
Extreme Ultraviolet Radiation Sources from Dense Plasmas
Fraunhofer Institute for Laser Technology ILT, Steinbachstr. 15, D-52074 Aachen, Germany
Atoms 2023, 11(9), 118; https://doi.org/10.3390/atoms11090118
Submission received: 28 July 2023
/
Revised: 24 August 2023
/
Accepted: 29 August 2023
/
Published: 31 August 2023
(This article belongs to the Special Issue Atomic Physics in Dense Plasmas)
Abstract
:The concept of dense and hot plasmas can be used to build up powerful and brilliant radiation sources in the soft X-ray and extreme ultraviolet spectral range. Such sources are used for nanoscale imaging and structuring applications, such as EUV lithography in the semiconductor industry. An understanding of light-generating atomic processes and radiation transport within the plasma is mandatory for optimization. The basic principles and technical concepts using either a pulsed laser or a gas discharge for plasma generation are presented, and critical aspects in the ionization dynamics are outlined within the framework of a simplified atomic physics model.
1. Introduction
The spectral range of extreme ultraviolet radiation (EUV or XUV), with wavelengths from ~ 1 to 50 nm or photon energies of 20 eV–1 keV, is of growing interest for a variety of applications in analysis and patterning with nanometer resolution. The short wavelength in combination with the increasing availability of high-quality optical elements and the strong interaction with matter with high elemental sensitivity are key features. Currently, utilizing extreme ultraviolet lithography to produce more powerful semiconductor chips is the most important application, which has driven the development of optics and a compact light source for the wavelength of 13.5 nm [1]. Other examples of applications making use of compact light sources are in the field of EUV lithography, i.e., use for mirror contamination studies [2,3,4], qualification of optical elements and masks [5,6,7,8,9,10,11] or photo resist development [12,13]. Further examples are X-ray microscopy in the spectral range of the water window (2.4–4.4 nm) for the imaging of biological samples in their natural wet environment [14,15,16,17,18] or XUV-based reflectometry for surface analysis [19,20].
All these applications require a compact, tabletop and powerful light source. An example of source requirements is given in Ref. [21] for an AIMS inspection tool. Plasma-based sources have been proven to fulfill the demands in contrast to, for example, an X-ray tube with limited power or a synchrotron source not being compact and having restricted access for the users. In plasma-based sources, the matter is heated up to a high temperature and then transferred into the plasma state with ions and free electrons. The target temperature can be roughly estimated by making use of Wien’s law for a blackbody radiator, λmax × Te = 250 eVnm, assuming that the electron or plasma temperature, Te, corresponds to the radiation temperature. Here, λmax is the wavelength of maximum brightness. For example, the target wavelength of 13.5 nm leads to a plasma temperature of about 20 eV or 200,000 °K. The preferred loss channel for the internal plasma energy is essentially via radiative transitions from resonance lines of ions in a highly ionized level of the respective target material. The preferred transitions are in the short wavelength region, which can roughly be estimated by making use of Wien’s law, rather than being in unwanted spectral regions, including visible radiation. This implies a high conversion efficiency of input energy to XUV radiation. Sometimes, a conversion over 90% can be achieved, as shown for the example in Ref. [22]. Matter at these high temperatures cannot exist for long times in compact devices. The high plasma pressure will lead to the expansion and decay of the plasma. Thus, the typical lifetimes of XUV emitting plasmas range from a few nanoseconds to a few hundred nanoseconds. The typical maximum repetition rates for generating these plasmas are in the range of up to a few 10 kHz. Since XUV radiation is strongly absorbed in matter or ambient air, all plasmas and systems are generated and operated in vacuum or a low-pressure environment with a maximum pressure of ~100 Pa.
There are two concepts for the pulsed generation of such dense and hot plasmas being used as thermal emitters of short wavelength radiation. The first method is using a high intensity laser pulse and the second is based on a pulsed electrical current for the heating and compression of the working gas. There are numerous theoretical and experimental papers on the modeling of hydrodynamics and light generation in the literature. Further information about a plasma-based XUV source can be found in the literature, e.g., in Refs. [1,23] and the references therein. In the present review, the key parameters for the efficient generation of radiation at short wavelengths are recalled, and ideas regarding actual and future research for a better understanding and optimization of such sources are presented.
2. Laser-Produced Plasma and Discharge-Based XUV Sources
With a laser-produced plasma (LPP), a high intensity pulsed laser hits a target and heats the matter to the required temperature for thermal XUV radiation. The targets are usually solids or liquids in the form of jets or droplets. The target material is converted to a plasma, where the density can be estimated by the critical density, necrit. At this density the process of Inverse Bremsstrahlung for the heating of the plasma is efficient. This density is dependent on the laser wavelength scaling of necrit ~1/λL2. Mostly, solid-state lasers with wavelengths of 532 nm or 1064 nm are used. Another example is a CO2 laser with a wavelength of 10.6 μm, which is used in the tin-droplet-based LPP source in EUV lithography systems [24]. Typical plasma densities for LPPs are in the range of 1019–2021 cm−3. The achievable plasma temperature is mainly determined by laser intensity, which is typically in the range of 1010–1012 W/cm2. Laser pulse durations vary from picoseconds to a few 100 ns.
The other method is a discharge-produced plasma (DPP), where a pulsed current is used to heat and compress a working gas at a typical pressure in the range from 10 Pa to a few 100 Pa. Usually, the maximum plasma density is lower compared to LPPs, typically in the range of 1018–1019 cm−3. The pulsed currents have peak values ranging from a few kiloamperes to 100 kA, with durations of a few 100 ns. The peak current mainly determines the achievable plasma temperature.
Typical sizes of the XUV emitting region are discs in the range of a few 10 μm in diameter for LPPs and an elongated plasma for DPPs, with diameters of a few 100 μm and a length of a few millimeters. Typical input powers range from a few 100 W electrical or laser power for small systems to a few tens of kW, as is the laser power for the source used in EUV lithography [24,25].
The emission spectra arise from resonance lines (bound-bound) transitions of highly charged ions, where a target material with a low atomic number (e.g., nitrogen or oxygen) shows only a few free-standing lines. Sources based on targets with high atomic numbers, such as tin or xenon, show a more broadband emission characteristics, with partly overlapping lines (UTA—Unresolved Transition Arrays).
Although there are already systems available and in commercial use, there are still a couple of open questions in fundamental research for optimizing the process of light generation. In addition, there are a couple of technical challenges on the system lifetime of the target or the electrode system—as for the example discussed in Ref. [26]—or the protection of the attached optical systems from source debris in the form of fast ions or neutrals [27].
An example for a compact discharge-based source which has been developed at Fraunhofer ILT in Aachen is shown in Figure 1. In the background, one can see the rack with the user interface and electrical power supply. The cabinet, which contains the electrode system, the storage capacity and the power electronics for triggering, has a diameter of 65 cm. The source can be attached to the vacuum system of the customer via a standard CF160 vacuum flange. In Figure 1, a small vacuum chamber with a turbo pump and viewport is attached for a stand-alone operation. More details about this system can be found in Refs. [28,29].
The source can be operated with different gases. Xenon is mainly used to generate a strong emission around 13.5 nm, which leads to a broadband emission between 10 nm and 17 nm. A photograph of the xenon plasma is shown in Figure 2. A typical parameter for pulse energy and frequency is 5 J of electrically stored energy and 1000–2000 Hz. The respective emission spectrum is shown in Figure 3. The spectrally integrated EUV emission in this case is 275 W/2πsr. The conversion efficiency of electrically stored energy to total EUV radiation is about 11%/4πsr. Note that the EUV emission is usually measured into a small solid angle, which is determined by the energy monitor and then recalculated to a half-sphere of 2πsr or a full sphere of 4πsr, with the assumption of a radially symmetric emission. This allows for a better comparison of different sources, where the effective usable angle and the angular emission characteristics must be checked separately for each individual concept. Measurements at lower and larger wavelengths show that most of the radiation is emitted within this spectral region between 10 nm and 25 nm for the considered xenon plasma.
Figure 4 shows the EUV emission profile at 13.5 nm, measured with an inband camera in the axial direction. The EUV emitting plasma length is about 3–5 mm. The diameter is about 500 μm (FWHM). The initial column of the working gas, which is compressed by the pulsed current (pinch effect), has a diameter of 5–8 mm, which is determined by the center boreholes in the electrodes.
The EUV emission arises from transitions of highly charged xenon ions starting from eight-fold ionized xenon (Xe8+) to higher levels. The transitions around 13.5 nm (92 eV) are mainly from ten-fold ionized xenon (Xe10+). A calculated energy level scheme for this ion is shown in Figure 5, where the 4d8 configuration represents the ground state and the observed transitions around 13.5 nm are between 4d74f1 and 4d8. Many transitions from higher 4d7nl levels contribute to the observed spectrum. Due to the large number of levels in each configuration, the ensemble of the emission lines exhibits quasi-broadband characteristics.
The XUV emission is a result of subsequently ionizing neutrals or low ionized atoms into higher levels by electron collisions, where the electrons are heated up by the external energy source (either laser or discharge current). The radiation from the plasma results from electron excitation and subsequent radiative decay in a multilevel energy scheme. In many cases, the radiation trapping and re-emission in the plasma is of importance to understand the net emission. This especially holds for LPPs with a much higher density [30,31], and will be discussed below in more detail.
Figure 5.
Calculated energy level scheme for the Xe10+ ion (from Ref. [32], reproduced with permission from O. Tomoyuki et al., J. Plasma Fusion Res. Series, Vol. 7; published by The Japan Society of Plasma Science and Nuclear Fusion Research, 2006).
Figure 5.
Calculated energy level scheme for the Xe10+ ion (from Ref. [32], reproduced with permission from O. Tomoyuki et al., J. Plasma Fusion Res. Series, Vol. 7; published by The Japan Society of Plasma Science and Nuclear Fusion Research, 2006).

3. XUV Light Generation in Plasmas
In this section, a simplified model for the generation of XUV light from resonance lines in plasma is presented to identify the most important parameters and their impact on the emitted light. It likewise allows the quantitative estimation of the required plasma parameters and achievable brightness of the light source, which can be used as a guideline for further source development and optimization. The advantage of the simplified model lies in its ability to identify the key parameters and guide future fundamental research on open questions related to atomic data, the modeling of plasma hydrodynamics and radiation transport.
The starting point for this model is the solution for the spectral brightness of a resonance line, designated by l and u for the lower and upper level. This discussion also follows the considerations given in Refs. [33,34]. The main parameters are illustrated in Figure 6. When assuming a homogeneous plasma, the observed spectral brightness, L, is given as a solution of the radiation transport equation:
with j(λ) as the emission coefficient, χ(λ) as the absorption coefficient and τ(λ) = χ(λ) × d as the optical thickness. These parameters can be expressed in terms of all levels (i) which contribute to the wavelength (λ), and the respective Einstein coefficients for spontaneous emission (Aiul), and absorption and emission (Biul)—h, Planck constant, c, velocity of light:
For the Einstein coefficients, the following relation holds true (the index i is omitted):
with gl and gu as the statistical weights (gu(l) = 2 Ju(l) + 1 with J the total angular moment) of the lower and upper level. The fi(λ) are the line profiles for the respective transition with ∫fi(λ)dλ = 1. The line profiles for absorption and emission are assumed to be identical for the simplification of the discussion. The line profiles are determined by the dominant broadening mechanism. For laser-produced plasma, collisional broadening is dominant, but for discharge plasma, which has a much lower density, Doppler broadening is dominant.
The Equations (1)–(3) can be re-arranged for the spectral brightness:
The further simplification of this expression is achieved by the assumption that the ratio (giu nil)/(gil niu) is independent of the transition i at the wavelength under consideration. For the estimation of this ratio, we assume an equilibrium between collisional excitation, collisional de-excitation and radiative decay, including re-absorption in a two-level system:
By taking the rate coefficients from Ref. [35], we obtain an approximation for the level population ratios:
Here, τm, is the optical thickness, which is relevant for the population density. For the estimation of τm, we consider the half distance of the smallest extension of the plasma. gi(τm) is the Holstein escape factor.
Given that the optical thick limit τ(λ) >> 1 and the second term in Equation (6) are much smaller than unity, the ratio of population density can be written as (giu nil)/(gil niu) = eΔΕ/Τe, which corresponds to the Boltzmann population. In this case, Equation (4) approaches the Planck limit for spectral brightness. Note that in the Boltzmann population limit, population inversion is not possible and is not considered here.
The Holstein escape factor can be written for a Gaussian-line shape fi(λ) for a multi-level system as [33]:
with
With Equations (4) and (6), the light emission can be estimated in terms of plasma density, plasma temperature, spatial expansion and the atomic data of the target material. The next question is to provide plasma parameters, where ionization levels with suitable resonance lines exist. A useful approximation is delivered by a CR model (collisional-radiative), where dielectronic recombination is neglected, and an equilibrium between collisional electron ionization with three-body recombination and radiative recombination is assumed.
Taking the rates for these processes, i.e., collisional ionization (), radiative recombination () and three body-recombination (), the ion distribution can be estimated:
with the ionization levels NZ and NZ+1 of charge Z and Z+1, respectively. The rate coefficients are taken from Ref. [35]:
Here, ζ is the number of electrons on the outermost shell. χi is the ionization energy and Za is the atomic number of the neutral atom.
The set of Equations (1)–(10) allow for a rough estimation of light emission based on the atomic data of the target material.
4. Example for Emitter at 6.7 nm
The next task is to provide key plasma parameters, such as density, temperature, size and lifetime. During the lifetime, the plasma is assumed to be homogenous in space and time. For a more accurate description (e.g., considering dielectronic recombination, inhomogeneity, non-stationarity), more sophisticated models are required. However, some valuable information regarding the optimization potential and interdependencies of parameters can already be extracted with this simplified description.
In the following section, this will be demonstrated with the example of a plasma which is considered as an efficient emitter of around 6.7 nm. This wavelength is discussed as a potential successor of the current 13.5 nm used in EUV lithography [36]. The procedure can be translated to other prominent emitters, such as tin or xenon as broadband emitters of around 13.5 nm or low-Z elements, which are used as narrowband emitters (e.g., nitrogen) in X-ray microscopy.
According to known atomic data, Gadolinium and Terbium are proposed as efficient emitters for radiation of around 6.7 nm [36]. Using Equations (8) and (9) allows for the estimation of the required electron temperature where the ionization levels with suitable resonance line transitions are present in a stationary plasma. The result is shown in Figure 7. The ionic levels, which include transitions at 6.7 nm, are highlighted in colored lines. In this case, the electron temperature ranges from 100 eV to 300 eV.
Due to the limited lifetime of the plasma, one must assure that the density and temperature are high enough to allow for efficient target ionization. The relevant time scale is the ionization time constant into this target level, which must be compared with the plasma lifetime. Figure 8 shows this ionization time constant as a function of electron density based on Equation (9) for different electron temperatures and ionization potentials. A laser-produced plasma typically has a nanosecond lifetime and a density larger than 1021 cm−3. Typical ionization potentials are in the range of 1000 eV. The green and red curves represent the case of a fully occupied 4f-shell (ζ = 14) and a 4f-shell with only one outer electron (ζ = 1). In conclusion, an electron temperature of up to 200 eV might be sufficient to achieve the requested ionization. However, there is not much margin to meet this condition. The diagram underlines that the ionization time constant and plasma lifetime must be carefully checked for each type of plasma. In fact, the exact theory of non-equilibrium phenomena and ionization dynamics shows [37] that the ionization time constant is given by the sum of the ionization and recombination processes (radiative recombination, dielectronic recombination, three-body recombination).
For the estimation of the achievable emission from a plasma, which is characterized by electron temperature and density and a certain distribution of the ionization levels of the target material, the influence of absorption and the re-emission of photons with impact on the level populations must be considered carefully. This will be presented in more detail with the example of a laser-produced plasma. The electron density is assumed to be the critical density for laser absorption. Here, a 532 nm laser is considered to lead to a critical density of 3.9 × 1021 cm−3. Furthermore, the plasma is assumed to be spherical, with a diameter of d = 10 μm. The profile function fi(λ) is assumed to be Gaussian with the same line width for all transitions of λ/ΔλFWHM ~ 3000. More information on the impact of choosing this parameter is given in Refs. [33,34].
The influence of ion density on spectral brightness is shown in Figure 9 for a two-level system with ΔE = 185 eV. The electron temperature is Te = 100 eV. The Einstein coefficient for spontaneous absorption is assumed to be Aul = 5 × 10¹² s−1. The ion density corresponds to the density of the respective lower-level population. The estimation of this number is based on the expression for the electron density and number density, niZ, of the ionization level, Z, i.e., ne = Σi Z × niZ. For the Gd and Tb levels, the level population of the lower level is estimated to be 1/20 of niZ. In the limit of low densities, here < 1018 cm−3, we have an optically thin plasma, with emission scales according to L ~ niZ × ne. For a density of >1019 cm−3, the optically thick limit is achieved, where the level populations have approached the Boltzmann limit. The spectral brightness converges to the Planck limit. The intermediate density interval of 1018–1019 cm−3 is of special interest. A reduction of one order of magnitude in density only leads to ~33% less brightness. This range can be considered as a target density for the efficient excitation of radiation. Lowering the density without loss of XUV radiance is also of technological interest. In conclusion, one can think of alloys as containing emitter materials such as Gadolinium, but showing more suitable properties, e.g., a lower melting point to realize a regenerative target based on a fluid material. Note that pure Gadolinium has a melting point of Tm = 1300 °C, which can be seen as a drawback to bring it into the liquid phase.
To get further insight into the impact of density on the emission spectrum, a simulated emission spectrum for GdXXIII or Gd22+ is shown in Figure 10. The GdXXIII density is assumed to be ni22 ~ 5 × 1019 cm−3. The atomic data are taken from Ref. [38]. The Planck limit is achieved for some transitions, as shown with the black curve. The red curve not only shows the emission for the same electron density, but also a reduction in ion density by a factor of 20. In this case, we observe an overall reduction in brightness. However, especially for the optically thicker transitions, the reduction is much less compared to the ion density reduction.
The underlying important parameter for the density impact on the brightness is the Holstein escape (7) factor or the optical density, τm. Figure 11 shows this parameter with the example of a GdXXIII and TbXXIV ion for the parameters given above. With τm being large enough, in this case >10, the respective transitions may be suitable for the reduction of density without losing too much in brightness. Similar behavior and emission characteristics are expected for Tb. Figure 11 also shows some transitions from the low-Z target materials, aluminum and magnesium. The AlVIII and MgIX levels have interesting resonance lines in the range of 6–7 nm, which might be of interest in metrology applications in the field beyond EUV lithography. The atomic data are taken from Ref. [39]. For Al and Mg, the average level of optical density is about one order of magnitude lower. Intense resonance line emission close to the Planck limit might be expected only in selected transitions for a non-diluted plasma. More information about target materials for 6.7 nm and some experimental data for the emission of plasmas based on Gd, Tb, Al, Mg and related alloys are given in Refs. [33,34].
Generally, the density of the plasmas under discussion is not high enough to have an impact on the atomic structure, leading to line shifts or the vanishing of lines into the continuum. As an example, we follow the model in the appendix of Ref. [40] to estimate the line shift for a GdXXIII 4d-5f transition. For ΔE = 185 eV, the line shift due to the interaction with the plasma is below 0.1 eV (Te = 100 eV, ne = 3.9 × 1021 cm−3).
5. Conclusions
After intense development, mainly triggered by the need for sources around 13.5 nm for extreme ultraviolet lithography, both laser-produced and discharge-driven dense and hot plasma sources are in commercial use. Future research and development will focus on technical aspects, such as the further increase in lifetime, understanding of debris generation and the mitigation system, or the lifetime of attached optical systems. Solving these questions not only involves engineering, but also requires further fundamental research covering several areas of plasma and atomic physics, and the interaction of XUV radiation with matter. With respect to the generation of light, i.e., the conversion of electrical or laser energy in short wavelength radiation, the current knowledge already allows for operation at a reasonable level, utilizing the principal property of high energy conversion efficiency with these plasmas. However, there is still room for further improvements, which may be beneficial for current or future applications in nanopatterning or analysis. This paper has proposed a simple model for the description of light emission with respect to plasma parameters. This already allows for a rough prediction of properties and an assessment of the optimization potential of existing sources. More sophisticated models using a better base of atomic data and including a more detailed modeling of the evolution of plasma parameters have been proposed by several groups for different source systems, and will be pursued in future work. With respect to light generation itself, the most important questions for further source development aim at increasing the source brilliance and optimizing the ionization dynamics and emission at shorter [41] and longer wavelengths [42] compared to the currently best understood and controlled systems for 13.5 nm, or improving the pulse-to-pulse stability of the XUV emission. Another aspect is to understand and suppress unwanted out-of-band radiation in the XUV and deep UV, which might be troublesome for some applications due to the heating or triggering of chemical reactions.
Funding
This research received no external funding.
Data Availability Statement
Part of the data presented in this study are available on request from the corresponding author. These data are not publicly available due to confidentiality reasons. The other part of data was not created or analyzed in this study and data sharing is not applicable to this article.
Conflicts of Interest
The author declares no conflict of interest.
References
- Bakshi, V. (Ed.) EUV-Sources for Lithography; SPIE Press: Bellingham, WA, USA, 2006. [Google Scholar]
- Garg, R.; Wüest, A.; Gullikson, E.; Baijt, S.; Denbeaux, G. EUV optics contamination studies in presence of selected hydrocarbons. Proc. SPIE 2008, 6921, 871–878. [Google Scholar]
- Van de Ven, T.H.M.; Reefman, P.; Meijere, C.A.; van der Horst, R.M.; van Kampen, M.; Banine, V.Y.; Beckers, J. Ion distribution in highly transient EUV induced hydrogen. J. Appl. Phys. 2018, 123, 63301. [Google Scholar] [CrossRef]
- Van de Kerkhof, M.; Yakunin, A.M.; Astakhov, D.; van Kampen, M.; van der Horst, R.; Banine, V. EUV-induced hydrogen plasma: Pulsed mode operation and confinement in scanner. J. Micro/Nanopattern. Mater. Metrol. 2021, 20, 033801. [Google Scholar] [CrossRef]
- Van Loyen, L.; Boettger, T.; Braun, S.; Mai, H.; Leson, A.; Scholze, F.; Tuemmler, J.; Ulm, G.; Legall, H.; Viktor, P.; et al. New laboratory EUV reflectometer for large optics using a laser plasma source. Proc. SPIE 2003, 5038, 12–21. [Google Scholar]
- Houser, D.C.; Dong, F.; Perera, C.N.; Perera, C.C. Challenges in constructing EUV metrology tools to qualify EUV masks for HVM implementation. Proc. SPIE 2015, 9661, 129–137. [Google Scholar]
- Wies, C.; Lebert, R.; Jaegle, B.; Juschkin, L.; Sobel, F.; Seitz, H.; Walter, R.; Laubis, C.; Scholze, F.; Biel, W.; et al. High Speed Reflectometer for EUV Mask-Blanks. Proc. SPIE 2005, 5835, 252–262. [Google Scholar]
- Missala, T.; Biermanns-Föth, A.; Pampfer, C.; Arps, J.; Phiesel, C.; Lebert, R. EUV pellicle qualification on transmission and reflectance. Proc. SPIE 2019, 11178, 111780O. [Google Scholar]
- Biermanns-Föth, A.; Phiesel, C.; Missala, T.; Arps, J.; Piel, C.; Lebert, R. Actinic inband EUV reflectometry AIMER compared to ALS blank qualification. Proc. SPIE 2019, 10957, 296–304. [Google Scholar]
- Weiss, M.R.; Hellweg, D.; Koch, M.; Peters, J.H.; Perlitz, S.; Garetoo, A.; Magnusson, K.; Capelli, R.; Jindal, V. Actinic review of EUV masks: Status and recent results of the AIMSTM EUV System. Proc. SPIE 2015, 9422, 395–403. [Google Scholar]
- Sayan, S.; Chakravorty, K.; Teramoto, Y.; Shirai, T.; Morimoto, S.; Watanabe, H.; Sato, Y.; Aoki, K.; Liang, T.; Tezuka, Y.; et al. Laser-assisted discharge produced plasma (LDP) EUV source for actinic patterned mask inspection (APMI). Proc. SPIE 2021, 11609, 34–45. [Google Scholar]
- Brose, S.; Danyluyk, S.; Grüneberger, F.; Gerngross, M.; Stollenwerk, J.; Schirmer, M.; Loosen, P. Industrial photoresist development with EUV laboratory exposure tool: Mask fabrication, sensitivity and contrast. Proc. SPIE 2019, 11147, 166–174. [Google Scholar]
- Blackborow, P.; Gustafson, D.; Snith, D.; Besen, M.; Horne, S.; D’Agostino, R.J.; Minami, Y.; Denbeaux, G. Application of the Energetiq EQ-10 electrodeless Z-Pinch EUV light source in outgassing and exposure of EUV photoresist. Proc. SPIE 2007, 6517, 551–560. [Google Scholar]
- Horne, S.F.; Silterra, J.; Holber, W. A compact Soft X-ray Microscope using an Electrode-less Z-Pinch Source. J. Phys. Conf. Ser. 2009, 186, 012028. [Google Scholar] [CrossRef] [PubMed]
- Benk, M.; Bergmann, K.; Schäfer, D.; Wilhein, T. Compact soft X-ray microscope using a gas-discharge light source. Opt. Lett. 2008, 33, 2359–2361. [Google Scholar] [CrossRef]
- Hertz, H.M.; von Hofsten, O.; Bertilson, M.; Vogt, U.; Holmberg, A.; Reinspach, J.; Martz, D.; Selin, M.; Christakou, A.E.; Jerlström-Hultqvist, J.; et al. Laboratory cryo soft X-ray microscopy. J. Struct. Biol. 2012, 2, 267–272. [Google Scholar] [CrossRef]
- Legall, H.; Blobel, G.; Stiel, H.; Sandner, W.; Seim, C.; Takman, P.; Martz, D.H.; Selin, M.; Vogt, U.; Hertz, H.M.; et al. Compact X-ray microscope for the water window based on a high brightness laser plasma source. Opt. Express 2012, 16, 18362–18369. [Google Scholar] [CrossRef]
- Wachulak, P.W.; Torrisi, A.; Bartnik, A.; Wegrzynski, L.; Fok, T.; Fiedorowicz, H. Nanoscale imaging applications of soft X-ray microscope based on a gas-puff target source. J. Phys. Conf. Ser. 2017, 849, 012050. [Google Scholar] [CrossRef]
- Danylyuk, S.; Herbert, S.; Loosen, P.; Lebert, R.; Schäfer, A.; Schubert, J.; Tryus, M.; Juschkin, L. Multi-angle spectroscopic extreme ultraviolet reflectometry for analysis of thin films and interfaces. Phys. Status Solidi C 2009, 12, 318–322. [Google Scholar] [CrossRef]
- Peth, C.; Barkusky, F.; Mann, K. Near-edge X-ray absorption fine structure measurements using a laboratory-scale XUV source. J. Phys. D Appl. Phys. 2008, 41, 105202. [Google Scholar] [CrossRef]
- Feldmann, H.; Ruoff, J.; Dinger, U.; Garetto, A. Source Requirements for Next Generation AIMSTM EUV Mask Metrology Tool (Aerial Image Monitoring System). In Proceedings of the 2014 International Workshop on EUV and Soft X-ray Sources, Dublin, Ireland, 3–6 November 2014. [Google Scholar]
- Küpper, F.A. EUV-Emission und Entladungsdynamik eines Zinnplasmas in einer Laserinduzierten Hochstromentladung für die Lithografie—EUV-Emission and Discharge Dynamics of a Tin Plasma in a Laser-Induced High-Current Discharge for Lithography. Ph.D. Thesis, RWTH Aachen University, Aachen, Germany, 2014. [Google Scholar]
- Juschkin, L.; Derra, G.; Bergmann, K. EUV Light Sources. In Low Temperature Plasmas, 2nd ed.; Hippler, R., Kersten, H., Schmidt, M., Schoenbach, K.H., Eds.; Wiley-VCG: Weinheim, Germany, 2008; pp. 619–654. [Google Scholar]
- Fomenkov, I.V.; Ershov, A.I.; Partlo, W.N.; Myers, D.W.; Sandstrom, D.R.; La Fontaine, B.; Bykanov, A.N.; Vaschenko, O.; Khodykin, O.V.; Böwering, N.R.; et al. Laser-produced plasma light source for EUVL. Proc. SPIE 2010, 7636, 700–707. [Google Scholar]
- Mizoguchi, H.; Nakarai, H.; Abe, T.; Nowak, K.M.; Kawasuji, Y.; Tanaka, H.; Watanabe, Y.; Hori, T.; Kodama, T.; Shiraishi, Y.; et al. Performance of 100-W HVM LPP-EUV source. Adv. Opt. Technol. 2015, 4, 297–309. [Google Scholar] [CrossRef]
- Fomenkov, I.; Brandt, D.; Ershov, A.; Schafgans, A.; Tao, Y.; Vaschenko, G.; Rokitski, S.; Kats, M.; Vargas, M.; Purvis, M.; et al. Light sources for high-volume manufacturing EUV lithography: Technology, performance, and power scaling. Adv. Opt. Technol. 2017, 6, 173–186. [Google Scholar] [CrossRef]
- Jurczyk, B.E.; Vargas-Lopez, E.; Neumann, M.N.; Rucic, D.N. Illinois debris-mitigation EUV applications laboratory. Microelectron. Eng. 2005, 77, 103–109. [Google Scholar] [CrossRef]
- Benk, M.; Bergmann, K. Brilliance scaling of discharge sources for extreme-ultraviolet and soft X-ray radiation for metrology applications. J. Micro/Nanolith. MEMS MOEMS 2012, 11, 021106. [Google Scholar] [CrossRef]
- Vieker, J.; Bergmann, K. Influence of the electrode wear on the EUV generation of a discharge based extreme ultraviolet light source. J. Phys. D Appl. Phys. 2017, 50, 3456601. [Google Scholar] [CrossRef]
- Harilal, S.S.; Tillack, M.S.; Tao, Y.; O’Shay, B. Extreme-ultraviolet spectral purity and magnetic ion debris mitigation by use of low-density tin targets. Opt. Lett. 2006, 31, 1549–1551. [Google Scholar] [CrossRef]
- Endo, A.; Hoshino, H.; Suganuma, T.; Moriya, M.; Ariga, T.; Ueno, Y.; Nakano, M.; Asayama, T.; Abe, T.; Komori, H.; et al. Laser Produced EUV Light Source Development for HVM. Proc. SPIE 2007, 6517, 210–217. [Google Scholar]
- Obara, T.; Kato, T.; Kato, D.; More, R.; Sato, K.; Funaba, H.; Morita, S.; Nishimura, H.; Nishihara, H.; Sasaki, A.; et al. EUV spectra from Xe10+ ions measured from LHD. J. Plasma Fusion Res. Ser. 2006, 7, 31–34. [Google Scholar]
- von Wezyk, A. Emissionscharakteristik von XUV-Strahlungsquellen bei Wellenlängen Zwischen 2 und 10 nm—Emission Characteristics of XUV-Radiation Sources at Wavelengths in the Spectral Range between 2 and 10 nm. Ph.D. Thesis, RWTH Aachen University, Aachen, Germany, 2019. [Google Scholar]
- von Wezyk, A.; Andrianov, K.; Wilhein, T.; Bergmann, K. Target materials for efficient plasma-based extreme ultraviolet sources in the range of 6 to 8 nm. J. Phys. D Appl. Phys. 2019, 52, 505202. [Google Scholar] [CrossRef]
- McWhirter, R.W.P. Spectral intensities. In Plasma Diagnostic Techniques; Huddlestone, R.H., Leonard, S.L., Eds.; Academic Press: New York, NY, USA, 1965; pp. 201–264. [Google Scholar]
- Banine, V.; Koshelev, K.N.; Swinkels, G.H.P.M. Physical processes in EUV sources for microlithography. J. Phys. D Appl. Phys. 2011, 44, 253001. [Google Scholar] [CrossRef]
- Rosmej, F.B.; Astapenko, V.A.; Lisita, V.S. Atomic Population Kinetics. In Plasma Atomic Physics—Springer Series on Atomic, Optical, and Plasma Physics 104; Rosmej, F.B., Astapenko, V.A., Lisita, V.S., Eds.; Springer International Publishing: Cham, Switzerland, 2021; pp. 249–304. [Google Scholar]
- Kilbane, D. Ground-state configurations and unresolved transition arrays in extreme ultraviolet spectra of Gd and Tb ions. J. Appl. Phys. 2010, 108, 104905. [Google Scholar] [CrossRef]
- NIST—Atomic Spectra Database. Available online: https://www.nist.gov/pml/atomic-spectra-database (accessed on 25 March 2017).
- Li, X.; Rosmej, F.B. Analytical approach to level delocalization and line shifts in finite temperature dense plasma. Phys. Lett. A 2020, 384, 126478. [Google Scholar] [CrossRef]
- Bakshi, V. Blue-X (EUVL Extension): Status and Update; Source Workshop: Dublin, Ireland, 2019. [Google Scholar]
- Barnes, B.M.; Zhou, H.; Henn, M.-A.; Sohn, M.Y.; Silver, R.M. Assessing the wavelength extensibility of optical patterned defect inspection. Proc. SPIE 2017, 10145, 415–426. [Google Scholar]
Figure 1.
Photograph of a discharge-based extreme ultraviolet light source with source cabinet and rack with control unit and power supply.
Figure 1.
Photograph of a discharge-based extreme ultraviolet light source with source cabinet and rack with control unit and power supply.
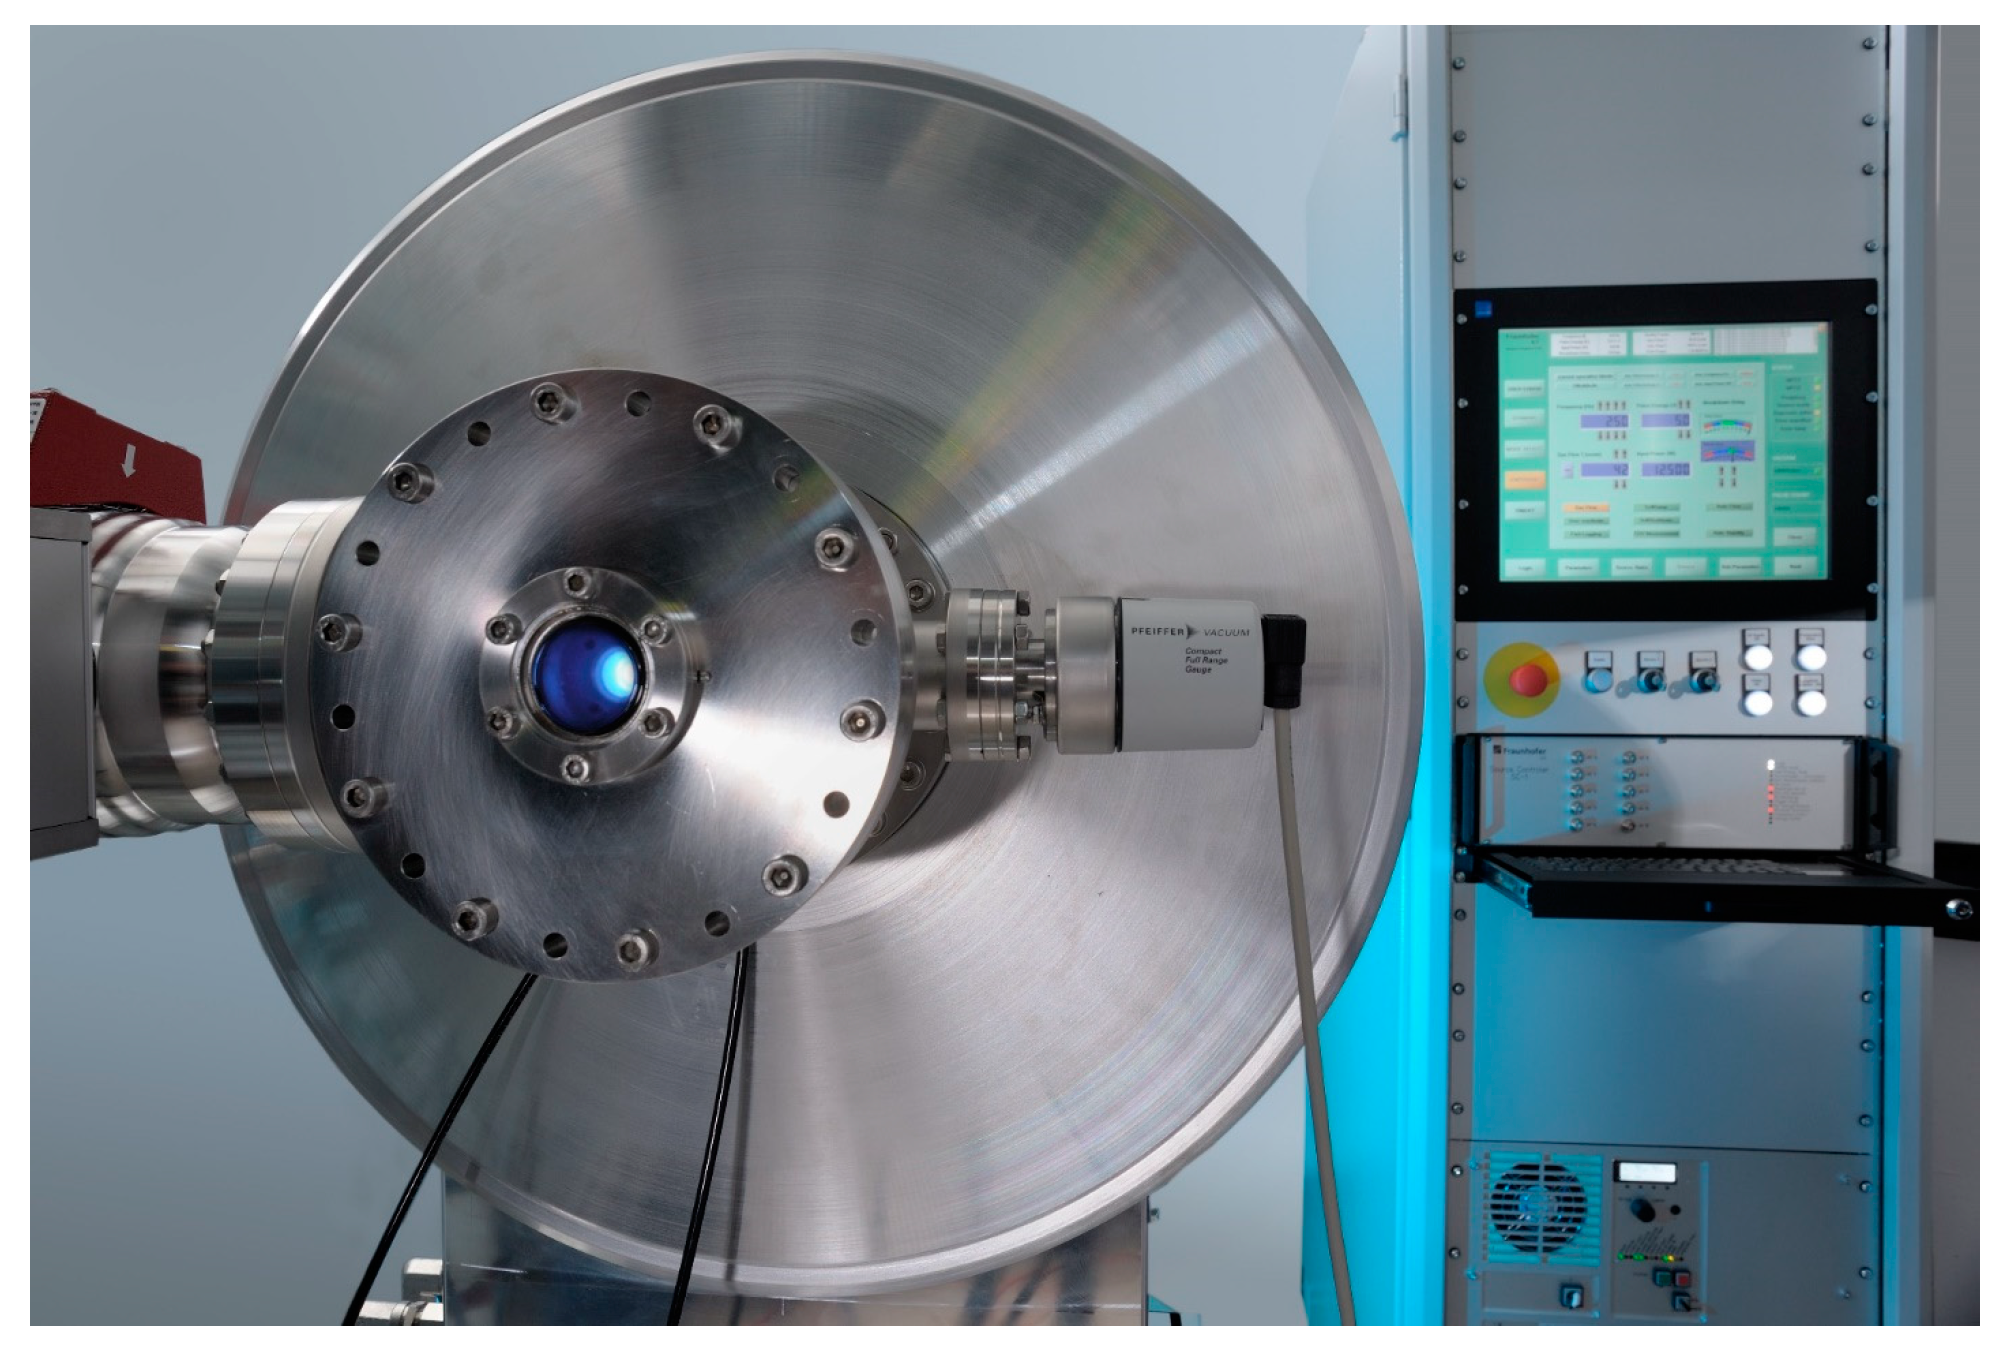
Figure 2.
Photograph of a xenon pinch plasma from off-axis viewing direction in the visible range.

Figure 3.
Typical xenon emission spectrum of a xenon-based discharge EUV source.

Figure 4.
Radial emission profile of the xenon pinch plasma for the axial viewing direction, taken with an inband EUV camera at a wavelength of around 13.5 nm.
Figure 4.
Radial emission profile of the xenon pinch plasma for the axial viewing direction, taken with an inband EUV camera at a wavelength of around 13.5 nm.

Figure 6.
Scheme of a spatial extended plasma for illustration of the parameters, which are considered in the model for the spectral brightness along a certain line of sight. The emission is estimated via a two-level system, where the level population is determined by electron collisional excitation, de-excitation, spontaneous emission, induced emission and absorption within the resonance levels.

Figure 7.
Calculated level population for Gadolinium (a) and Terbium (b) in an equilibrium plasma as function of electron temperature for a density of ne = 3.9 × 1021 cm−3.
Figure 7.
Calculated level population for Gadolinium (a) and Terbium (b) in an equilibrium plasma as function of electron temperature for a density of ne = 3.9 × 1021 cm−3.
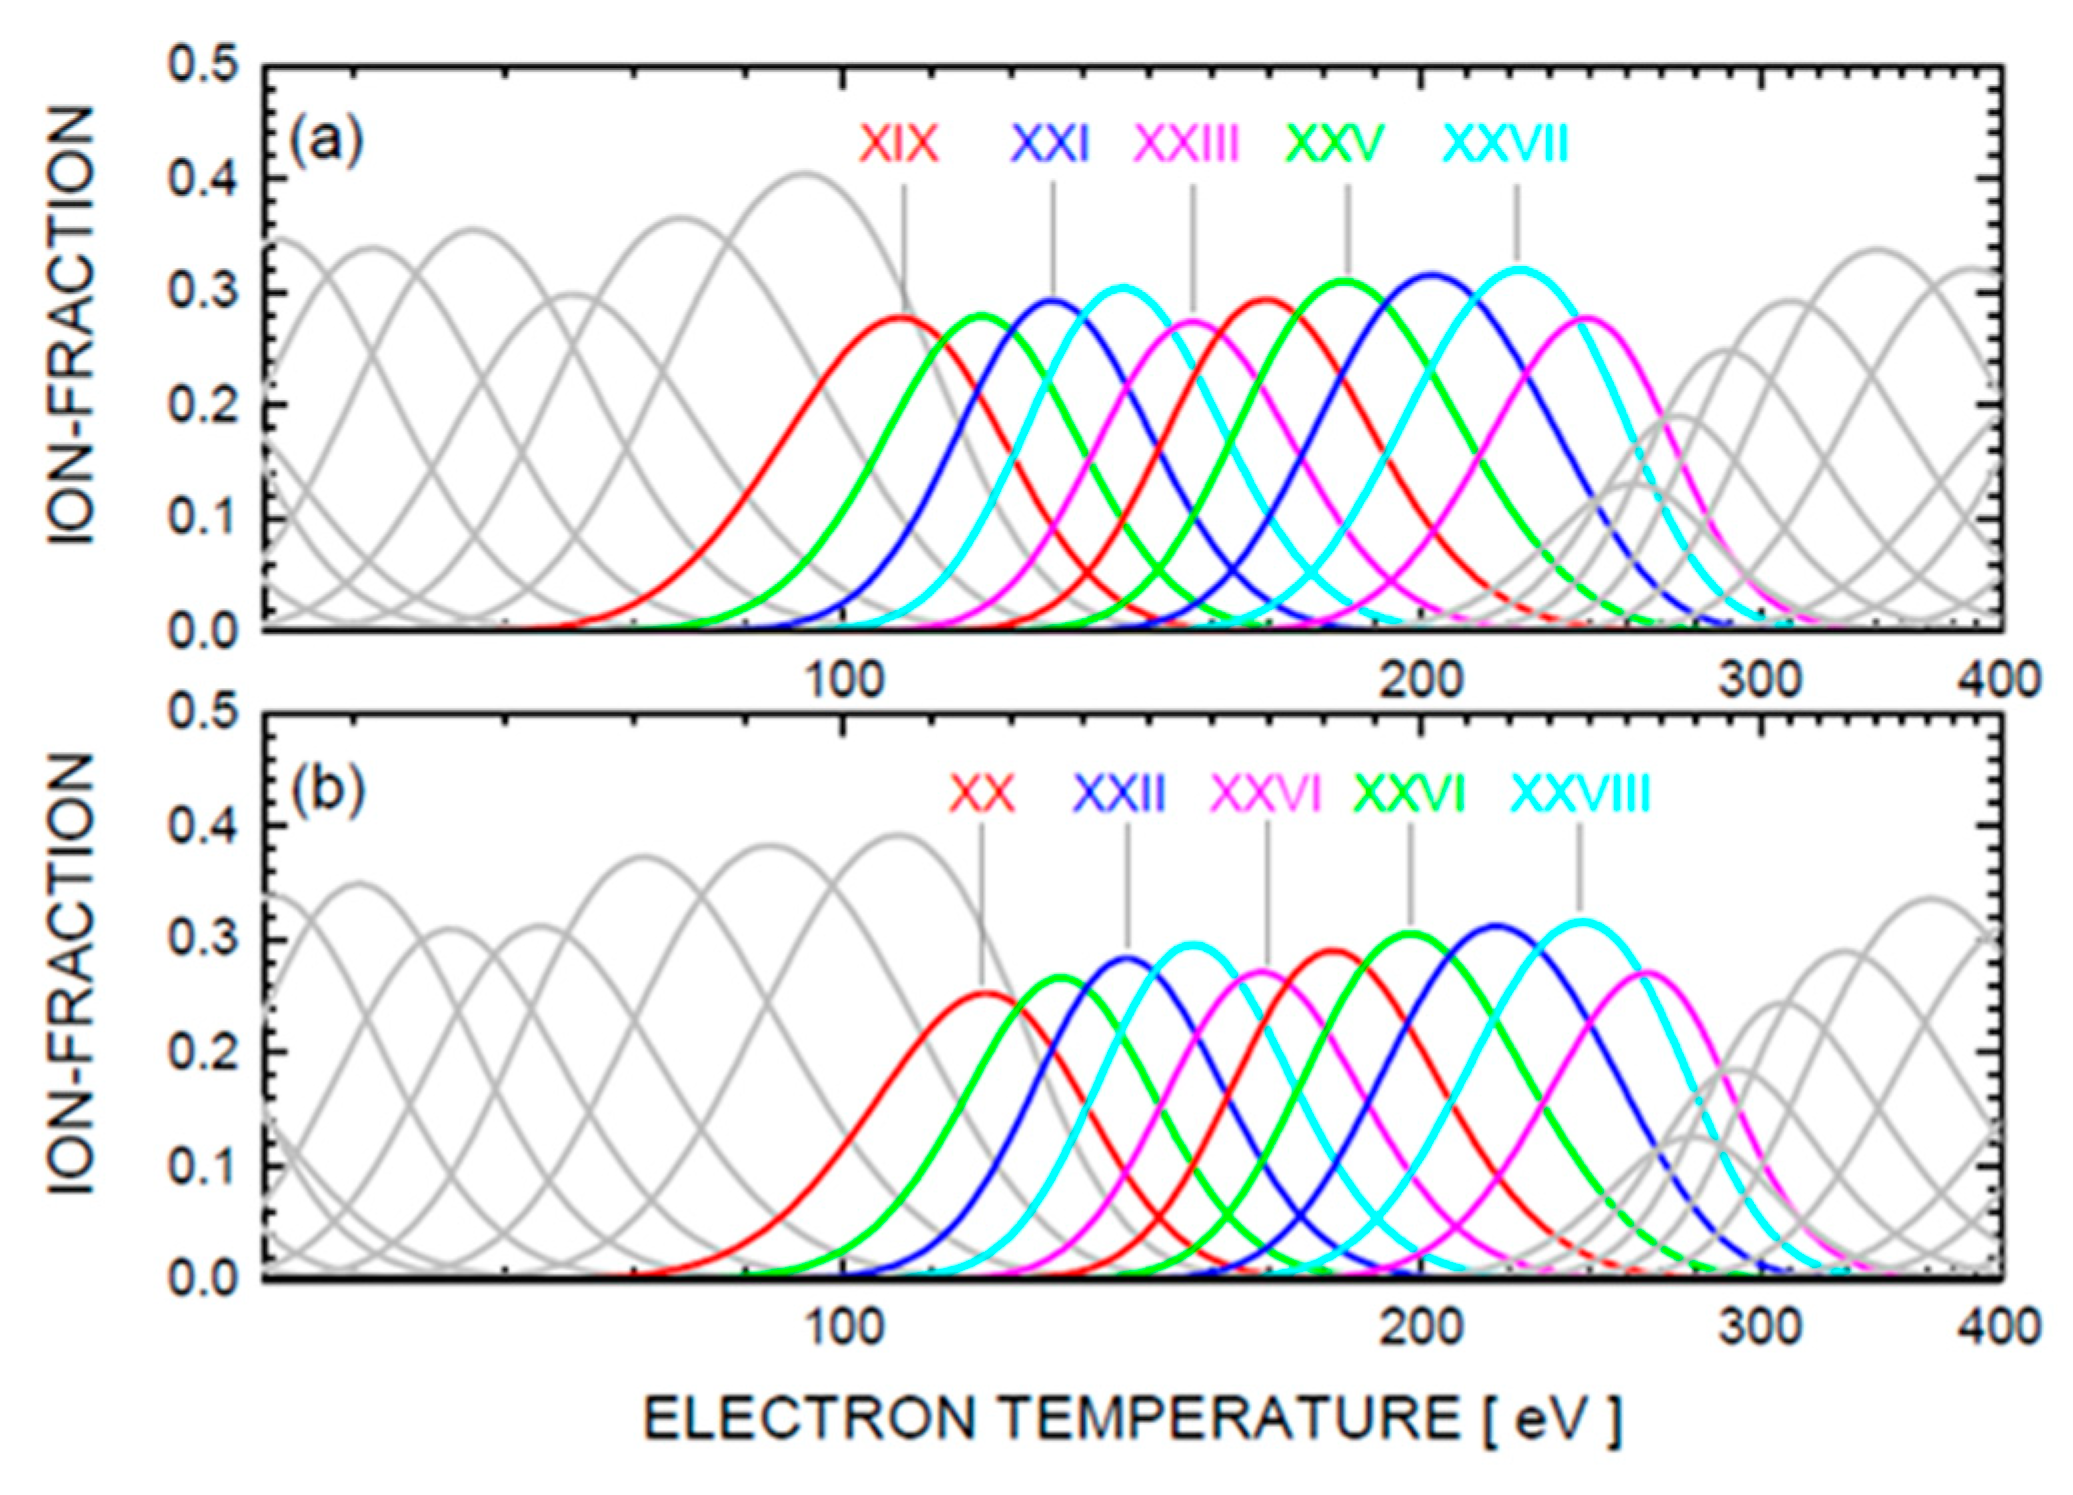
Figure 8.
Ionization time constant for different ionization energies and electron temperatures as a function of electron density in a range, which covers discharge-based and laser-produced XUV plasmas.
Figure 8.
Ionization time constant for different ionization energies and electron temperatures as a function of electron density in a range, which covers discharge-based and laser-produced XUV plasmas.

Figure 9.
Calculated spectral brightness for a two-level system (ΔE = 185 eV, Te = 100 eV, ne = 3.9 × 1021 cm−3, Aul = 5 × 10¹² s−1, dm = 10 µm) as a function of ion density.
Figure 9.
Calculated spectral brightness for a two-level system (ΔE = 185 eV, Te = 100 eV, ne = 3.9 × 1021 cm−3, Aul = 5 × 10¹² s−1, dm = 10 µm) as a function of ion density.

Figure 10.
Synthetic emission spectrum of a spherical plasma for Gd23+ based on the simplified model (black) and for a reduced ion density by a factor 20 (red) with ne = 3.9 × 1021 cm−3, Te = 100 eV and dpl = 10 µm on different intervals for the wavelength. The dashed line indicates the Planck limit.

Figure 11.
Calculated optical density, τm, for selected Gd, Tb, Al and Mg ions, which show resonance lines of around 6.7 nm.
Figure 11.
Calculated optical density, τm, for selected Gd, Tb, Al and Mg ions, which show resonance lines of around 6.7 nm.

Disclaimer/Publisher’s Note: The statements, opinions and data contained in all publications are solely those of the individual author(s) and contributor(s) and not of MDPI and/or the editor(s). MDPI and/or the editor(s) disclaim responsibility for any injury to people or property resulting from any ideas, methods, instructions or products referred to in the content. |
© 2023 by the author. Licensee MDPI, Basel, Switzerland. This article is an open access article distributed under the terms and conditions of the Creative Commons Attribution (CC BY) license (https://creativecommons.org/licenses/by/4.0/).
Share and Cite
MDPI and ACS Style
Bergmann, K. Extreme Ultraviolet Radiation Sources from Dense Plasmas. Atoms 2023, 11, 118. https://doi.org/10.3390/atoms11090118
AMA Style
Bergmann K. Extreme Ultraviolet Radiation Sources from Dense Plasmas. Atoms. 2023; 11(9):118. https://doi.org/10.3390/atoms11090118
Chicago/Turabian StyleBergmann, Klaus. 2023. "Extreme Ultraviolet Radiation Sources from Dense Plasmas" Atoms 11, no. 9: 118. https://doi.org/10.3390/atoms11090118
Note that from the first issue of 2016, this journal uses article numbers instead of page numbers. See further details here.