Article

Configuration Interaction Effects in Unresolved 5p65dN+1−5p55dN+2+5p65dN5f1 Transition Arrays in Ions Z = 79–92

1
Wuhan National Laboratory for Optoelectronics, Huazhong University of Science and Technology, Wuhan 430074, China
2
School of Physics, University College Dublin, Belfield, Dublin 4, Ireland
*
Author to whom correspondence should be addressed.
Atoms 2017, 5(2), 20; https://doi.org/10.3390/atoms5020020
Submission received: 12 April 2017 / Revised: 10 May 2017 / Accepted: 12 May 2017 / Published: 21 May 2017
(This article belongs to the Special Issue Spectra of Ionized Atoms: From Laboratory to Space)

Abstract

:
Configuration interaction (CI) effects can greatly influence the way in which extreme ultraviolet (EUV) and soft X-ray (SXR) spectra of heavier ions are dominated by emission from unresolved transition arrays (UTAs), the most intense of which originate from Δn = 0, 4p64dN+14p54dN+2+4p64dN4f1 transitions. Changing the principle quantum number n, from 4 to 5, changes the origin of the UTA from Δn = 0, 4p64dN+14p54dN+2+4p64dN4f1 to Δn = 0, 5p65dN+15p55dN+2+5p65dN5f1 transitions. This causes unexpected and significant changes in the impact of configuration interaction from that observed in the heavily studied n = 4 – n = 4 arrays. In this study, the properties of n = 5n = 5 arrays have been investigated theoretically with the aid of Hartree-Fock with configuration interaction (HFCI) calculations. In addition to predicting the wavelengths and spectral details of the anticipated features, the calculations show that the effects of configuration interaction are quite different for the two different families of Δn = 0 transitions, a conclusion which is reinforced by comparison with experimental results.

1. Introduction

Laser produced plasmas (LPPs) from tin droplet targets have been adopted as the optimum extreme ultraviolet (EUV) light sources for next generation lithography for high-volume manufacturing (HVM) of semiconductor circuits with feature sizes of 10 nm or less [1,2]. Transitions of the type 4p64dN+14p54dN+2+4p64dN4f1 in Sn8+–Sn13+ merge to form an unresolved transition array (UTA) [3] which contains thousands of individual lines and emits strongly in such a plasma at an electron temperature of ~30 eV in a narrow wavelength range around 13.5 nm [4,5]. This value coincides with the wavelength of peak reflectance of ~70% of the Mo/Si multilayer mirrors (MLMs) that are used in the scanning tools [6] and tin plasmas are the brightest sources at this wavelength. Other recent research has concentrated on investigating future-generation lithographic sources at shorter wavelengths, in particular at 6.75 nm where an intense UTA is emitted by gadolinium and terbium plasmas with an electron temperature of close to 100 eV [7,8,9], and where LaB4C and LaNB4C MLMs have a peak theoretical reflectivity of close to ~80% [10]. Once more the transitions responsible are predominantly of the type 4p64dN+14p54dN+2+4p64dN4f1.
Moving to shorter wavelengths, we encounter the ”water window” (2.3–4.4 nm) spectral region lying between the K-edges of carbon and oxygen, where carbon K-edge absorption is strong, but oxygen L edge absorption is weak, and where sources are being developed for in vivo single shot imaging and tomography of biological samples in aqueous environments with nm resolution [11,12]. Initially, sources in this region used strong quasi-monochromatic emission at wavelengths of λ = 2.879 nm and λ = 2.478 nm arising from the 1s21s 2p line in N5+ and the 1s2p doublet in N6+ respectively [13]. However more recently 4d4f transitions of the 4p64dN+14p54dN+2+4p64dN4f1 UTA in Bi37+–Bi46+ have been proposed, and a Bi source based on a plasma heated to a sufficient temperature (Te > 500 eV) to generate these ion stages is under development for water window imaging [14].
The dominant emission in all of these sources arises from 4p64dN+14p54dN+2+4p64dN4f1 transitions and due to the near degeneracy of the 4p54dN+2 and 4dN4f configurations, it is well known that it is necessary to allow for configuration interaction (CI) in the upper state [4,15,16]. The effects of CI in any particular ion stage have been shown to cause a strong spectral narrowing and concentrate the available emission intensity at the high energy end of the array. Moreover, although the 4p54dN+2 configuration must be included in order to obtain the correct energy eigenvalues and eigenvectors, the latter remain sufficiently pure while the emission is dominated by the valence 4p64dN+14p64dN4f1 transitions and there is little evidence in any spectrum of a sizable contribution in emission from 4p64dN+14p54dN+2 lines until N = 1. This is presumably due to the electron impact excitation rates for valence and sub-valence excitation responsible for populating the upper states being very different. Based on a simple line strengths comparison, the ratio of total lines strengths for pd transitions to that for df should scale as 9−N/N+1 times the ratio of their respective dipole matrix elements [17]. So one would expect the pd contribution to overtake that for df with increasing ionization around n = 3 [17]. Moreover, if one allows for spin orbit splitting of the 4p and 4d subshells, for N > 4 the lowest configuration will be 4p21/24p43/24d43/24dN-45/2, Thus if it is easier to collisionally excite outer electrons, for N > 4 the dominant excitation will involve 4d5/2 electrons and the transitions expected are: 4p21/24p43/24d43/24dN-45/2−4p21/24p33/24d43/24dN-35/2+4p21/24p43/24d43/24dN-55/24f.
For N < 4, the lowest configuration will be 4p21/24p43/24dN3/2 and transitions can now take place to 4p21/24p43/24dN3/2−4p21/24p33/24dN+13/2+4p11/24p43/24dN+13/2+4p21/24p43/24dN-13/24f with the 4p1/2–4d3/2 contribution appearing on the short wavelength side of the UTA, or, if the 4p spin orbit splitting is sufficiently large, forming a second UTA at a shorter wavelength.
However, both sets of transitions are responsible for absorption by ions in the plasma periphery which is the major problem that must be overcome to attain the maximum conversion efficiency of laser to spectral emission energy in EUV source development. Theoretical studies of the effects of CI in ions from Z = 50 – Z = 89 have been reported which showed that CI effects in general diminish as Z increases as the upper state arrays separate in energy [18,19] and recently the corresponding UTA emission in a number of elements at the higher Z end of this sequence has been observed [20,21].
In the absence of CI, according to the UTA formalism, for 4p64dN+14p64dN4f1 transitions the position of the line strength weighted mean of an array is shifted from the position of the differences in average energies by an amount [22]
δ E = 35 9 ( N ) [ k 0 f k F k ( 4 d , 4 f ) + g k G k ( 4 d , 4 f ) ]
where Fk(4d,4f) and Gk(4d,4f) are Slater Condon direct and exchange integrals respectively and the coefficients fk and gk result from integrals over polar and azimuthal angles that, in general, decrease with increasing k [23]. Here g1 = 137/2450 has the largest numerical value and the above formula can be roughly approximated as δ E = 2 9 N G 1 ( 4 d , 4 f ) [24] so that the position of the emission peak is determined by the degree of 4d and 4f overlap. In higher ion stages (beyond ~4+) of the rare earths, where G1(4d, 4f) is almost constant for different ion stages of a given element, the effect of CI is to essentially remove this N dependence and the array is narrowly peaked at around 2G1(4d, 4f) above the difference between the average energies of the ground and upper state configurations. Thus the UTAs in successive ion stages overlap with each other to yield a very intense, relatively narrow (ΔE ~10 eV), emission band in a low opacity plasma, whose shape is completely modified by increasing opacity [25].
In performing calculations for low ion stages of the lighter lanthanides and the elements preceding them in the periodic table, it is necessary to expand the excited state basis to include higher nf orbitals or reduce the effective exchange interaction. This is achieved by scaling the G1(4d, 4f) parameter, as is done in calculations with the Cowan code, in order to obtain good agreement between calculated and observed results. Mixing of 4f and nf orbitals essentially increases the mean radius of the 4f wave function and so leads to a reduction in the size of both direct and exchange integrals [26]. The photoionization spectra of low ion stages of these elements are well known to be dominated by 4f contraction effects and the correct estimation of the 4f radial wave function is essential if good agreement between theory and experimental spectra is to be obtained [27].
For the elements from Ag to La, 4f contraction increases with ion stage due to the interplay between the attractive Coulomb and centrifugal repulsion ( l ( l + 1 ) 2 μ r 2 ) terms in the effective radial potential, where l is the orbital angular momentum quantum number and µ is the reduced mass of the electron. In the neutral atom, the effective potential is bimodal with an inner well close to the nucleus, whose depth rapidly increases from Z = 47 (silver), where it first appears, to Z = 58 (cerium), where it first supports a bound state leading to the formation of the lanthanides [27,28]. This inner well is separated by a centrifugal barrier from a broad outer well with a minimum near the hydrogenic value of 16a0. The EUV absorption spectrum of these elements is dominated by a large 4dεf shape resonance [29] since depending on Z, 4dεf excitation can only occur when the εf photoelectron has sufficient energy to surmount the centrifugal barrier, or the lowest state of the inner well is autotomizing. Due to the lack of any appreciable overlap between the 4d wave function, which lies in the core, and the bound nf wave functions which are eigenstates of the outer well, 4d4f transitions have vanishing oscillator strength. With increasing ionization, the inner well deepens, the potential barrier decreases, and the outer-well nf functions gradually contract into the inner well region. As they do, the 4d, 4f overlap increases and the intensity of 4d4f transitions increases and the oscillator strength, associated with 4dεf in the neutral is effectively transferred to 4d4f excitation [30].
In contrast to the situation for Δn = 0, n = 4 – n = 4 transitions, no systematic study of the equivalent Δn = 0, n = 5 – n = 5 transitions has been reported. From studies of the photoionization cross-sections of neutral elements past Z = 79 (gold) it is known that the spectra display strong 5dεf resonances and that any difference from their 4d−εf counterparts can be attributed to the increased influence of spin-orbit effects [30,31,32,33]. UTAs due to 5p65dN+15p55dN+2+5p65dN5f1 transitions in LPPs of Th and U have been observed and some of the simpler transitions identified [34,35]. Compared to the 4p64dN+14p54dN+2+4p64dN4f1 UTAs observed under identical experimental conditions in the homologous elements Ba and Ce, the n = 5 – n = 5 UTAs were broader [36]. Spectra from ionized uranium that were recorded following impurity injection into the TEXT Tokamak were found to contain two distinct UTAs which were assigned primarily to 5p1/25d and 5d5f component groups of 5p65dN+15p55dN+2+5p65dN5f1 transitions in U XV –U XXXI [37]. However, apart from this work, no calculations were performed to elucidate and explore CI effects.
In this paper, we report on the results of calculations for 5p65dN+15p55dN+2+5p65dN5f1 transitions in elements from Z = 79 to Z = 92 to predict the positions and spectral properties of the corresponding UTAs and in particular to compare the effects of CI between Δn = 0, n = 5 – n = 5 transitions in these elements and n = 4 – n = 4 transitions in their homologous, lower Z counterparts.

2. Results

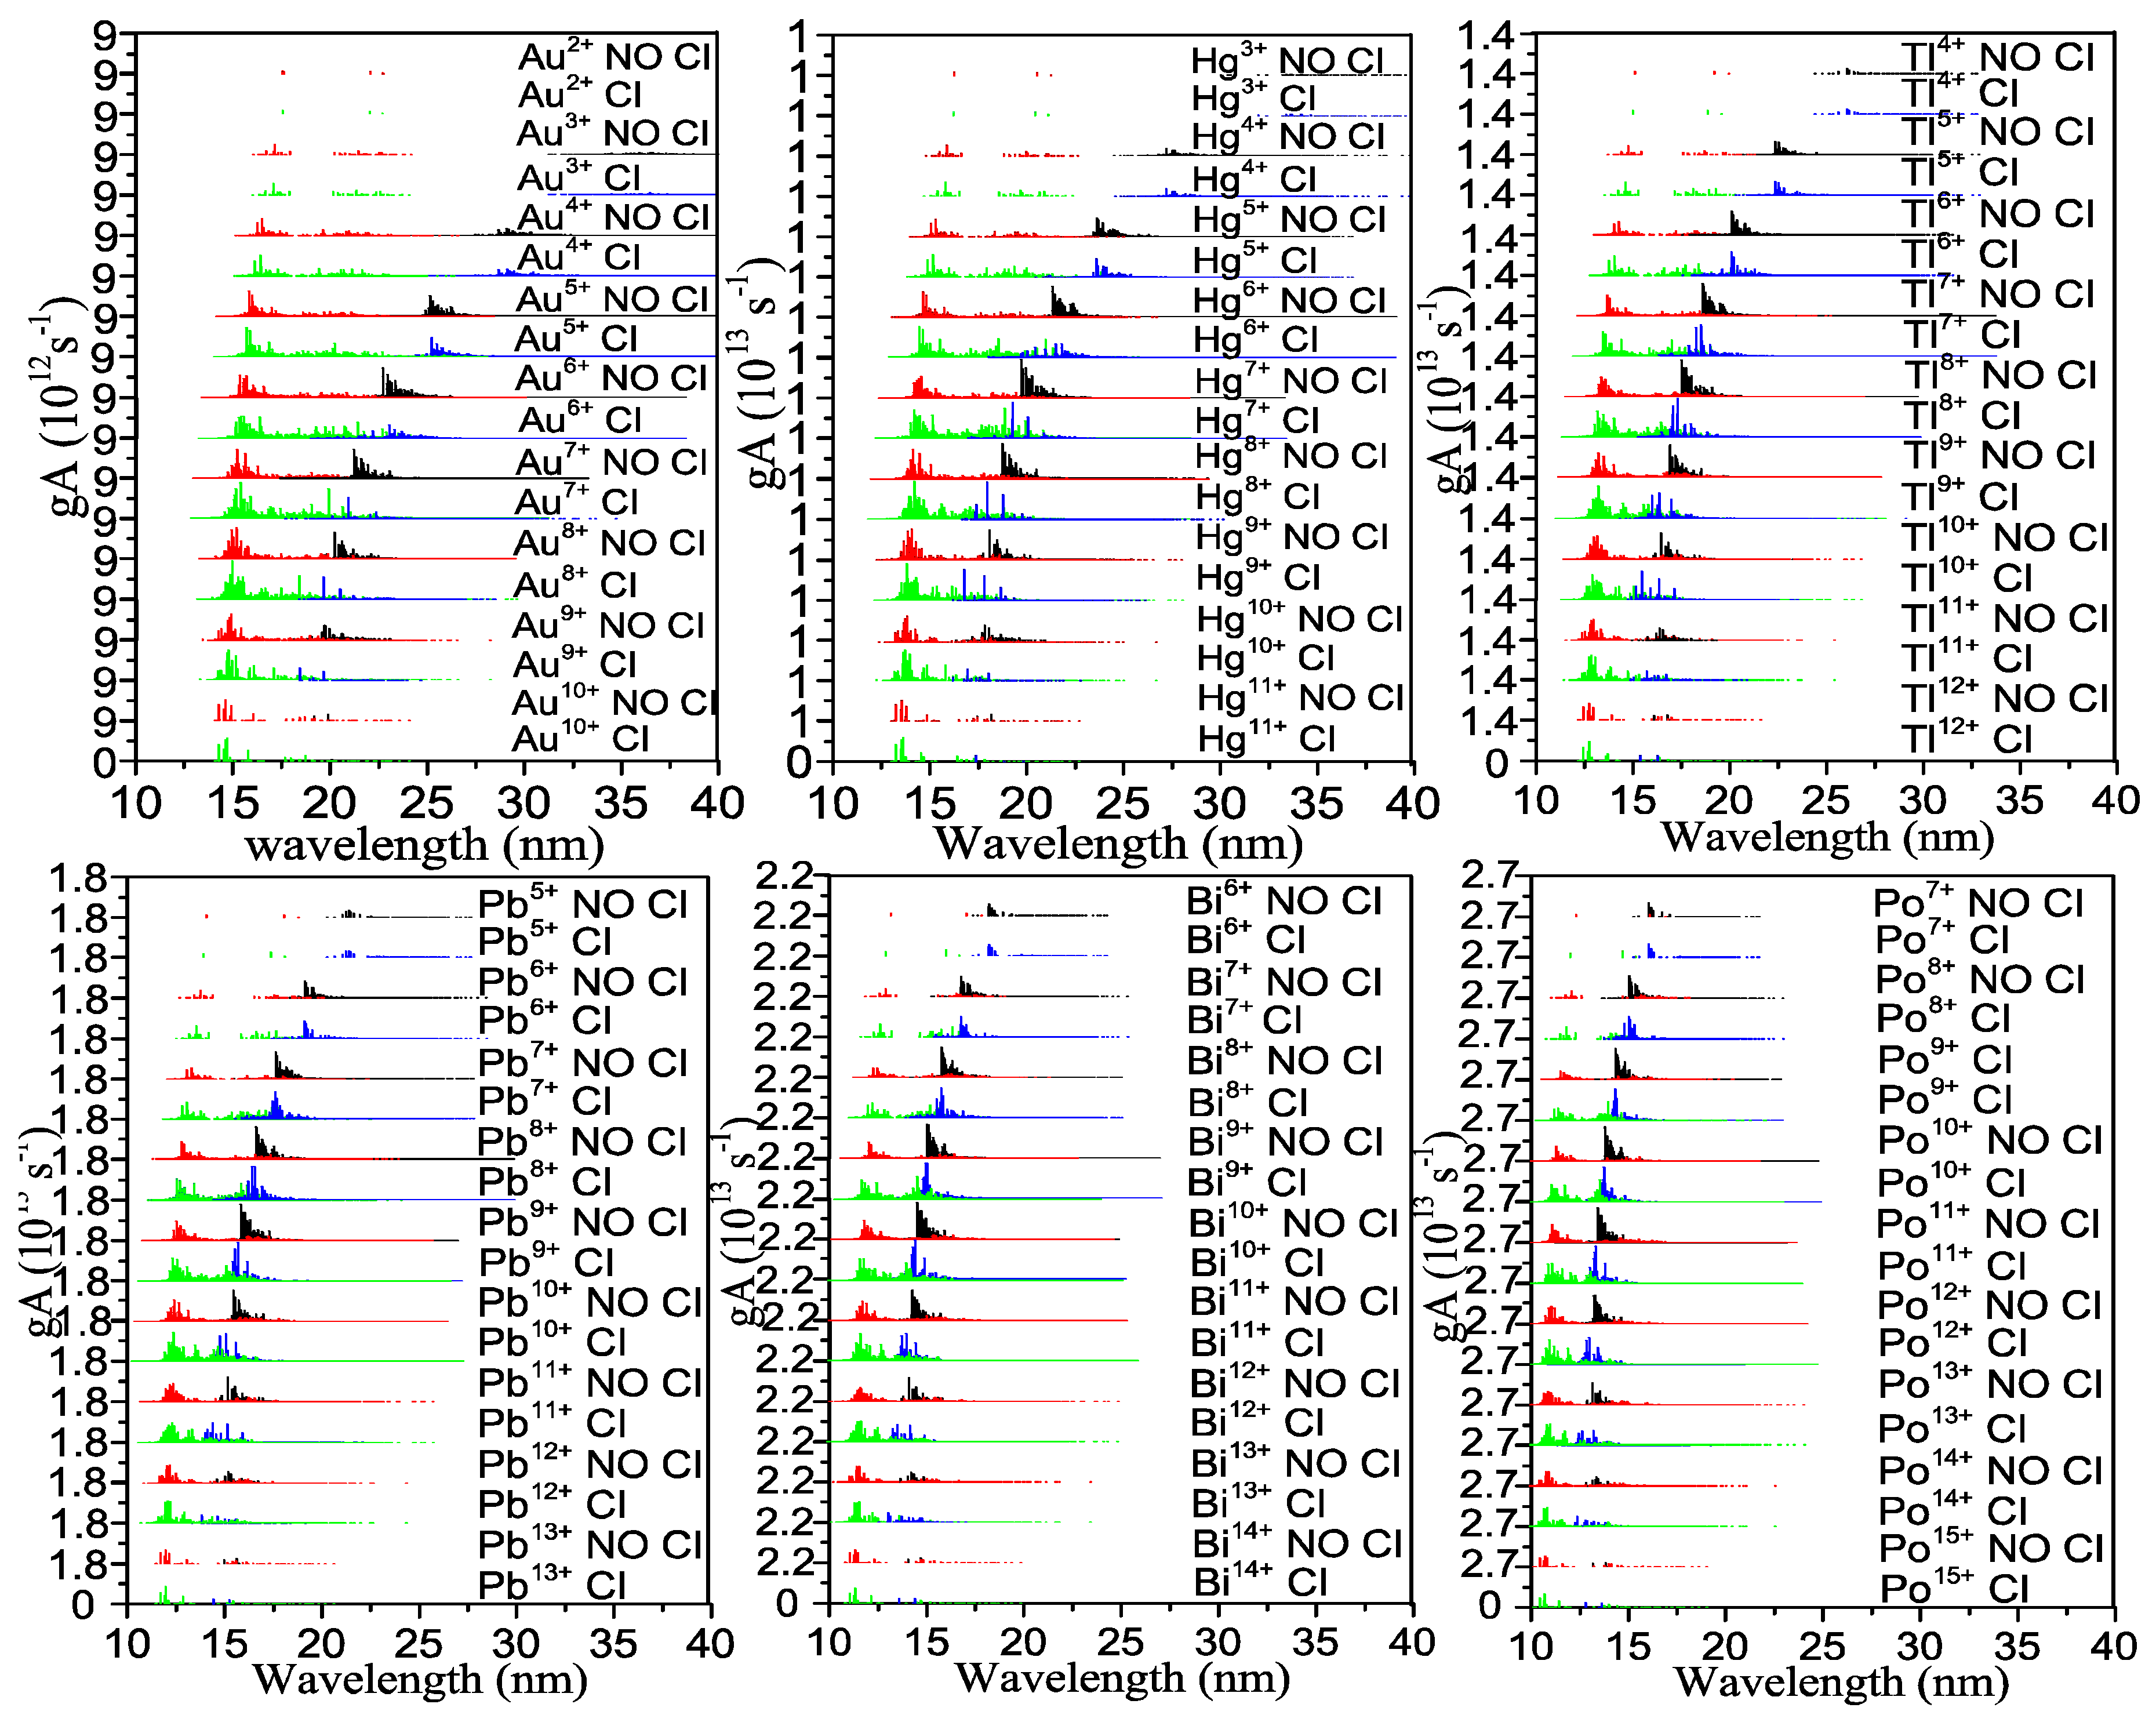
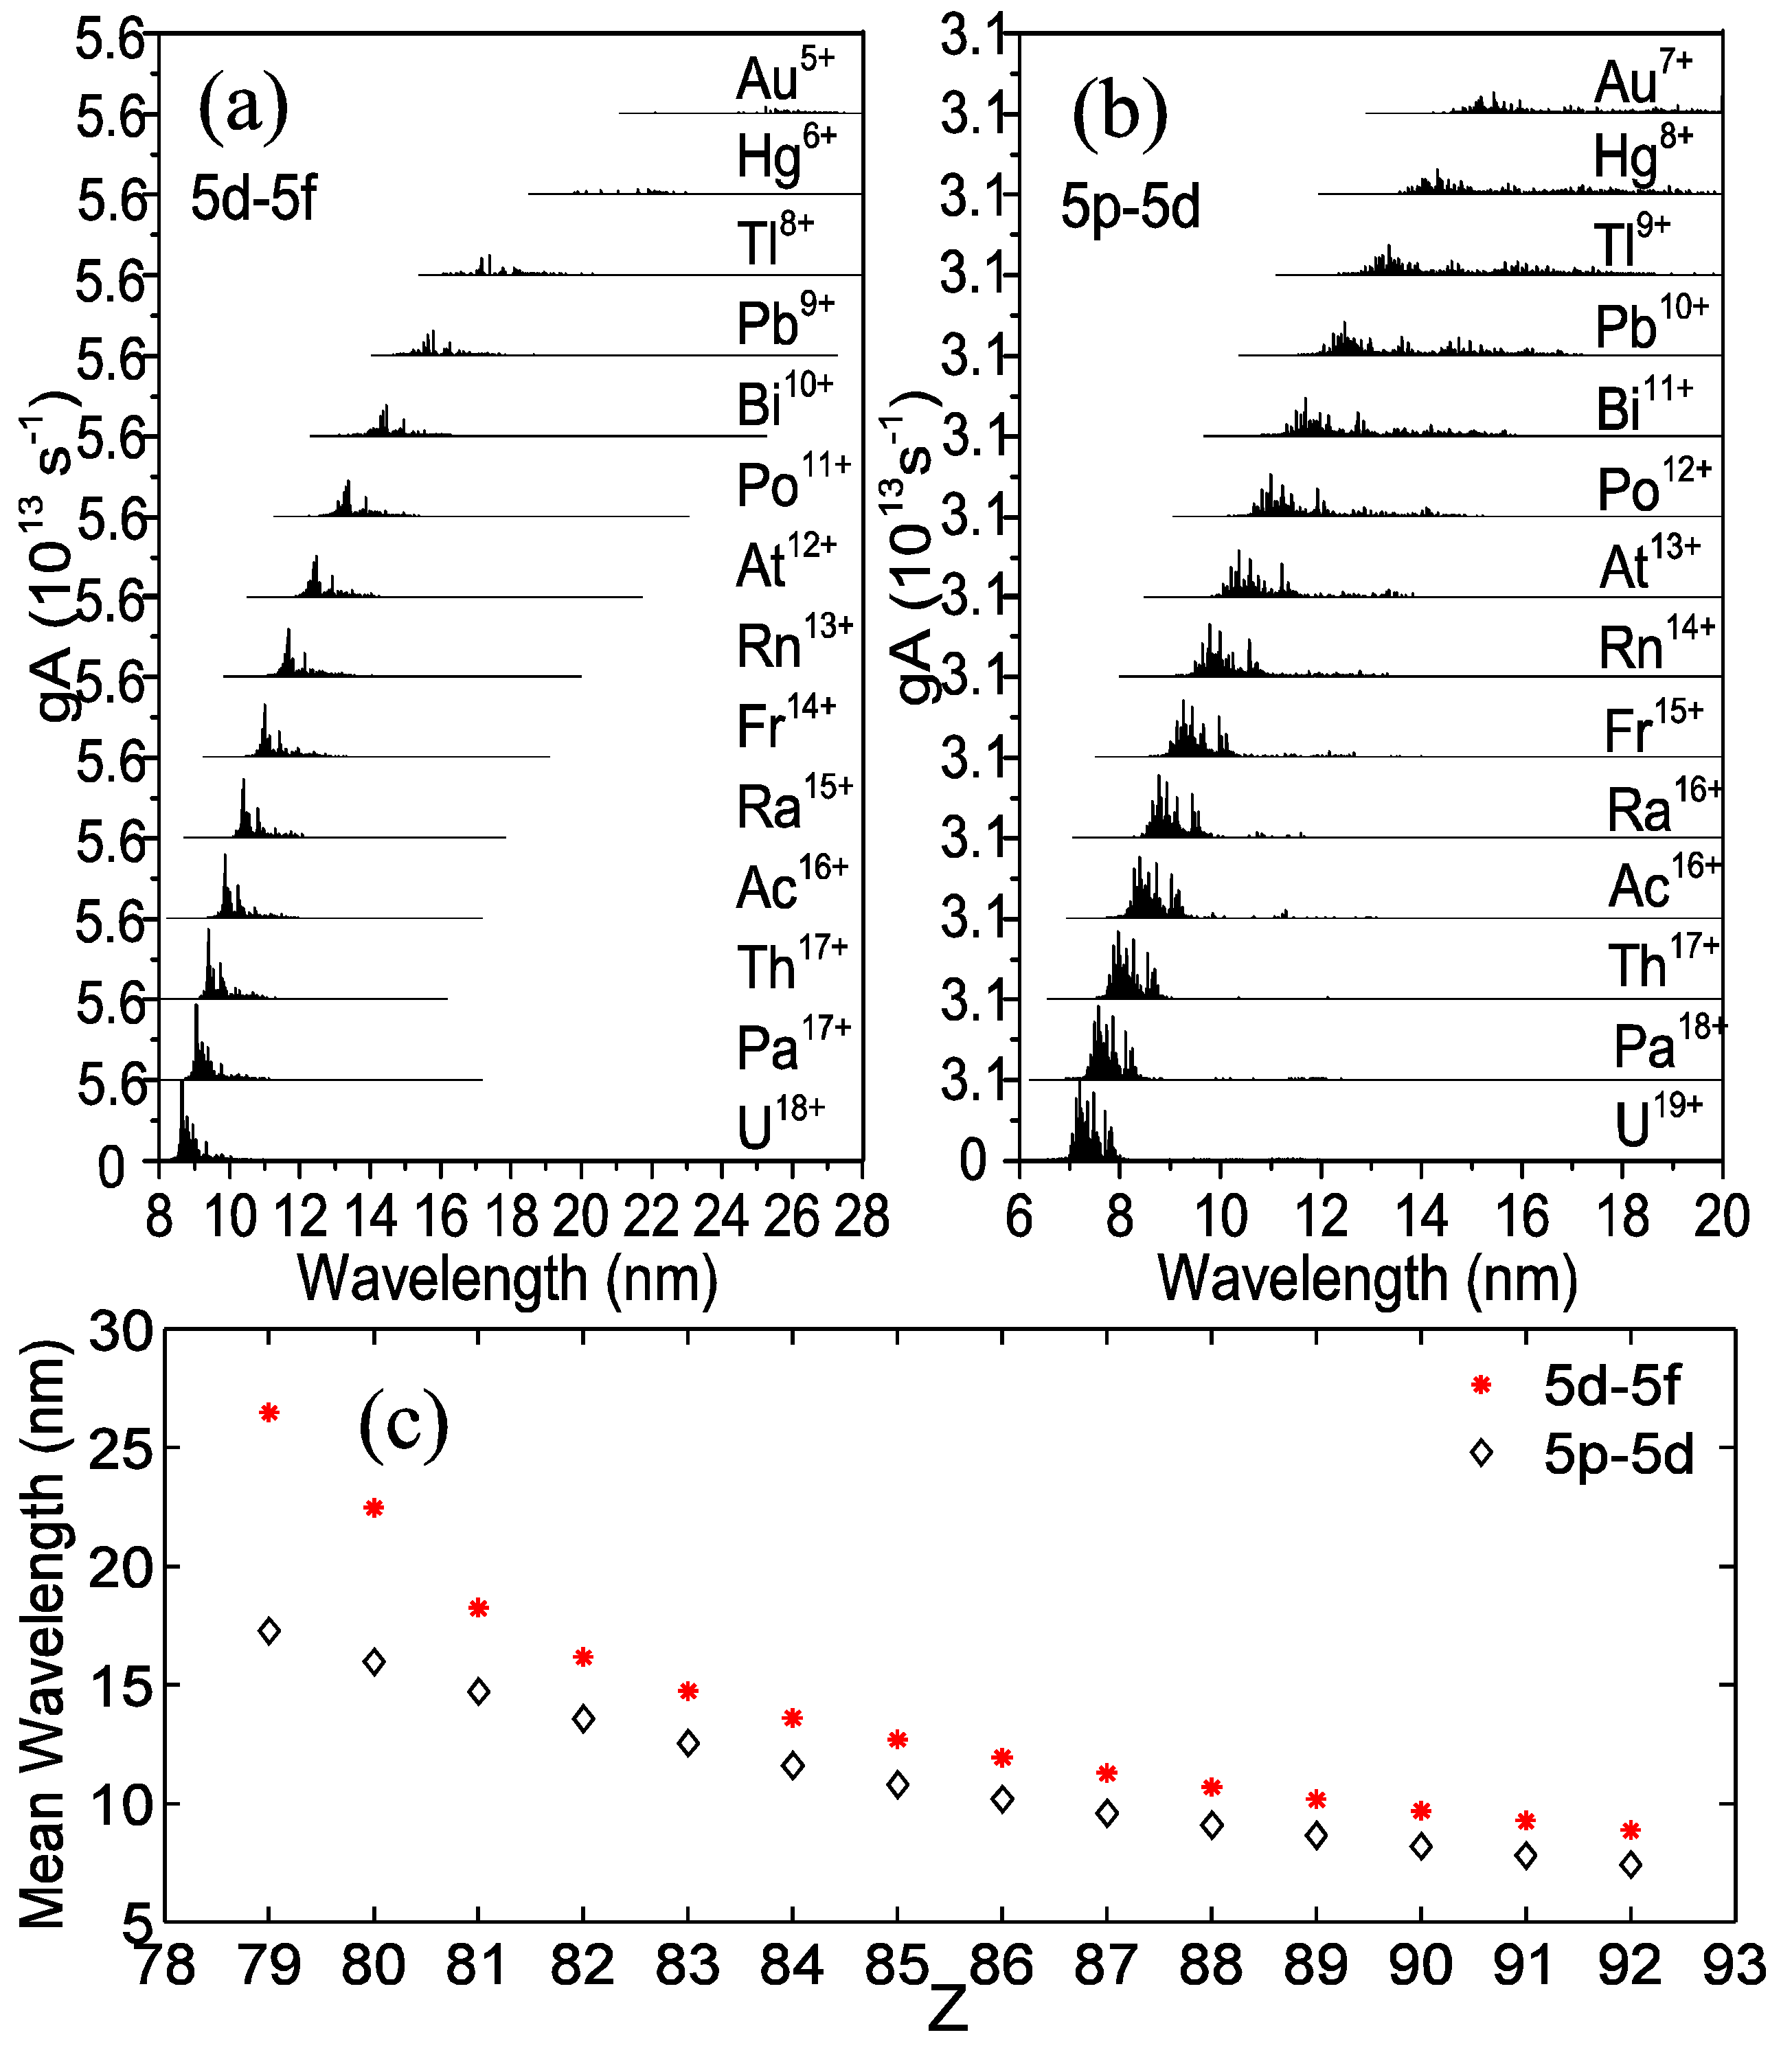
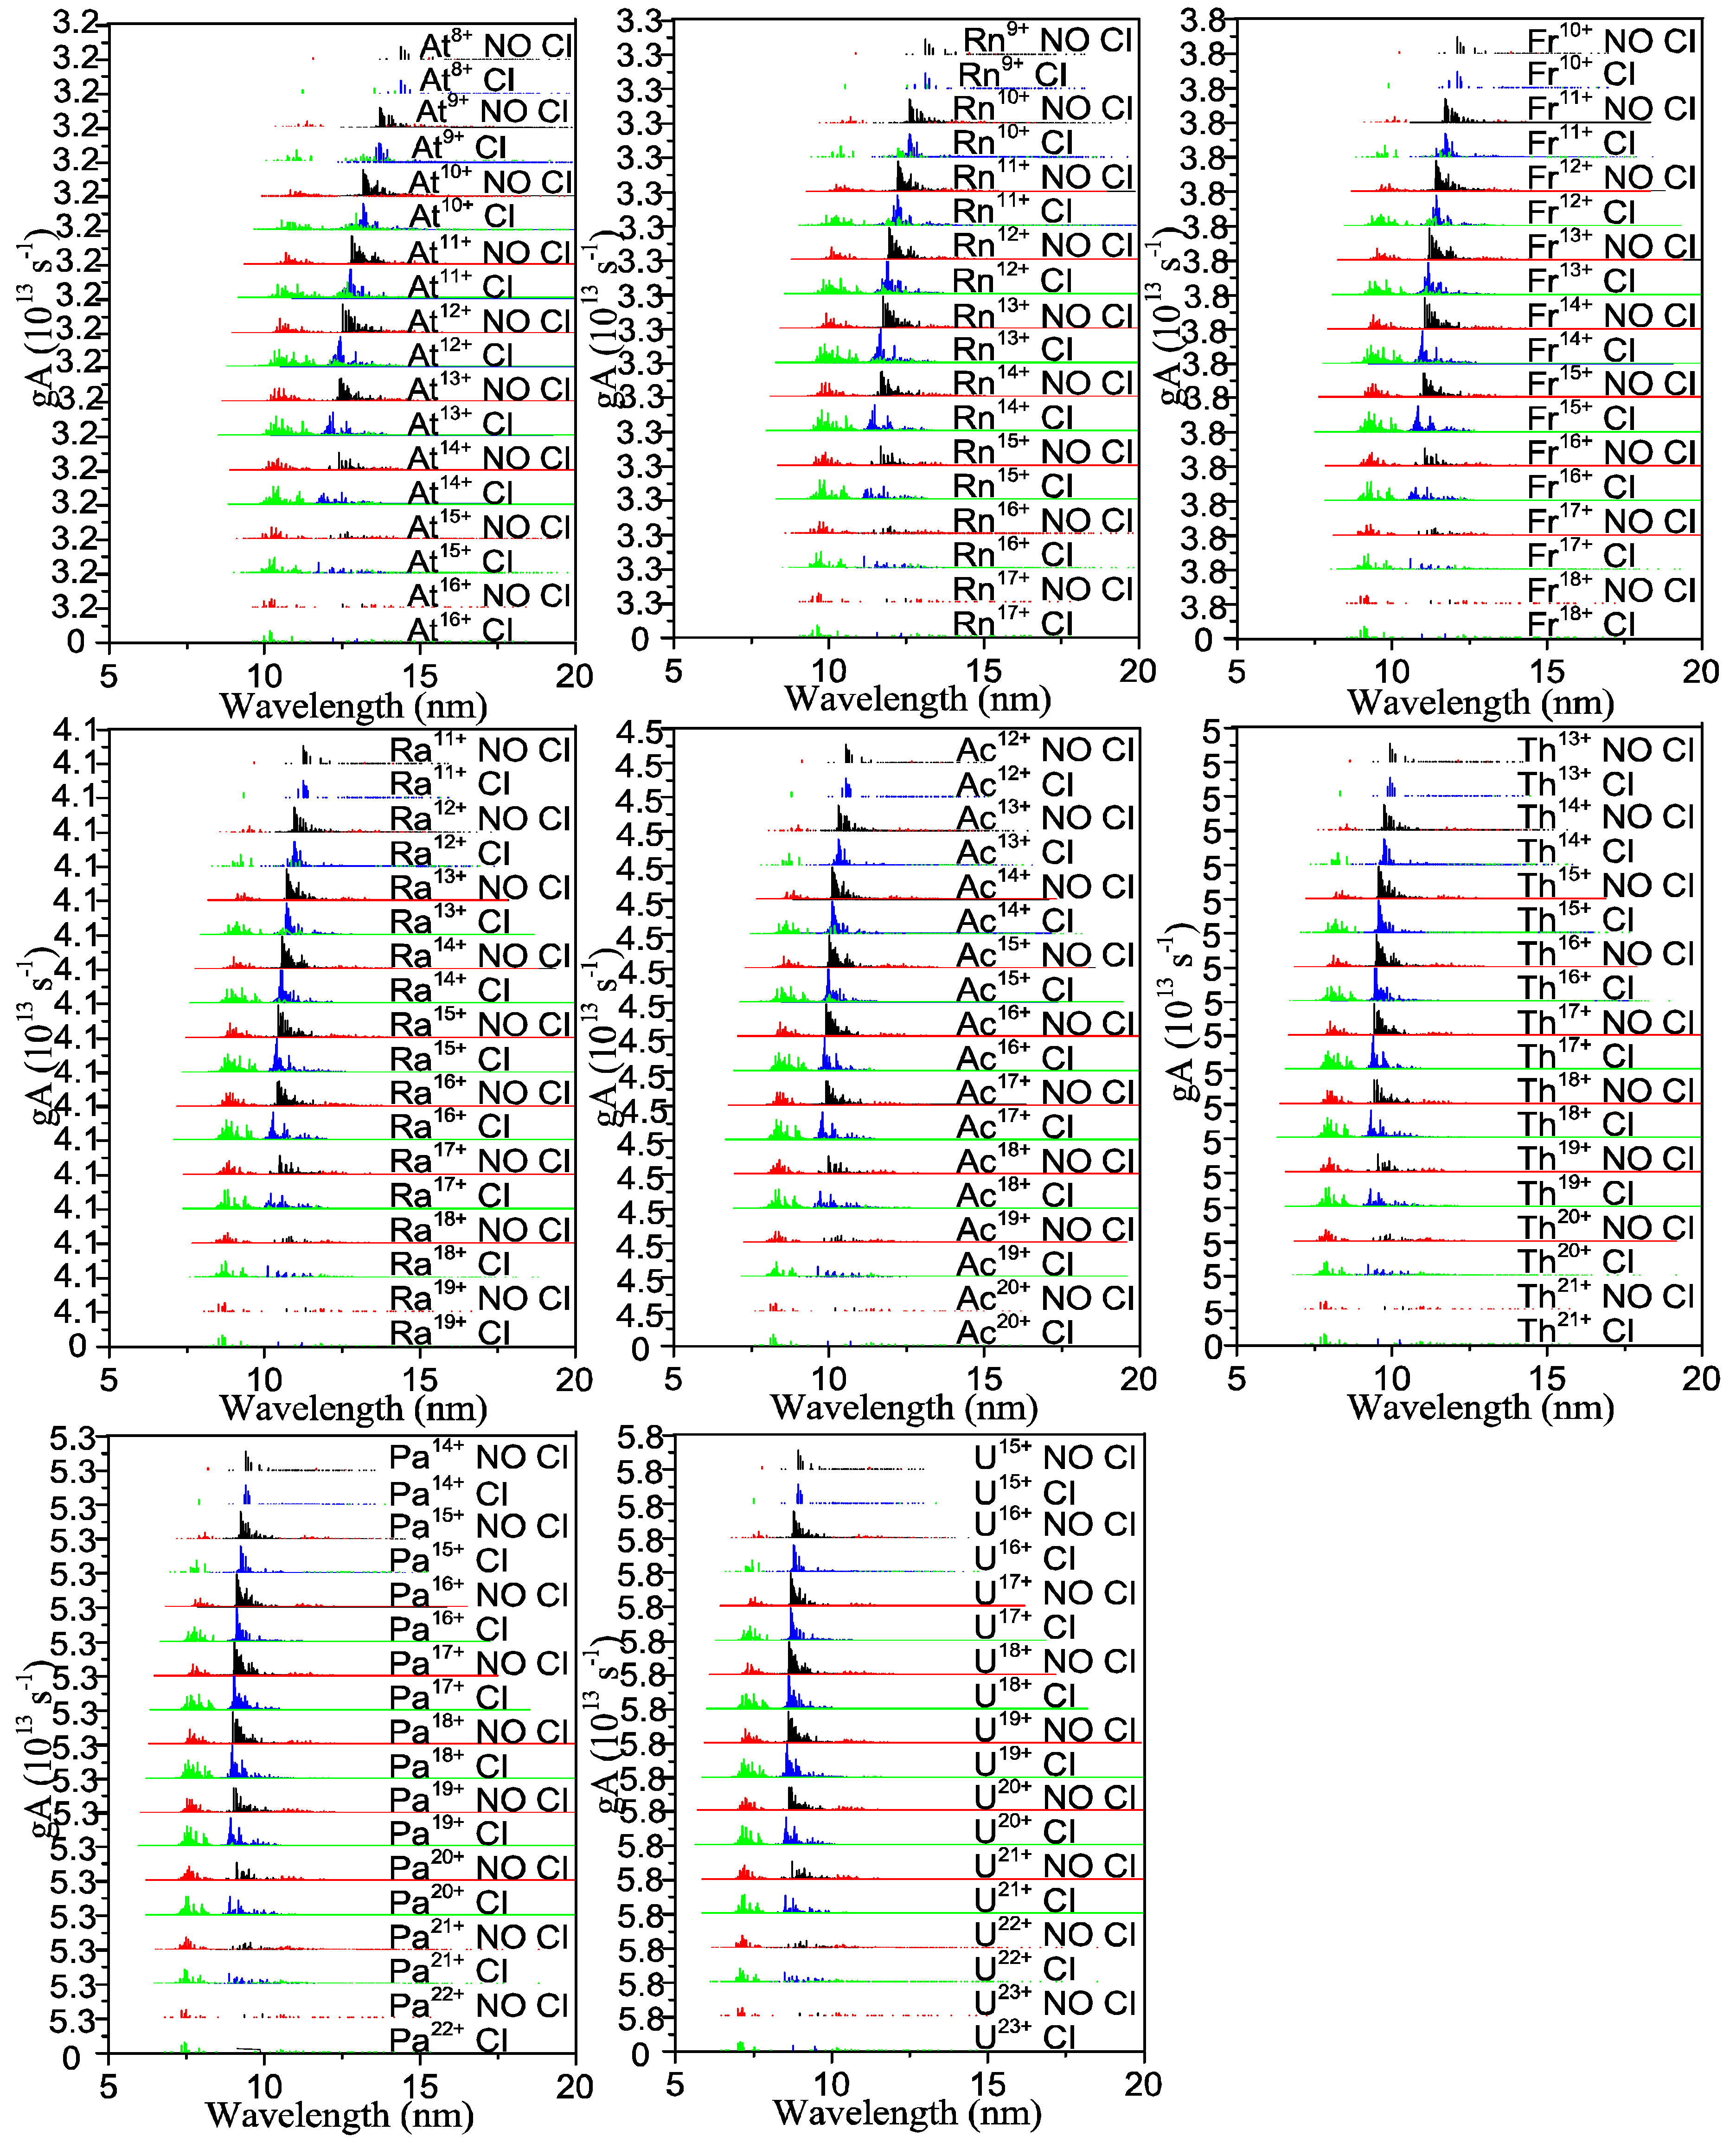
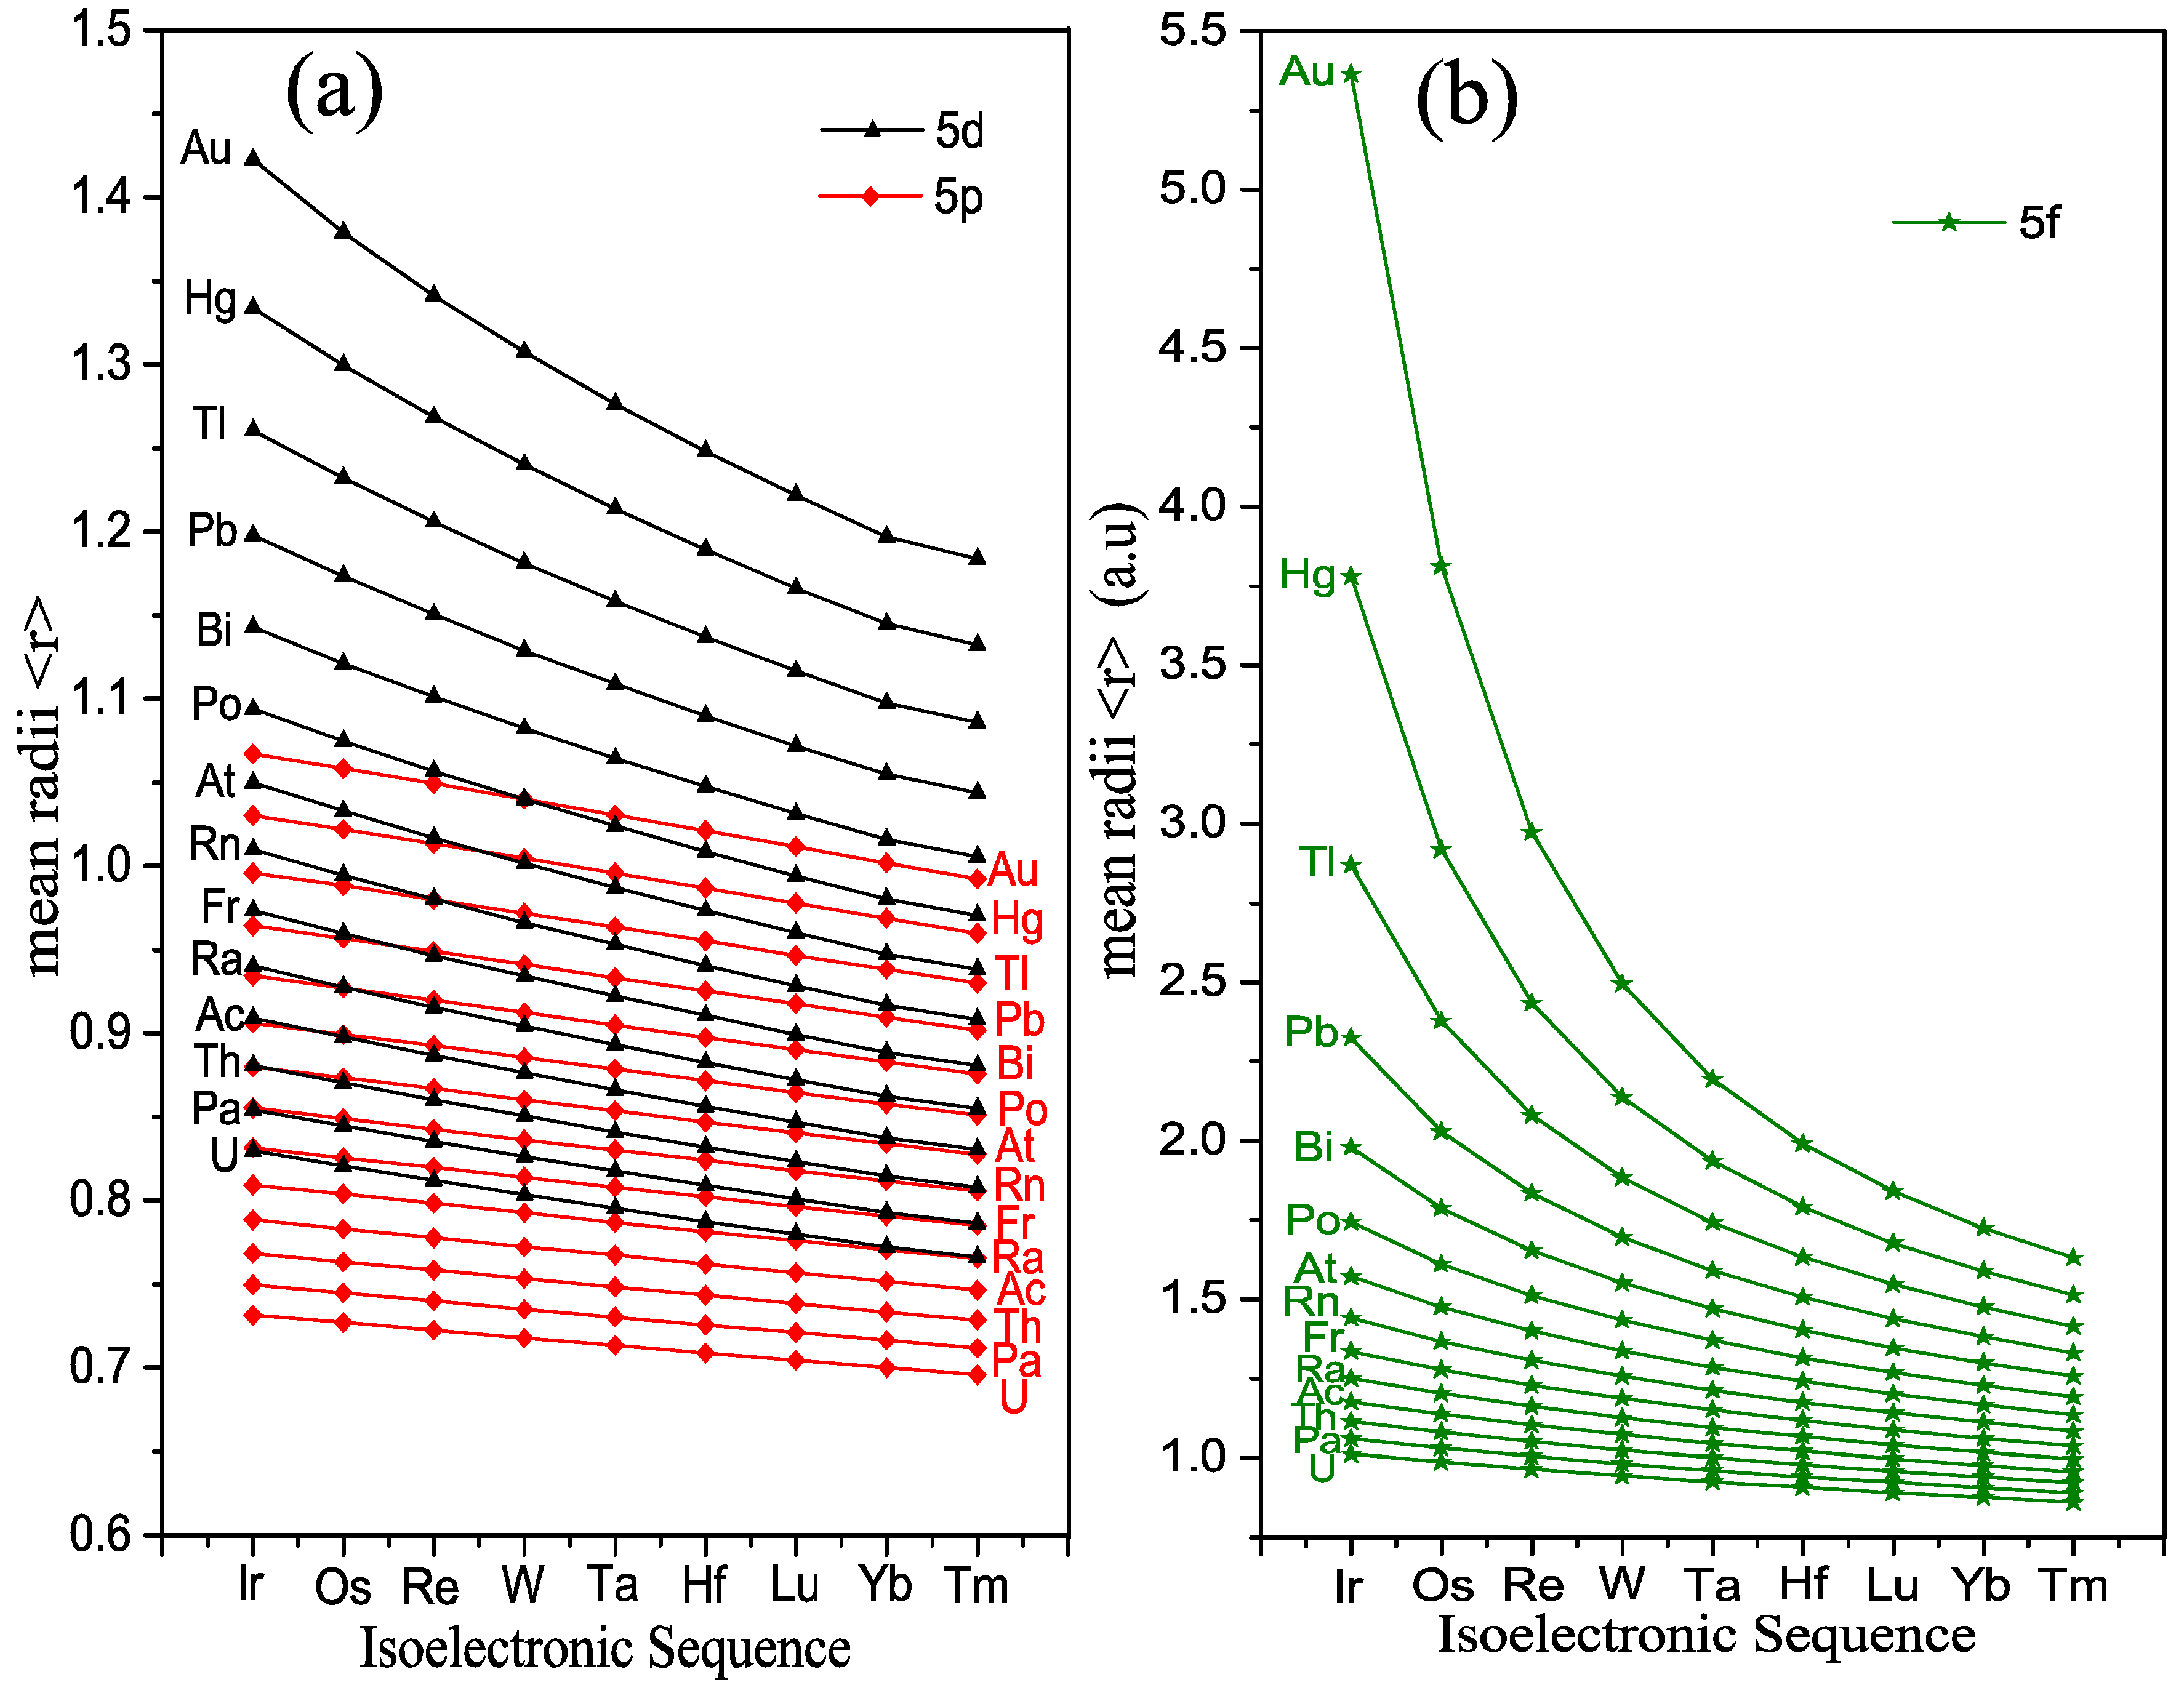
2.1. 5p−5d and 5d−5f Unresolved Transition Arrays of Ions with Z = 79-92

Calculations were performed using the Hartree-Fock with Configuration Interaction (HFCI) suite of codes written by Cowan [17]. Because of the high Z of the atoms and ions of interest, relativistic effects which are the mass-velocity and Darwin contributions to the energy were included. The Slater Condon Fk, Gk, and Rk parameters were scaled to 90% of their ab initio values while the spin orbit parameters were unchanged. Energies and wavelengths were determined for 5p65dN+15p55dN+2+5p65dN5f1 transitions both with and without CI for all ions with N = 0-8 of the elements considered. For the CI calculations, the eigenvectors percentage compositions were used to assign 5d5f and 5p5d lines within the overall arrays.
The results of these calculations are presented in Figure 1 and Figure 2. Figure 1 shows the calculated spectra for ions of the elements from Au (Z = 79) to Po (Z = 84), while Figure 2 contains the corresponding data for ions from At (Z = 85) to U (Z = 92). For each element, the green and red line distributions denote 5p5d transitions with and without CI included, respectively, while blue and black denote 5d5f transitions with and without CI included. In the case of Au, the most obvious feature of the spectra is that with increasing ion stage, the 5p5d transition arrays move slowly towards shorter wavelength while the 5d5f transition arrays move more rapidly towards higher energy with increasing ion stage. The arrays never overlap and so CI effects are almost non-existent up to Au5+ and from Au6+ onwards, CI mainly affects the 5d5f transitions where they dramatically alter the line distributions. It should be noted that most or all of the 5p5d transitions are autoionizing until we reach Au7+ and even if the upper states are populated, they will never appear in emission. The near absence of CI for 5d5f transitions in lower stages and the closeness in energy of the 5d5f sub-arrays in the higher stages would suggest that the intensity weighted mean positions of these arrays should be given by Equation (1). The fact that the arrays move to shorter wavelength so dramatically is due to the 5f wave function contraction which leads to both an increase in the separation of average energies of the upper and lower configurations and also a rapid increase in G1(5d, 5f). Similar behavior, in the case of 4d4f transitions has been found in Sn spectra [38].
In the case of Hg and Tl, CI effects again become important for 5d5f spectra at Hg6+ and Tl6+. For Pb and Bi the effects of CI on 5d5f transitions are predicted to become noticeable at Pb7+ and Bi7+, while in all cases the changes in the 5p5d sub-arrays only become noticeable when they begin to overlap with the 5d5f sub-arrays and where a redistribution of intensity towards the higher energy end of the overall arrays become visible. With increasing Z, 5f contraction effects diminish as the transitions now involve significantly higher charge state ions. As can be seen from Figure 2, the 5p5d and 5d5f sub-arrays become closer and CI effects cause subtle changes to the spectral profiles of both sub-arrays for situations where the 5p65dN+1 ground configuration has N > 3 and more dramatic effects when N ≤ 3.
To explore the effects of wave function contraction with increasing ion stage, the radial wave functions P n , l ( r ) were extracted for 5p, 5d, and 5f electron orbitals for each ion considered. From these the mean radius r was computed using r = 0 P n , l 2 r d r and the results are presented in Figure 3. It is clear from this figure that the mean radii of the 5p and 5d functions decrease slowly with Z and charge state. The situation for the 5f wave function is very different. In Au, for example, r contracts from 5.4a0 in Au2+ to 1.5a0 in Au10+. With increasing Z, the effect is less dramatic and past Ra, the 5f contacts with increasing ionization much like the 5p and 5d. This is mirrored in the spectra by the fact that separation of the 5p5d and 5d5f arrays becomes essentially constant as the 5d5f array does not dramatically move to higher energy with increasing charge.

2.2. 5p−5d and 5d−5f UTA Statistics of Ions with Z = 79–92

In general, the complexity of arrays with 1 < N < 8, the UTA formalism is suitable for the parameterization of the calculated wavelength data [3,21]. The general nth-order moment for a set of N values λi with line strengths ωi reads
μ n = i = 1 N ω i λ i n / W
where W = i = 1 N ω i is the total line strength. The first-order moment μ 1 gives the intensity weighted average wavelength. The centered second-order moment μ 2 c = μ 2 μ 1 2 gives the variance, ν , which is obtained by the above expression after replacing λi by λiμ1. For a Gaussian-shaped distribution, its full width at half maximum (FWHM) is given by 2 ( 2 ln 2 ) 1 / 2 σ = 2.355 σ , where σ = ( μ 2 c ) 1 / 2 . Thus the variance is related to the width of the array. Using the UTA formalism described above, the gA weighted UTA positions and widths for the 5d5f and 5p5d component sub-arrays of the 5p65dN+15p55dN+2+5p65dN5f1 array were calculated and the results are presented in Figure 4 and Table 1 and Table 2. Separate UTAs for 5p5d and 5d5f transitions were identified from their eigenvector compositions and UTA statistics were computed for both sets of transitions with and without CI effects included for comparison. From this figure it is clear that in the case of 5d5f transitions, which will be observed in emission from a plasma, the effect of CI is to shift the corresponding sub-array towards higher energy especially for the higher Z elements. This trend is also clear from Table 1 and Table 2. Interestingly, unlike the corresponding 44 arrays, where spectral narrowing is the dominant effect observed, the effect of CI is actually to increase the width of the UTAs. Again, during the rapid contraction phase of the 5f wave function in lower ion stages of the lighter elements, CI effects are noticeably absent as can be seen from the coincidence in energies in both cases. For 5p5d transitions, CI effects are somewhat different also for lighter and heavier elements. For the elements past francium, the mean energies are shifted by CI towards higher values in lower ion stages and gradually converge towards their non-CI value at the highest ion stage.

3. Comparison of 5p65dN+−5p55dN+2+5p65dN5f1 with 4p64dN+1−4p54dN+2+4p64dN4f1 Arrays

In the case of 4p64dN+14p54dN+2+4p64dN4f1 transitions, as already discussed, configuration interaction leads to a strong spectral narrowing and redistribution of oscillator strength towards the high energy end of the resulting UTA. Here, the opposite is true and the widths of the predicted 5d5f UTAs is in general slightly greater when CI effects are accounted for. In order to directly compare the results of CI on the spectral distribution rearrangement of n = 4n = 4 UTA and n = 5n = 5 UTA, calculations were performed for 4p64d24p54d3+4p64d4f1 transitions in Sr-like Ag9+, Sn12+, Ba18+, and Nd22+ and 5p65d25p55d3+5p65d5f1 transitions in the homologous ions Au9+, Pb12+, Ra18+, and U22+ of the Yb-isoelectronic sequence. The results are shown in Figure 5. From this figure it is clear that for n = 4n = 4 transitions, CI completely reallocates the intensity of the 4d4f component transitions as well as the lower energy 4p4d lines to the higher energy end of the array and that with increasing ionization the resulting spectrum narrows until its FWHM becomes less than 0.5 nm. For n = 5n = 5 transitions, in the absence of CI the 5p5d array splits with increasing Z due to spin orbit interaction into 5p1/25d and 5p3/25d sub-arrays. The 5d5f sub array overlays the longer wavelength 5p3/25d5/2 sub-array in Au9+ and Pb12+, and lies between the 5p1/25d and 5p3/25d sub-arrays in Ra18+ and U22+. The effect of CI is to narrow the spectral width of the 5p1/25d sub-array while leaving its mean position essentially unchanged, while mixing the 5d5f and 5p3/25d sub-arrays to produce a broader spectral profile that in some instances contains fewer strong individual lines, that is shifted to shorter wavelength by the interaction. Thus, the effect of CI is less dramatic for 55 transitions though it still leads to major redistribution of intensity both between and within the resulting two sub arrays.
From the CI calculations, the normalized gA (gA/ΣgA) distributions for 5d5f and 5p5d transitions were extracted for each ion stage, i.e., for 0 ≤ N ≤ 8 of each of the elements considered here and summed to give an overall profile for both sets of transitions. The results are shown in Figure 6. As in the rare earths, the df lines are expected to contribute to the emission spectra from hot plasmas of these elements whilst both sets of transitions may be observed in absorption. It is interesting to compare the positions of the strong UTAs observed in LPPs of Th and U [34,35] with the predictions of the present calculations. In the Th spectrum, recorded under essentially optically thin conditions, a UTA extending from approximately 9.5–11.5 nm and peaking near 10.3 nm was observed while in the U spectrum the same feature lay between approximately 9.0 and 10.5 nm and peaked near 9.5 nm. From Table 2, the peak positions are predicted to lie near 9.8 and 9 nm respectively indicating a wavelength shift of approximately 0.5 nm between observed and calculated data for 5p65dN+15p65dN5f1 transitions. No shorter wavelength UTA corresponding to 5p65dN+15p55dN+2 was observed. However, the maximum ionization stages produced in these experiments were around 16 or 17 times ionized and some contribution from 5d105fN5d95fN+1 transitions in lower ion stages is also present. When first reported it was assumed that the increased widths of these 5p65dN+15p65dN5f1 UTAs relative to their 4p64dN+14p64dN4f1 counterparts in the spectra of the homologous species Ce and Nd was due to increased spin orbit interaction effects [34]. From this work it is clear that the 5p spin orbit splitting essentially limits the interaction to the 5p3/25d sub-array and this interaction results in a broadening of the 5d5f array. In the more highly ionized spectra of U recorded from the TEXT Tokamak, two distinct UTAs were observed with peaks near 7 and 9 nm which are in excellent agreement with the results obtained in this work. However, the shorter wavelength observed peak also contains a contribution from 5pn5pn-15d transitions, which may dominate over 5p65dN+15p55dN+2 emission.

4. Conclusions

Unresolved transition arrays (UTAs) of the type Δn = 0, 4p64dN+14p54dN+2+4p64dN4f1 have been extensively studied because their intensity and emission bandwidth makes them ideal candidates for applications as radiation sources for a variety of technological applications in the EUV and SXR region. In contrast, the corresponding Δn = 0, 5p65dN+15p55dN+2+5p65dN5f1 UTAs have not been studied in detail. In this paper, the properties of these arrays have been studied theoretically with the aid of Hartree-Fock with configuration interaction (CI) calculations. We report on calculations for 5p5d and 5d5f transitions in elements from Z = 79 to Z = 92 and predict the positions and spectral properties of the corresponding UTAs. We compared the effects of CI between Δn = 0, n = 5–n = 5 transitions in these elements and n = 4n = 4 transitions in their homologous, lower Z counterparts and found that the strong spectral narrowing, which is a feature of Δn = 0, n = 4–n = 4 transitions is not expected to be important in these spectra but shifts the position of 5d5f arrays to slightly shorter wavelengths and results in a broadening of their spectral profiles. This broadening points to their potential usefulness in the development of broadband sources for future EUV and soft X-ray metrology applications.

Acknowledgments

Luning Liu acknowledges support from UCD and from a Chinese Scholarship Council (CSC) scholarship and from the Fundamental Research Funds for the Central Universities under grant No. HUST: 2016YXMS028. DK acknowledges funding from the Irish Research Council and the Marie Curie Actions ELEVATE fellowship.

Author Contributions

Luning Liu and Gerry O’ Sullivan performed the calculations; Gerry O’ Sullivan, Deirdre Kilbane, Padraig Dunne, Luning Liu and Xinbing Wang analyzed the data; Gerry O’Sullivan, Deirdre Kilbane and Luning Liu wrote the paper.

Conflicts of Interest

The authors declare no conflict of interest. The founding sponsors had no role in the design of the study; in the collection, analyses, or interpretation of data; in the writing of the manuscript, and in the decision to publish the results.

References

  1. Van den Zande, W. EUVL exposure tools for HVM: It’s under (and about) control. In Proceedings of the EUV and Soft X-Ray Source Workshop, Amsterdam, The Netherlands, 7–9 November 2016. [Google Scholar]
  2. O’Sullivan, G.; Li, B.W.; D’Arcy, R.; Dunne, P.; Hayden, P.; Kilbane, D.; McCormack, T.; Ohashi, H.; O'Reilly, F.; Sheridan, P.; et al. Spectroscopy of highly charged ions and its relevance to EUV and soft X-ray source development. J. Phys. B At. Mol. Opt. Phys. 2015, 48, 144025. [Google Scholar] [CrossRef]
  3. Bauche-Arnoult, C.; Bauche, J.; Klapisch, M. Variance of the distributions of energy levels and of the transition arrays in atomic spectra. Phys. Rev. A 1979, 20, 2424–2439. [Google Scholar] [CrossRef]
  4. O’Sullivan, G.; Faulkner, R. Tunable narrowband soft X-ray source for projection lithography. Opt. Eng. 1994, 33, 3978–3983. [Google Scholar]
  5. Churilov, S.S.; Ryabtsev, A.N. Analysis of the Sn IX-Sn XII spectra in the EUV region. Phys. Scr. 2006, 73, 614. [Google Scholar] [CrossRef]
  6. Attwood, D.T. Soft X-rays and Extreme Ultraviolet Radiation: Principles and Applications; Cambridge University Press: Cambridge, UK, 2000. [Google Scholar]
  7. Churilov, S.S.; Kildiyarova, R.R.; Ryabtsev, A.N.; Sadovsky, S.V. EUV spectra of Gd and Tb ions excited in laser-produced and vacuum spark plasmas. Phys. Scr. 2009, 80, 045303. [Google Scholar] [CrossRef]
  8. Cummins, T.; Otsuka, T.; Yugami, N.; Jiang, W.; Endo, A.; Li, B.; O’Gorman, C.; Dunne, P.; Sokell, E.; O’Sullivan, G.; et al. Optimizing conversion efficiency and reducing ion energy in a laser-produced Gd plasma. Appl. Phys. Lett. 2012, 100, 061118. [Google Scholar] [CrossRef]
  9. Yoshida, K.; Fujioka, S.; Higashiguchi, T.; Ugomori, T.; Tanaka, N.; Ohashi, H.; Kawasaki, M.; Suzuki, Y.; Suzuki, C.; Tomita, K.; et al. Efficient extreme ultraviolet emission from one-dimensional spherical plasmas produced by multiple lasers. Appl. Phys. Express 2014, 7, 086202. [Google Scholar] [CrossRef]
  10. Louis, E.; Mullender, S.; Bijkerk, F. Multilayer development for extreme ultraviolet and shorter wavelength lithography. In Proceedings of the International Workshop on EUV and Soft X-ray Sources, Dublin, Ireland, 7–9 November 2011. [Google Scholar]
  11. Skoglund, P.; Lundström, U.; Vogt, U.; Hertz, H.M. High-brightness water window electron-impact liquid-jet microfocus source. Appl. Phys. Lett. 2010, 96, 084103. [Google Scholar] [CrossRef]
  12. McDermott, G.; le Gros, M.A.; Larabell, C.A. Visualizing cell architecture and molecular location using soft x-ray tomography and correlated cryo-light microscopy. Annu. Rev. Phys. Chem. 2012, 63, 225–239. [Google Scholar] [CrossRef] [PubMed]
  13. Wachulak, P.W.; Bartnik, A.; Fiedorowicz, H.; Rudawski, P.; Jarocki, R.; Kostecki, K.; Szczurek, M. “Water window” compact, table-top laser plasma soft X-ray sources based on gas puff target. Nucl. Instrum. Methods B 2010, 268, 1692–1700. [Google Scholar] [CrossRef]
  14. Higashiguchi, T.; Otsuka, T.; Yugami, N.; Jiang, W.; Endo, A.; Li, B.; Dunne, P.; O’Sullivan, G. Feasibility study of broadband efficient “water window” source. Appl. Phys. Lett. 2012, 100, 014103. [Google Scholar] [CrossRef]
  15. Mandelbaum, P.; Finkenthal, M.; Schwob, J.L.; Klapisch, M. Interpretation of the quasicontinuum band emitted by highly ionized rare-earth elements in the 70–100-Å range. Phys. Rev. A 1987. [Google Scholar] [CrossRef]
  16. Koike, F.; Fritzsche, S.; Nishihara, K.; Sasaki, A.; Kagawa, T.; Nishikawa, T.; Fujima, K.; Kawamura, T.; Furukawa, H. Precise and Accurate Calculations of Electronic Transitions in Heavy Atomic Ions Relevant to Extreme Ultra-Violet Light Sources. J. Plasma Fusion Res. 2006, 7, 253. [Google Scholar]
  17. Cowan, R.D. The Theory of Atomic Structure and Spectra; University of California Press: Berkeley, CA, USA, 1981. [Google Scholar]
  18. Kilbane, D.; O’Sullivan, G. Ground-state configurations and unresolved transition arrays in extreme ultraviolet spectra of lanthanide ions. Phys. Rev. A 2010, 82, 062504. [Google Scholar] [CrossRef]
  19. Kilbane, D. Transition wavelengths and unresolved transition array statistics of ions with Z=72–89. J. Phys. B At. Mol. Opt. Phys. 2011, 44, 165006. [Google Scholar] [CrossRef]
  20. Ohashi, H.; Higashiguchi, T.; Suzuki, Y.; Arai, G.; Li, B.; Dunne, P.; O’Sullivan, G.; Sakaue, H.A.; Kato, D.; Murakami, I.; et al. Characteristics of X-ray emission from optically thin high-Z plasmas in the soft X-ray region. J. Phys. B At. Mol. Opt. Phys. 2015, 48, 144011. [Google Scholar] [CrossRef]
  21. Wu, T.; Higashiguchi, T.; Li, B.W.; Arai, G.; Harac, H.; Kondo, Y.; Miyazaki, T.; Dinh, T.-H.; O'Reilly, F.; Sokell, E.; et al. Analysis of unresolved transition arrays in XUV spectral region from highly charged lead ions produced by subnanosecond laser pulse. Opt. Commun. 2017, 385, 143–152. [Google Scholar] [CrossRef]
  22. Bauche-Arnoult, C.; Bauche, J. Statistical approach to the spectra of plasmas. Phys Scr. 1992. [Google Scholar] [CrossRef]
  23. Condon, E.U.; Odabasi, H. Atomic Structure; Cambridge University Press: Cambridge, UK, 1980. [Google Scholar]
  24. Bauche-Arnoult, C.; Bauche, J. Variance of the distributions of energy levels and of the transition arrays in atomic spectra. Phys Rev. A 1979, 20, 2424–2439. [Google Scholar] [CrossRef]
  25. Carroll, P.K.; O’Sullivan, G. Ground-state configuration of ionic species I through XVI for Z=57–74 and the interpretation of 4d-4f emission resonances in laser-produced plasma. Phys Rev. A 1982, 25, 275. [Google Scholar] [CrossRef]
  26. Connerade, J.P.; Mansfield, M.W.D. Term-dependent Hybridization of the 5f wave functions of Ba and Ba++. Phys. Rev. Lett. 1982. [Google Scholar] [CrossRef]
  27. O’Sullivan, G. The origin of line-free XUV continuum emission from laser-produced plasmas of the elements 62≤Z≤74. J. Phys. B 1983. [Google Scholar] [CrossRef]
  28. Connerade, J.P.; Esteva, J.M.; Karnatak, R.C. Giant Resonances in Atoms, Molecules and Solids; Springer: New York, NY, USA, 1987. [Google Scholar]
  29. Fano, U.; Cooper, J.W. Spectral distribution of atomic oscillator strengths. Rev. Mod. Phys. 1968. [Google Scholar] [CrossRef]
  30. Cheng, K.T.; Fischer, C.F. Collapse of the 4f orbital for Xe-like ions. Phys. Rev. A 1983. [Google Scholar] [CrossRef]
  31. Band, I.M.; Trzhaskovskaya, M.B. On the 5d photoabsorption spectra in the gaseous and metallic states of uranium and thorium. J. Phys. B At. Mol. Opt. Phys. 1992. [Google Scholar] [CrossRef]
  32. Carroll, P.K.; Costello, J.T. Giant-dipole-resonance absorption in atomic thorium by a novel two-laser technique. Phys Rev. Lett. 1986. [Google Scholar] [CrossRef] [PubMed]
  33. Carroll, P.K.; Costello, J.T. The XUV photoabsorption spectrum of uranium vapor. J. Phys. B At. Mol. Opt. Phys. 1987. [Google Scholar] [CrossRef]
  34. Carroll, P.K.; Costello, J.T.; Kennedy, E.T.; O’Sullivan, G. XUV emission from uranium plasmas: The identification of U XIII and U XV. J. Phys. B At. Mol. Opt. Phys. 1984. [Google Scholar] [CrossRef]
  35. Carroll, P.K.; Costello, J.T.; Kennedy, E.T.; O’Sullivan, G. XUV emission from thorium plasmas; the identification of Th XI and Th XIII. J. Phys. B At. Mol. Opt. Phys. 1986, 19, L651. [Google Scholar] [CrossRef]
  36. Carroll, P.K.; O’Sullivan, G. The observation of 5d-5f resonant emission in thorium in high ion stages (≈VIII to XVI). Phys. Lett. A. 1981. [Google Scholar] [CrossRef]
  37. Finkenthal, M.; Lippmann, S.; Moos, H.W.; Mandelbaum, P.; The TEXT Group. Highly ionized uranium emission in the soft-X-ray region 50–100 Å. Phys. Rev. A 1989. [Google Scholar] [CrossRef]
  38. Hayden, P.; Cummings, A.; Murphy, N.; O’Sullivan, G.; Sheridan, P.; White, J.; Dunne, P. 13.5 nm extreme ultraviolet emission from tin based laser produced plasma sources. J. Appl. Phys. 2006. [Google Scholar] [CrossRef]
Figure 1. (Color online) Ir-like through Tm-like spectra of Au-Po calculated with the Cowan Code both including Configuration interaction (CI) (green denotes 5p5d and blue denotes 5d5f) and excluding CI (red denotes 5p5d and black denotes 5d5f).
Atoms 05 00020 g001
Figure 2. (Color online) Ir-like through Tm-like spectra of At-U calculated with the Cowan Code both including CI (green denotes 5p5d and blue denotes 5d5f) and excluding CI (red denotes 5p5d and black denotes 5d5f).
Atoms 05 00020 g002
Figure 3. (Color online) mean radii of 5p, 5d, and 5f eigenfunctions for ions of the Ir (ground state 5d9) through Tm (ground configuration 5d1) for all elements from Au-U.
Atoms 05 00020 g003
Figure 4. (Color online) Mean wavelength of transition arrays 5p65dN+15p55dN+2 and of 5p65dN+15p65dN5f1 Ir-like through Tm-like ions of gold through uranium (a) 5p65dN+15p55dN+2 including CI (red) and excluding CI (black); (b) 5p65dN+15p65dN5f1 including CI (orange) and excluding CI (green).
Atoms 05 00020 g004
Figure 5. (Color online) Gaussian convolved spectra of 4p64d24p54d3+4p64d14f1 transitions in Sr-like Ag9+, Sn12+, Ba18+, and Nd22+ and 5p65d25p55d3+5p65d15f1 transitions in the homologous ions Au9+, Pb12+, Ra18+, and U22+ of the Yb-isoelectronic sequence.
Atoms 05 00020 g005
Figure 6. (Color online) Summed peak emission from (a) 5d5f and (b) 5p5d UTAs including CI in elements with Z = 7992. (c) Dependence of UTA transition energies on atomic number Z, 5d5f (red stars) and 5p5d (black diamonds).
Atoms 05 00020 g006
Table 1. Calculated mean wavelength λ ¯ g A (nm) and spectral width Δ λ g A (nm) for the UTA of gold through astatine ions: Ir-like to Tm-like ions for the 5d5f arrays without and with the effect of configuration interaction.
5d5f (No CI)AuHgTlPbBiPoAt
Ion λ ¯ g A Δ λ g A λ ¯ g A Δ λ g A λ ¯ g A Δ λ g A λ ¯ g A Δ λ g A λ ¯ g A Δ λ g A λ ¯ g A Δ λ g A λ ¯ g A Δ λ g A
Ir-like48.625.9934.333.1126.401.9721.591.4718.451.2316.231.0814.590.98
Os-like36.543.8328.092.3922.961.8019.581.5117.211.3415.441.2214.061.13
Re-like29.992.7724.482.0920.841.7718.271.5716.361.4314.871.3213.671.24
W-like26.172.3522.231.9819.451.7617.371.6115.751.4814.461.3813.381.30
Ta-like23.772.1620.741.9118.481.7416.721.6015.311.4914.151.4013.181.32
Hf-like22.172.0019.701.8217.791.6716.251.5514.991.4513.941.3713.041.29
Lu-like21.051.8018.961.6517.291.5315.911.4314.771.3513.791.2812.941.21
Yb-like20.251.4818.421.3716.921.2915.671.2114.611.1513.691.1012.901.05
Tm-like19.670.8718.030.8316.670.8015.510.7814.520.7613.650.7512.890.74
5d5f (CI)AuHgTlPbBiPoAt
Ion λ ¯ g A Δ λ g A λ ¯ g A Δ λ g A λ ¯ g A Δ λ g A λ ¯ g A Δ λ g A λ ¯ g A Δ λ g A λ ¯ g A Δ λ g A λ ¯ g A Δ λ g A
Ir-like48.646.0034.363.1626.432.1021.601.6918.431.4516.191.2514.531.10
Os-like36.623.9028.172.6023.022.1719.582.0017.091.9015.241.5613.851.30
Re-like30.152.9924.632.6920.862.6618.162.5116.132.0714.551.6113.361.36
W-like26.482.8922.473.1819.433.0517.122.5815.332.0314.001.5912.981.37
Ta-like24.343.1521.213.4618.243.0016.182.3514.751.8513.621.5512.701.39
Hf-like22.793.2919.363.6017.192.6415.462.0314.261.6813.331.5012.541.43
Lu-like21.013.2418.252.8816.352.0815.021.7314.061.6113.201.5112.471.43
Yb-like19.372.3417.601.7916.251.4214.921.7014.061.5313.181.3712.511.37
Tm-like20.190.1617.560.1215.991.0514.981.0014.090.9713.290.9412.580.92
Table 2. Calculated mean wavelength λ ¯ g A (nm) and spectral width Δ λ g A (nm) for the UTA of radon through uranium ions: Ir-like to Tm-like ions for the 5d5f arrays without and with the effect of configuration interaction.
5d−5f (No CI)RnFrRaAcThPaU
Ion λ ¯ g A Δ λ g A λ ¯ g A Δ λ g A λ ¯ g A Δ λ g A λ ¯ g A Δ λ g A λ ¯ g A Δ λ g A λ ¯ g A Δ λ g A λ ¯ g A Δ λ g A
Ir-like13.320.9112.280.8511.430.8010.710.7710.090.739.540.719.060.68
Os-like12.951.0612.031.0011.250.9510.590.9010.010.869.490.839.030.80
Re-like12.681.1611.841.1011.131.0410.501.009.950.959.460.929.030.88
W-like12.481.2211.711.1611.041.1010.451.059.931.019.460.979.030.94
Ta-like12.351.2511.621.1810.991.1310.431.089.921.049.471.009.060.97
Hf-like12.251.2311.571.1710.971.1210.431.089.941.049.501.009.100.97
Lu-like12.201.1611.551.1110.971.0710.451.039.981.009.550.979.160.94
Yb-like12.191.0111.560.9811.000.9510.500.9210.030.909.610.889.230.86
Tm-like12.210.7311.610.7211.060.7210.560.7110.110.719.700.719.320.71
5d−5f (CI)RnFrRaAcThPaU
Ion λ ¯ g A Δ λ g A λ ¯ g A Δ λ g A λ ¯ g A Δ λ g A λ ¯ g A Δ λ g A λ ¯ g A Δ λ g A λ ¯ g A Δ λ g A λ ¯ g A Δ λ g A
Ir-like13.220.9912.160.8411.330.7710.630.7110.020.689.480.659.010.63
Os-like12.781.1111.840.9811.080.9010.440.839.870.799.380.778.930.74
Re-like12.391.1911.581.0610.900.9910.300.949.780.909.310.878.890.85
W-like12.111.2211.391.1510.771.0910.211.059.721.019.270.988.870.96
Ta-like11.931.2911.281.2410.691.1910.171.149.701.119.271.018.881.05
Hf-like11.841.3611.231.3010.681.2710.181.239.721.189.311.158.931.12
Lu-like11.811.3811.231.3210.721.2910.241.269.781.229.381.189.001.14
Yb-like11.861.2711.281.2210.771.1710.281.129.831.089.431.069.061.04
Tm-like11.930.9011.340.8910.810.8710.330.869.880.859.480.849.110.83

