Plasma Expansion Dynamics in Hydrogen Gas


Abstract
1. Introduction
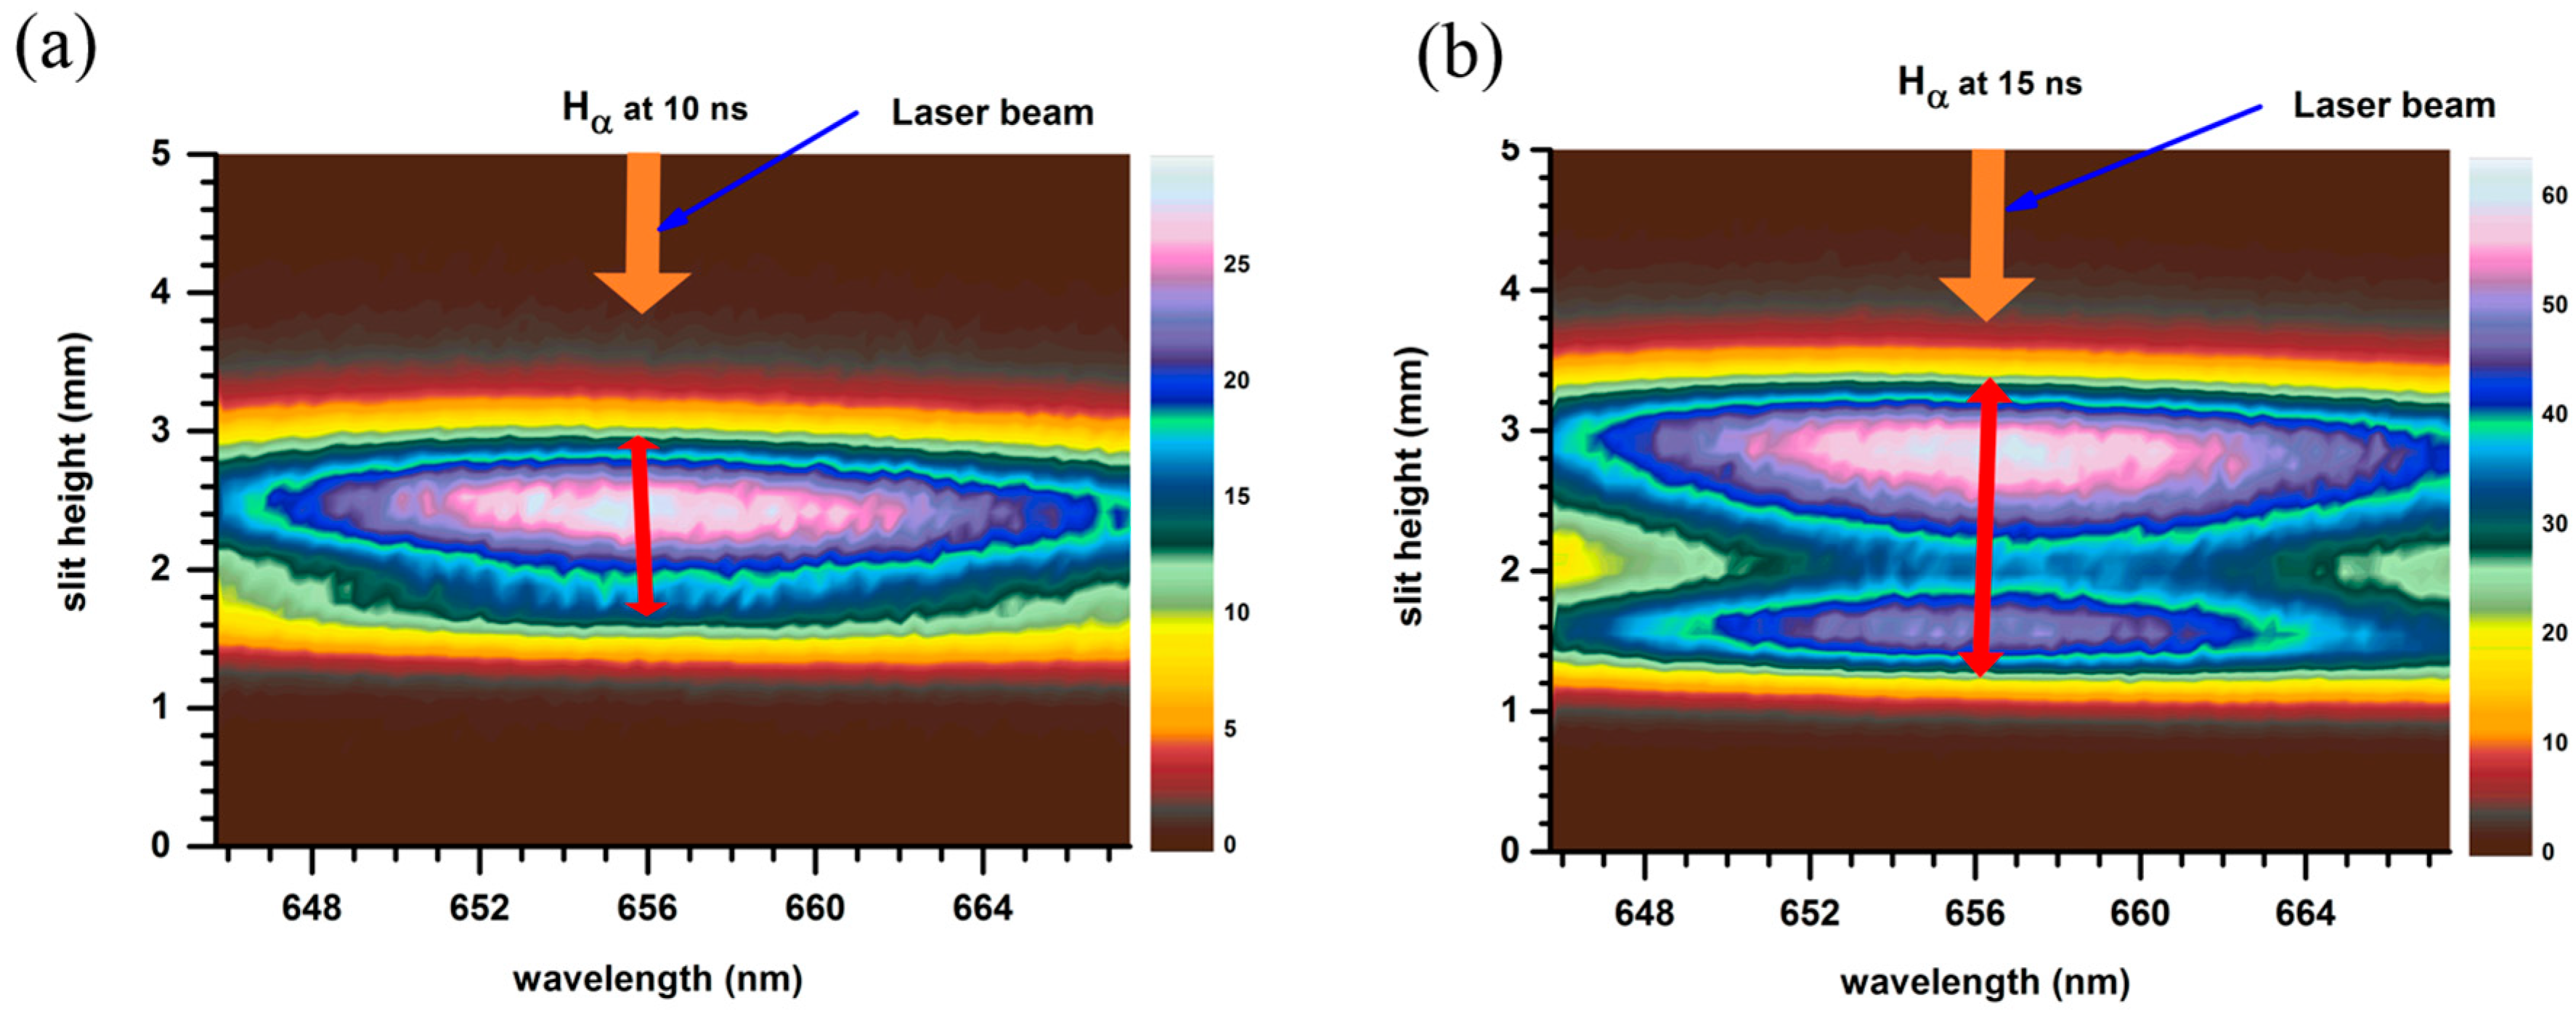
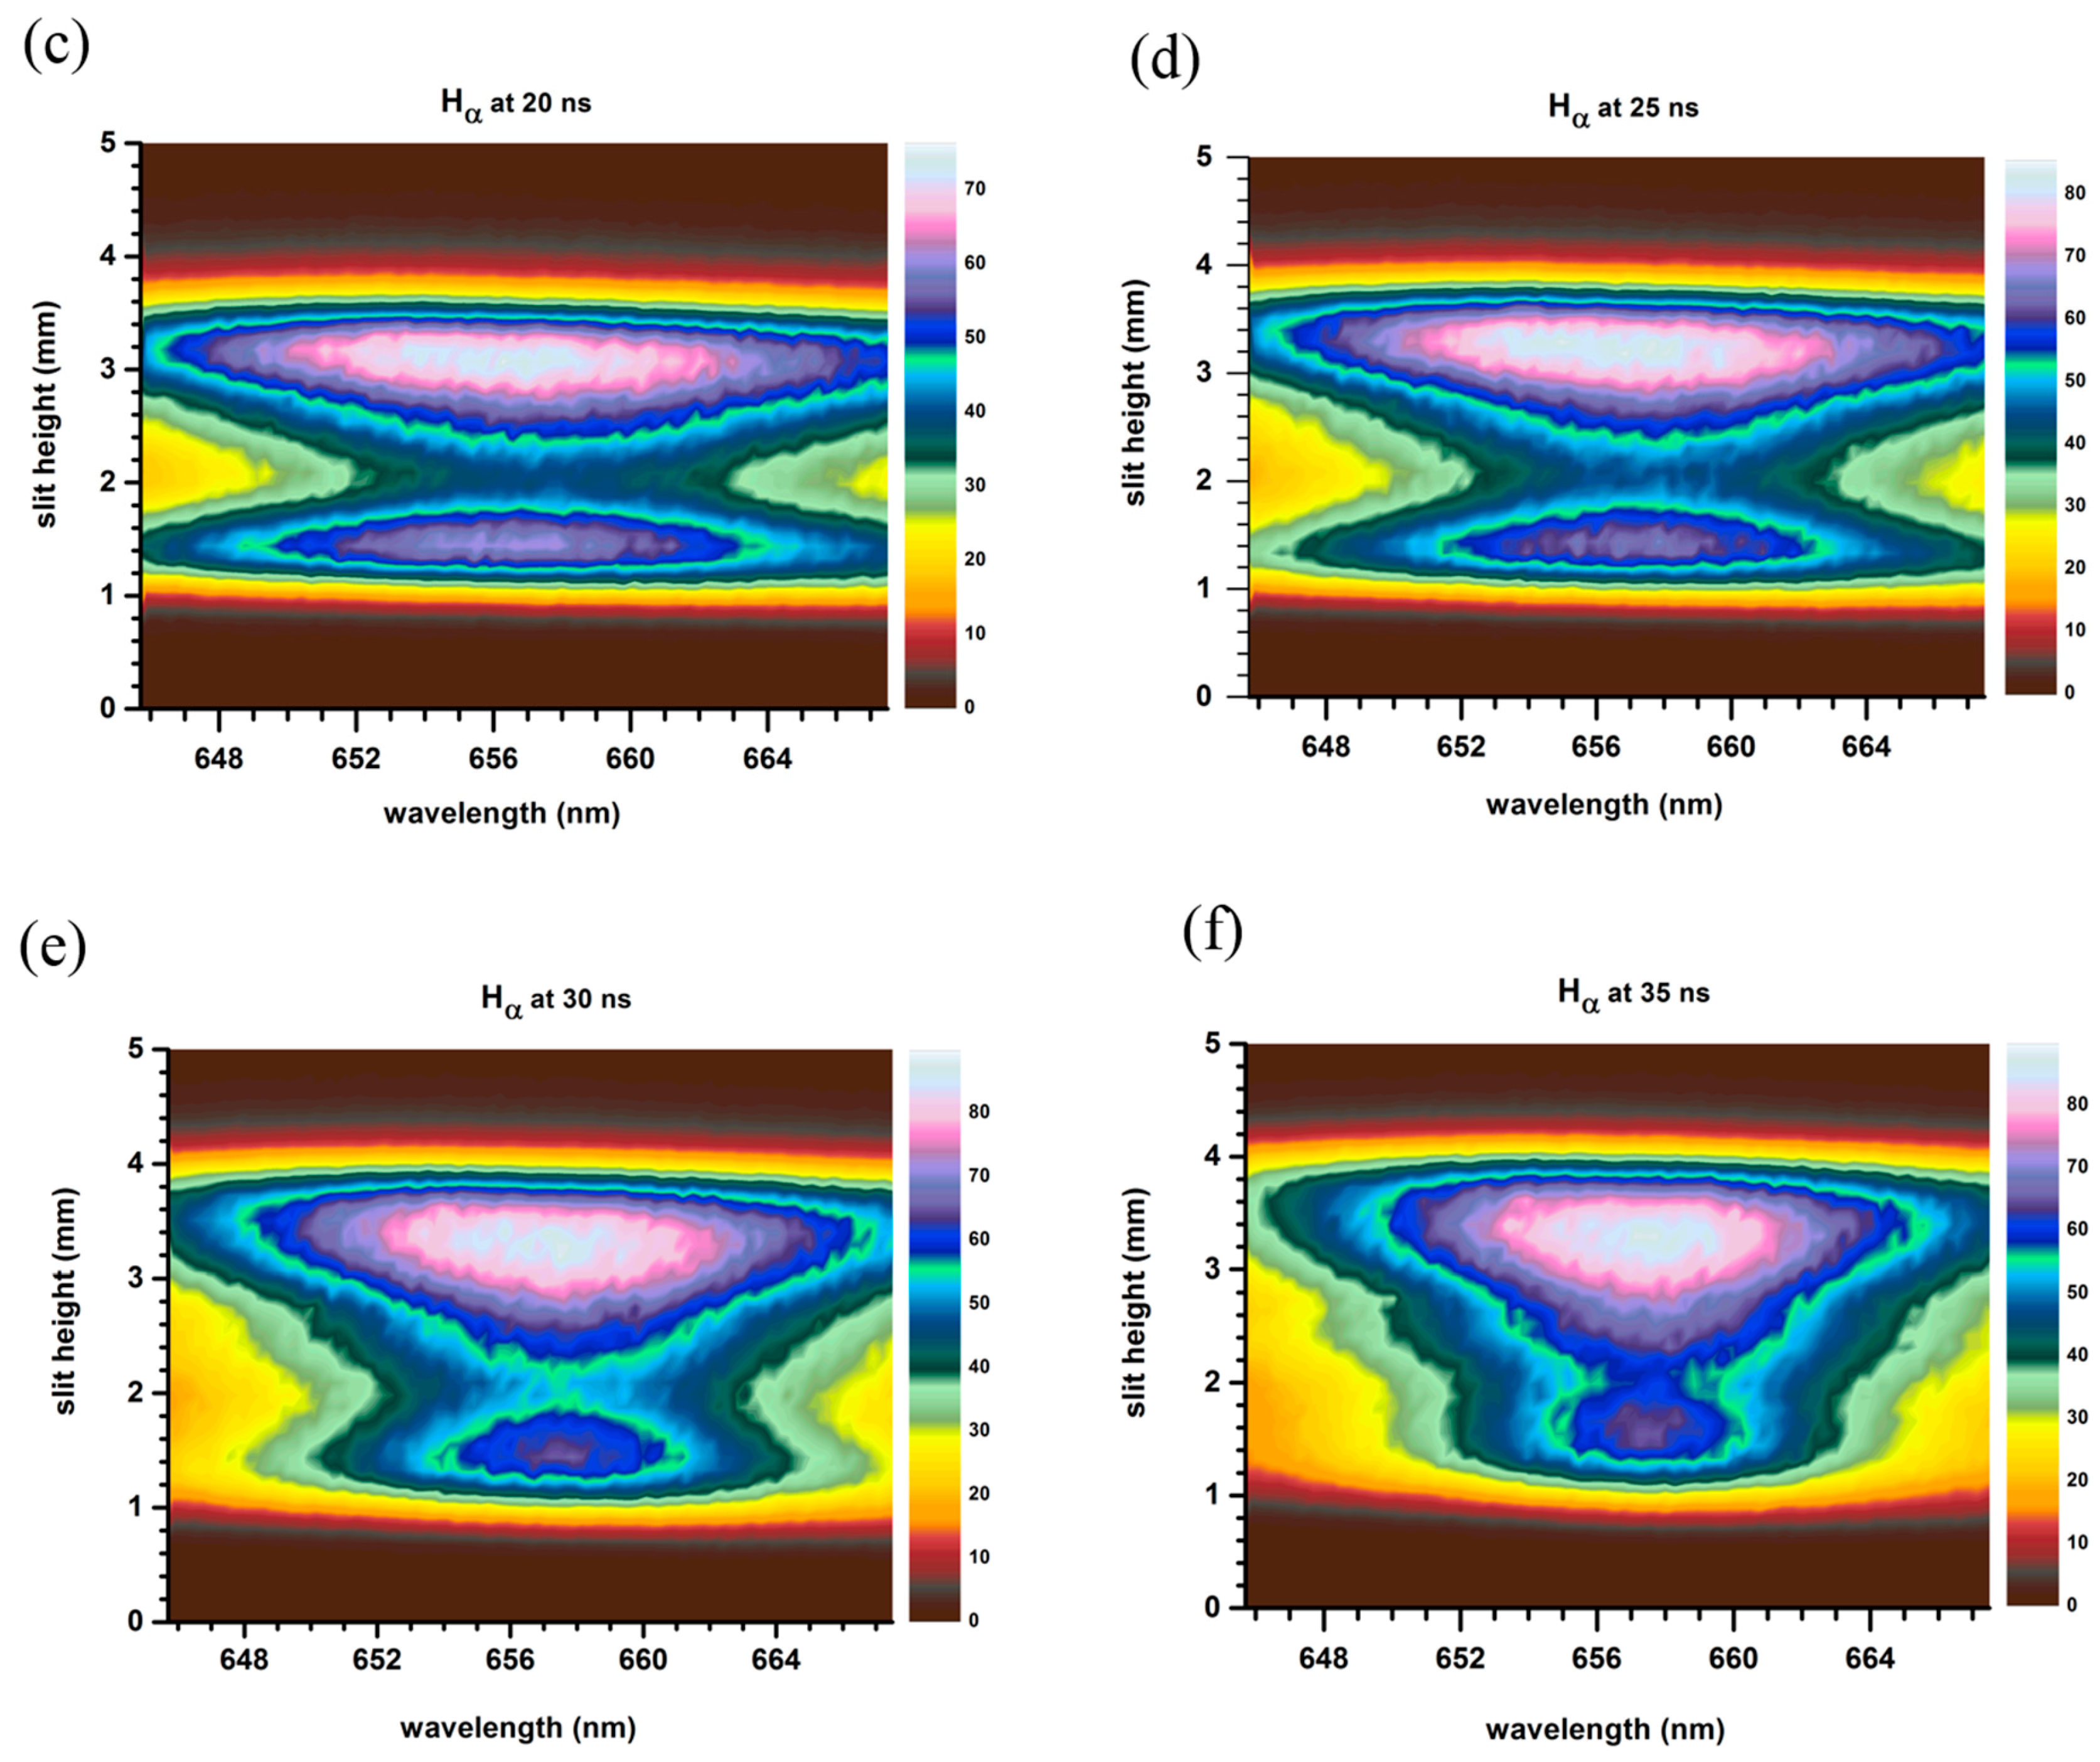
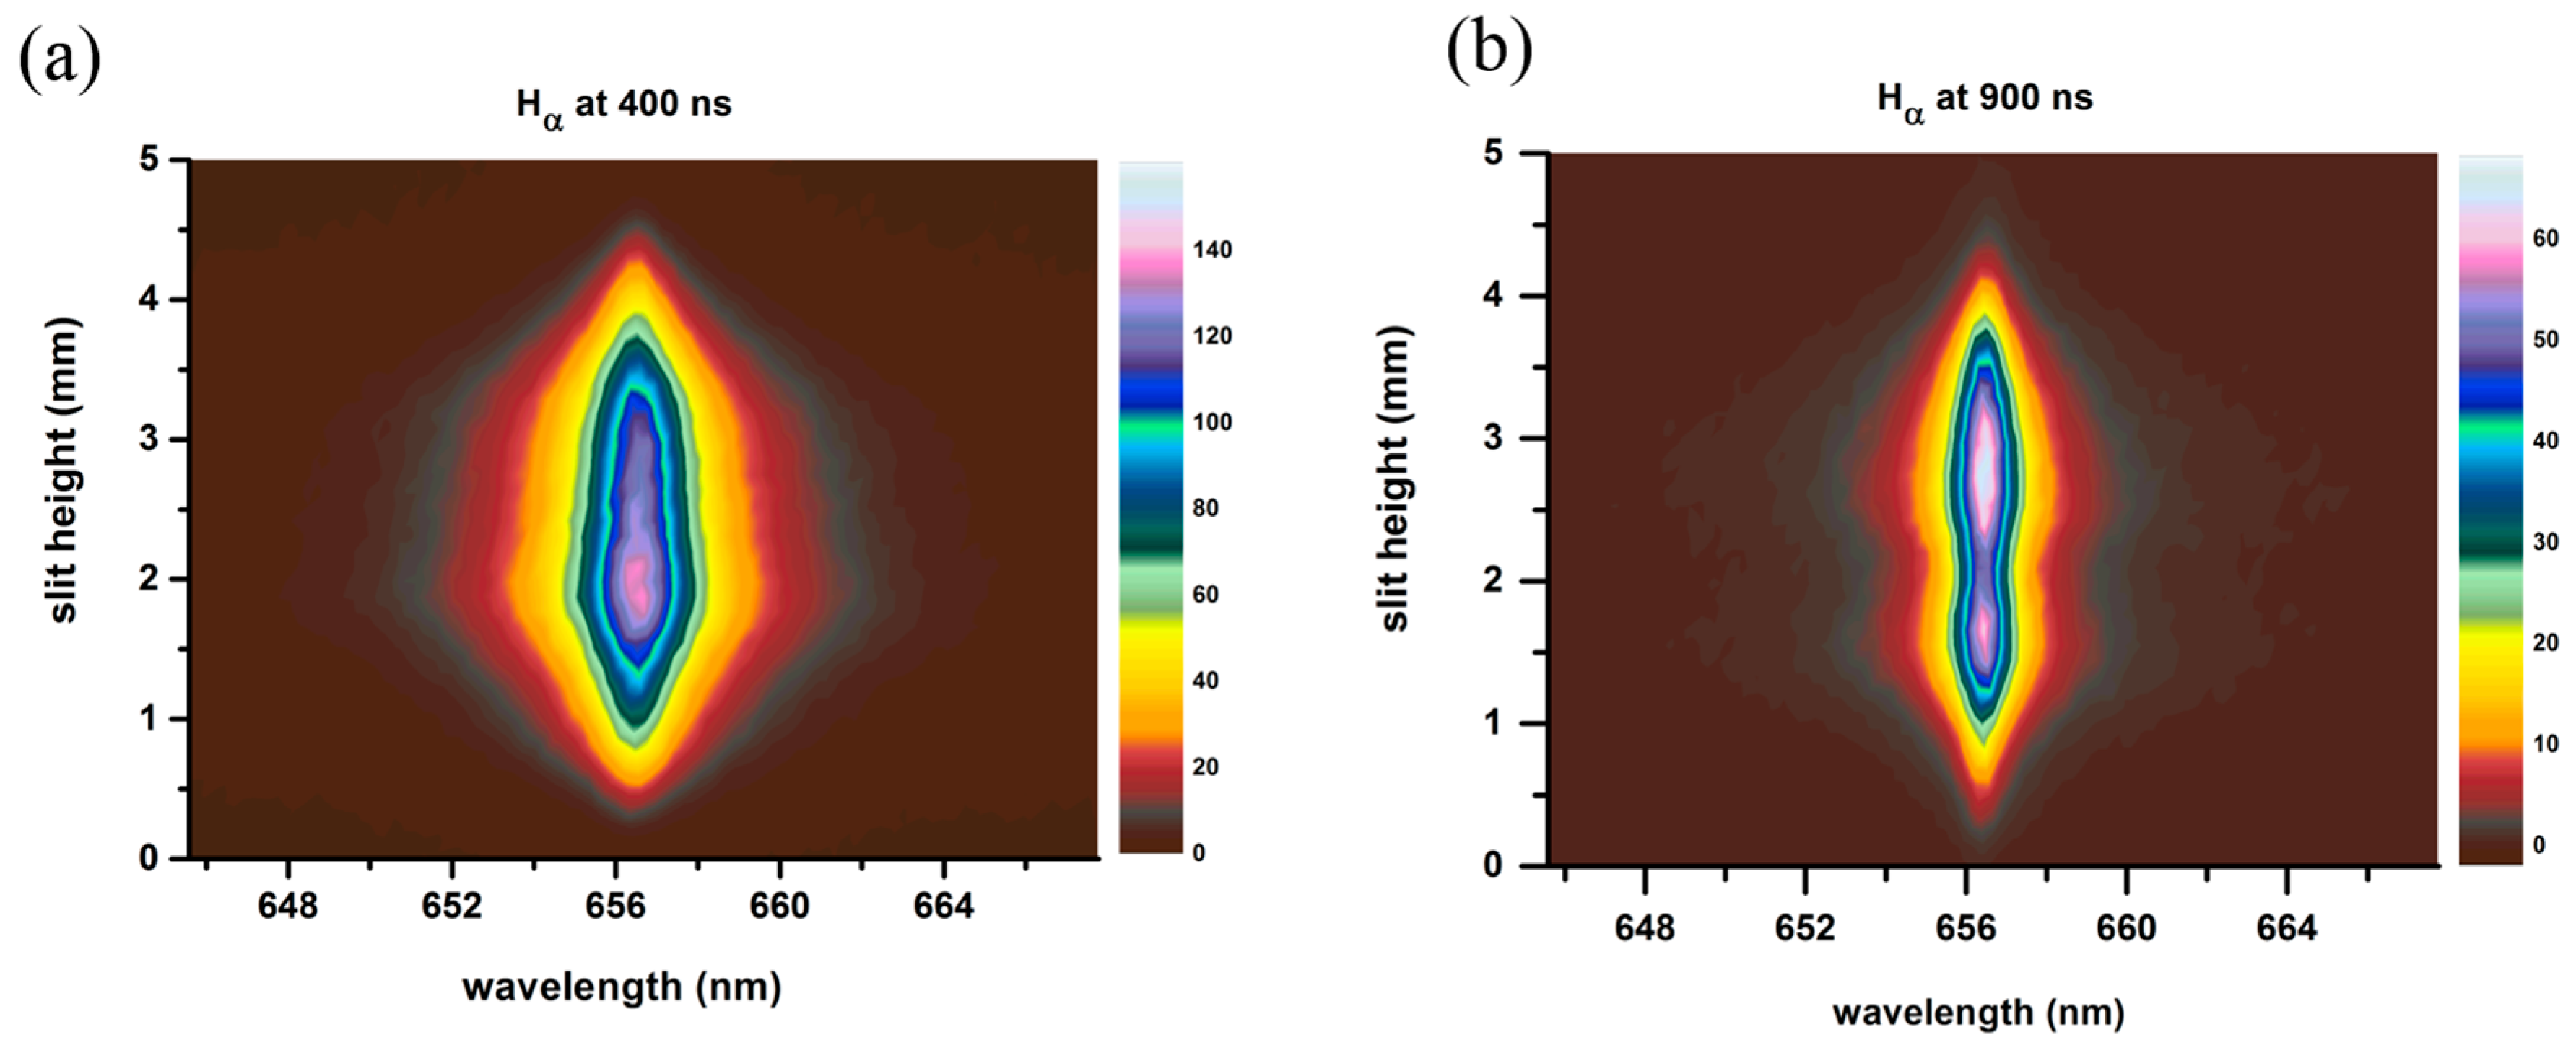
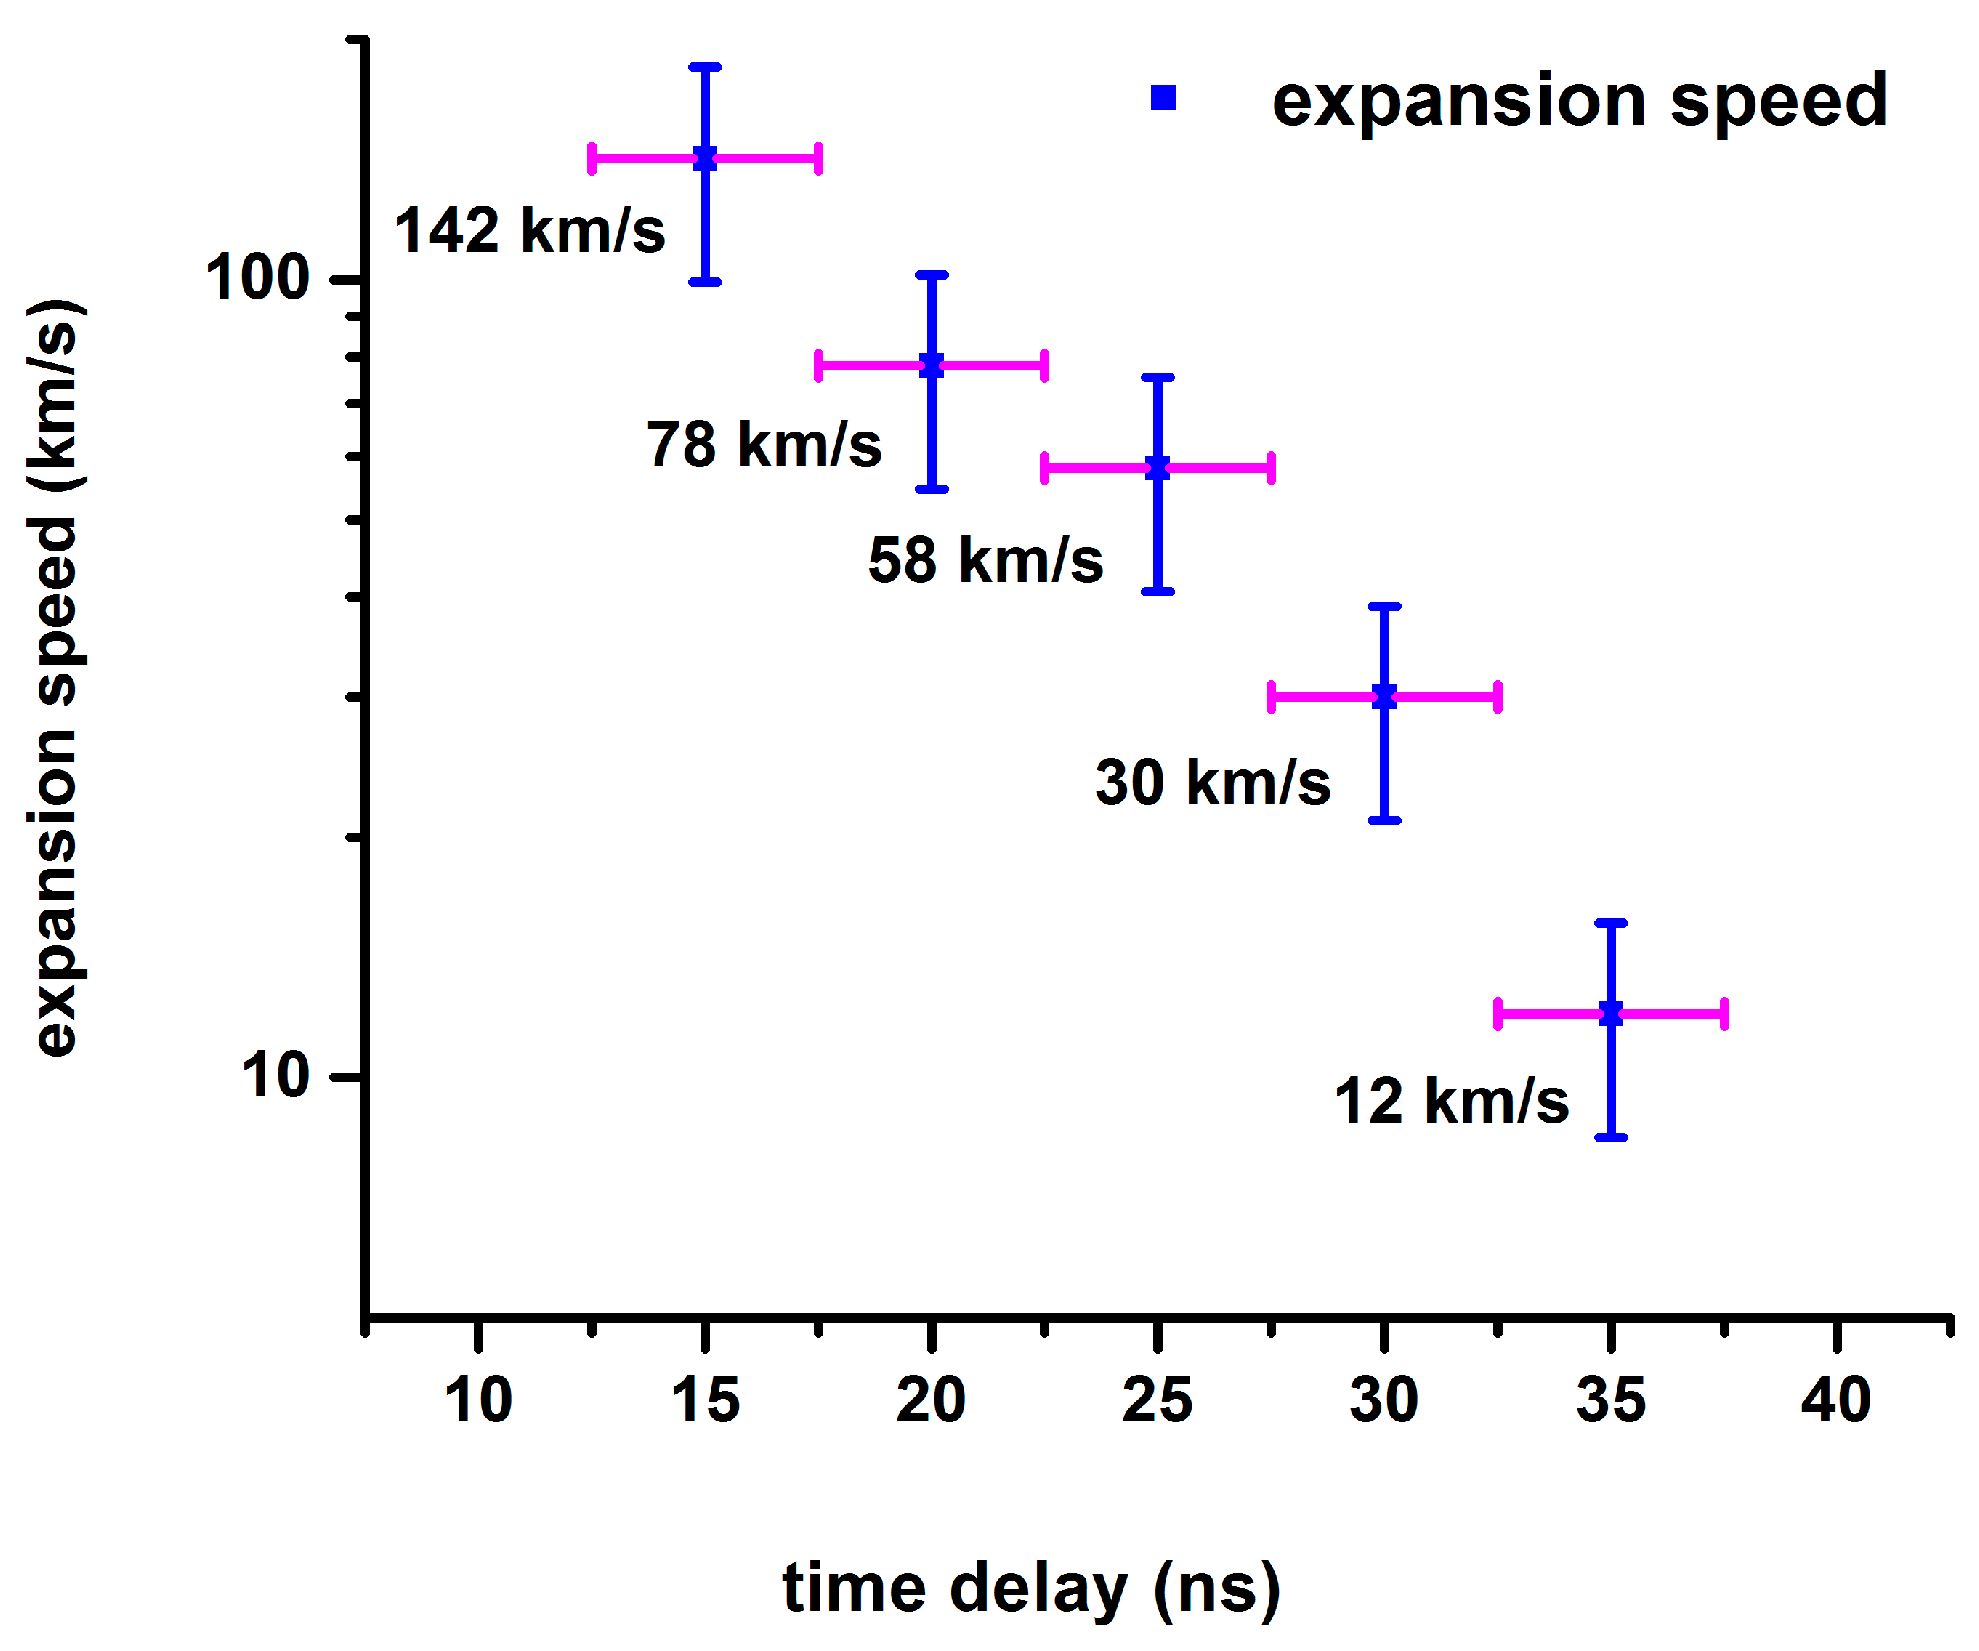
2. Results
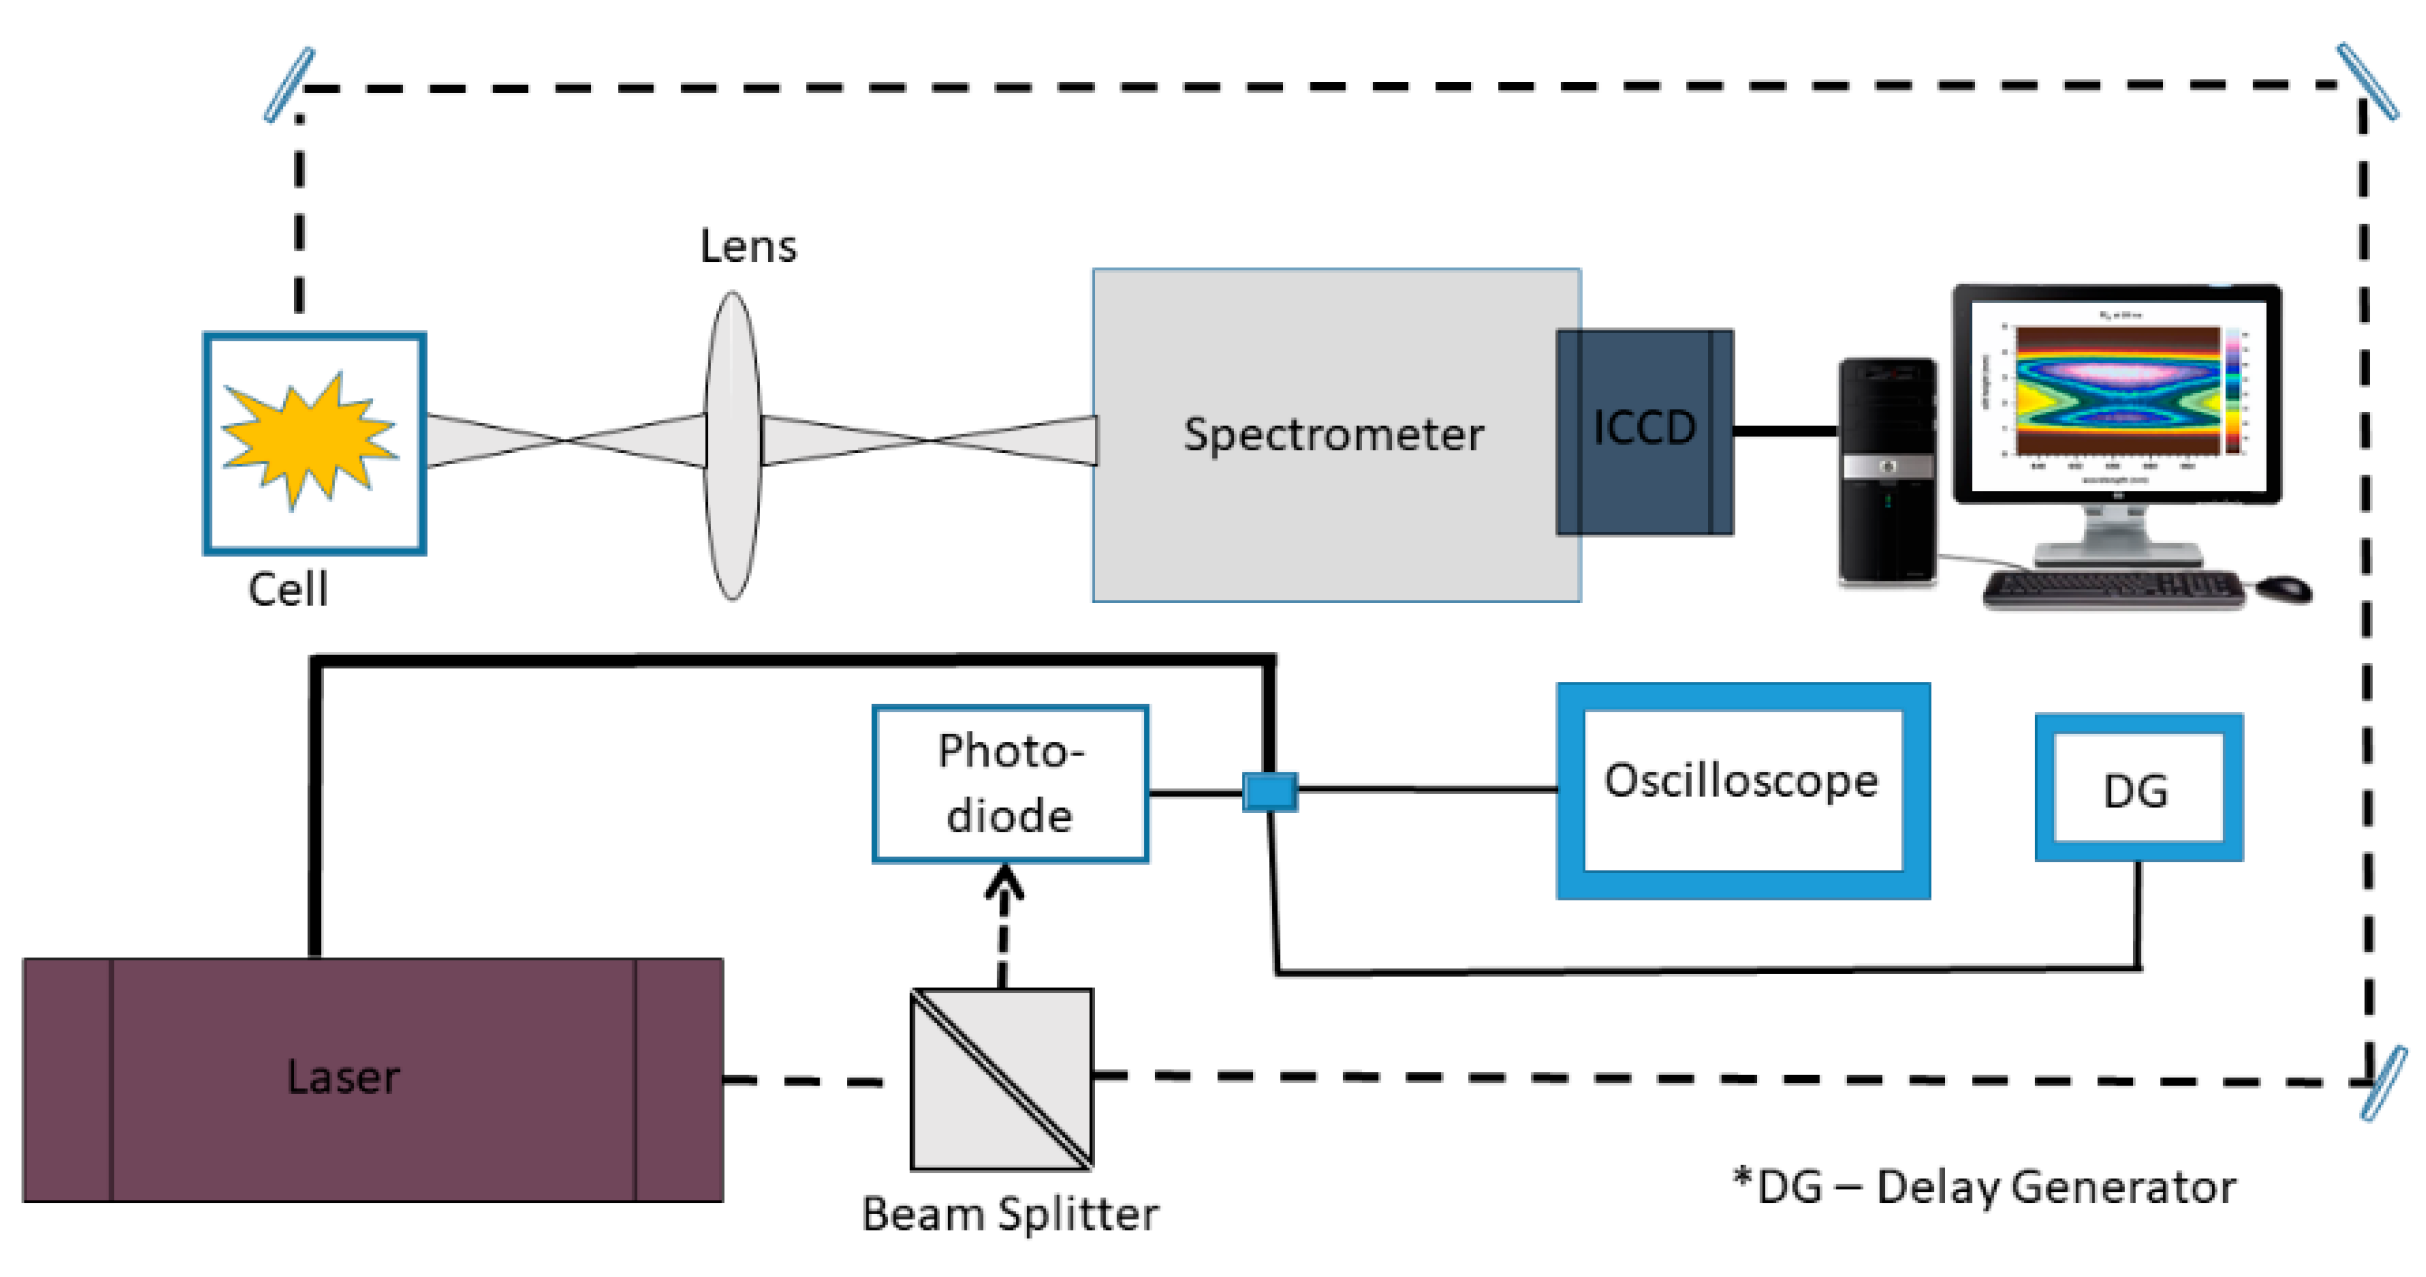
3. Materials and Methods
4. Conclusions
Author Contributions
Funding
Conflicts of Interest
References
- Anabitarte, F.; Cobo, A.; Lopez-Higuera, J.M. Laser-induced breakdown spectroscopy: Fundamentals, applications, and challenges. Int. Sch. Res. Notices Spectrosc. 2012, 2012, 285240. [Google Scholar] [CrossRef]
- Falcon, R.E.; Rochau, G.A.; Bailey, J.E.; Ellis, J.L.; Carlson, A.L.; Gomez, T.A.; Montgomery, M.H.; Winget, D.E.; Chen, E.Y.; Gomez, M.R.; et al. An experimental platform for creating white dwarf photospheres in the laboratory. High Energy Density Phys. 2013, 9, 82–90. [Google Scholar] [CrossRef]
- Falcon, R.E.; Rochau, G.A.; Bailey, J.E.; Gomez, T.A.; Montgomery, M.H.; Winget, D.E.; Nagayama, T. Laboratory measurements of white dwarf photospheric spectral lines: Hβ. Astrophys. J. 2015, 806, 214. [Google Scholar] [CrossRef]
- Parigger, C.G.; Drake, K.A.; Helstern, C.M.; Gautam, G. Laboratory hydrogen-beta emission spectroscopy for analysis of astrophysical white dwarf spectra. Atoms 2018, 6, 36. [Google Scholar] [CrossRef]
- Engeln, R.; Mazouffre, S.; Vankan, P.; Bakker, I.; Schram, D.C. Plasma expansion: fundamentals and applications. Plasma Sources Sci. Technol. 2002, 11, A100. [Google Scholar] [CrossRef]
- Chen, Y.L.; Lewis, J.W.L.; Parigger, C.G. Spatial and temporal profiles of pulsed laser-induced air plasma emissions. J. Quant. Spectrosc. Radiat. Transf. 2000, 67, 91–103. [Google Scholar] [CrossRef]
- Sakka, T.; Tamura, A.; Matsumoto, A.; Fukami, K.; Nishi, N.; Thornton, B. Effects of pulse width on nascent width on nascent laser-induced bubbles for underwater laser-induced breakdown spectroscopy. Spectrochim. Acta Part B At. Spectrosc. 2014, 97, 94–98. [Google Scholar] [CrossRef]
- Glumac, N.; Elliott, G.; Boguszko, M. Temporal and spatial evolution of a laser spark in air. Am. Inst. Aeronaut. Astronaut. J. 2005, 34, 1984–1994. [Google Scholar] [CrossRef]
- Brieschenk, S.; O’Byrne, S.; Kleine, H. Visualization of jet development in laser-induced plasmas. Opt. Lett. 2013, 38, 664–666. [Google Scholar] [CrossRef] [PubMed]
- Parigger, C.G.; Plemmons, D.H.; Lewis, J.W.L. Spatially and temporally resolved electron number density measurements in a decaying laser-induced plasma using hydrogen-alpha line profiles. Appl. Opt. 1995, 34, 3325–3330. [Google Scholar] [CrossRef] [PubMed]
- Parigger, C.G. Atomic and molecular emissions in laser-induced breakdown spectroscopy. Spectrochim. Acta Part B At. Spectrosc. 2013, 79, 4–16. [Google Scholar] [CrossRef]
- Sobral, H.; Villagrán-Muniz, M.; Navarro-González, R.; Raga, A.C. Temporal evolution of the shock wave and hot core air in laser induced plasma. Appl. Phys. Lett. 2000, 77, 3158–3160. [Google Scholar] [CrossRef]
- Parigger, C.G.; Surmick, D.M.; Gautam, G. Self-absorption characteristics of measured laser-induced plasma line shapes. J. Phys. Conf. Ser. 2017, 810, 012012. [Google Scholar] [CrossRef]
- Parigger, C.G.; Gautam, G.; Surmick, D.M. Radial electron density measurements in laser-induced plasma from Abel inverted hydrogen Balmer beta line profiles. Int. Rev. At. Mol. Phys. 2015, 6, 43–55. [Google Scholar]
- Parigger, C.G. Laser-induced breakdown in gases: Experiments and simulation. In Laser-Induced Breakdown Spectroscopy; Miziolek, A.W., Palleschi, V., Schechter, I., Eds.; Cambridge University Press: Cambridge, UK, 2006; ISBN 978-0521071000. [Google Scholar]


| Time (ns) | Diameter (mm) | Distance in 5 ns (mm) | Speed (km/s) |
|---|---|---|---|
| 10 | 1.32 | -- | -- |
| 15 | 2.03 | 0.71 | 142 |
| 20 | 2.42 | 0.39 | 78 |
| 25 | 2.71 | 0.29 | 58 |
| 30 | 2.86 | 0.15 | 30 |
| 35 | 2.92 | 0.06 | 12 |
| 400 | 0.96 | -- | -- |
| 900 | 1.81 | 0.85 * | 1.70 |
© 2018 by the authors. Licensee MDPI, Basel, Switzerland. This article is an open access article distributed under the terms and conditions of the Creative Commons Attribution (CC BY) license (http://creativecommons.org/licenses/by/4.0/).
Share and Cite
Gautam, G.; Parigger, C.G. Plasma Expansion Dynamics in Hydrogen Gas. Atoms 2018, 6, 46. https://doi.org/10.3390/atoms6030046
Gautam G, Parigger CG. Plasma Expansion Dynamics in Hydrogen Gas. Atoms. 2018; 6(3):46. https://doi.org/10.3390/atoms6030046
Chicago/Turabian StyleGautam, Ghaneshwar, and Christian G. Parigger. 2018. "Plasma Expansion Dynamics in Hydrogen Gas" Atoms 6, no. 3: 46. https://doi.org/10.3390/atoms6030046
APA StyleGautam, G., & Parigger, C. G. (2018). Plasma Expansion Dynamics in Hydrogen Gas. Atoms, 6(3), 46. https://doi.org/10.3390/atoms6030046