A New Procedure to Determine the Plasma Parameters from a Genetic Algorithm Coupled with the Spectral Line-Shape Code PPP


1
Aix Marseille Université, CNRS, PIIM UMR 7345, 13397 Marseille, France
2
Laboratoire G2Elab, CNRS, Grenoble University, 21 rue des Martyrs, 38042 Grenoble, France
*
Author to whom correspondence should be addressed.
Atoms 2018, 6(4), 55; https://doi.org/10.3390/atoms6040055
Submission received: 3 July 2018
/
Revised: 3 September 2018
/
Accepted: 20 September 2018
/
Published: 26 September 2018
(This article belongs to the Special Issue Spectral Line Shapes in Plasmas II)
Abstract
:A method of analysis of experimental spectra for obtaining the plasma parameters is presented and discussed. Based on the coupling of the spectral line-shape code PPP with the genetic algorithm PIKAIA, the proposed method is inspired by natural selection mechanisms resulting in the development of basic genetic operators. The spectra analysis is performed by fitting experimental spectra with synthetic spectral line profiles obtained by using theoretical models and a set of plasma parameters, such as its temperature and electron density. In the present paper, the diagnostic procedure based on a genetic algorithm coupled with the PPP code has been used for the analysis of both hydrogen Balmer-β and He I 492.2 nm lines in the helium plasma created by corona discharge. The broadening of these spectral lines due to the Stark effect has been considered, together with the van der Waals and instrumental broadening.
1. Introduction
Experimental spectra are usually analyzed using a spectral line-shape model, allowing the extraction of information on the emitter and its environment. In plasmas, the spectral line shapes are affected by different broadening mechanisms such as Doppler broadening due to emitter’s motion, Stark broadening due to the presence of local electric fields created by the plasma charged particles (ions and electrons) [1], and instrumental broadening introduced by measurement optical instruments. Realistic models predict the entire line profile, enabling the use of all spectroscopic information associated with the observed line. Thus, the best fit between the synthetic spectral line profiles and the experimental profiles should be achieved to obtain plasma parameters. For this purpose, in the past different diagnostic techniques based on genetic algorithms have been used for the analysis of data obtained in inertial confinement fusion (ICF) experiments [2,3] or edge plasmas in Tokamaks [4], where the conditions require accounting for Stark and/or Zeeman effects. Here, we present the method developed in the framework of the 4th SLSP code comparison workshop [5]. In this method, experimentally obtained plasma emission spectra (as an illustrative of “real-life” case), have been interpreted to compare different analytical approaches. The hydrogen Balmer-β and He I 492 nm lines were simultaneously obtained in the experimental spectra; the challenge for the SLSP participants was to find the plasma parameters (if they existed), which would result in fitting of both lines simultaneously [6,7] with synthetic spectral line profiles. A procedure based on the coupling of the spectral line-shape code PPP [8,9] with the genetic algorithm PIKAIA [10] has been developed for this purpose. The PPP code is an internationally recognized code, dedicated to calculations of spectral line profiles in plasmas. Since its introduction, this code has been successfully used and verified by other models, simulations, and experimental data [11,12], which proves its reliability and accuracy. The genetic algorithm, PIKAIA, has been chosen because it enables the use of a reliable and robust optimization technique.
In Section 2 of this paper, we present a general discussion of the genetic PIKAIA algorithm and its coupling with the line-shape code PPP; in Section 3, we present its application in the analysis of experimentally obtained spectra of corona discharges in helium [13], an illustrative “real-life” case discussed at the 4th SLSP code comparison workshop.
2. A Genetic Algorithm Coupled with a Stark Broadened Line-Shape Model
2.1. Genetic Algorithm
Genetic algorithms (GA) are optimization techniques based on an analogy with the biological processes of selection, inheritance, and variation. GAs can provide a solution in a complex search space, avoiding the problem of local minima.
Chi-square () tests are performed to assess the relevance of the obtained fits. These tests are based on the sum of differences between the experimental spectrum and the theoretical line shape . The () parameter is given by:
where N is the number of experimental points of .
Obtaining reliable plasma parameters from the fit of the synthetic line profile to the experimental line profile is an optimization problem, as should be minimized. In many cases, the line profile model depends non-linearly on different plasma parameters; thus, shows multiple minima. Finding the global minimum is a difficult task which requires a robust and efficient algorithm.
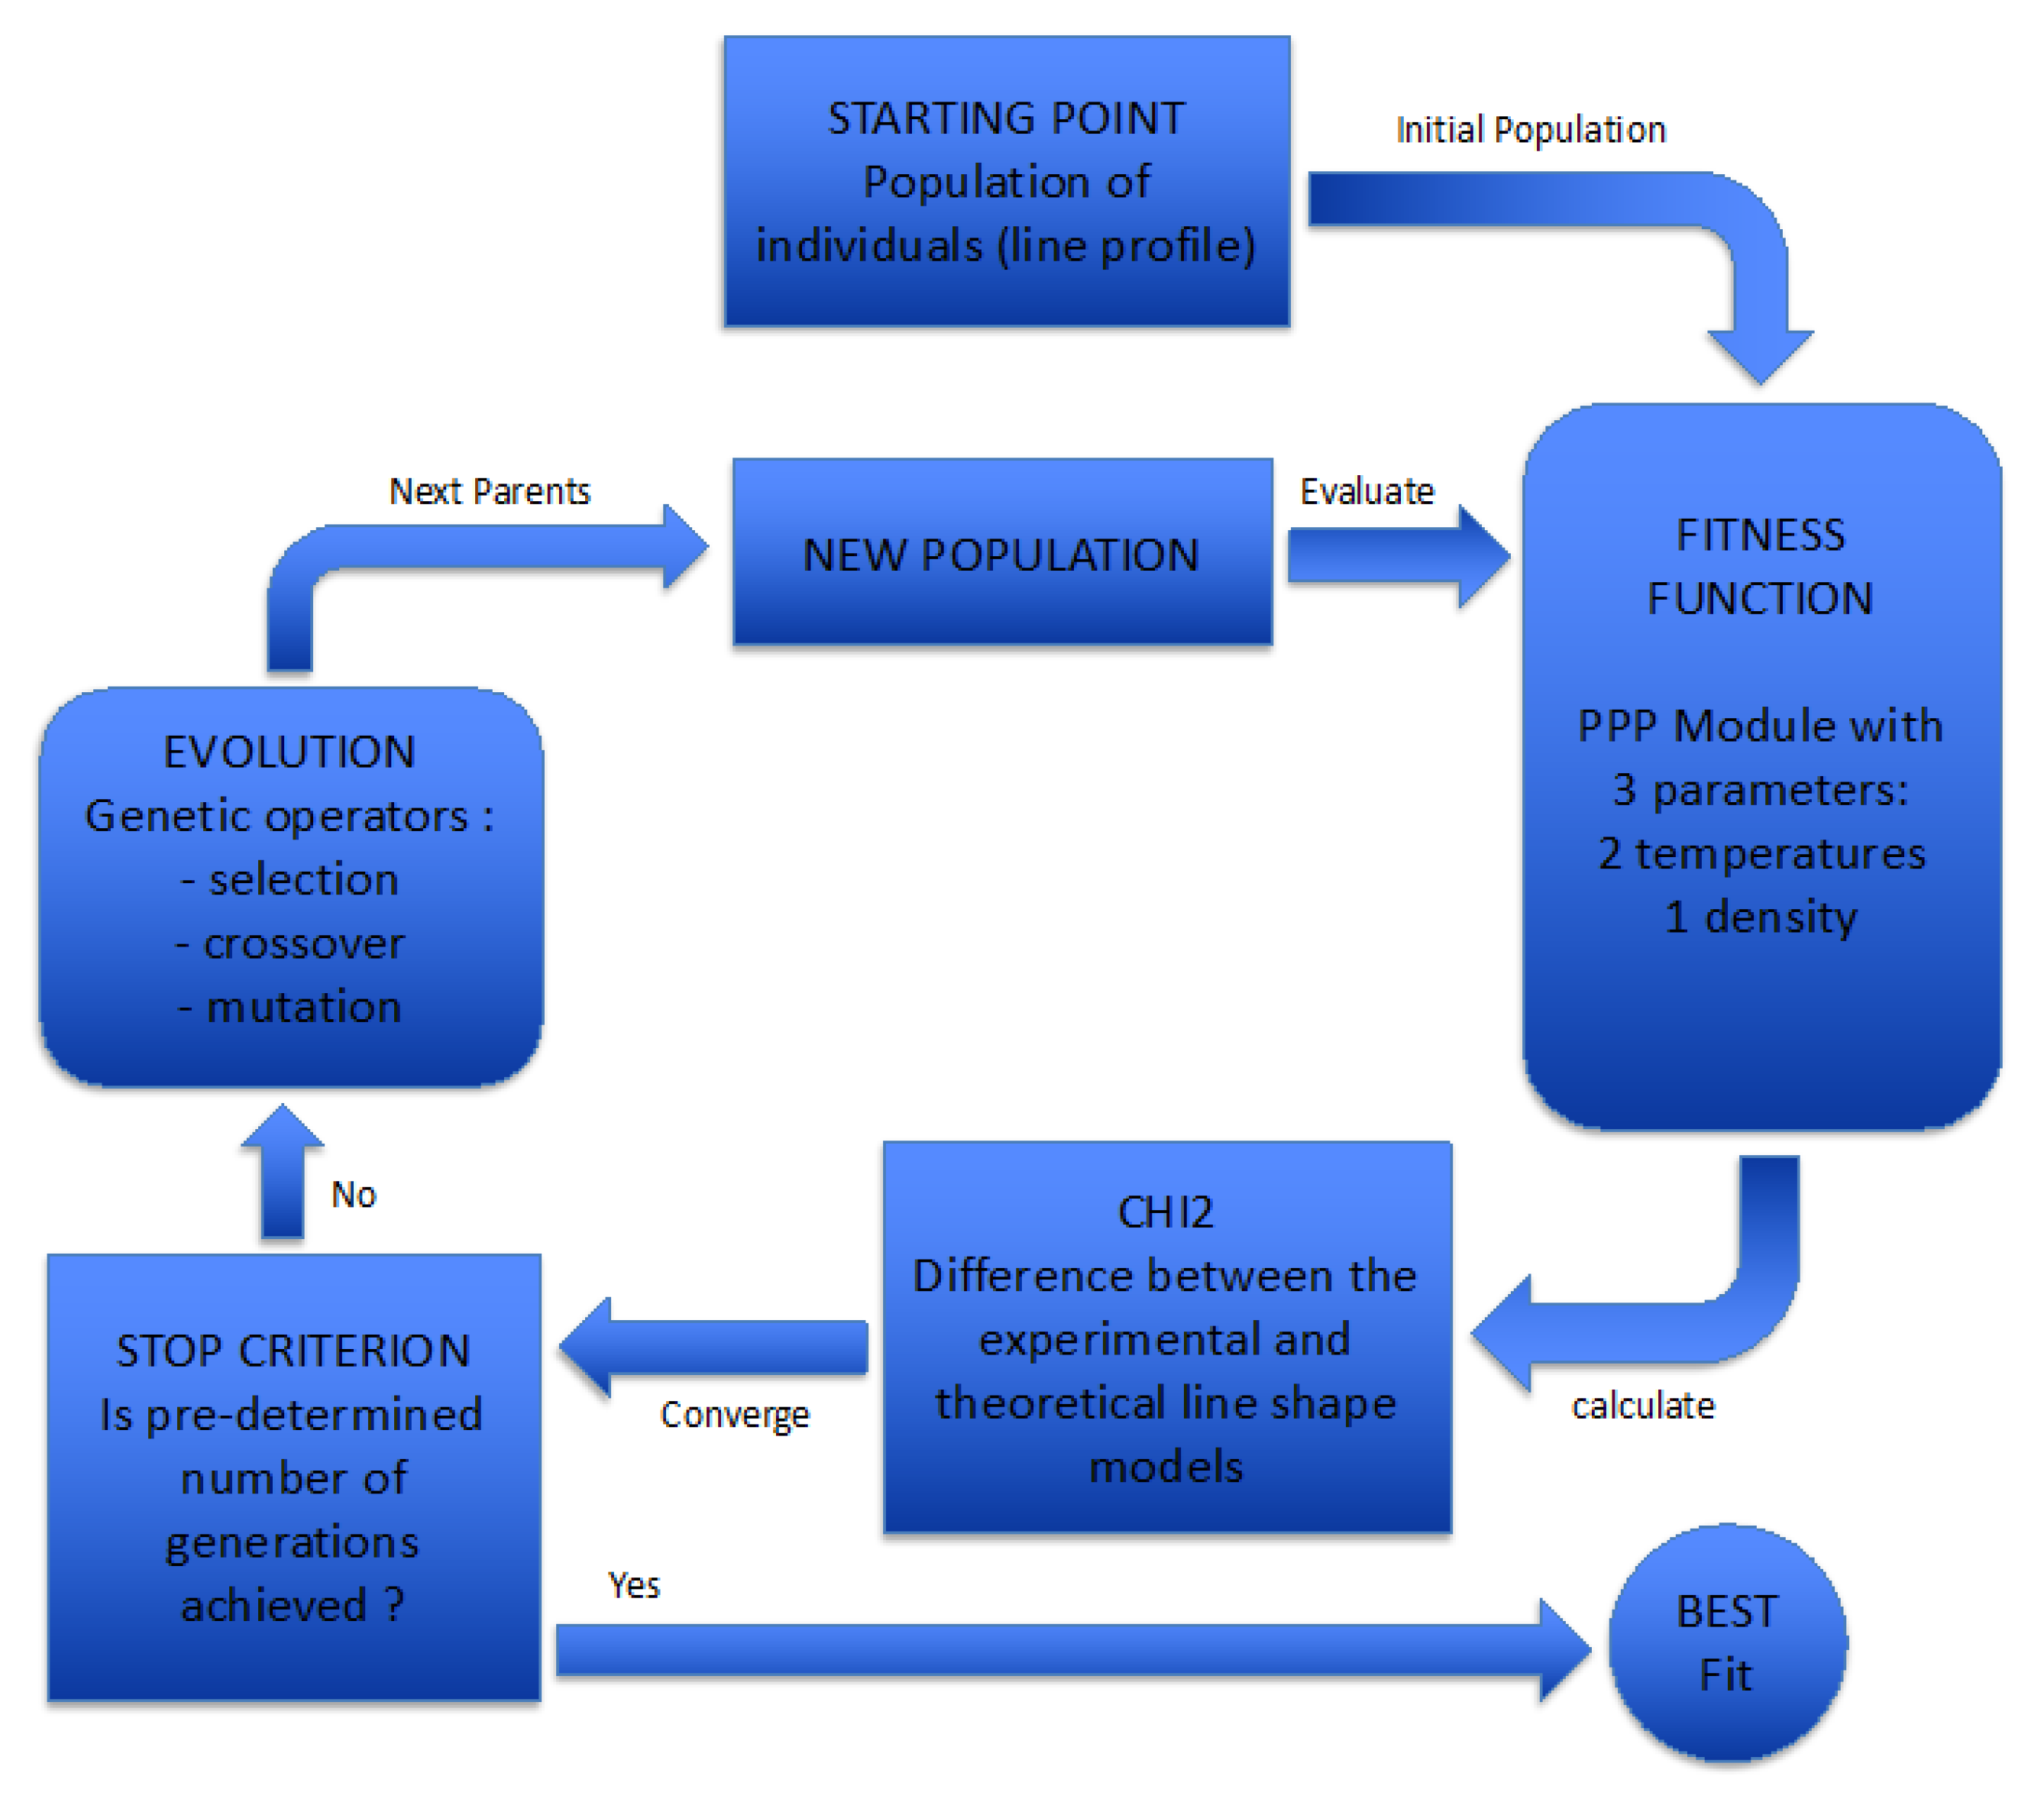
The first step in this optimization technique is encoding the model parameters in binary strings. In the language of genetic algorithms, it corresponds to a chromosome containing several genes. In the present spectroscopy problem, an initial sample of several individuals (typically 20) is considered. Each individual has a single chromosome and corresponds to a line profile; its relevance of fit is obtained by fitting the synthesized profile to the experimental data, with serving as a statistical estimator. The GA, as shown in Figure 1, modifies this initial random sample using three operators. “Selection” is a process of determination of the fittest individuals who have the highest probability to survive. The chromosomes of these fittest individuals are recombined by crossover of a part of their genes. Mutations are permitted at a very low rate and consist in random change of one bit in the binary string (gene). Although mutations generally result in less fit individuals, they occasionally produce a change that improves the sample and helps to avoid local minima. In addition, in the procedure developed in this work, as soon as each local minimum is found, the parameters are systematically perturbed to search if a deeper minimum was reached, then the procedure is repeated again until being confident in the characteristic of the minimum.
The function “Fitness” is the point of contact between the GA and the “PPP module”, adapted from the line-shape code PPP which has been designed to calculate the line shape of any emitter for any given plasma conditions.
In plasmas, spectral line shapes depend on electronic density, ionic and electronic temperatures, and chemical composition of the plasma. Moreover, in order to compare analytical results with experimental data, it is necessary either to deconvolute the experimental spectrum and to measure artifacts or to account for instrumental broadening in the synthetic profile. In this work, the PPP code coupled to GA was selected to generate synthetic line profiles which should fit the experimental data and to determine plasma parameters, including the electron density ne and the electron temperature Te. Both of these plasma parameters are related to the ionic and electronic Stark broadening models. In addition, the Lorentzian width related to van der Waals broadening of spectral lines and the Gaussian width which corresponds to instrumental broadening have been investigated. Specific hypotheses which could affect the obtained parameters have been adapted in the proposed spectral model. For instance, the plasma is considered to have uniform temperature and density for which both lines of interest are optically thin. However, there could be spatial temperature and density gradients, and the emission lines may be emitted in different physical locations for various conditions. Such variations have not been considered in the spectra modelling.
2.2. Spectral Line Shape Calculations
Theoretical profiles of the spectral lines have been performed with the PPP code, which permits rapid and accurate line-profile calculations for neutral or ionic emitters and accounts for different broadening mechanisms such as Stark, Doppler, and van der Waals. These broadening mechanisms affect the emission line profile when the emitter is embedded into a plasma. The Stark line-shape calculation is based on the separation of the plasma–emitter interaction into the homogeneous broadening effects due to electrons and inhomogeneous broadening arising from ions [8]. The usual line-shape formalism based on the Fourier transform of the dipole autocorrelation function, written in the Liouville space, uses the no-quenching approximation for the Stark effect. A non-Hermitian collision operator represents all homogeneous broadenings, i.e., electronic and natural broadening. The interference terms were also included in references [14,15]. The static Stark profile is obtained by calculating the evolution operator in the basis in which it has a diagonal form. The quasi-static ion approximation is then used to average over the micro-field distribution function obtained by the APEX method [16,17] for multi-charged ionic emitters, or over the Hooper distribution [18,19] for neutrals. The effects of ionic perturber dynamics are considered by using the fluctuation frequency model (FFM) [20]. Both the Doppler and instrumental broadening mechanisms are accounted for in the post-processing procedure via a convolution of spectral profiles with the Lorentzian or Gaussian functions.
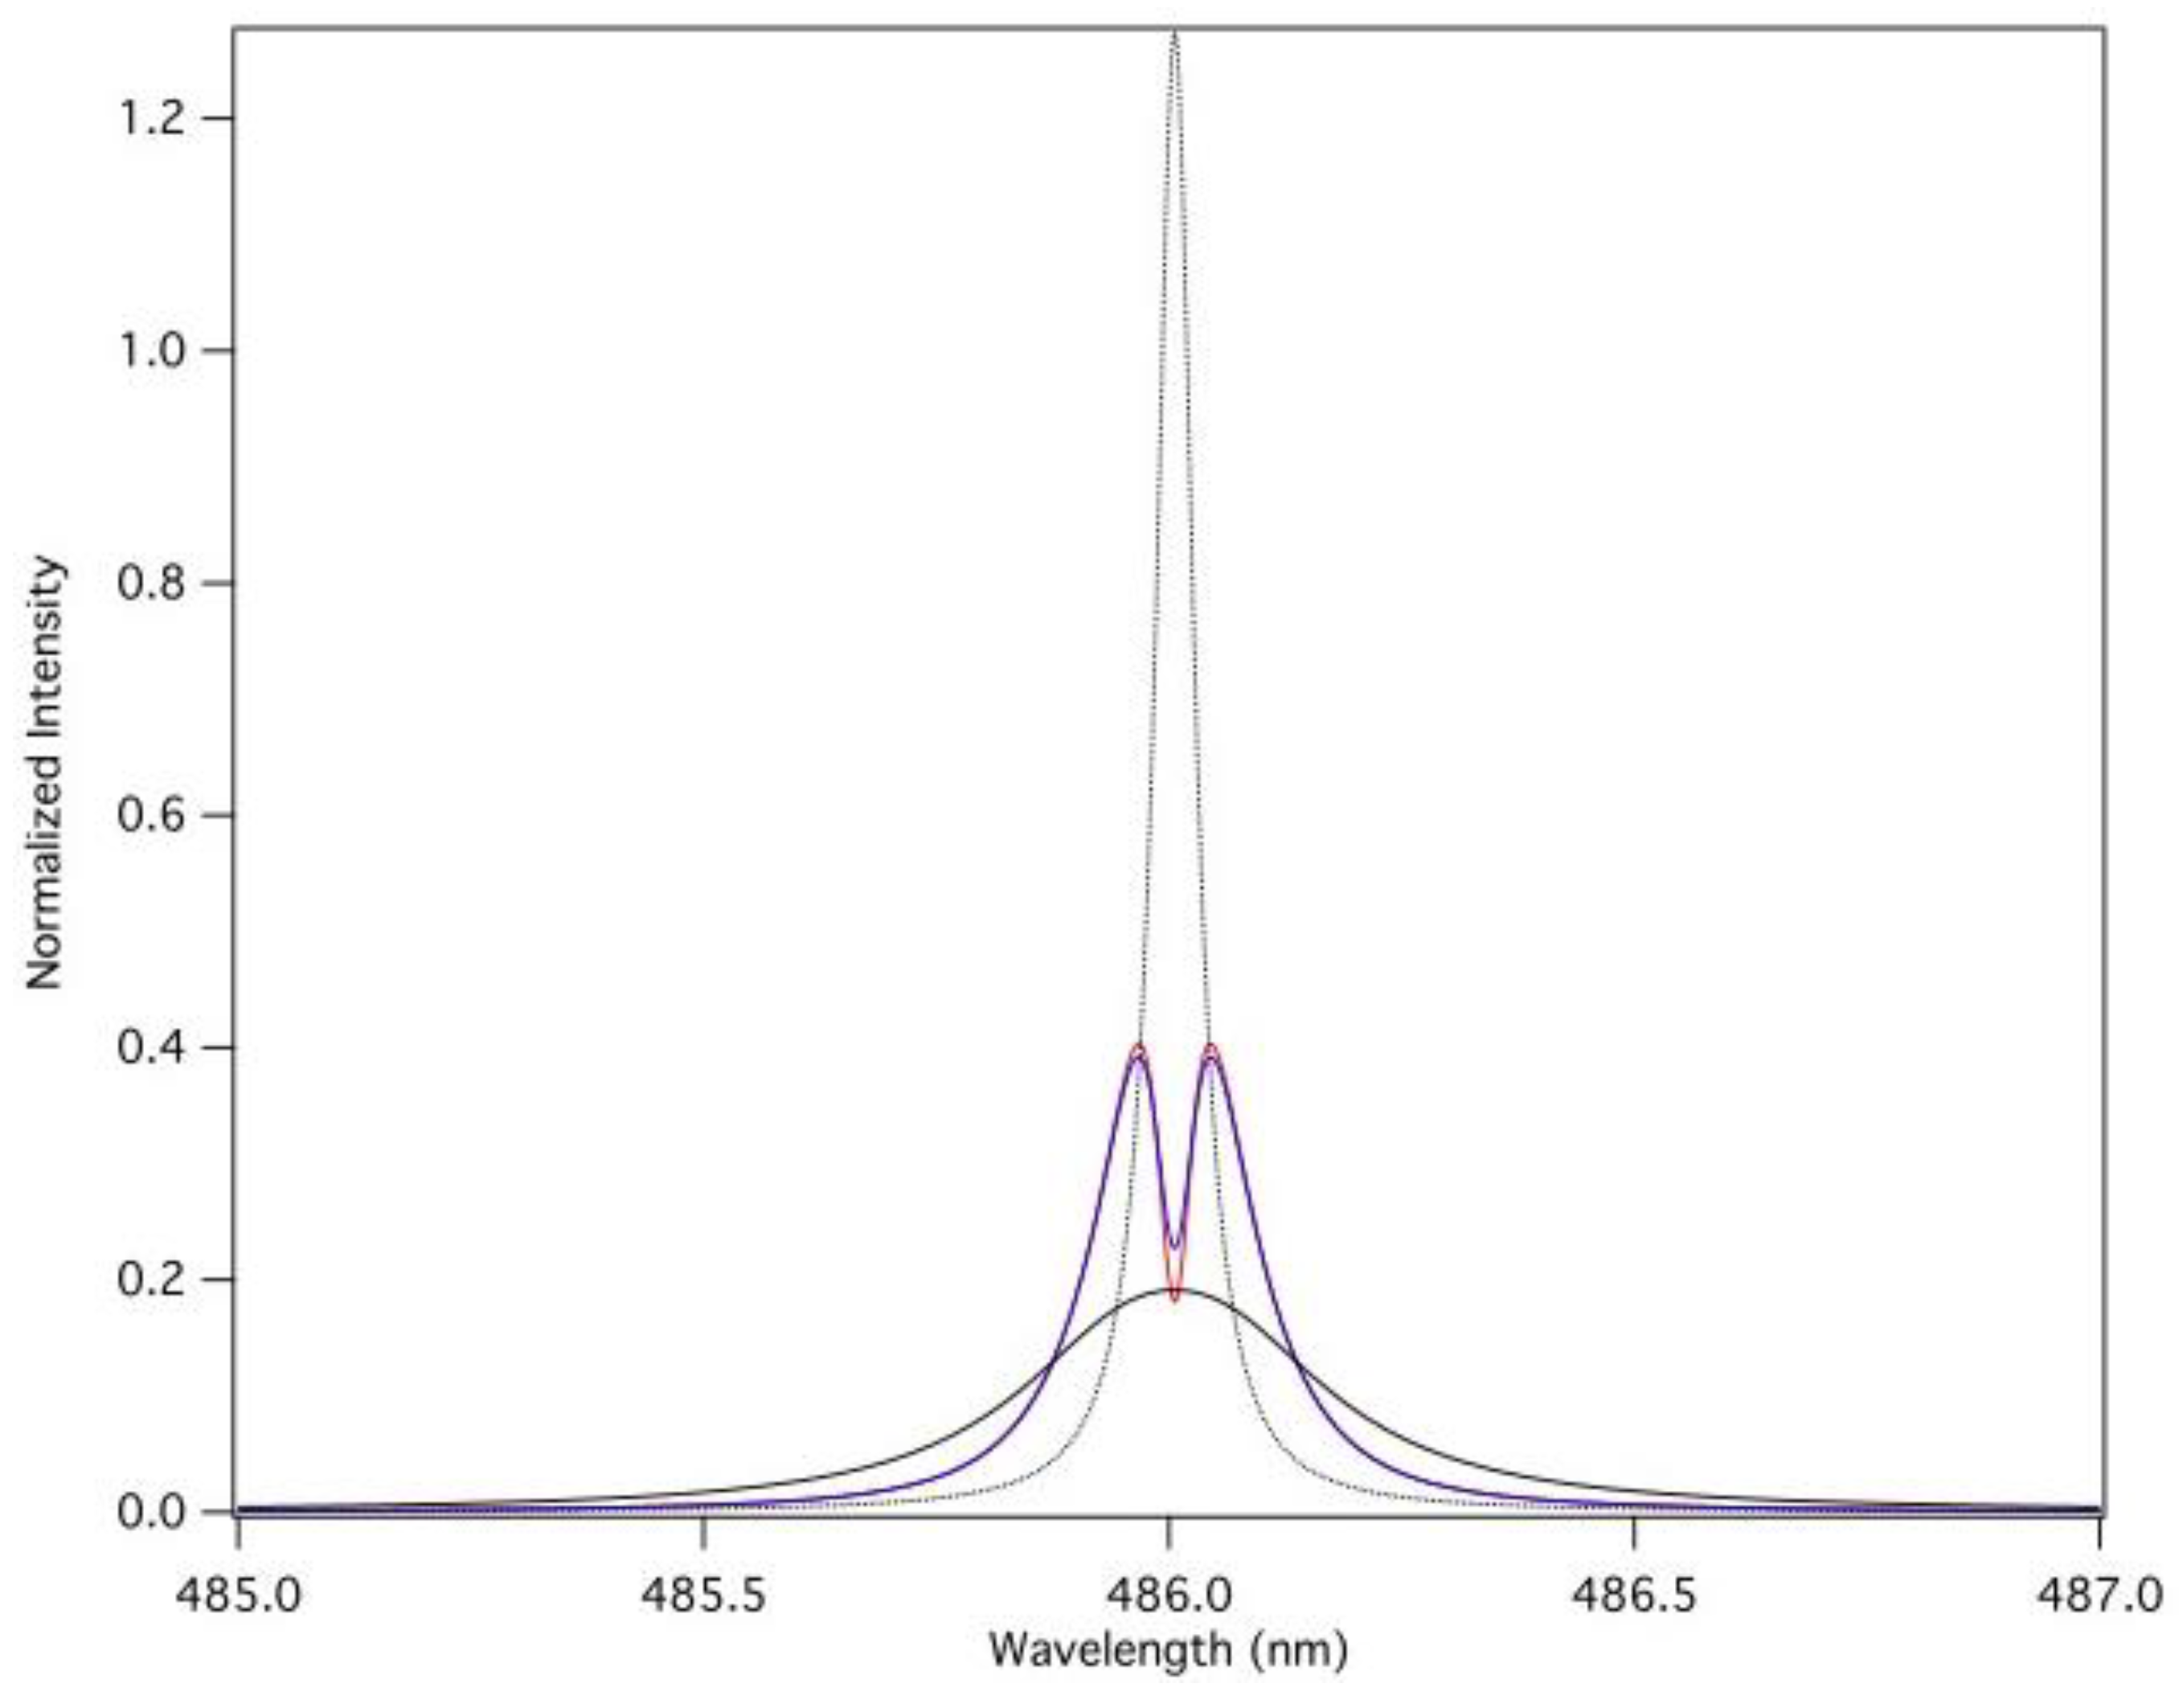
As an example, the profile of the Balmer-β (n = 2 − n = 4) line (H-β) has been performed using the PPP code for typical experimental conditions described in Section 3. As can be seen in Figure 2, the H-β line profile is significantly affected by the Stark effect at ne = 1 × 1015 cm−3 and Te = 1.16 × 10⁴ K (Ti = 300 K). Moreover, in this particular case, this line profile is also affected by van der Waals broadening which results from the dipolar interaction between excited atoms and induced dipoles from the neutral perturbers [21]. In Figure 2, in addition to Stark broadening, both the van der Waals and instrumental broadening mechanisms are included in this analysis to show their influence on the line profile. It appears that these broadening effects cannot be ignored in density diagnostic methods. Detailed analysis of the van der Waals broadening effects is provided in Section 3.2. The Balmer-β line profile has also been calculated by the PPP code for a fixed temperature, Te = Ti = 10,000 K, and for different densities in the range between 1014 and 1016 cm−3 for the specific case of reduced mass of 0.8. The line widths have been compared with those tabulated in [22] and are found to be in good agreement within 5%.
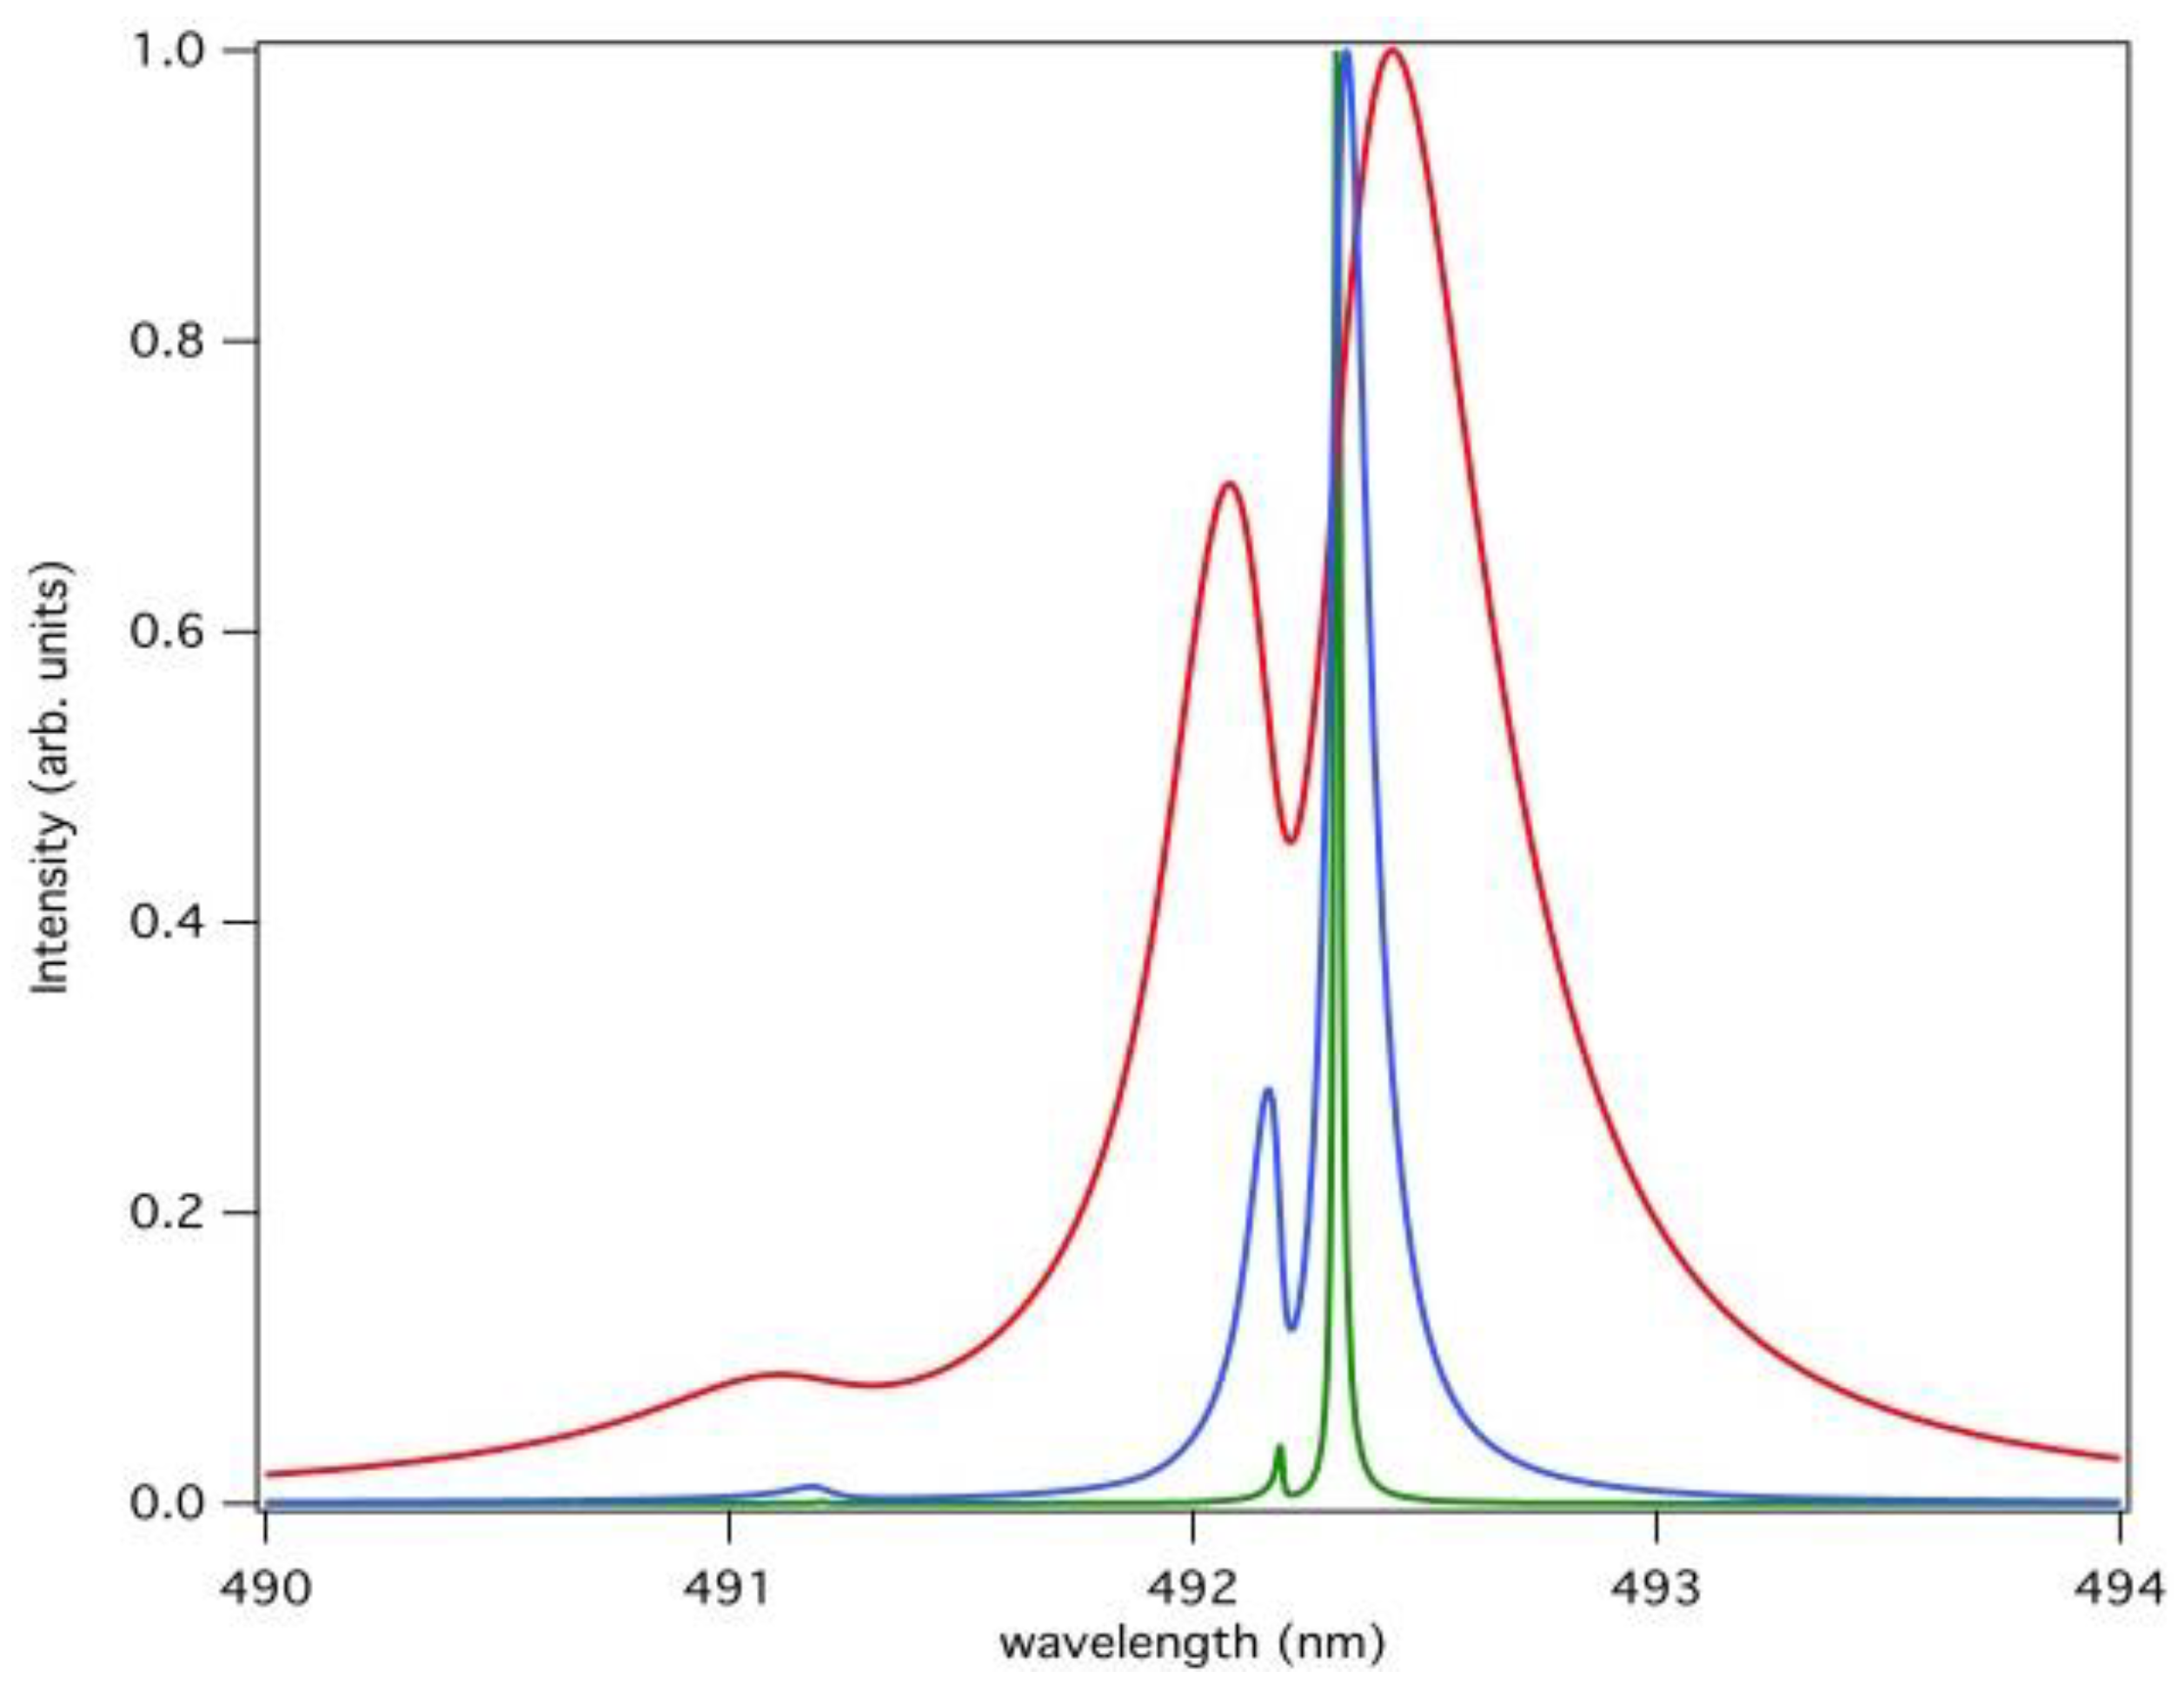
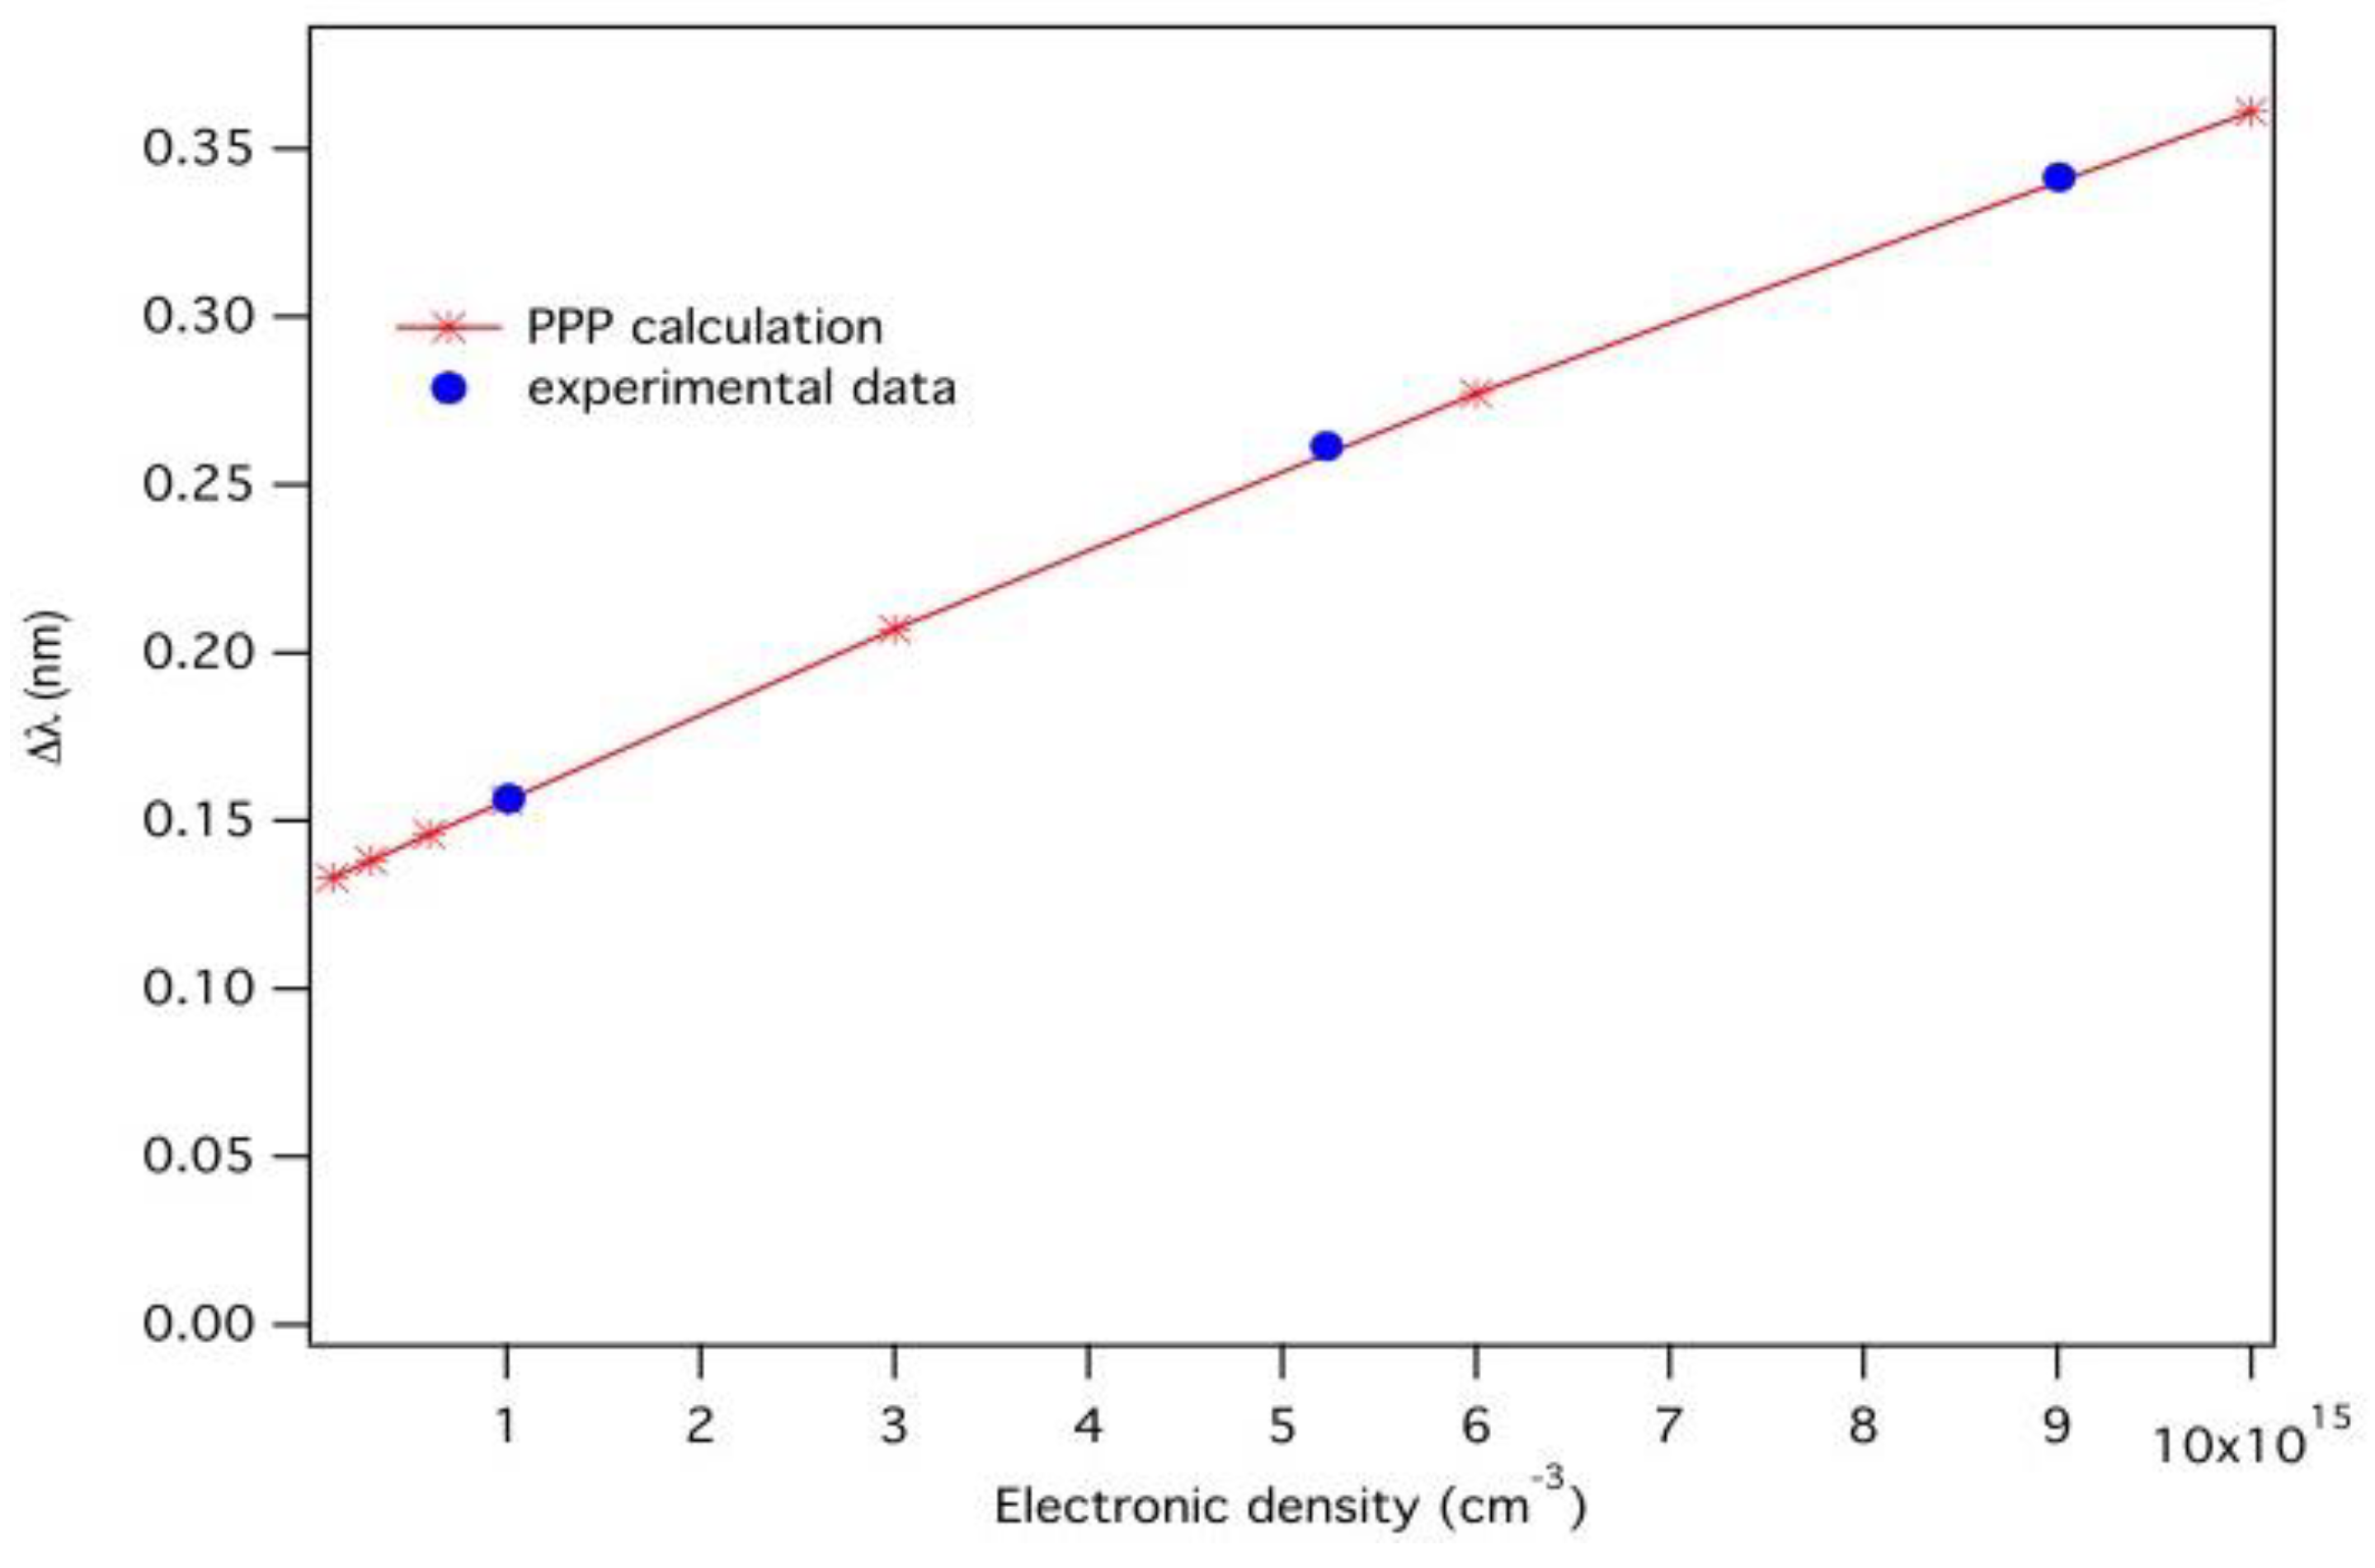
Figure 3 shows the synthesized profiles of the He I 1s4d 1D – 1s2p 1P0 line at 492.2 nm with He+ perturbers for different electronic densities: ne = 3 × 1014 cm−3, ne = 2 × 1015 cm−3, ne = 1016 cm−3. Electronic and ionic temperatures were fixed at 1.16 × 10⁴ K and 300 K, respectively. No additional broadening was taken into account in this calculation. When the electronic density increases, the forbidden components (the transitions 1s4p 1P0 – 1s2p 1P0 and 1s4f 1F0 – 1s2p 1P0) become more intense, and their position is shifted towards the blue wing of the allowed components. The distance between the peaks of the allowed and forbidden components can be used for an estimation of the electronic density [23]. The He I 492.2 nm line has then been synthesized using the PPP code for various densities, from ~1014 cm−3 to 1016 cm−3. The dependency of the distance between the allowed and forbidden component peaks versus the electronic density is shown in Figure 4. According to these results and by comparison with the experimental data (blue points in Figure 4), the estimate electronic densities for pressures of 0.1, 0.2, and 0.3 MPa have been found to be ne = 1015 cm−3, ne = 5.2 × 1015 cm−3, and ne = 9 × 1015 cm−3, respectively.
3. Analysis of the Hydrogen Balmer-β and He I 492.2 nm Lines in Corona Discharge Plasma
3.1. Corona Discharges Excited in Gaseous Helium: Experimental Setup and Methodology
Corona discharges have been developed in gaseous He at 300 K and at different gas pressures, from 0.1 MPa up to 0.6 MPa. Typically, corona discharge (ionization of gaseous He) occurs in the vicinity of sharp high-voltage electrode. Prior to each test, the test cell was evacuated using a turbo molecular pump to ~10−4 Pa and filled with ultra-pure helium of grade N 60 (l’Air Liquide) with nominal concentration of impurities of <0.1 ppm of oxygen. The gas was directed through a series of traps filled with a mixture of molecular sieves (3–10 ) and charcoal, activated under vacuum typically at 350 °C for three days and then immersed in liquid N2.
The test cell was equipped with a point electrode made of an electrolytically etched tungsten wire of 1 mm in diameter. The tungsten wire tips produced by the electrolytic etching process had radii between 0.1 μm and 0.2 μm as measured by inspection of images obtained using an electron microscope. The plane electrode was made of stainless steel and was virtually grounded through a Keithley 610C electrometer. The inter-electrode spacing was 8 mm. All metallic electrodes were supported by Macor ceramic insulators. The point electrode was energized negatively using a stabilized HV DC power supply (Spellman RHSR/20PN60). The light emitted from the corona region was transmitted through a sapphire window, collected by a lens, and focused into the entrance slit of a spectrograph. Spectra were recorded using an Acton Research Corporation spectrograph with 500 mm focal length. The spectrograph was equipped with three plane gratings of 1800 grooves/mm blazed at 500 nm and two of 1200 grooves/mm, blazed at 750 nm and 300 nm, respectively. A liquid nitrogen-cooled 2D-CCDTKB-UV/AR detector was located directly in the exit plane of the spectrograph. At the operating temperature of 153 K, the dark current was lower than 1 e/pixel/h resulting in a noise level only dominated by the read-out noise. Instrumental broadening was obtained using spectral profiles of helium lines emitted by a low-pressure discharge lamp, resulting in Δλins ~ 0.09 nm for the 1800 grooves/mm grating.
3.2. Analysis of the Observed H-β and He I 492 nm Lines
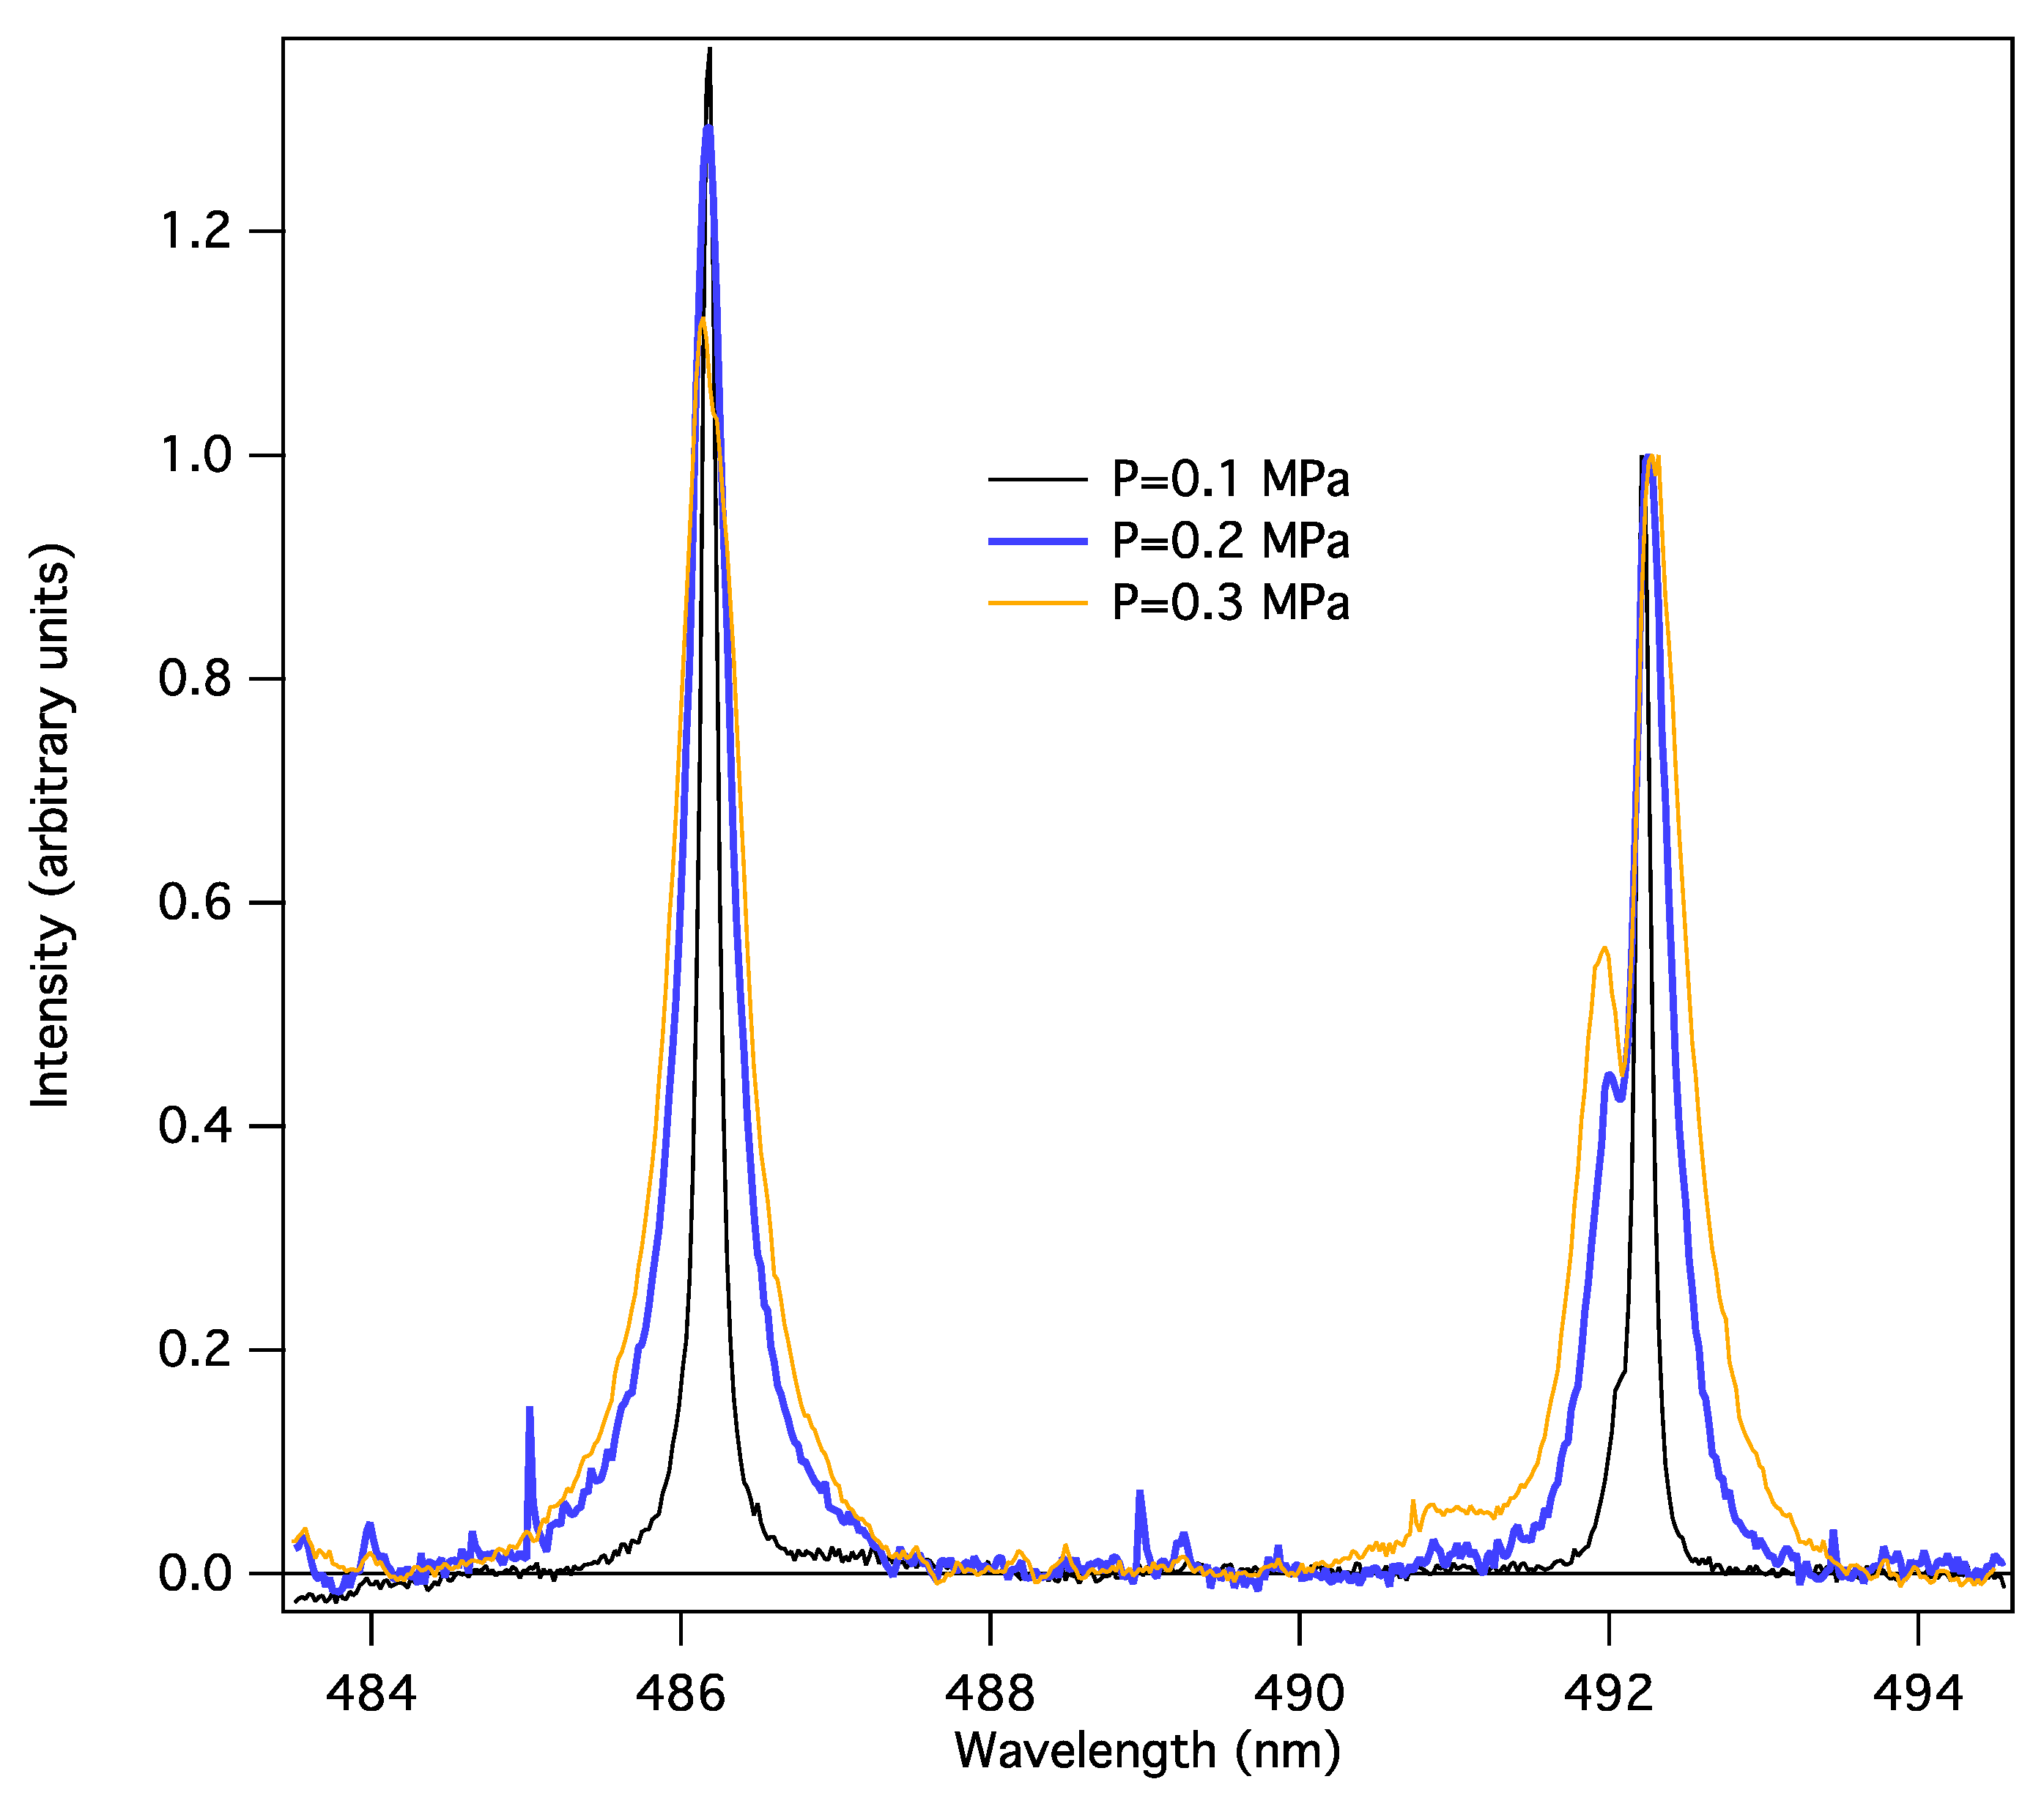
Figure 5 shows the experimental spectra of H-β and He I 492 nm lines recorded simultaneously for different pressure values in the test cell, at 0.1, 0.2, and 0.3 MPa.
It can be seen, by comparison with theoretical results shown in Figure 3, that an increase in the pressure has the same effect on the spectral profile as an increase in the electronic density. The PPP calculations provide reasonable qualitative agreement with the experimental data.
In the following, we have considered that the experimental spectra result from three different broadening mechanisms: Stark broadening, van der Waals broadening, and instrumental broadening. For a gas temperature of 300 K, the Doppler width is 1 × 10⁻³ nm for the H-β line and 7 × 10⁻⁴ nm for the He I 492 nm line, leading to negligible effects on these line profiles compared to overall broadenings. Thus, the combination of these different broadening mechanisms results in complex spectral line profiles showing an inhomogeneous structure, i.e., a set of Stark components due to ionic Stark effect, where each component is homogeneously broadened by electronic collisions, van der Waals effects, and instrumental artifacts.
The van der Waals broadening mechanism, together with the resonance (which is not taken into account in this work) and electronic impact broadening, contributes to the width of the Lorentzian part of the line shape. The corresponding widths for the H-β line and for the He I 492.2 nm lines emitted in a helium plasma are determined by formulas given in column 2 of Table 1 and Table 2, respectively [24].
In these formulas, the units of pressure and temperature are Pa and K, respectively. In the present study, it is assumed that van der Waals broadening can be taken into account by considering the same equation for three radiative lines in both the H-β and He I 492.2 nm spectra. The result of this assumption has been proved with a modified version of the PPP code, and it was found that it is negligible in the present conditions. The theoretical values of the van der Waals (VDW) widths for the H-β and He I 492.2 nm spectral lines are shown in Table 3 and Table 4, respectively.
The opacity effects have also been estimated for both lines in the conditions of the present study. In this experiment, the corona discharge occurs in gaseous helium at 300 K at different gas pressures in the test cell, at 0.1 MPa, 0.2 MPa, and 0.3 MPa. The helium gas is not perfectly pure and contains impurities, in particular ~0.1 ppm of hydrogen. By using the helium density given by nhe = P/kT, where k is the Boltzmann constant, and the hydrogen density by 0.1 × 10⁻⁶ nhe, it is possible to estimate the line center opacity assuming a spatially uniform plasma of given geometrical path length, ℓ, at local thermodynamic equilibrium. For a geometrical path length ℓ = 100 μm, the line center opacities are of the order of a few 10−6 for the helium line and of a few 10−8 for the hydrogen line (for these three pressure values). Thus, in the following analysis, it is assumed that both lines are optically thin.
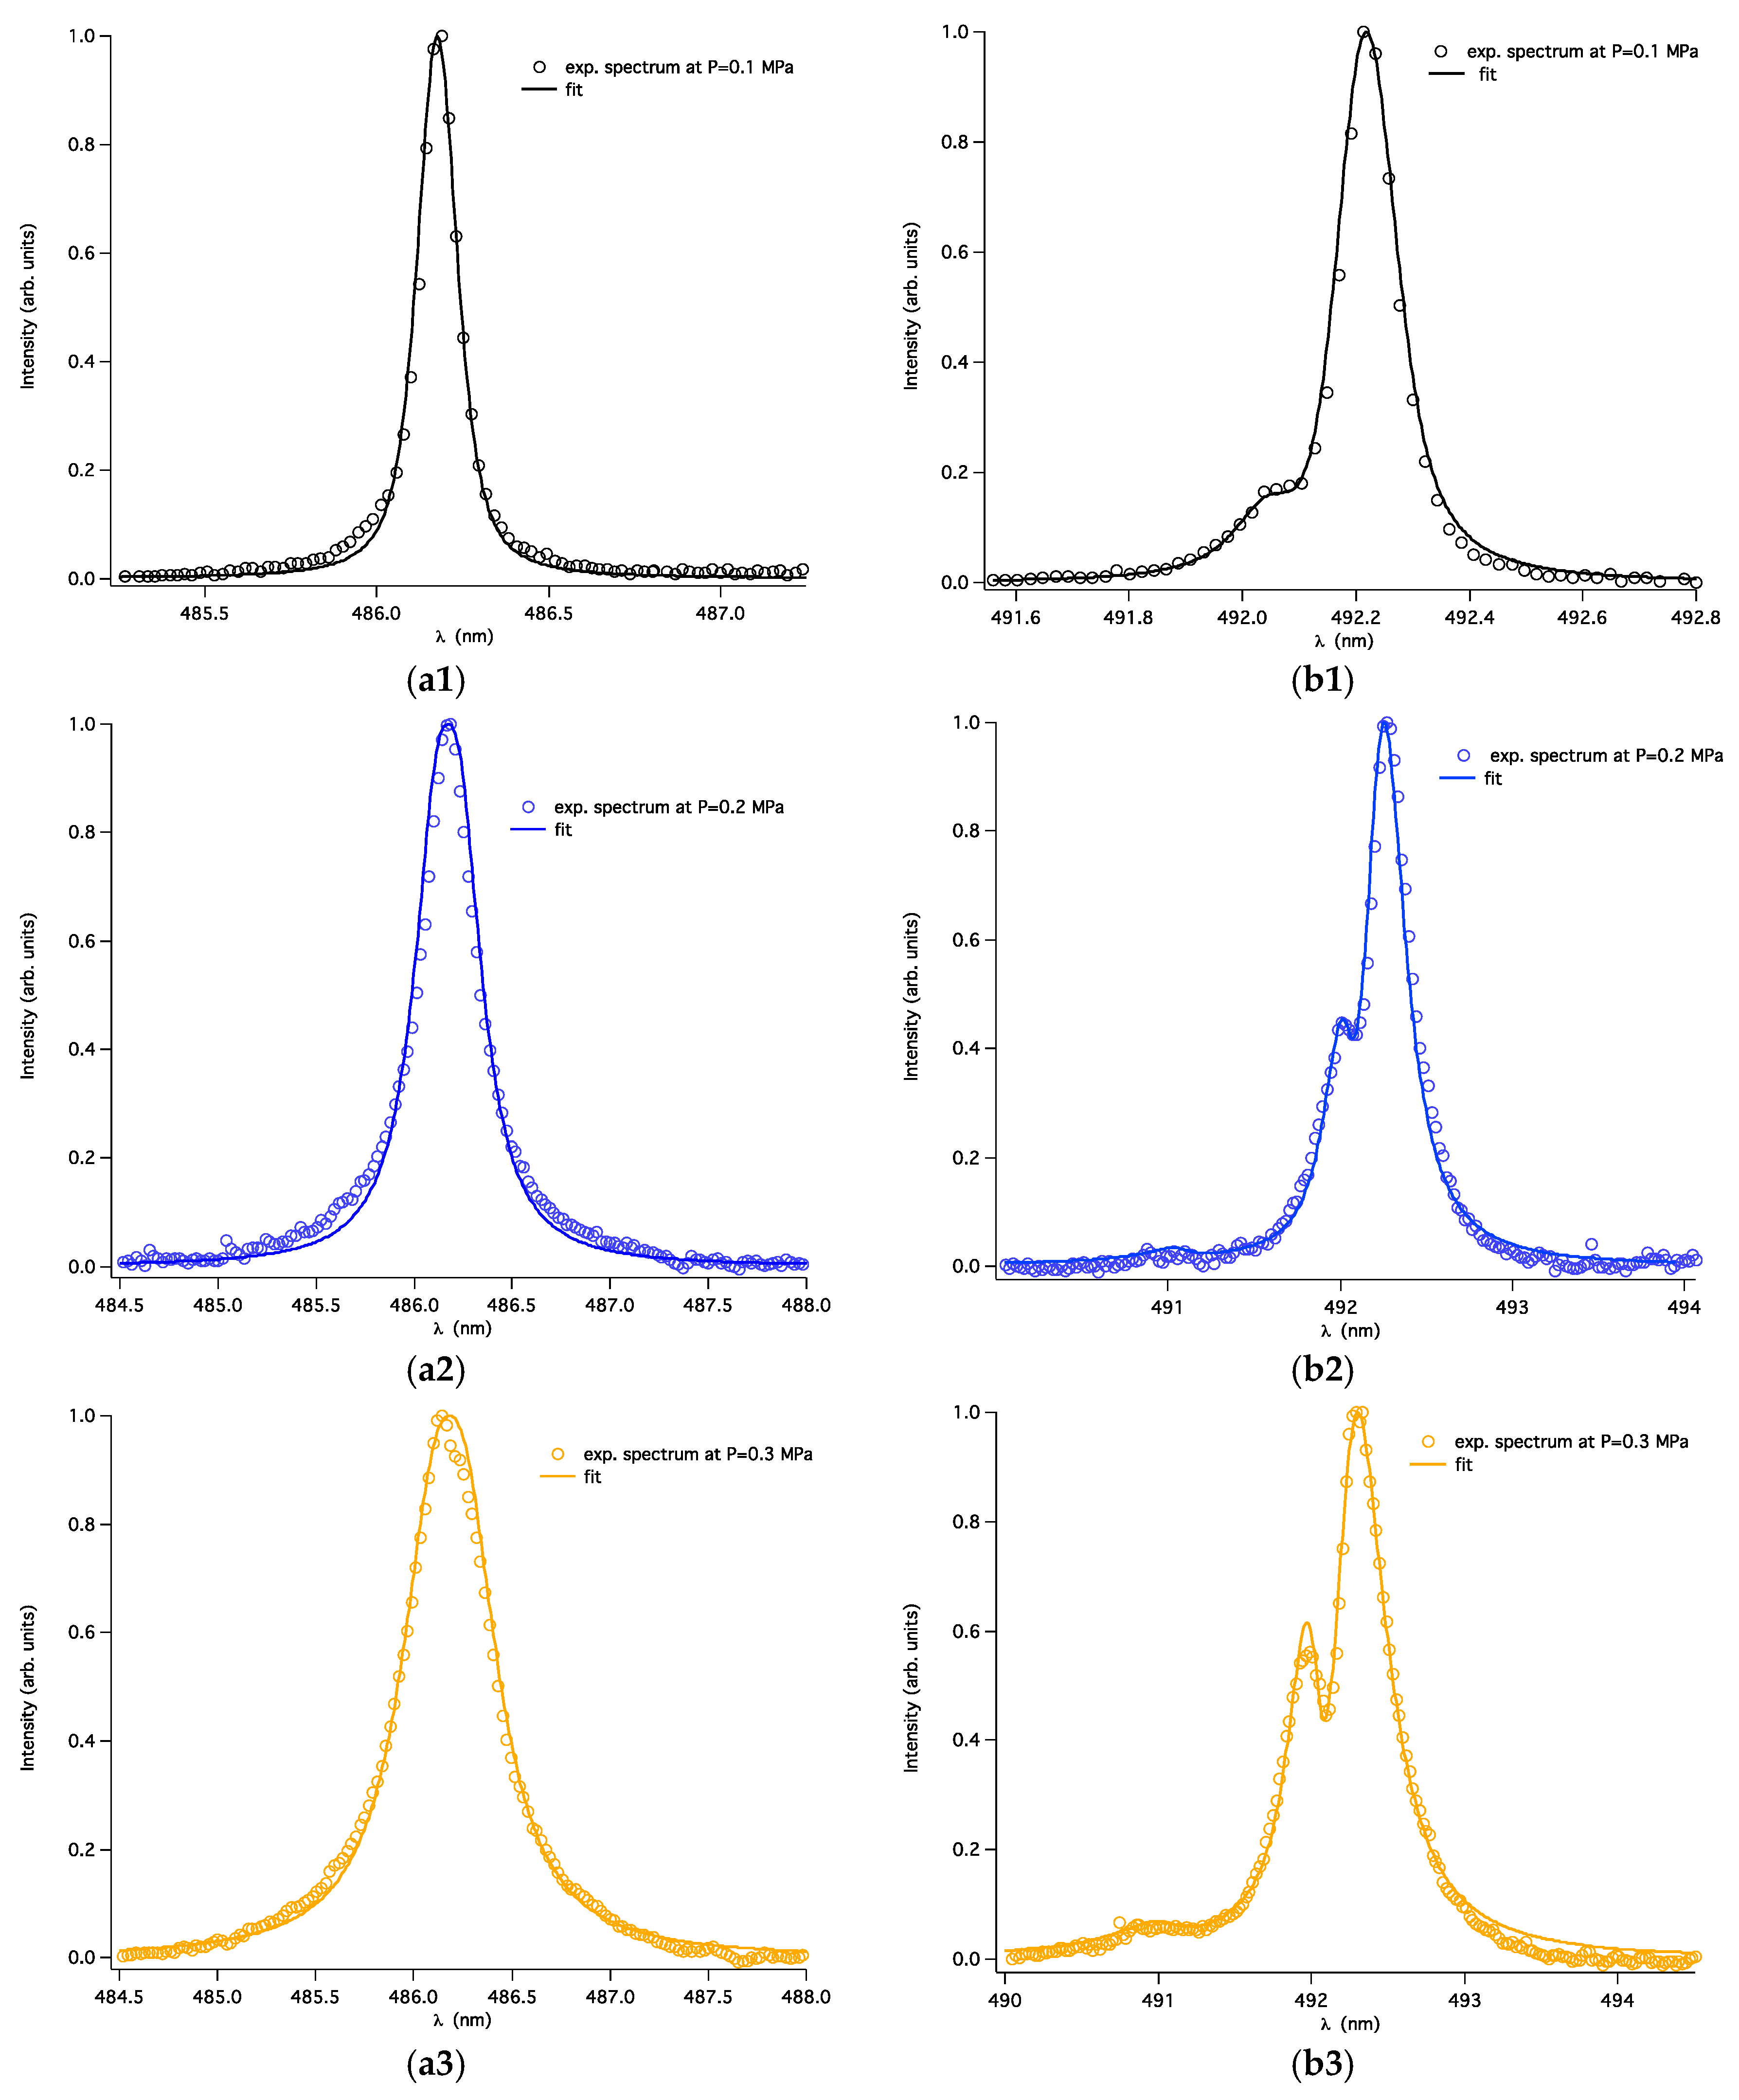
The comparisons between line shapes synthesized by the PPP code in the conditions determined by the GA analysis and the H-β and He I 492 nm experimental lines are shown in Figure 6 for each pressure value.
The plasma parameters ne and Te are determined with the GA procedure, together with the potential additional broadening of spectral lines corresponding to the full (Lorentzian) width at half maximum (FWHM) for van der Waals broadening, and the full (Gaussian) width at half maximum (FWHM) for instrumental broadening. The latter has been measured in the range between 0.08 nm and 0.09 nm which has been set in the GA procedure in order to determine the Gaussian width.
The four parameters obtained by the GA analysis, i.e., the electron density ne, the electron temperature Te, the van der Waals width , and the additional Gaussian width Δλins, are given in Table 5 for the H-β line and in Table 6 for the He I 492 nm line.
It can be seen that the electronic densities obtained by individual fitting of the hydrogen and helium lines are significantly different. The densities obtained using the helium line are in accordance with the densities obtained previously by analyzing the peak distances. However, these values are completely incompatible with a suitable fit of the H-β experimental spectra. The H-β line is much more difficult to fit with the synthetic spectral line profile than the He I 492.2 nm, in particular because of a bump in the blue wing which is not explained by the models. In other words, if the experimental spectral lines include specific structures which cannot be reproduced by the models (e.g., impurity emission lines), the GA will produce the best fit between the synthesized and experimental profiles, including the given structures, at the expense of the rest of the spectra. In the present work, to avoid the problem caused by the bump in the blue wing of the Balmer-β line, the fitting procedure has been restricted to the center of the line, as neither the Stark broadening models nor the van der Waals modeling could predict this bump in the He I 492.2 nm line.
Nevertheless, it appears that it is impossible to fit both lines with the same plasma parameters. The parameters obtained by analyzing the Balmer line do not permit to correctly reproduce the distance between the allowed and the forbidden components of the helium line. This distance depends on the electronic density only; however, the synthetic profiles obtained by analyzing the helium line provide densities leading to a too strong Stark effect to fit the Balmer line. One explanation could be that the emitting plasma is not uniform and that, even though these two spectra are recorded simultaneously, the spectroscopic measurements being not local, they are not emitted in the same part of the plasma and thus correspond to different plasma parameters.
Furthermore, the experimental spectral profiles of both lines at 0.1 MPa have been also compared to theoretical profiles obtained by the simulation method described in [25,26]. Density values of ~1.8 × 1015 cm−3 and ~1015 cm−3 have been obtained for the He I and for the H-β lines, respectively. In these preliminary works, the authors do not consider either van der Waals or instrumental broadening. Thus, it is difficult to compare the results of these papers [25,26] with the results obtained in the present paper, as both broadening mechanisms are not negligible. However, there is no contradiction between these papers [25,26] and the present study, as in articles [25,26] the authors obtained higher electronic densities to compensate the omission of additional broadening mechanisms.
The values of van der Waals broadening obtained from the best-fit procedure are close to those calculated by the formula given in Table 4 for the He I line. However, for the H-β line, the results of the GA analysis are not so straightforward to interpret; the obtained values of van der Waals broadening are 2–3 times greater than the theoretical values. Again, it can be assumed that the observed non-symmetrical profile of the spectral line can be a reason for such mismatch. Calculations have been performed using the PPP code by considering the van der Waals effect according to the theoretical values given in Table 3. In this case, the density values obtained by fitting the synthetic profiles to the experimental data are 1 × 10¹⁴, 1.19 × 10¹⁵, and 2.5 × 1015 cm−3 for 0.1, 0.2, and 0.3 MPa, respectively. However, these values are still below the density values obtained by analyzing the helium line.
4. Conclusions
In this work, a method based on the genetic algorithm coupled with the spectral line-shape code PPP is presented and used for obtaining plasma parameters from experimental spectra in the conditions when Stark broadening is important. This procedure is based on finding the global minimum of the function and it is proved to be a reliable, robust, and fast optimization technique, which allows the determination of the best fit parameters within good confidence intervals. However, this method strongly depends on the used theoretical line broadening models.
In order to illustrate the possibilities of the proposed procedure, it has been used for analyzing spectra measured in helium corona discharge by determining the electron density, the electron temperature, and the van der Waals broadening. The experimental spectra exhibit, on the same record, two radiative transitions emitted by different components of the plasma, the hydrogen Balmer-β line and the He I 492.2 nm line. This experiment was chosen in the framework of the 4th SLSP code comparison workshop [5] as an illustrative “real-life” case. The challenge for the attendees of the workshop was to find plasma parameters permitting to fit simultaneously both hydrogen and helium lines. The procedure presented in this paper has been developed to meet this challenge.
It was found that the joint analysis of the two lines using the PPP–GA procedure leads to significantly different electronic density values. For each calculation, it has been checked that the reached minima were non-local. Due to asymmetry in the blue wing of the experimental spectral lines, it was difficult to fit the Balmer-β line with the synthetic line obtained with the PPP–GA procedure, as this asymmetry is not explained by the spectrum modeling. Thus, the fitting procedure has been restricted to the center of each line. The analysis of the He I line was more straightforward and provided plasma parameters which are in agreement with the parameters obtained with different theoretical methods.
An in-depth analysis of the obtained results confirms that both lines cannot be fitted with the same set of plasma parameters. It is shown that the difference between the fitting results for these two spectral lines is an indication of the complex experimental conditions, including, in particular, a significant inhomogeneity of the plasma.
This work presents preliminary encouraging results based on the proposed method; however, further studies based on the GA procedure are required for improving the spectroscopic diagnostic methods used in the analysis of non-uniform spatial plasma regions.
Author Contributions
The development of the procedure of GA coupled with PPP was done by C.M. and P.G. The spectroscopic measurements were performed by N.B. The manuscript was written by C.M. and A.C. with contribution of the co-authors.
Funding
This research received no external funding
Conflicts of Interest
The authors declare no conflict of interest.
References
- Griem, H.R. Spectral Line Broadening by Plasma; Academic Press: New York, NY, USA, 1974. [Google Scholar]
- Golovkin, I.E.; Mancini, R.C.; Louis, S.J.; Lee, R.W.; Klein, L. Analysis of X-ray spectral data with genetic algorithms. JQSRT 2002, 75, 625–636. [Google Scholar] [CrossRef]
- Chung, H.K.; Cohen, D.H.; MacFarlane, J.J.; Bailey, J.E.; Wang, P.; Moses, G.A. Statistical fitting analysis of Stark-broadened optically thick Ar II spectra measured in ion beam transport experiments. JQSRT 2000, 65, 135–149. [Google Scholar] [CrossRef]
- Marandet, Y.; Genesio, P.; Godbert-Mouret, L.; Koubiti, M.; Stamm, R.; Capes, H. Determination of edge plasma parameters by a genetic algorithm analysis of spectral line shapes. Contrib. Plasmas Phys. 2004, 44, 289–293. [Google Scholar] [CrossRef]
- 4th SLSP Workshop. Available online: http://plasma-gate.weizmann.ac.il/projects/slsp/slsp4/ (accessed on 22 February 2018).
- Sheeba, R.R.; Koubiti, M.; Bonifaci, N.; Gilleron, F.; Mossé, C.; Pain, J.-C.; Rosato, J.; Stambulchik, E. H-β Line in a Corona Helium Plasma: A Multi-Code Line Shape Comparison. Atoms 2018, 6, 29. [Google Scholar] [CrossRef]
- Sheeba, R.R.; Koubiti, M.; Bonifaci, N.; Gilleron, F.; Pain, J.-C.; Stambulchik, E. Broadening of the Neutral Helium 492 nm Line in a Corona Discharge: Code Comparisons and Data Fitting. Atoms 2018, 6, 19. [Google Scholar] [CrossRef]
- Calisti, A.; Khelfaoui, F.; Stamm, R.; Talin, B.; Lee, R.W. Model for the line shapes of complex ions in hot and dense plasmas. Phys. Rev. A 1990, 42, 5433–5440. [Google Scholar] [CrossRef] [PubMed]
- Talin, B.; Calisti, A.; Godbert, L.; Stamm, R.; Lee, R.W.; Klein, L. Frequency-fluctuation model for line-shape calculations in plasma spectroscopy. Phys. Rev. A 1995, 51, 1918–1928. [Google Scholar] [CrossRef] [PubMed]
- Charbonneau, P. Genetic algorithms in astronomy and astrophysics. Astrophys. J. Suppl. Ser. 1995, 101, 309. [Google Scholar] [CrossRef]
- Ferri, S.; Calisti, A.; Mossé, C.; Rosato, J.; Talin, B.; Alexiou, S.; Gigosos, M.A.; González, M.A.; González-Herrero, D.; Lara, N.; et al. Ion Dynamics Effect on Stark-Broadened Line Shapes: A Cross-Comparison of Various Models. Atoms 2014, 2, 299–318. [Google Scholar] [CrossRef] [Green Version]
- Godbert-Mouret, L.; Meftah, T.; Calisti, A.; Stamm, R.; Talin, B.; Gigosos, M.; Cardenoso, V.; Alexiou, S.; Lee, R.W.; Klein, L. Accuracy of stark broadening calculations for ionic emitters. Phys. Rev. Lett. 1998, 81, 5568. [Google Scholar] [CrossRef]
- Bonifaci, N.; Li, Z.; Eloranta, J.; Fiedler, S.L. Interaction of Helium Rydberg State Molecules with Dense Helium. J. Phys. Chem. A 2016, 120, 9019–9027. [Google Scholar] [CrossRef] [PubMed]
- Galtier, E.; Rosmej, F.B.; Calisti, A.; Talin, B.; Mossé, C.; Ferri, S.; Lisitsa, V.S. Interference effects and Stark broadening in XUV intrashell transitions in aluminum under conditions of intense XUV free-electron-laser irradiation. Phys. Rev. A 2013, 87, 033424. [Google Scholar] [CrossRef]
- Mancini, R.C.; Iglesias, C.A.; Ferri, S.; Calisti, A.; Florido, R. The effect of improved satellite line shapes on the argon Heβ spectral feature. High Energy Density Phys. 2013, 9, 731–736. [Google Scholar] [CrossRef]
- Iglesias, C.A.; DeWitt, H.E.; Lebowitz, J.L.; MacGowan, D.; Hubbard, W.B. Low-frequency electric microfield distributions in plasmas. Phys. Rev. A 1985, 31, 1698. [Google Scholar] [CrossRef]
- Iglesias, C.A.; Rogers, F.J.; Shepherd, R.; Bar-Shalom, A.; Murillo, M.S.; Kilcrease, D.P.; Calisti, A.; Lee, R.W. Fast electric microfield distribution calculations in extreme matter conditions. J. Quant. Spectrosc. Radiat. Transf. 2000, 65, 303–315. [Google Scholar] [CrossRef]
- Hooper, C.F., Jr. Electric microfield distributions in plasmas. Phys. Rev. 1966, 149, 77. [Google Scholar] [CrossRef]
- Hooper, C.F., Jr. Low-frequency component electric microfield distributions in plasmas. Phys. Rev. 1968, 165, 215. [Google Scholar] [CrossRef]
- Calisti, A.; Mossé, C.; Ferri, S.; Talin, B.; Rosmej, F.; Bureyeva, L.A.; Lisitsa, V.S. Dynamic Stark broadening as the Dicke narrowing effect. Phys. Rev. E 2010, 81, 016406. [Google Scholar] [CrossRef] [PubMed]
- Drake, G.W.F. Atomic, Molecular, and Optical Physics Handbook; AIP Press: Woodbury, NY, USA, 1996. [Google Scholar]
- Gigosos, M.A.; Cardenoso, V. New plasma diagnosis tables of hydrogen Stark broadening including ion dynamics. J. Phys. B Atomic Mol. Opt. Phys. 1996, 29, 4795. [Google Scholar] [CrossRef]
- Lara, N.; González, M.A.; Gigosos, M.A. Stark broadening tables for the helium I 492.2 line-Application to weakly coupled plasma diagnostics. Astron. Astrophys. 2012, 542, A75. [Google Scholar] [CrossRef]
- Nguyen, T.H.V. Spectroscopie d’émission d’un plasma crée par des décharges couronne dans l’hélium. Ph.D. Thesis, Université de Grenoble, Grenoble, France, 2015. [Google Scholar]
- Rosato, J.; Bonifaci, N.; Li, Z.; Stamm, R. A spectroscopic diagnostic of the electron density in a corona discharge. J. Phys. Conf. Ser. 2017, 810, 012057. [Google Scholar] [CrossRef] [Green Version]
- Rosato, J.; Bonifaci, N.; Li, Z.; Stamm, R. Line shape modeling for the diagnostic of the electron density in a corona discharge. Atoms 2017, 5, 35. [Google Scholar] [CrossRef]
Figure 1.
A schematic representation of the operation of the genetic algorithm (GA) coupled with PPP.
Figure 1.
A schematic representation of the operation of the genetic algorithm (GA) coupled with PPP.

Figure 2.
Comparisons between different broadening effects on the H-β line profile in He plasma at ne = 1 × 1015 cm−3, Te = 1.16 × 10⁴ K, and Ti = 300 K. Dotted black line: electronic impact broadening; Red line: total Stark broadening with quasi-static approximation; Blue line: total Stark broadening taking into account ion dynamics effect; Black line: total Stark profile taking into account relevant, van der Waals, and instrumental broadening.

Figure 3.
Synthetized profiles of spectral line He I 492.2 nm for Te = 1.16 × 10⁴ K and Ti = 300 K and for three densities, i.e., ne = 3 × 1014 cm−3 (green line), ne = 2 × 1015 cm−3 (blue line), ne = 1 × 1016 cm−3 (red line).
Figure 3.
Synthetized profiles of spectral line He I 492.2 nm for Te = 1.16 × 10⁴ K and Ti = 300 K and for three densities, i.e., ne = 3 × 1014 cm−3 (green line), ne = 2 × 1015 cm−3 (blue line), ne = 1 × 1016 cm−3 (red line).

Figure 4.
Distance between allowed and forbidden component peaks versus electronic density for He I 492.2 nm line synthesized at Te = 1.16 × 10⁴ K and Ti = 300 K.
Figure 4.
Distance between allowed and forbidden component peaks versus electronic density for He I 492.2 nm line synthesized at Te = 1.16 × 10⁴ K and Ti = 300 K.

Figure 5.
Experimental spectra of H-β and He I 492 nm lines measured at 0.1, 0.2, and 0.3 MPa.

Figure 6.
Examples of fitting of the experimental spectral lines. (a) H-β line profile (b) He I 492 nm line profile for pressure value (1) 0.1 MPa (2) 0.2 MPa (3) 0.3 Mpa.
Figure 6.
Examples of fitting of the experimental spectral lines. (a) H-β line profile (b) He I 492 nm line profile for pressure value (1) 0.1 MPa (2) 0.2 MPa (3) 0.3 Mpa.


Table 1.
van der Waals width formulas for the three radiative transitions of the H-β line in helium plasma.
Table 1.
van der Waals width formulas for the three radiative transitions of the H-β line in helium plasma.
| Transition | Δλth vdw |
|---|---|
| 4s – 2p | 2.20 × 10⁻⁵PT−7/10 |
| 4p – 2s | 2.12 × 10⁻⁵PT−7/10 |
| 4d – 2p | 1.98 × 10⁻⁵PT−7/10 |
Table 2.
van der Waals width formulas for the He I 492.2 nm line in helium plasma.
| Wavelength (nm) | Transition | Δλth vdw |
|---|---|---|
| 491.0747 | 1Po – 1P0 | 1.6906 × 10⁻⁵PT−7/10 |
| 492.0612 | 1Po – 1F0 | 1.3342 × 10⁻⁵PT−7/10 |
| 492.1931 | 1P0 – 1D1 | 1.5424 × 10⁻⁵PT−7/10 |
Table 3.
Theoretical van der Waals (VDW) width for 4d – 2p H-β for three values of pressure.
| Pressure (105 Pa) | |
|---|---|
| 1 | 3.65 × 10⁻² |
| 2 | 7.31 × 10⁻² |
| 3 | 10.96 × 10⁻² |
Table 4.
Theoretical VDW width for He I at 492.1931 nm for three values of pressure.
| Pressure (105 Pa) | |
|---|---|
| 1 | 2.85 × 10⁻² |
| 2 | 5.69 × 10⁻² |
| 3 | 8.54 × 10⁻² |
Table 5.
Results of the fitting GA analysis of the H-β line. ne: electron density; Te: electron temperature; : van der Waals width; Δλins: Gaussian width.
Table 5.
Results of the fitting GA analysis of the H-β line. ne: electron density; Te: electron temperature; : van der Waals width; Δλins: Gaussian width.
| Pressure (bar) | ne (cm−3) | Te (104 K) | Δλins (nm) | |
|---|---|---|---|---|
| 1 | 1014 | 1.23 | 7.2 × 10⁻² | 8.0 × 10⁻² |
| 2 | 8 × 10¹⁴ | 1.17 | 15.2 × 10⁻² | 8.0 × 10⁻² |
| 3 | 1.85 × 10¹⁵ | 1.21 | 24.2 × 10⁻² | 8.0 × 10⁻² |
Table 6.
Results of the fitting GA analysis of the He I 492 nm line.
| Pressure (bar) | ne (cm−3) | Te (104 K) | Δλins (nm) | |
|---|---|---|---|---|
| 1 | 1015 | 1.21 | 2.93 × 10⁻² | 8.0 × 10⁻² |
| 2 | 3.96 × 10¹⁵ | 1.16 | 5.82 × 10⁻² | 8.0 × 10⁻² |
| 3 | 8 × 10¹⁵ | 1.16 | 9.7 × 10⁻³ | 8.0 × 10⁻² |
© 2018 by the authors. Licensee MDPI, Basel, Switzerland. This article is an open access article distributed under the terms and conditions of the Creative Commons Attribution (CC BY) license (http://creativecommons.org/licenses/by/4.0/).
Share and Cite
MDPI and ACS Style
Mossé, C.; Génésio, P.; Bonifaci, N.; Calisti, A. A New Procedure to Determine the Plasma Parameters from a Genetic Algorithm Coupled with the Spectral Line-Shape Code PPP. Atoms 2018, 6, 55. https://doi.org/10.3390/atoms6040055
AMA Style
Mossé C, Génésio P, Bonifaci N, Calisti A. A New Procedure to Determine the Plasma Parameters from a Genetic Algorithm Coupled with the Spectral Line-Shape Code PPP. Atoms. 2018; 6(4):55. https://doi.org/10.3390/atoms6040055
Chicago/Turabian StyleMossé, Caroline, Paul Génésio, Nelly Bonifaci, and Annette Calisti. 2018. "A New Procedure to Determine the Plasma Parameters from a Genetic Algorithm Coupled with the Spectral Line-Shape Code PPP" Atoms 6, no. 4: 55. https://doi.org/10.3390/atoms6040055
Note that from the first issue of 2016, this journal uses article numbers instead of page numbers. See further details here.