The Influence of Secondary Electron Emission and Electron Reflection on a Capacitively Coupled Oxygen Discharge


1
Science Institute, University of Iceland, Dunhaga 3, IS-107 Reykjavik, Iceland
2
Department of Space and Plasma Physics, School of Electrical Engineering and Computer Science, KTH Royal Institute of Technology, SE-100 44 Stockholm, Sweden
*
Author to whom correspondence should be addressed.
Atoms 2018, 6(4), 65; https://doi.org/10.3390/atoms6040065
Submission received: 22 September 2018
/
Revised: 21 November 2018
/
Accepted: 23 November 2018
/
Published: 28 November 2018
(This article belongs to the Special Issue SPIG2018)
Abstract
:The one-dimensional object-oriented particle-in-cell Monte Carlo collision code oopd1 is applied to explore the role of secondary electron emission and electron reflection on the properties of the capacitively-coupled oxygen discharge. At low pressure (10 mTorr), drift-ambipolar heating of the electrons dominates within the plasma bulk, while at higher pressure (50 mTorr), stochastic electron heating in the sheath region dominates. Electron reflection has negligible influence on the electron energy probability function and only a slight influence on the electron heating profile and electron density. Including ion-induced secondary electron emission in the discharge model introduces a high energy tail to the electron energy probability function, enhances the electron density, lowers the electronegativity, and increases the effective electron temperature in the plasma bulk.
1. Introduction
Low pressure radio frequency (rf)-driven capacitively-coupled discharges have a range of material processing applications such as plasma etching and plasma enhanced chemical vapor deposition within the microelectronics industry. These discharges have been explored extensively over the past few decades. However, a few issues remain to be fully understood, including the electron heating mechanism, in particular when driven by multiple frequencies [1], and the role of surfaces regarding recombination and quenching of various species and phenomena such as secondary electron emission and electron reflection [2,3]. The modern capacitively-coupled discharge consists of two parallel electrodes separated by a few cm and is driven by a radio-frequency power generator. The plasma forms when rf voltage is applied between the electrodes. The electrons that gain enough energy from the resulting electric field produce positive ions, negative ions, and electrons through electron impact ionization of neutral atoms and molecules and electron impact dissociative attachment of molecules, which forms the plasma. The plasma is separated from the electrodes by space charge sheaths. Multiple frequencies are commonly applied in order to achieve separate control of ion flux and ion energy, as the ion flux dictates the throughput of the process and the ion energy determines the etching and deposition parameters on the wafer surface.
The particle-in-cell (PIC) method, when combined with Monte Carlo (MC) treatment of collision processes, is a self-consistent kinetic approach that has become a predominant numerical approach to investigate the properties of the low pressure capacitively-coupled discharge. This approach is commonly referred to as particle-in-cell Monte Carlo collision (PIC/MCC) method. The basic idea of the PIC method is to allow typically a few hundred thousand computer-simulated particles (superparticles) to represent a significantly higher number of real particles (density in the range of – m) [4,5,6]. In a PIC simulation, the motion of each particle is simulated and the various macro-quantities are calculated from the position and velocity of these particles. The particle interaction is handled through a macro-force acting on the particles, which is calculated from the field equations at points on a computational grid. This method allows us to follow the spatio-temporal evolution of the various plasma parameters such as particle density, particle energy, particle fluxes, and particle heating rates.
The kinetics of the capacitively-coupled oxygen discharge have been studied for over two decades starting with the seminal work of Vahedi and Surendra [7] using the 1D xpdp1 PIC/MCC code. Since then, a number of PIC/MCC studies have been reported on oxygen and Ar/O discharges using the xpdx1 series of codes, in both symmetrical and asymmetrical geometry, performed over a range of pressures and compared to experimental findings [8] and to analytical density profiles [9], showing good agreement, to explore the formation of the ion energy distribution function in an O/Ar mixture in an asymmetric capacitively-coupled discharge [10], and the influence of the secondary electron emission on the density profiles and the electron energy distribution function (EEDF) [11]. Other 1D PIC/MCC codes have been developed to explore the oxygen discharge. A 1D PIC/MCC model developed in Greifswald, that includes the metastable oxygen molecule O as a fraction of the ground state molecule, was used to determine the ion energy distribution function (IEDF) in oxygen CCP [12,13]. Furthermore, they found by comparison with experiments that one sixth of the oxygen molecules are in the metastable singlet delta state. A 1D PIC/MCC code, developed in Dalian [14,15], was applied to explore the electrical asymmetry effect in a dual-frequency capacitively-coupled oxygen discharge. Similar to Bronold et al. [12], this work assumed a constant density for the singlet metastable molecule O. More recently, a 1D PIC/MCC code that was developed in Budapest was used to explore the heating mechanism in a capacitively-coupled oxygen discharge driven by tailored waveforms (composed of N harmonics in addition to a fundamental frequency ) [16,17]. Furthermore, a PIC/MCC fluid hybrid model was applied to explore the electron power absorption and the influence of pressure on the energetics and particle densities [18,19]. In all of these works, only electrons, the positive ion O, and the negative ion O were treated kinetically, and the positive ion O was neglected. Furthermore, none of the metastable states were treated kinetically. The one-dimensional object-oriented plasma device one (oopd1) code allows having the simulated particles of different weights, which allows for tracking both charged and neutral particles in the simulation. Earlier, we benchmarked the basic reaction set for the oxygen discharge in oopd1 to the xpdp1 code [20].
In recent years, the oxygen reaction set in the oopd1 code was improved significantly [20,21,22]. Using this improved discharge model, we showed that the singlet metastable molecular states have a significant influence on the electron heating mechanism in the capacitively-coupled oxygen discharge [21,22,23,24] as well as the ion energy distribution [25]. We demonstrated that, when operating at low pressure (10 mTorr), the electron heating is mainly located within the plasma bulk (the electronegative core), while, when operating at higher pressures (50–500 mTorr), the electron heating appears almost solely within the sheath regions [22,23]. Furthermore, when operating at low pressure, the electron heating within the discharge is due to a hybrid drift-ambipolar-mode (DA-mode) and -mode, and while operating at higher pressures, the discharge is operated in a pure -mode [26,27]. We have also shown that detachment by the singlet molecular metastable states is the process that has the most influence on the electron heating process in the higher pressure regime, while it has almost negligible influence at lower pressures [22,23,24].
Secondary electron emission and electron reflection from the electrodes have often been neglected in PIC/MCC simulations. When it is included, it is common to assume the secondary electron emission to have a constant value (independent of the discharge conditions such as the energy of the bombarding ions), while only the ion-induced secondary electron emission is taken into account, and thus, the contributions of other species are neglected [2,3]. The effects of including a constant secondary electron emission yield are increased electron density, enhancement of the density profiles and the electron energy distribution functions (EEDFs), decreased sheath width, and the electron heating rate profiles changing significantly in both argon [28] and oxygen [11] discharges. Furthermore, it has been demonstrated that an asymmetry can be introduced by having electrodes with different secondary electron emission properties in a capacitively-coupled discharge [29], which was later extended to also include the electrical asymmetry effect in a dual-frequency capacitively-coupled discharge driven by two consecutive harmonics with different electrode materials [30]. In these studies, the secondary electron emission yield was set to be a constant. A few recent studies have emphasized using realistic secondary electron emission yields for both fast neutrals and ions bombarding the electrodes [2,3,22,28,31,32,33].
In an earlier study, we explored the role of including an energy-dependent secondary electron emission yield for both O and O-ions and O and O neutrals in an oxygen discharge [22]. We noted that this had a significant influence on the discharge properties, including increased electron and ion densities and decreased sheath width. Here, we study systematically how the secondary electron emission and the electron reflection from the electrodes influence the charged particle profiles, the electron heating processes, the electron energy probability function (EEPF), and the effective electron temperature, in a single frequency voltage-driven capacitively-coupled oxygen discharge by means of numerical simulation, for a fixed discharge voltage, while the discharge pressure is varied from 10–50 mTorr. The simulation parameters and the cases explored are defined in Section 2, and the simulation results found by including and excluding the ion-induced secondary electron emission and electron reflection are compared in Section 3. We give a summary and concluding remarks in Section 4.
2. The Simulation
The one-dimensional (1d-3v) object-oriented particle-in-cell Monte Carlo collision (PIC/MCC) code oopd1 [34,35] is herein applied to a capacitively-coupled oxygen discharge. The oopd1 code, like the well-known xpdp1 code [7], is a general plasma device simulation tool capable of simulating various types of plasmas, including breakdown, accelerators, beams, as well as processing discharges [20].
The oxygen reaction set included in the oopd1 code is rather extensive. Like xpdp1, it includes the ground state oxygen molecule O, the negative ion O, the positive ion O, and electrons [7,20]. In addition, oxygen atoms in the ground state OP) and ions of the oxygen atom O [20], the singlet metastable molecule O(a), and the metastable oxygen atom OD) [21], and the singlet metastable molecule O(b) [22] were added along with the relevant reactions and cross-sections. The full oxygen reaction set was discussed in our earlier works where the cross-sections used were also given [20,21,22]. Furthermore, oopd1 has energy-dependent secondary electron emission coefficients for oxygen ions and neutrals as they bombard both clean and dirty metal electrodes [22]. Thus, for this current work, the discharge model contains nine species: electrons, the ground state neutrals O(P) and O, the negative ions O, the positive ions O and O, and the metastables O(D), O, and O(b. We herein use the secondary electron emission yield for a dirty surface as given in our earlier work [22].
We assume a geometrically-symmetric capacitively-coupled discharge where one of the electrodes is driven by an rf voltage at a single frequency:
while the other electrode is grounded. Here, is the voltage amplitude, f the driving frequency, and t the time. The discharge operating parameters assumed are the voltage amplitude of V, an electrode separation of 4.5 cm, and a capacitor of 1 F connected in series with the voltage source. The driving frequency is assumed to be 13.56 MHz. These are the parameters used in our earlier works using oopd1 [20,21,22,24,27] and in the work of Lichtenberg et al. [9] using the xpdp1 code. The discharge electrode separation is assumed to be small compared to the electrode diameter so that the discharge can be treated as one dimensional. We assume the electrode diameter to be 10.25 cm, which is needed in order to determine the absorbed power, and set the discharge volume for the global model calculations applied to determine the partial pressure of the neutral species. The time step and the grid spacing are set to resolve the electron plasma frequency and the electron Debye length of the low-energy electrons, respectively, according to , where is the electron plasma frequency, and the simulation grid is taken to be uniform and consists of 1000 cells. The electron time step is set to s. The simulation was run for time steps, which corresponds to 2750 rf cycles. It takes roughly 1700 rf cycles to reach equilibrium for all particles, and the time averaged plasma parameters shown, such as the densities, the electron heating rate, and the effective electron temperature, are averages over 1000 rf cycles. All particle interactions are treated by the Monte Carlo method with a null-collision scheme [4]. For the heavy particles, we use sub-cycling, and the heavy particles are advanced every 16 electron time steps [36]. Furthermore, we assume that the initial density profiles are parabolic [36].
The kinetics of the charged particles (electrons, O-ions, O-ions, and O-ions) was followed for all energies. Since the neutral gas density is much higher than the densities of charged species, the neutral species at thermal energies (below a certain cut-off energy) are treated as a background with fixed density and temperature and maintained uniformly in space. These neutral background species are assumed to have a Maxwellian velocity distribution at the gas temperature (here, = 26 mV). The kinetics of the neutrals are followed when their energy exceeds a preset energy threshold value. The energy threshold values and the particle weights used here for the various neutral species included in the simulation are listed in Table 1. The partial pressures of the background thermal neutral species were calculated using a global (volume averaged) model of the oxygen discharge, as discussed in Proto and Gudmundsson [37]. The fractional densities for the neutrals O, O(P), O(a, and O(b, estimated using the global model calculations at 10, 25, and 50 mTorr, are listed in Table 2. These values are used as input for the PIC/MCC simulation as the partial pressures of the neutral background gas. Note that not all the neutrals considered in the global model calculations are shown in Table 2. Due to recombination of atomic oxygen and quenching of metastable atoms and molecules on the electrode surfaces, discussed below, there is a drop in the high energy (energy above the threshold value) atomic oxygen density and an increase in the high energy oxygen molecule densities next to the electrodes, as shown in our earlier work [22]. Thus, assuming uniformity of the background gas is thus somewhat an unrealistic assumption.
The electrode surfaces have significant influence on the discharge properties. There are a few parameters regarding the surface interaction of the neutral species that have to be set in the discharge model. For a neutral species that hits the electrode, we assume it returns as a thermal particle with a given probability. Similarly atoms can recombine on the electrode surfaces to form a thermal molecule with a given probability. As the oxygen atom O(P) hits the electrode, we assume that half of the atoms are reflected as O(P) at room temperature, and the other half recombines to form the ground state oxygen molecule O at room temperature. Thus, for a neutral oxygen atom in the ground state O(P), we use a wall recombination coefficient of 0.5, as measured by Booth and Sadeghi [38], for a pure oxygen discharge in a stainless steel reactor at 2 mTorr. Similarly, as the metastable oxygen atom O(D) hits the electrode, we assume that half of the atoms are quenched to form O(P) and that the other half recombines to form the ground state oxygen molecule O at room temperature. For the surface quenching coefficients of the singlet metastables molecules on the electrode surfaces, we assume for the singlet metastable O(a) a value of , and for the singlet metastable O(b), we assume a value of , based on the suggestion by O’Brien and Myers [39] that the surface quenching coefficient for the b state is significantly larger than for the a state. We explored the influence of the surface quenching coefficients of the singlet metastable molecule O(a) on the discharge properties in an earlier work [37]. There, we demonstrated that the influence of on the discharge properties and the electron heating mechanism can be significant indeed. The partial pressures listed in Table 2 were calculated by a global model using these surface quenching and recombination parameters as discussed in our earlier study [37].
In the simulations, we either neglect electron reflection from the electrode or assume that electrons are reflected from the electrodes with a probability of 0.2, which is the number of elastically-reflected electrons per incoming electron, independent of their energy and angle of incidence. This value is based on the summary of values presented by Kollath [40] for various materials. This value has been used by others in PIC/MCC simulations of capacitively-coupled discharges [2,3]. However, in reality, the reflection of electrons is known to depend on the electrode material, incident electron energy and the angle of incidence [40,41]. Furthermore, for all the cases explored here, we neglect secondary electron emission due to electron impact of the electrodes. The four cases explored for each pressure are listed in Table 3.
3. Results and Discussion
The choice of the surface quenching coefficient for the singlet metastable O(a) of was based on our earlier study of the time averaged electron heating profile between the electrodes [37]. In this study, we found that at 10 mTorr, almost all the electron heating occurred within the plasma bulk (the electronegative core), and the electron heating profile was almost independent of the surface quenching coefficient for the singlet metastable molecule O(a, while the DA-heating mode dominated the time averaged electron heating over one rf cycle. At 25 mTorr, the time averaged electron heating occurred both in the bulk (the electronegative core) and in the sheath regions, and a hybrid DA- and -mode heating was observed. When operating at 50 mTorr, electron heating in the sheath region dominated, and the discharge was operated in a pure -mode. Thus, this choice of pressure values and gave us three distinct operating regimes to analyze further.
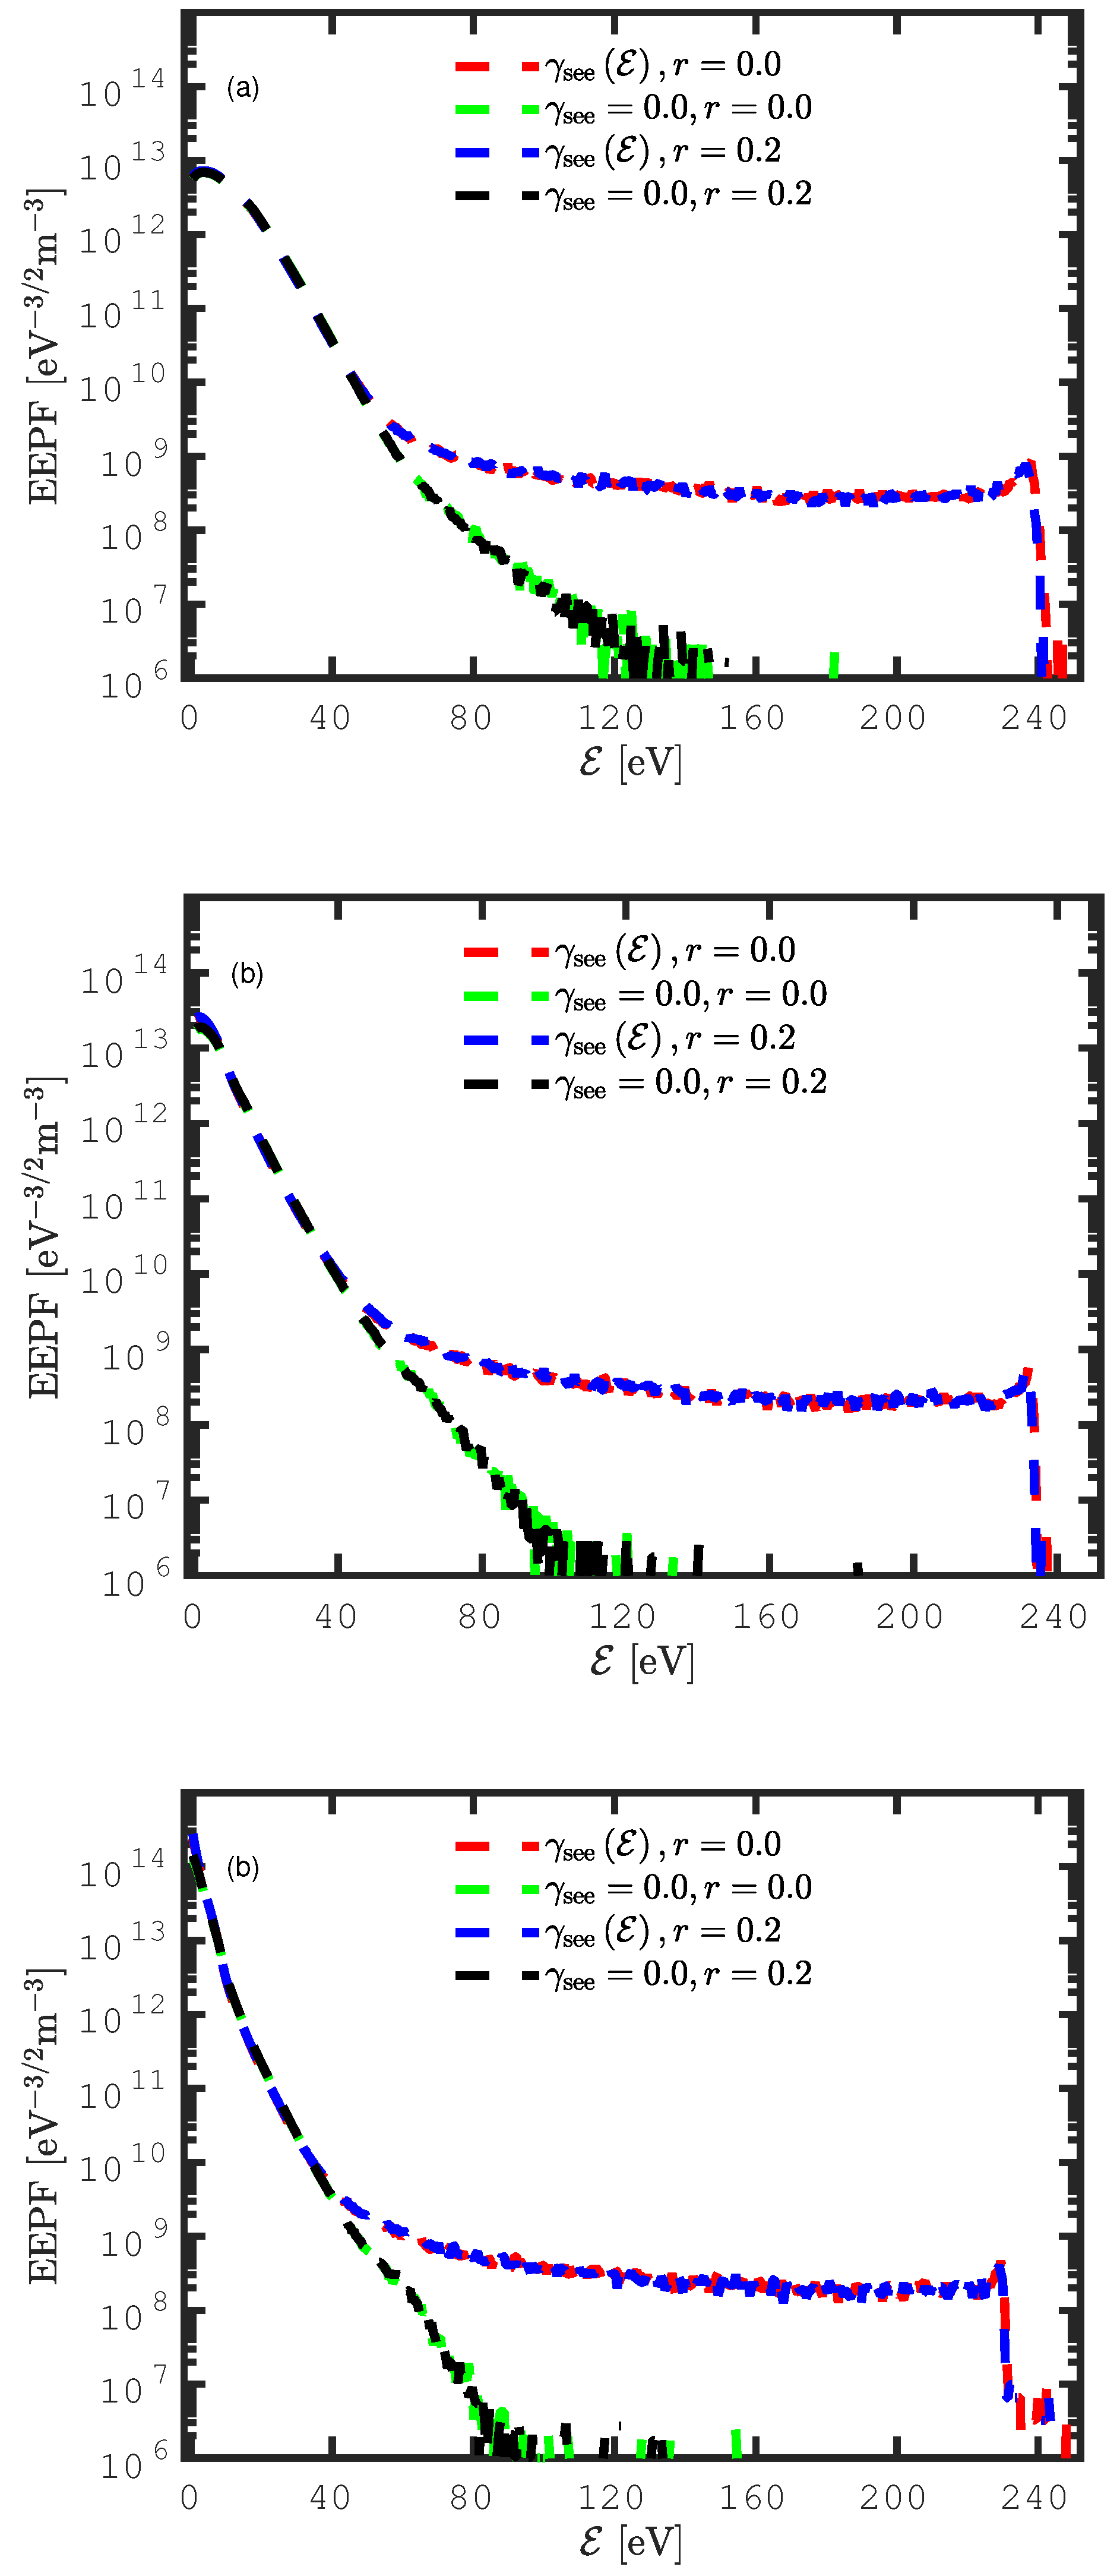
The electron energy probability function (EEPF) in the discharge center is shown in Figure 1, for the various combinations of pressures, including and excluding secondary electron emission and electron reflection from the electrodes, for a total of four cases for each pressure, as shown in Table 3. Figure 1a shows the electron probability function (EEPF) at 10 mTorr. At low electron energy, the EEPF curved outwards, and a high energy tail was apparent when secondary electron emission was excluded from the simulation. We see that adding secondary electron emission to the discharge model enhanced the EEPF. When including the ion-induced energy-dependent secondary electron emission yield, more electrons were created at the electrodes, which were subsequently accelerated to the plasma bulk across the sheath. Thus, more high energy electrons were created in the discharge, and the EEPF exhibits a high energy tail when secondary electrons were emitted from the electrodes. This high energy tail extended up to roughly 240 eV. At 10 mTorr, both cases (including and excluding electron reflection) including secondary electron emission overlapped, and both cases (including and excluding electron reflection) neglecting the secondary electron emission overlapped. Thus, including electron reflection from the electrodes had negligible effects on the EEPF. Figure 1b shows the EEPF at 25 mTorr. We see that the shape changed for all four cases as the pressure increased. The electron reflection had a negligible effect on the EEPF. This can be seen from the overlap of the green dashed line on the black one, when secondary electron emission was excluded, and from the overlap of the red line on the blue one, where secondary electron emission was included. Furthermore, an overall reduction of the high energy part of the curve, compared to the 10 mTorr case, was observed when secondary electron emission was neglected. This means that, when the pressure was raised and the secondary electron emission was neglected, there were fewer hot electrons within the bulk. Figure 1c shows the EEPF at 50 mTorr. Here, the transition, which already started at 25 mTorr, was fully accomplished and the shape of the EEPF now curved inwards or was bi-Maxwellian for all four cases. As before including secondary electron emission led to a high energy tail. Furthermore, now, the black dashed line with the green one and the blue dashed line with the red one overlapped almost perfectly, which indicates that the electron reflection from the electrodes had negligible effects.
Figure 2 shows the profile of the time averaged power absorption by the electrons over an rf cycle . A predominance of the electron heating within plasma bulk was observed in all four cases at 10 mTorr. We see that, when including the ion-induced secondary electron emission, the difference between including and excluding the electron reflection at the electrodes was very small within the plasma bulk. The same occurred when the secondary electron emission was excluded. A maximum in the power absorption in the bulk and a minimum in the sheath region were observed when the secondary electron emission was excluded and the electron reflection was included in the simulation (black line in Figure 2a). On the contrary, a maximum in the power absorption in the sheath edge and a minimum in the bulk were seen when the secondary electron emission was included and the electron reflection was excluded (red line in Figure 2a). At the transition pressure of 25 mTorr, the situation was drastically changed. A combination of the electron heating in the plasma bulk and in the sheath region was observed in all four cases. Indeed Figure 2b shows that there was a maximum in the power absorption in the bulk and a minimum in the sheath edge when both secondary electron emission and electron reflection were excluded (green line in Figure 2b), while a minimum in the bulk and a maximum in the sheath edge were observed when the secondary electron emission and the electron reflection were included (blue line in Figure 2b). At 50 mTorr, the transition was fully accomplished and the electron heating was almost solely in the sheath region or stochastic electron heating. This is clearly seen in Figure 2c when averaged over the rf cycle. Indeed, the electron reflection did not play much of a role. The maximum in the power absorption was observed when secondary electron emission was included in the simulation and the sheath was slightly narrower.
In order to explore the observed transition further, we plot the center electron density as a function of pressure in Figure 3a. The electron density increased with increased pressure. At 10 mTorr, all four cases exhibited a similar electron density, and the electron density was slightly enhanced when the electron reflection was included in the simulation. At 25 mTorr, we see that including both the secondary electron emission and the electron reflection gave the highest center electron density, while excluding both processes led to the lowest center electron density. The differences in electron density between including and excluding both secondary electron emission and electron reflection were bigger than at 10 mTorr. At 50 mTorr, we see that including the ion induced secondary electron emission increased the center electron density and that including electron reflection increased the electron density even further.
Further insights about the observed transition are shown in the plot of the center electronegativity as a function of pressure in Figure 3b. At 10 mTorr, the discharge was the most strongly electronegative. The electronegativity decreased from ∼110 at 10 mTorr to ∼20 at 50 mTorr. The electronegativity was higher (lower) when electron reflection was excluded (included) in the simulation; however, all four cases were very close to each other. The maximum (minimum) value of the electronegativity was reached when both secondary electron emission and electron reflection were excluded (included). At 25 mTorr, we observe that the gap between including and excluding both secondary electron emission and electron reflection was bigger than at 10 mTorr. We observe that, when secondary electron emission was included, excluding the electron reflection enhanced the electronegativity. The same occurred when secondary electron emission was included. Indeed, in this case, excluding both secondary electron emission and electron reflection gave the highest electronegativity. At 50 mTorr, the electronegativity was drastically reduced. We observed that electronegativity was lowest when secondary electron emission was included in the simulation and that electron reflection did not play much of a role. On the other hand, the electronegativity was highest when secondary electron emission and electron reflection were excluded from the simulation.
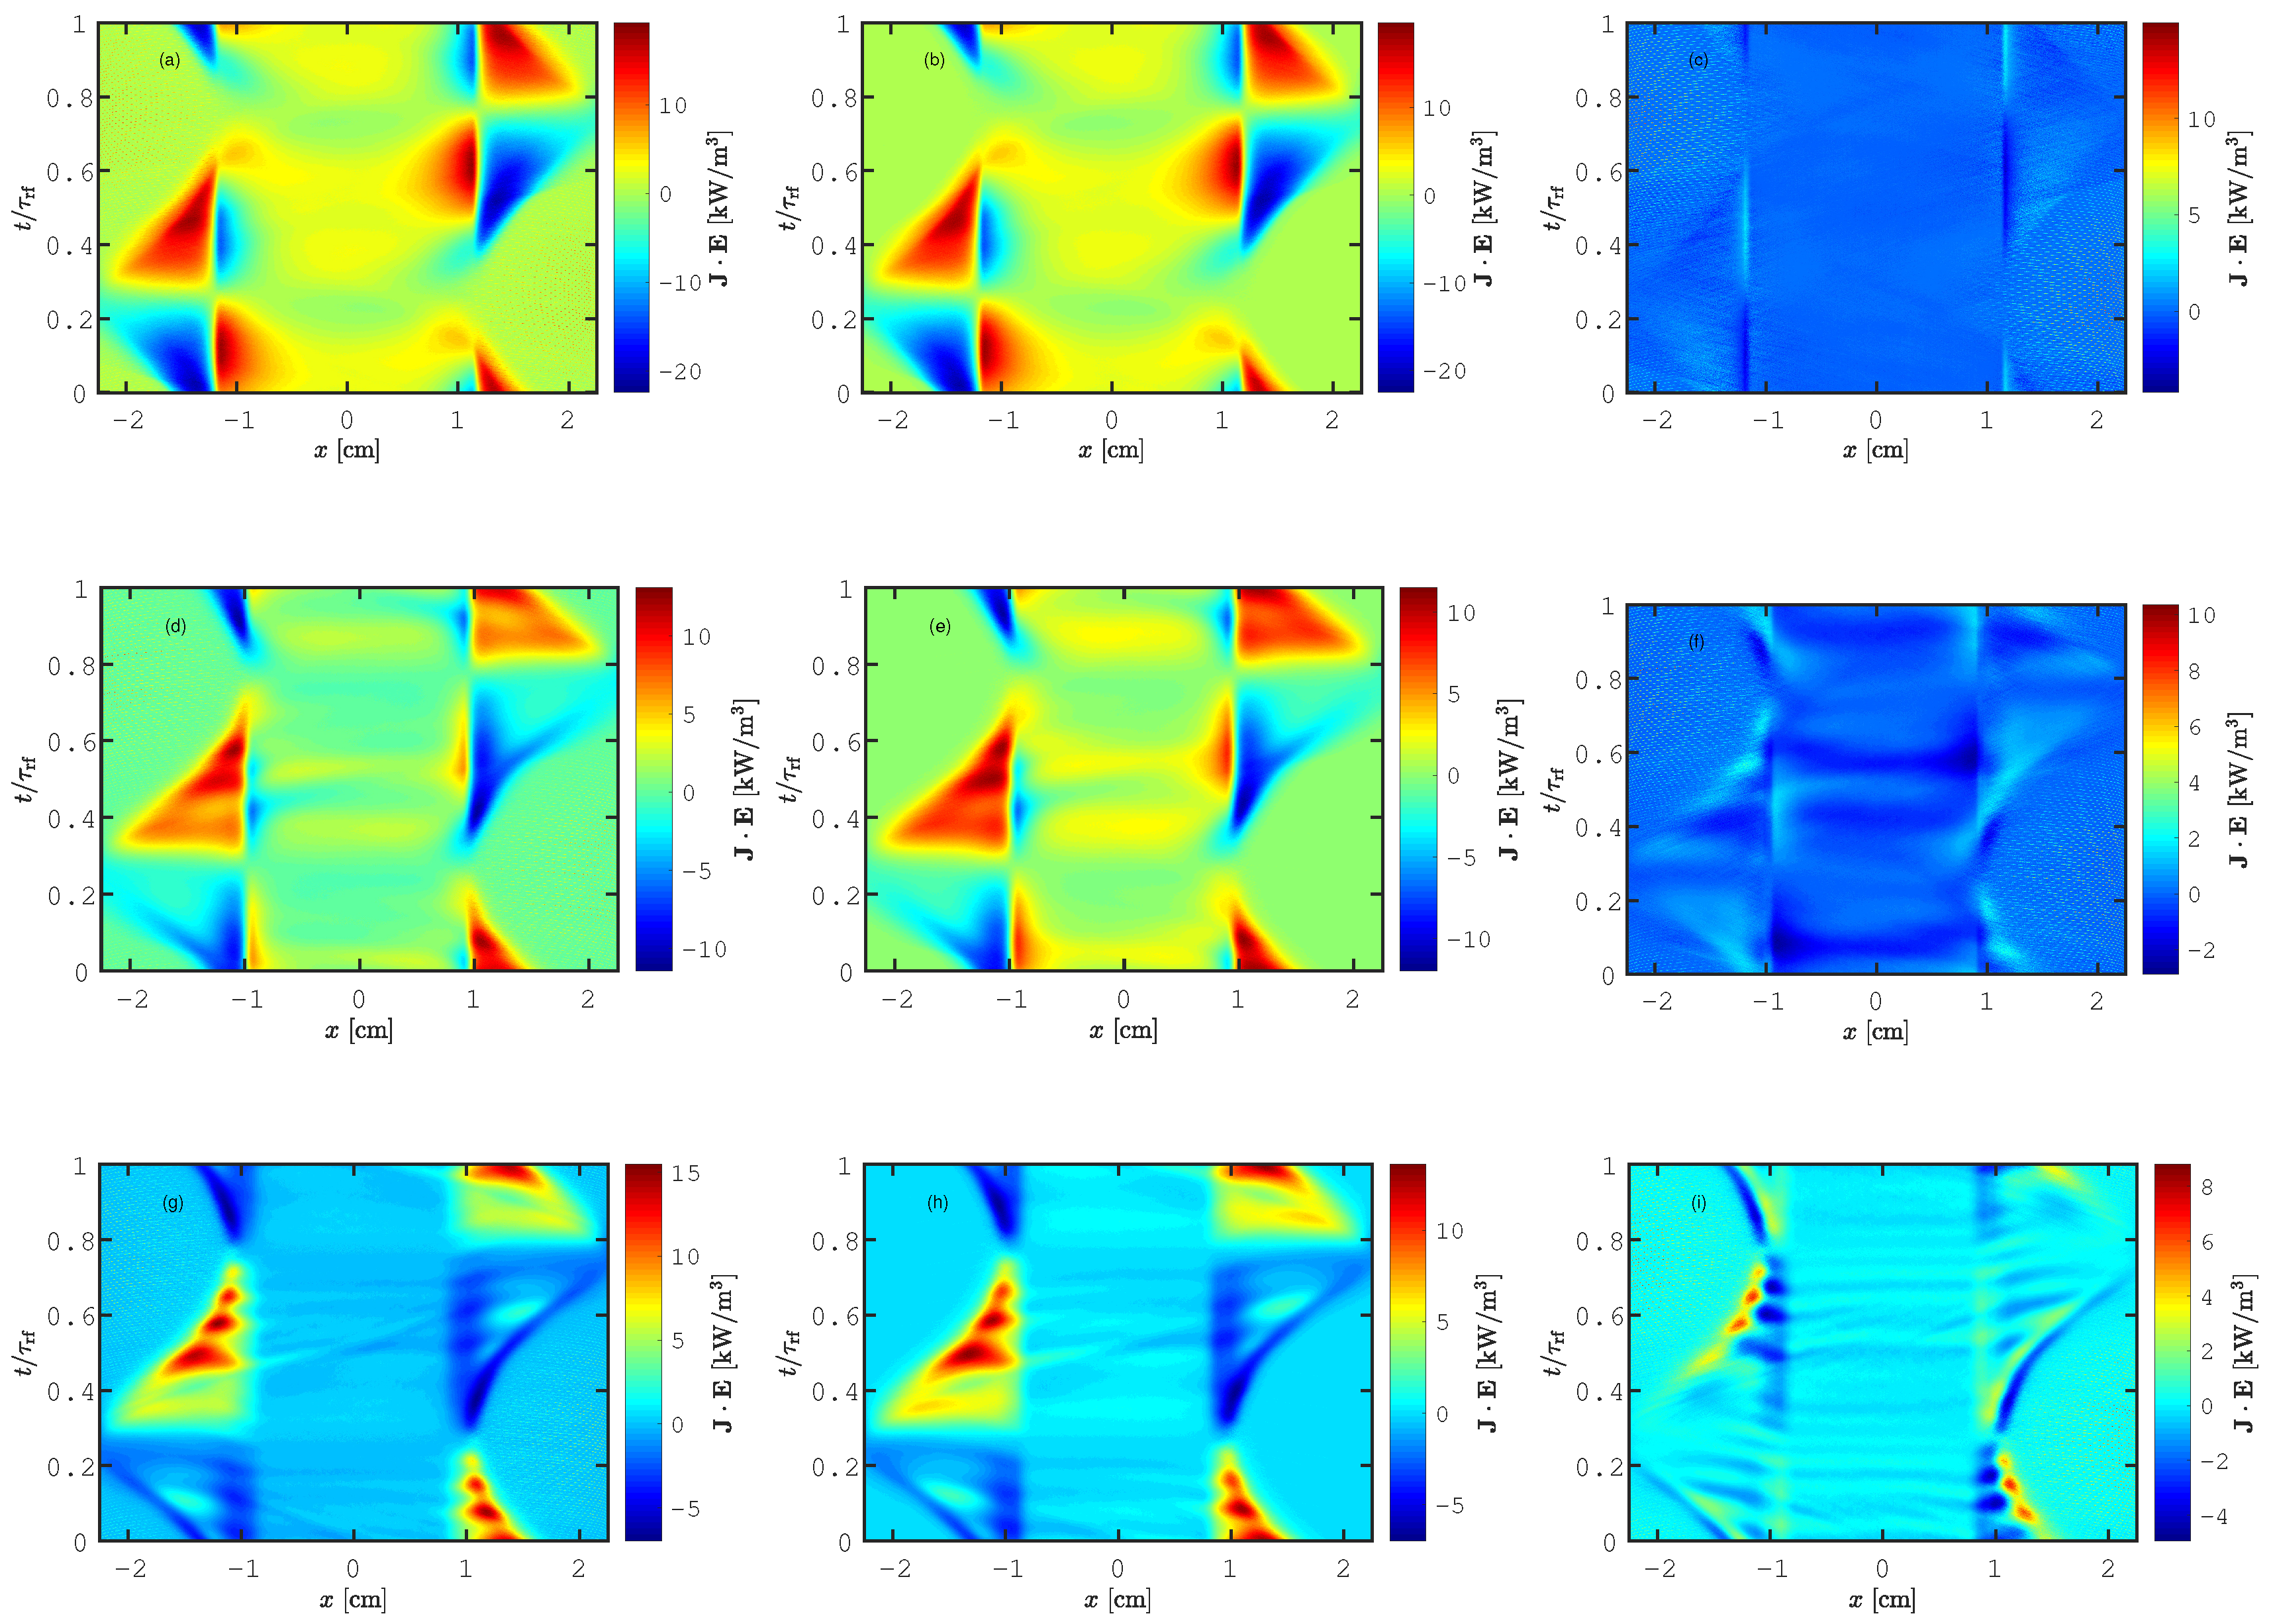
Figure 4 shows the spatio-temporal behavior of the electron power absorption , where and are the spatially and temporally-varying electron current density and electric field, respectively. The figures show the electron power absorption for the various combinations of pressures, including and excluding secondary electron emission, while excluding electron reflection from the electrodes. For each of the figures, the abscissa covers the whole inter-electrode gap, from the powered electrode on the left-hand size to the grounded electrode on the right-hand size. Similarly, the ordinate covers the full rf cycle. Note that each of the six figures may have different magnitude scales, represented by the color scales on the right-hand side of each figure. Therefore, there can be differences in the six figures, not only qualitative, but also quantitative. Figure 4a,b shows the spatio-temporal behavior of the electron power absorption including and excluding at 10 mTorr, respectively. Figure 4c shows the difference between including and excluding the ion-induced secondary electron emission from the electrodes. In Figure 4a,b, the most significant heating is observed in the sheath region, during the sheath expansion, and the most significant cooling is observed during the sheath collapse. Here, significant energy gain (red and yellow areas) and small energy loss (dark blue areas) were evident within the plasma bulk region. We observe electron heating during the sheath collapse on the bulk side of the edge of the collapsing sheath (next to the instantaneous anode), while there was cooling (electrons loose energy) on the electrode side (the lower left-hand corner and upper center on the right-hand side). This kind of electron heating structure was observed experimentally in a capacitively-coupled SF/N discharge [42] and SiH discharge [43] using spatiotemporal optical emission spectroscopy. This heating mechanism was explored further using the relaxation continuum model [44], where electron heating due to three processes was identified: sheath expansion (-mode), high electric field within the bulk, and ionization due to formation of a double layer on the instantaneous anode side, which resulted in acceleration of electrons. Indeed, in electronegative discharges, this electron heating within the plasma bulk can be the dominating electron heating mechanism [42,44]. This heating mechanism, which is due to electrons that are accelerated by strong drift and ambipolar electric fields within the plasma bulk and at the sheath edges in strongly electronegative discharges, was later coined as drift ambipolar (DA) electron heating [45]. In highly electronegative discharges, these electrons are often found to dominate the ionization processes. As seen in Figure 3b, the electronegativity was high ∼110 at 10 mTorr, which is essential for the DA-heating to be effective. The electron heating occurred both within the bulk and in the sheath regions, and a hybrid DA- and -mode heating was observed. By looking at the time averaged electron heating profile in Figure 2a, we see that there was electron cooling in the sheath region and all the electron heating occurred in the bulk region averaged over one rf cycle. Figure 4c shows that there were no significant differences in the power absorption between the two cases, and in fact, there was a slightly higher electron heating within the discharge when secondary electron emission was excluded. Figure 4d,e shows the spatio-temporal behavior of the electron power absorption for and , respectively, at 25 mTorr. Figure 4f shows the difference between including and excluding secondary electron emission from the electrodes. At 25 mTorr, a transition process was observed. Indeed, Figure 4e shows that the heating and the cooling in the sheath regions were reduced, while Figure 4d shows that a significant contribution to the electron heating in the bulk region was observed. Therefore, a hybrid DA- and -mode heating was observed, where the DA-heating was more important when secondary electron emission was excluded (Figure 4e) than when it was included (Figure 4d). This is clearly seen in the difference plot shown in Figure 4f when cooling was seen as the difference. We see in Figure 2b that in this case, the time averaged power absorption was observed both in the plasma bulk, as well as in the sheath regions. Figure 4g,h shows the spatio-temporal behavior of the electron power absorption for and at 50 mTorr, respectively. Figure 4i shows the difference between including secondary electron emission (Figure 4g) and excluding secondary electron emission (Figure 4h). Here, the electron heating rate in the sheath regions reduced again, and there was almost no heating in the plasma bulk, as seen in Figure 4g,h; a pure -mode was observed for both plots. This is clearly seen in Figure 2a when averaged over the rf cycle. As seen from the difference plot shown in Figure 4i, the electron heating in the sheath region was quantitatively more important for than for . There was clearly higher electron heating at sheath expansion when secondary electron emission was included. However, including ion-induced secondary electron emission from the electrodes decreased the overall electron power absorption.
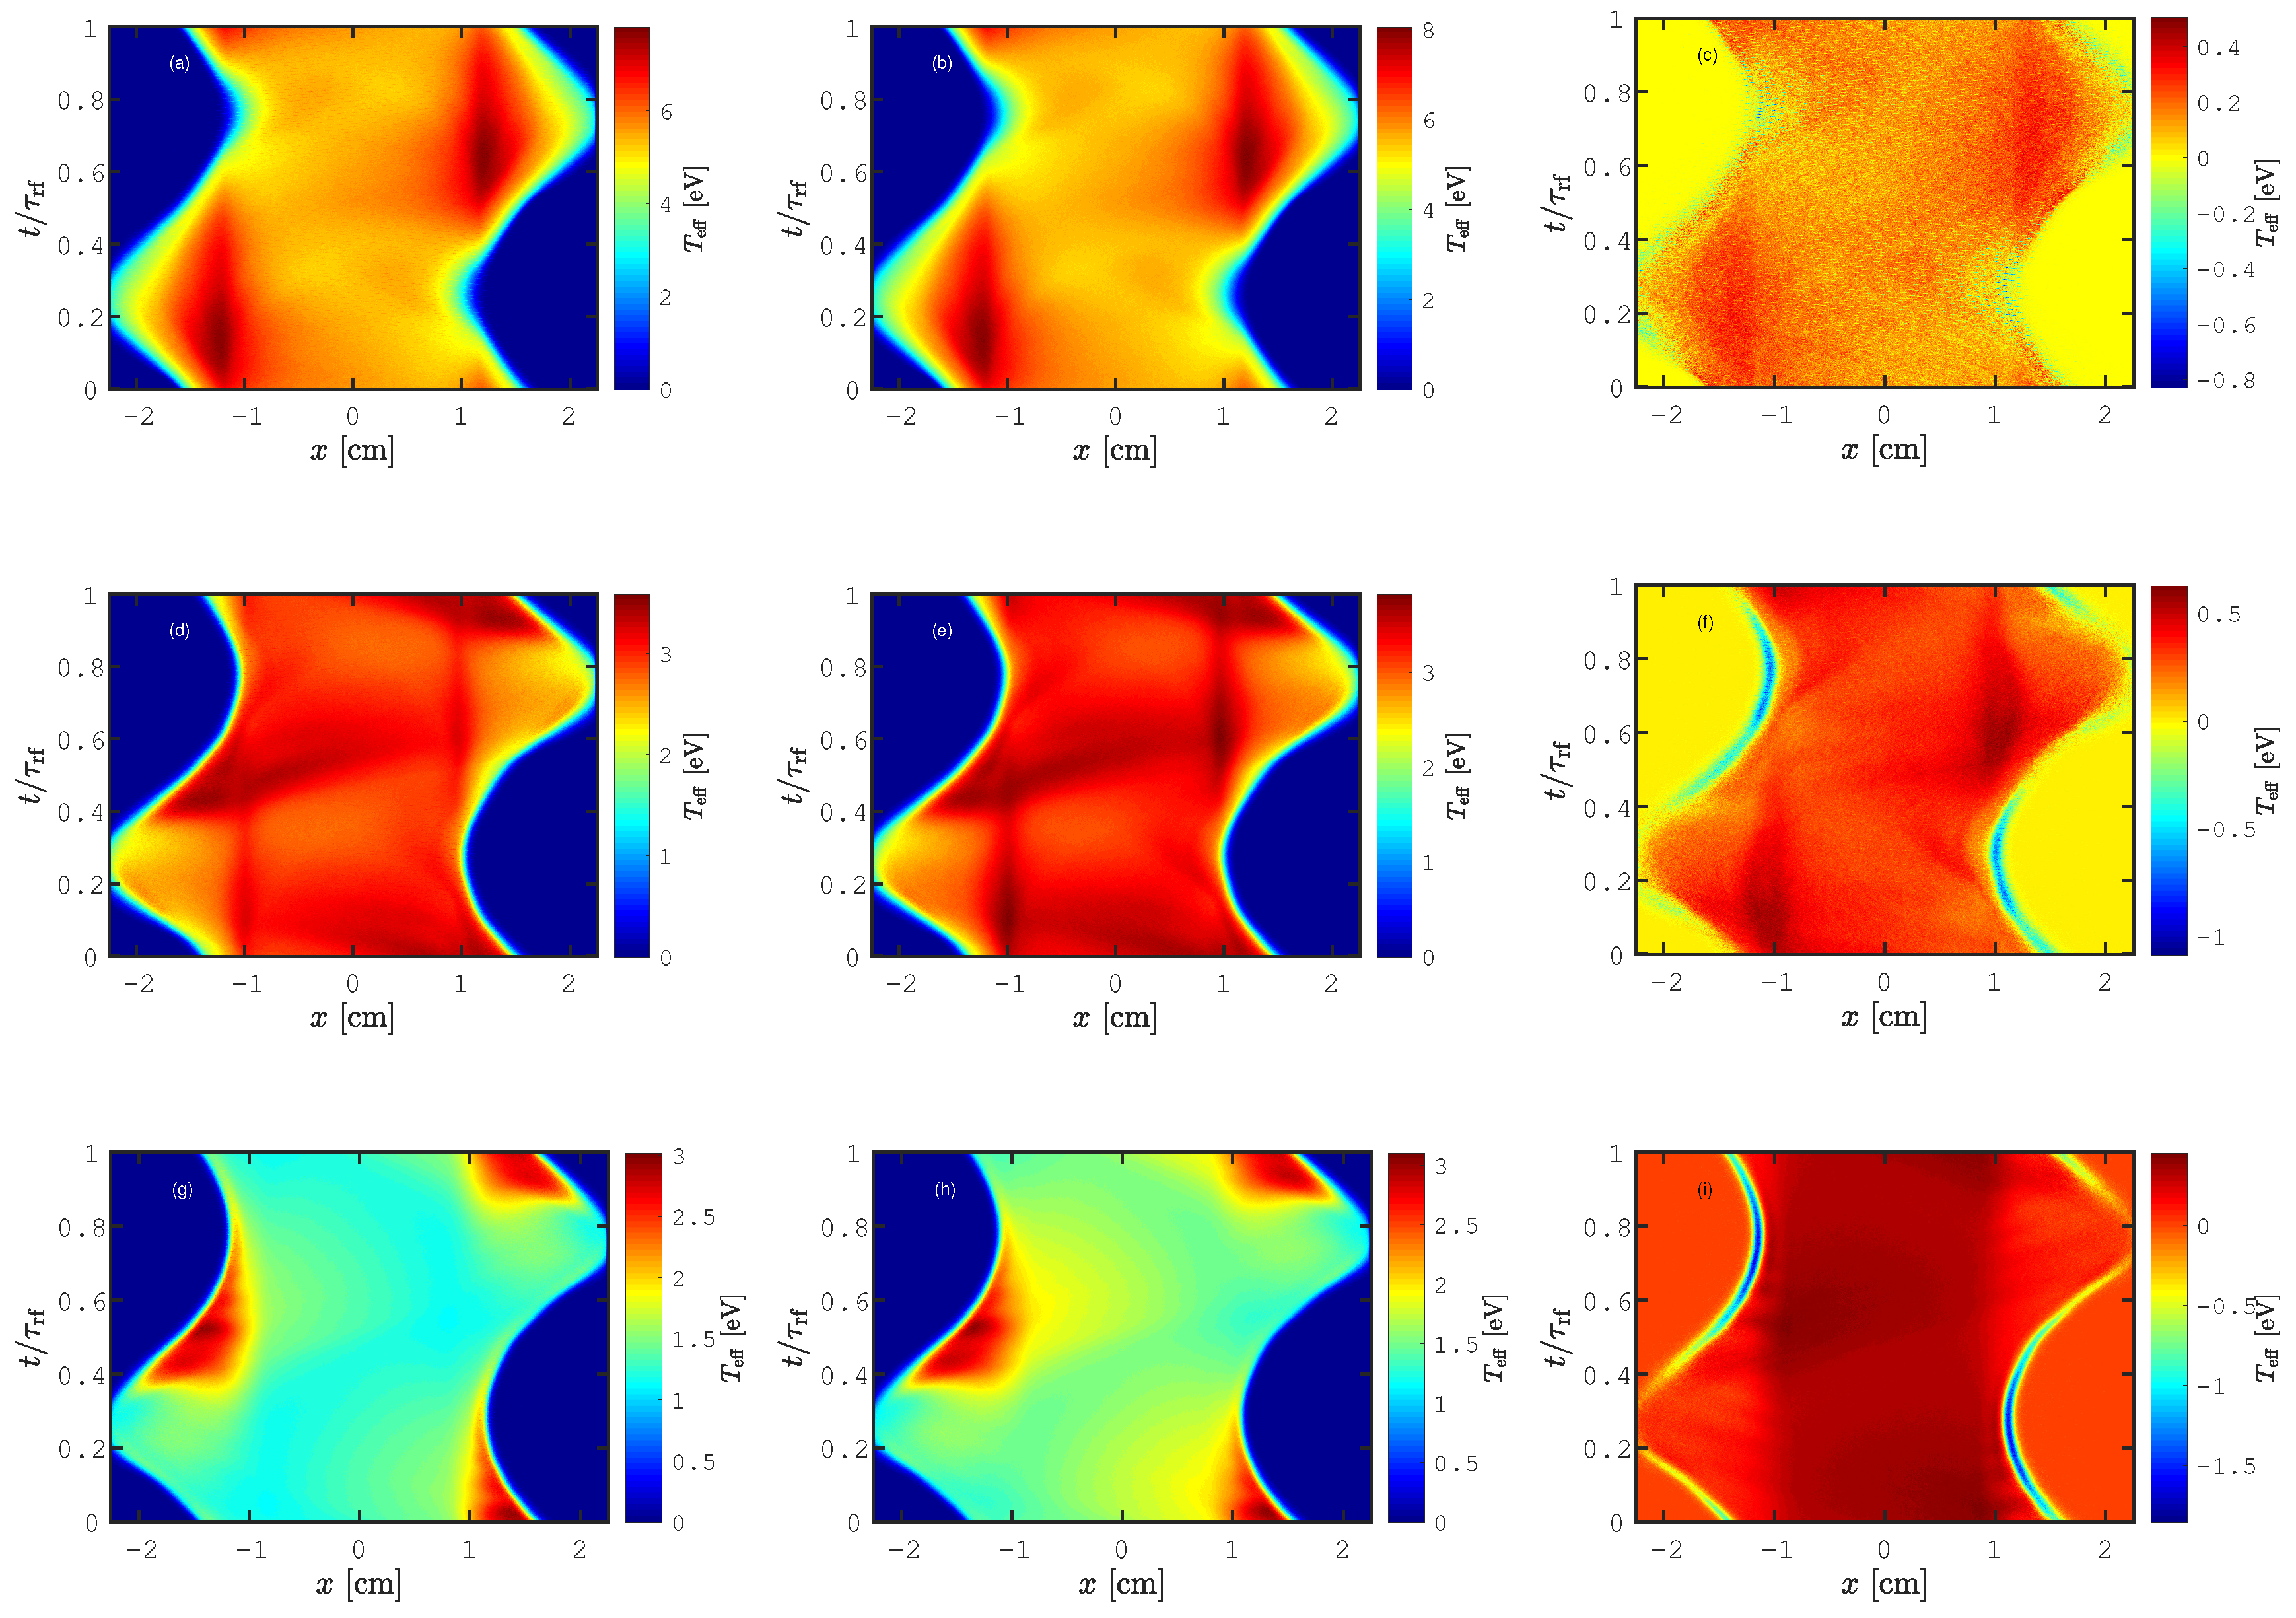
Figure 5 shows the spatio-temporal behavior of the effective electron temperature. It shows the effective electron temperature as a function of position between the electrodes within one rf cycle, for the various combinations of pressures including and excluding secondary electron emission from the electrodes. At 10 mTorr, the effective electron temperature was high within the plasma bulk, and no important difference was observed in the spatio-temporal behavior of the effective electron temperature between and , as seen in Figure 5a,b, respectively. A peak in the effective electron temperature was observed within the bulk region on the instantaneous anode side and agrees with the region of peak electron heating seen in Figure 4a,b. The difference in the effective electron temperature calculated excluding and including the secondary electron emission is seen in Figure 5c. We see that the effective electron temperature within the plasma bulk was slightly higher when secondary electron emission was included. The peaks in the effective electron temperature were higher when secondary electron emission was included. We also observe that the effective electron temperature had a peak within the plasma bulk at the instantaneous anode side and at the sheath expansion at 25 mTorr for both and , as seen in Figure 5d,e, respectively. This is clearly seen in the difference plot in Figure 5f. The electron effective temperature was higher for than for in the bulk region. In particular, the peak in the bulk region on the instantaneous anode side increased when secondary electron emission was included. At 50 mTorr, we observe a peak in the effective electron temperature during the sheath expansion. We also see that there was an increase in the effective electron temperature within the bulk when secondary electron emission was included. For , the effective electron temperature in the bulk and in the sheath region was lower than when secondary electron emission was included, as seen in Figure 5g,h. This behavior is clearly manifest in the difference plot shown in Figure 5i. At all pressures, we found that including secondary electron emission in the discharge model increased the electron energy.
4. Conclusions
The one-dimensional object-oriented PIC/MCC code oopd1 was applied to explore the evolution of the EEPF and of the electron heating mechanism in a capacitively-coupled oxygen discharge while including and excluding the ion-induced secondary electron emission and electron reflection. Adding secondary electron emission enhances the EEPF with a high energy tail for all the pressures. At 10 mTorr, the EEPF curves outwards. The electron heating at 10 mTorr is a hybrid DA- and -mode heating, and no significant difference is observed including and excluding secondary electron emission from the electrodes. Averaged over one rf cycle, a predominance of the electron heating in the plasma bulk was observed for all the cases. At 25 mTorr, the shape of the EEPF starts to develop an inward curving behavior and a hybrid DA- and -mode heating is observed. The role of sheath heating increases when secondary electron emission from the electrodes is included in the simulation. At 50 mTorr, the transition, which had already started at 25 mTorr, is fully accomplished, and the shape of the EEPF is now bi-Maxwellian, while no electron heating is observed in the plasma bulk.
Author Contributions
Conceptualization, J.T.G. and A.P.; Formal Analysis, A.P. and J.T.G.; Investigation, A.P. and J.T.G.; Resources, J.T.G.; Data Curation, A.P.; Writing—Original Draft Preparation, J.T.G. and A.P.; Writing—Review & Editing, J.T.G. and A.P.; Supervision, J.T.G.; Project Administration, J.T.G.; Funding Acquisition, J.T.G.
Funding
This work was partially supported by the Icelandic Research Fund Grant No. 163086, the University of Iceland Research Fund, and the Swedish Government Agency for Innovation Systems (VINNOVA) Contract No. 2014-04876.
Conflicts of Interest
The authors declare no conflict of interest.
References
- Donkó, Z.; Schulze, J.; Czarnetzki, U.; Derzsi, A.; Hartmann, P.; Korolov, I.; Schüngel, E. Fundamental investigations of capacitive radio frequency plasmas: Simulations and experiments. Plasma Phys. Control. Fusion 2012, 54, 124003. [Google Scholar] [CrossRef]
- Derzsi, A.; Korolov, I.; Schüngel, E.; Donkó, Z.; Schulze, J. Effects of fast atoms and energy-dependent secondary electron emission yields in PIC/MCC simulations of capacitively coupled plasmas. Plasma Sources Sci. Technol. 2015, 24, 034002. [Google Scholar] [CrossRef] [Green Version]
- Daksha, M.; Derzsi, A.; Wilczek, S.; Trieschmann, J.; Mussenbrock, T.; Awakowicz, P.; Donkó, Z.; Schulze, J. The effect of realistic heavy particle induced secondary electron emission coeffcients on the electron power absorption dynamics in single- and dual-frequency capacitively coupled plasma. Plasma Sources Sci. Technol. 2017, 26, 085006. [Google Scholar] [CrossRef]
- Birdsall, C.K. Particle-in-cell charged-particle simulations, plus Monte Carlo collisions with neutral atoms, PIC-MCC. IEEE Trans. Plasma Sci. 1991, 19, 65–85. [Google Scholar] [CrossRef]
- Verboncoeur, J.P. Particle simulation of plasmas: Review and advances. Plasma Phys. Control. Fusion 2005, 47, A231–A260. [Google Scholar] [CrossRef]
- Tskhakaya, D.; Matyash, K.; Schneider, R.; Taccogna, F. The Particle-In-Cell Method. Contrib. Plasma Phys. 2007, 47, 563–594. [Google Scholar] [CrossRef]
- Vahedi, V.; Surendra, M. A Monte Carlo collision model for the particle-in-cell method: Applications to argon and oxygen discharges. Comput. Phys. Commun. 1995, 87, 179–198. [Google Scholar] [CrossRef]
- Lee, S.H.; Iza, F.; Lee, J.K. Particle-in-cell Monte Carlo and fluid simulations of argon-oxygen plasma: Comparisons with experiments and validations. Phys. Plasmas 2006, 13, 057102. [Google Scholar] [CrossRef] [Green Version]
- Lichtenberg, A.J.; Vahedi, V.; Lieberman, M.A.; Rognlien, T. Modeling electronegative plasma discharges. J. Appl. Phys. 1994, 75, 2339–2347. [Google Scholar] [CrossRef]
- Babaeva, N.Y.; Lee, J.K.; Shon, J.W.; Hudson, E.A. Oxygen ion energy distribution: Role of ionization, resonant, and nonresonant charge-exchange collisions. J. Vac. Sci. Technol. A 2005, 23, 699–704. [Google Scholar] [CrossRef] [Green Version]
- Roberto, M.; Verboncoeur, J.; Verdonck, P.; Cizzoto, E. Effects of the Secondary Electron Emision Coefficent on the Generation of Charged Particles in RF Oxygen Discharge. ECS Trans. 2006, 4, 563–571. [Google Scholar]
- Bronold, F.X.; Matyash, K.; Schneider, D.T.R.; Fehske, H. Radio-frequency discharges in oxygen: I. Particle-based modelling. J. Phys. D Appl. Phys. 2007, 40, 6583–6592. [Google Scholar] [CrossRef] [Green Version]
- Matyash, K.; Schneider, R.; Dittmann, K.; Meichsner, J.; Bronold, F.X.; Tskhakaya, D. Radio-frequency discharges in oxygen: III. Comparison of modelling and experiment. J. Phys. D Appl. Phys. 2007, 40, 6601–6607. [Google Scholar] [CrossRef]
- Schüngel, E.; Zhang, Q.Z.; Iwashita, S.; Schulze, J.; Hou, L.J.; Wang, Y.N.; Czarnetzki, U. Control of plasma properties in capacitively coupled oxygen discharges via the electrical asymmetry effect. J. Phys. D Appl. Phys. 2011, 44, 285205. [Google Scholar] [CrossRef] [Green Version]
- Zhang, Q.Z.; Jiang, W.; Hou, L.J.; Wang, Y.N. Numerical simulations of electrical asymmetry effect on electronegative plasmas in capacitively coupled rf discharge. J. Appl. Phys. 2011, 109, 013308. [Google Scholar] [CrossRef]
- Derzsi, A.; Lafleur, T.; Booth, J.P.; Korolov, I.; Donkó, Z. Experimental and simulation study of a capacitively coupled oxygen discharge driven by tailored voltage waveforms. Plasma Sources Sci. Technol. 2016, 25, 015004. [Google Scholar] [CrossRef]
- Derzsi, A.; Bruneau, B.; Gibson, A.; Johnson, E.; O’Connell, D.; Gans, T.; Booth, J.P.; Donkó, Z. Power coupling mode transitions induced by tailored voltage waveforms in capacitive oxygen discharges. Plasma Sources Sci. Technol. 2017, 26, 034002. [Google Scholar] [CrossRef] [Green Version]
- Bera, K.; Rauf, S.; Collins, K. PIC-MCC/Fluid Hybrid Model for Low Pressure Capacitively Coupled O2 Plasma. AIP Conf. Proc. 2011, 1333, 1027–1032. [Google Scholar]
- Bera, K.; Rauf, S.; Collins, K. Plasma Dynamics in Low-Pressure Capacitively Coupled Oxygen Plasma Using PIC–MCC/Fluid Hybrid Model. IEEE Trans. Plasma Sci. 2011, 39, 2576–2577. [Google Scholar] [CrossRef]
- Gudmundsson, J.T.; Kawamura, E.; Lieberman, M.A. A benchmark study of a capacitively coupled oxygen discharge of the oopd1 particle-in-cell Monte Carlo code. Plasma Sources Sci. Technol. 2013, 22, 035011. [Google Scholar] [CrossRef]
- Gudmundsson, J.T.; Lieberman, M.A. On the role of metastables in capacitively coupled oxygen discharges. Plasma Sources Sci. Technol. 2015, 24, 035016. [Google Scholar] [CrossRef]
- Hannesdottir, H.; Gudmundsson, J.T. The role of the metastable O and energy-dependent secondary electron emission yields in capacitively coupled oxygen discharges. Plasma Sources Sci. Technol. 2016, 25, 055002. [Google Scholar] [CrossRef]
- Gudmundsson, J.T.; Ventéjou, B. The pressure dependence of the discharge properties in a capacitively coupled oxygen discharge. J. Appl. Phys. 2015, 118, 153302. [Google Scholar] [CrossRef]
- Gudmundsson, J.T.; Hannesdottir, H. On the role of metastable states in low pressure oxygen discharges. AIP Conf. Proc. 2017, 1811, 120001. [Google Scholar] [Green Version]
- Hannesdottir, H.; Gudmundsson, J.T. On singlet metastable states, ion flux and ion energy in single and dual frequency capacitively coupled oxygen discharges. J. Phys. D Appl. Phys. 2017, 50, 175201. [Google Scholar] [CrossRef]
- Gudmundsson, J.T.; Snorrason, D.I. On electron heating in a low pressure capacitively coupled oxygen discharge. J. Appl. Phys. 2017, 122, 193302. [Google Scholar] [CrossRef] [Green Version]
- Gudmundsson, J.T.; Snorrason, D.I.; Hannesdottir, H. The frequency dependence of the discharge properties in a capacitively coupled oxygen discharge. Plasma Sources Sci. Technol. 2018, 27, 025009. [Google Scholar] [CrossRef] [Green Version]
- Bojarov, A.; Radmilović-Radjenović, M.; Petrović, Z.L. The influence of the ion induced secondary electron emission on the characteristics of rf plasmas. Publ. Astron. Obs. Belgrade 2010, 89, 131–134. [Google Scholar]
- Lafleur, T.; Chabert, P.; Booth, J.P. Secondary electron induced asymmetry in capacitively coupled plasmas. J. Phys. D Appl. Phys. 2013, 46, 135201. [Google Scholar] [CrossRef]
- Korolov, I.; Derzsi, A.; Donkó, Z.; Schulze, J. The influence of the secondary electron induced asymmetry on the electrical asymmetry effect in capacitively coupled plasmas. Appl. Phys. Lett. 2013, 103, 064102. [Google Scholar] [CrossRef] [Green Version]
- Radmilović-Radjenović, M.; Petrović, Z.L. Influence of the surface conditions on rf plasma characteristics. Eur. Phys. J. D 2009, 54, 445–449. [Google Scholar] [CrossRef]
- Bojarov, A.; Radmilović-Radjenović, M.; Petrović, Z.L. Modeling the effects of the secondary electron emission in a dual-frequency capacitively coupled plasma reactor. In Proceedings of the 20th Europhysics Sectional Conference on Atomic and Molecular Physics of Ionized Gases (ESCAMPIG XX), Novi Sad, Serbia, 13–17 July 2010; p. P2.38. [Google Scholar]
- Bojarov, A.; Radmilović-Radjenović, M.; Petrović, Z.L. Particle in cell simulation of the electrical asymmetric effect with a realistic model of the ion induced secondary electron emission. In Proceedings of the 27th Summer School and International Symposium on the Physics of Ionized Gases, Belgrade, Serbia, 26–29 August 2014; pp. 407–410. [Google Scholar]
- Hammel, J.; Verboncoeur, J.P. DC Discharge Studies Using PIC-MCC. Bull. Am. Phys. Soc. 2003, 48, 66. [Google Scholar]
- Verboncoeur, J.P.; Langdon, A.B.; Gladd, N.T. An object-oriented electromagnetic PIC code. Comput. Phys. Commun. 1995, 87, 199–211. [Google Scholar] [CrossRef]
- Kawamura, E.; Birdsall, C.K.; Vahedi, V. Physical and numerical methods of speeding up particle codes and paralleling as applied to RF discharges. Plasma Sources Sci. Technol. 2000, 9, 413–428. [Google Scholar] [CrossRef]
- Proto, A.; Gudmundsson, J.T. The role of surface quenching of the singlet delta molecule in a capacitively coupled oxygen discharge. Plasma Sources Sci. Technol. 2018, 27, 074002. [Google Scholar] [CrossRef] [Green Version]
- Booth, J.P.; Sadeghi, N. Oxygen and fluorine kinetics in electron cyclotron resonance plasmas by time-resolved actinometry. J. Appl. Phys. 1991, 70, 611–620. [Google Scholar] [CrossRef]
- O’Brien, R.J.; Myers, G.H. Direct flow measurement of O quenching rates. J. Chem. Phys. 1970, 53, 3832–3835. [Google Scholar] [CrossRef]
- Kollath, R. Sekundärelektronen-Emission fester Körper bei Bestrahlung mit Elektronen. In Elektronen-Emission Gasentladungen I; Flügge, S., Ed.; Handbuch der Physik; Springer: Berlin, Germany, 1956; Volume 21, pp. 232–303. [Google Scholar]
- Braginsky, O.; Kovalev, A.; Lopaev, D.; Proshina, O.; Rakhimova, T.; Vasilieva, A.; Voloshin, D.; Zyryanov, S. Experimental and theoretical study of dynamic effects in low-frequency capacitively coupled discharges. J. Phys. D Appl. Phys. 2012, 45, 015201. [Google Scholar] [CrossRef]
- Petrović, Z.L.; Tochikubo, F.; Kakuta, S.; Makabe, T. Spatiotemporal optical emission spectroscopy of rf discharges in SF6. J. Appl. Phys. 1993, 73, 2163–2172. [Google Scholar] [CrossRef]
- Makabe, T.; Tochikubo, F.; Nishimura, M. Influence of negative ions in rf glow discharges in SiH4 at 13.56 MHz. Phys. Rev. A 1990, 42, 3674–3677. [Google Scholar] [CrossRef] [PubMed]
- Nakano, N.; Shimura, N.; Petrović, Z.L.; Makabe, T. Simulations of rf glow discharges in SF6 by the relaxation continuum model: Physical structure and function of the narrow-gap reactive-ion etcher. Phys. Rev. E 1994, 49, 4455–4465. [Google Scholar] [CrossRef]
- Schulze, J.; Derzsi, A.; Dittmann, K.; Hemke, T.; Meichsner, J.; Donkó, Z. Ionization by drift and ambipolar electric fields in electronegative capacitive radio frequency plasmas. Phys. Rev. Lett. 2011, 107, 275001. [Google Scholar] [CrossRef] [PubMed]
Figure 1.
The electron energy probability function (EEPF) in the discharge center for a parallel plate capacitively-coupled oxygen discharge at (a) 10 mTorr, (b) 25 mTorr, and (c) 50 mTorr with a surface quenching coefficient for the singlet metastable molecule as and a gap separation of 4.5 cm driven by a 222 V voltage source at a driving frequency of 13.56 MHz.

Figure 2.
The time averaged electron heating profile for a parallel plate capacitively-coupled oxygen discharge at (a) 10 mTorr, (b) 25 mTorr, and (c) 50 mTorr with a surface quenching coefficient for the singlet metastable molecule as and a gap separation of 4.5 cm driven by a 222 V voltage source at a driving frequency of 13.56 MHz.

Figure 3.
The (a) electron density and the (b) electronegativity in the discharge center as a function of pressure for a parallel plate capacitively-coupled oxygen discharge with a surface quenching coefficient for the singlet metastable molecule as and a gap separation of 4.5 cm driven by a 222 V voltage source at a driving frequency of 13.56 MHz.

Figure 4.
The spatio-temporal behavior of the electron power absorption for a parallel plate capacitively-coupled oxygen discharge at 10 mTorr for (a) and (b) , (c) the difference between and , at 25 mTorr, for (d) and (e) , (f) the difference between and , at 50 mTorr for, (g) and (h) , and (i) the difference between and with a surface quenching coefficient for the singlet metastable molecule as , , and a gap separation of 4.5 cm driven by a 222 V voltage source at a driving frequency of 13.56 MHz.

Figure 5.
The spatio-temporal behavior of the effective electron temperature for a parallel plate capacitively-coupled oxygen discharge at 10 mTorr for (a) and (b) , (c) the difference between and , at 25 mTorr, for (d) , and (e) , (f) the difference between and , at 50 mTorr for, (g) and (h) , and (i) the difference between and with a surface quenching coefficient for the singlet metastable molecule as , , and a gap separation of 4.5 cm driven by a 222 V voltage source at a driving frequency of 13.56 MHz.


Table 1.
The parameters of the simulation, the particle weight, and the energy threshold above which kinetics of the neutral particles are followed.
Table 1.
The parameters of the simulation, the particle weight, and the energy threshold above which kinetics of the neutral particles are followed.
| Species | Particle Weight | Energy Threshold (meV) |
|---|---|---|
| O | 500 | |
| O() | 100 | |
| O() | 100 | |
| O(P) | 500 | |
| O(D) | 50 | |
| O | - | |
| O | - | |
| O | - | |
| e | - |
Table 2.
The partial pressures of the thermal neutrals at 10, 25, and 50 mTorr for the wall quenching coefficient for the singlet metastable molecule O(a of calculated by a global (volume averaged) model.
Table 2.
The partial pressures of the thermal neutrals at 10, 25, and 50 mTorr for the wall quenching coefficient for the singlet metastable molecule O(a of calculated by a global (volume averaged) model.
| Pressure | O | Oa | Ob | OP) |
|---|---|---|---|---|
| 10 mTorr | ||||
| 25 mTorr | ||||
| 50 mTorr |
© 2018 by the authors. Licensee MDPI, Basel, Switzerland. This article is an open access article distributed under the terms and conditions of the Creative Commons Attribution (CC BY) license (http://creativecommons.org/licenses/by/4.0/).
Share and Cite
MDPI and ACS Style
Proto, A.; Gudmundsson, J.T. The Influence of Secondary Electron Emission and Electron Reflection on a Capacitively Coupled Oxygen Discharge. Atoms 2018, 6, 65. https://doi.org/10.3390/atoms6040065
AMA Style
Proto A, Gudmundsson JT. The Influence of Secondary Electron Emission and Electron Reflection on a Capacitively Coupled Oxygen Discharge. Atoms. 2018; 6(4):65. https://doi.org/10.3390/atoms6040065
Chicago/Turabian StyleProto, Andrea, and Jon Tomas Gudmundsson. 2018. "The Influence of Secondary Electron Emission and Electron Reflection on a Capacitively Coupled Oxygen Discharge" Atoms 6, no. 4: 65. https://doi.org/10.3390/atoms6040065
Note that from the first issue of 2016, this journal uses article numbers instead of page numbers. See further details here.