Abstract
A hand-held laser-induced breakdown spectroscopy device was used to acquire spectral emission data from laser-induced plasmas created on the surface of cerium-gallium alloy samples with Ga concentrations ranging from 0–3 weight percent. Ionic and neutral emission lines of the two constituent elements were then extracted and used to generate calibration curves relating the emission line intensity ratios to the gallium concentration of the alloy. The Ga I 287.4-nm emission line was determined to be superior for the purposes of Ga detection and concentration determination. A limit of detection below 0.25% was achieved using a multivariate regression model of the Ga I 287.4-nm line ratio versus two separate Ce II emission lines. This LOD is considered a conservative estimation of the technique’s capability given the type of the calibration samples available and the low power (5 mJ per 1-ns pulse) and resolving power (/ = 4000) of this hand-held device. Nonetheless, the utility of the technique is demonstrated via a detailed mapping analysis of the surface Ga distribution of a Ce-Ga sample, which reveals significant heterogeneity resulting from the sample production process.
1. Introduction
Laser-induced breakdown spectroscopy (LIBS) systems have shown increasing promise to bolster current capabilities for chemical analysis, particularly for cases involving the need for near real-time, standoff, and/or in situ sampling with little to no sample preparation. This is often desired in applications involving hazardous materials or the monitoring of industrial processes. Nuclear forensics is one such application where LIBS has found significant application [1]. Several studies have demonstrated the ability of LIBS to detect nuclear material in matrices relevant to the nuclear community, such as geological deposits [2,3], uranium ores [4,5], and surrogate nuclear debris [6]. Other studies validated the use of LIBS in nuclear safeguard applications, including analysis of IAEAswipe samples [7], nuclear reprocessing plant activities [8], and standoff detection of radiological threat materials [9]. Recently, Harilal et al. summarized the advancements in LIBS and other optical techniques to conduct isotopic analysis in laser-produced plasmas (LPPs) [10]. Portable hand-held LIBS (HH-LIBS) systems, such as the SciAps Z500-ER [11], have demonstrated the ability to detect uranyl fluoride contamination in metallic and sand substrates at a level of 250 ppm, as well as rare earths in uranium matrices [12,13]. This work demonstrates the capability of a HH-LIBS to conduct rapid chemical analysis of cerium alloys for the first time.
Cerium, a lanthanide series metal, is a common chemical surrogate for plutonium. Cerium metal has similar physical and chemical properties to plutonium [14], and previous studies have used cerium as a nonradioactive substitute for plutonium to gain insights into plutonium behavior [15,16,17,18]. This use of cerium makes it a substance of interest to the nuclear forensics community. A particularly interesting property of cerium is its behavior when alloyed with gallium.
Gallium is a common fuel stabilizer material, alloyed with plutonium for use in nuclear applications [19]. Upon extraction from reprocessing, plutonium metal exists in its (monoclinic) phase; this phase is characterized by brittleness and large changes in atomic volume over small changes in temperature, making it a less than ideal candidate for machining into fuel rods or other nuclear components [20]. The (FCC) phase of Pu is malleable and much less sensitive to atomic volume changes; however, it only exists between 600 and 700 K [21]. A phase change could easily be achieved by heating plutonium metal; however, it cannot be stabilized at room temperature. In order to circumvent this problem, a stabilizer, such as gallium, is added in small amounts to the plutonium and alloyed through an annealing process. This stabilizes the phase at room temperature, allowing the metal to be machined [14]. Cerium can also be alloyed with gallium; Ce-Ga alloys have similar properties to Pu-Ga alloys, and studying them can provide useful insights into the behavior of Pu-Ga metals [15,17]. LIBS provides a promising avenue to analyze the Ce-Ga alloy production process. Being able to determine and map the Ga concentration rapidly in a metal alloy sample can provide an indication of the process used to create the sample, as the level of sample heterogeneity is sensitive to the temperatures, cooling rates, and equipment used in the alloy production process [22]. The use of LIBS to monitor a metallic alloy production process has been studied previously [23,24,25], but to our knowledge, this work represents the first study of a hand-held LIBS device to conduct such an analysis of a lanthanide metal alloy. The rest of the paper is organized as follows: the metallurgical processes used to create the Ce-Ga samples are described in Section 2. The HH-LIBS settings and mathematical pre-processing routines used in the data analysis are described in Section 3. Strong neutral and ionic emission lines of both elements are identified and analyzed in Section 4. Section 5 discusses the univariate calibration curves generated from emission peak intensity ratios and the limits of detection calculated from the fit parameters. A multivariate regression model fit to the data is discussed in Section 6. This model was then used to conduct a surface mapping analysis of the Ga concentration variation across a sample; the results are presented in Section 7.
2. Sample Manufacturing
The cerium and gallium alloy samples were made using a Thermo Scientific Thermolyne (Model Number FD1545M) resistive heating furnace. Cerium metal (99.9% purity) was obtained from Aldrich Chemistry, and gallium metal (99.99% purity) was obtained from Alfa Aesar. Preparation of the samples took place in an argon-filled glovebox with oxygen content nominally under 200 PPM. Between 10 and 20 g of cerium metal in chips of approximately 4 g each were weighed using a mass balance (Mettler Toledo PR2003 DeltaRange). Gallium metal was then heated to its liquid state (approximately 60 C) and measured out using a glass pipette to the desired concentration within the Ce-Ga alloy. The combined Ce-Ga was placed in a magnesium oxide crucible obtained through Fisher Scientific and heated in the furnace to 850 C and held at that temperature for 8 h. The furnace temperature was then reduced to 480 C and held for 12 h to anneal the samples. After annealing, the furnace was turned off and allowed to cool via natural convection down to room temperature. The crucible containing the Ce-Ga alloy was removed and cracked with a hammer to release the sample. Samples were then exposed to ambient air and humidity to grow an oxide layer. For the scope of this work, the Ce-Ga samples were exposed to air for over three months.
3. Spectral Acquisition and Pre-Processing
A commercially-available SciAps Z500-ER was used to collect spectral data from the alloy samples. The Z500-ER (Figure 1) is an industrial HH-LIBS device that uses a 5-mJ 1064-nm Nd:YAG laser at a repetition rate of 10 Hz to ablate the surface of a sample. Spectral emissions are then collected by a group of four on-board spectrometers and recorded by the device computer. The gate delay of the device was varied, and an optimal delay of 450 ns was determined to give the best signal while minimizing noise. Ten cleaning shots were used to ablate through the surface of any oxide layer that had developed on the sample surface. Additionally, an argon gas purge was used before each data shot to minimize the presence of spectral lines of air in the data. The automated raster function of the device was used to sample eight different surface locations three times each, and an average spectrum was saved.

Figure 1.
The SciAps Z500-ER hand-held (HH)-LIBS device used in this study.
The extracted peak data was then processed in a method similar to the one used for UO2F2 detection with this device [12] and based on well-established spectral pre-processing techniques that aid in quantitative analysis [26,27]. First, a signal removal method algorithm was employed to subtract the baseline from the spectra. Next, a five-point Savitzky–Golay (SG) filter was employed after analysis determined that it removed continuum noise from the peak while maintaining the peaks and valleys in the spectra. Finally, a third-order noise median method (NMM) function was used to further remove noise from the peak wings. The applied filter is shown in Figure 2. The filter parameters were optimized to maximize noise reduction and minimize peak information loss. Ensuring the filtering algorithms did not clip the peaks allowed for the highest accuracy in the peak ratio calculations for the calibration curves discussed further in Section 5.
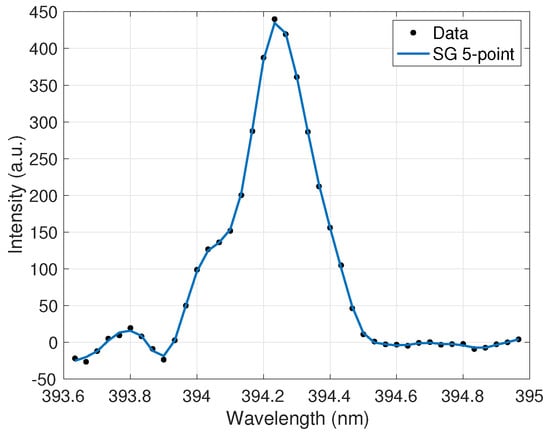
Figure 2.
Ce II 394.3-nm emission peak after effective smoothing and noise reduction by a five-point Savitzky–Golay (SG) filter.
4. Analytical Line Selection
Four emission lines (Ga I 287.4 nm, Ga I 294.4 nm, Ce II 394.3 nm, and Ce II 413.8 nm) were identified for use in building calibration curves. These lines appeared across all gallium concentrations tested and were relatively free from other spectral interferences. These lines were extracted from each spectrum and processed according to the routine described in Section 3. Figure 3 displays the behavior of the two selected gallium emission lines with varying gallium concentration levels in the alloy sample. The peak intensity increased as the weight percent of gallium in the alloy increased, as expected. These lines showed good responsiveness to gallium concentrations, and their line shapes suggested that the plasma was optically thin and free from self-absorption for these emissions.
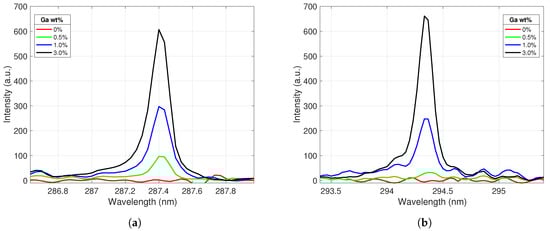
Figure 3.
Ga I emission peaks centered at (a) 287.4 nm and (b) 294.4 nm. The peak intensities increase as the gallium concentration in the alloy increases.
The Ce II peak behavior was similarly analyzed as a function of gallium concentration; the results are displayed in Figure 4. As expected, Ce II peak emission intensity decreased as the Ga concentration of the samples increased. The large drop in intensity between pure Ce and the 0.5% Ga sample was likely due to surface gallium crystallization diminishing the Ce peak intensity of some of the spectra taken from this lower concentration sample; this effect was then propagated to the averaged spectra. The recorded peak intensity ratios for the selected gallium and cerium emission lines were further analyzed to create calibration curves for the samples.
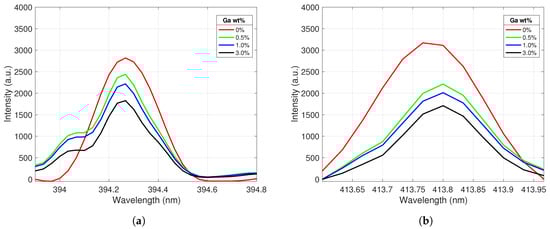
Figure 4.
Ce II emission peaks centered at (a) 394.3 nm and (b) 413.8 nm. The peak intensities decrease as the Ga concentration in the alloy increases.
5. Univariate Calibration Curves and Limits of Detection
Four different calibration curves were fit for the purposes of conducting a univariate analysis of the spectral data. The ratio of each Ga I peak to each Ce II peak was taken across all concentrations. The first calibration curve sets using the Ga I 287.4-nm line are displayed in Figure 5. The data points from the intensity ratios are represented by the black dots; error bars were calculated from standard deviation measurements of the peak intensities between shots. The increasing magnitude of error corresponding to increasing concentrations is most likely due to the varying heterogeneity of the samples; the data indicated that as the Ga concentration of the sample increased, the more non-uniform the surface was. This would lead to higher variations in intensity between shots and yield a higher standard deviation for these samples. A weighted linear regression based on the error of each data point was employed to create the calibration curve for each dataset; this is represented by a solid red line. Error terms of the fitting coefficients were calculated, and the confidence region is noted by the dashed red lines. The largest error was seen in the intensity ratios from the 3% samples, as these peaks had the largest shot-to-shot variation. While emission line intensities were dependent on parameters such as laser energy and spot size, the intensity ratios remained relatively constant since individual line intensities scaled similarly with changing plasma temperature and plasma density. Therefore, line ratios from normalized spectra taken with other laser systems can be compared to these calibration curve sets.
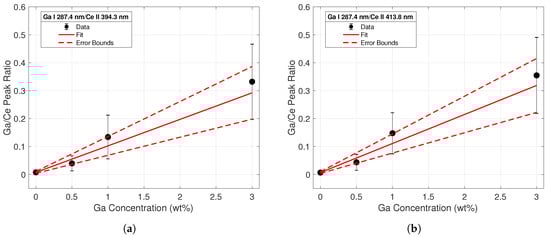
Figure 5.
Calibration curve from line intensity ratios of the Ga I 287.4-nm emission to the (a) Ce II 394.3 nm (b) and the Ce II 413.8-nm emission lines. The regression fit is shown with a solid red line, while errors in the regression coefficients are plotted with the dashed red lines.
The same analysis was conducted using intensities of the Ga I 294.4-nm peak, shown in Figure 6. Upon initial visual inspection, it was clear that the fits for the calibration ratios generated using the 294.4-nm peak intensities were worse than those derived from the 287.4-nm peak in Figure 5. The low signal intensity of this line at low Ga concentrations made it difficult to achieve a good fit. These data clearly indicated the superiority of the 287.4-nm emission line for Ga detection purposes at low Ga weight percentages. LODs for each calibration curve were calculated according to the commonly-used definition 3/s. is referred to as the standard deviation of the blank, and inferred from variations in spectra taken from cerium with no gallium. s refers to the slope of the calibration line. Table 1 lists all experimental fitting parameters along with the limits of detection for each calibration curve.
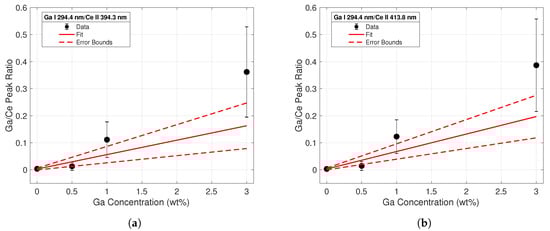
Figure 6.
Calibration curve from line intensity ratios of the Ga I 294.4-nm emission to the (a) Ce II 394.3-nm (b) and the Ce II 413.8-nm emission lines.

Table 1.
Fitting parameters for calibration curves for the equation y = ax + band limit of detection (LOD).
The tabulated R-squared values and LODs for each calibration set reflect the conclusions drawn from the observations of Figure 5 and Figure 6. The coefficients of determination were much closer to unity for the calibration curves built using the Ga I 287.4-nm peak data. Additionally, the calculated LODs using these peaks were an order of magnitude less than those calculated from the 294.4-nm peak. These calculations confirmed the superiority of the 287.4-nm line for quantitative analysis of gallium concentrations in Ce-Ga alloys, particularly at lower gallium concentrations.
6. Multivariate Analysis
Multivariate analysis is commonly used in the analysis of complex spectra [28,29,30]. This technique numerically estimates how multiple independent input variables interact to produce the dependent response; this can result in a fit with less statistical uncertainty than a univariate calibration [31]. In this case, the intensity ratios of the Ga I 287.4-nm line to the Ce II 394.3-nm and 413.8-nm lines were analyzed using the multivariate regression function in MATLAB. More advanced multivariate techniques such as partial least squares (PLS) and principle component regression (PCR) are also commonly used in the LIBS community for quantitative elemental analysis. These techniques have the advantage of using the entire spectrum to inform their calibrations, at the cost of an increase in processing complexity. Given the limited computing power of the on-board systems of a hand-held instrument, these more advanced techniques were avoided. However, a simple MLS regression technique based on two well-defined, interference-free peak ratios appeared reasonable for this application. The generated coefficients from the MLS approach are displayed in Table 2.
Table 2.
Fit parameters for multivariate regression of data points using Ga I 287.4-nm line intensities.
These produced a regression fit of the following form:
Here, y represents the Ga concentration in a sample, x represents the peak intensity ratios I/I, and x represents the ratio I/I. The regression equation is plotted with the experimental data in Figure 7 and includes the confidence interval based on the error bounds calculated for the tabulated fitting parameters.
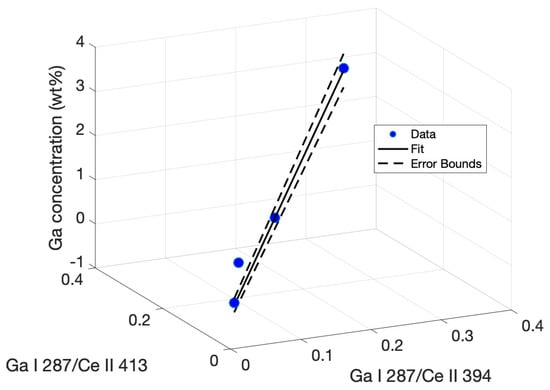
Figure 7.
Multiple regression plot fitting ratios of the Ga I 287.4-nm peak intensity to a model determining Ga concentration based on the correlation between peak intensity ratios.
The limit of detection using this multivariate method was calculated in the same manner as the univariate calibrations. The standard deviation was calculated by using the regression in Equation (1) with peak ratios taken from a blank shot series. The standard deviation in the calculated concentrations was then extracted. The slope s was calculated for the 3D line plot. Using the relation 3/s gave an LOD of 0.2435% Ga using the multivariate regression, a 23 percent improvement in LOD over the best-achieved univariate calibration, as well as a superior R-squared value.
7. Concentration Mapping
The data from the calibration curves were further used to analyze the gallium distribution across the surface of a Ce-Ga alloy sample. Mapping the gallium concentration can yield valuable insights into the alloy production process and help evaluate flaws in the alloying and annealing treatments. Determining how well distributed the gallium in an alloy is can also help indicate its origin. This mapping process was conducted by mounting both the HH-LIBS and the alloy sample onto a laser table and securing them. An x-y translation stage was used to adjust the ablation location on the sample. Data points were taken at 1-mm intervals, and a 2D linear interpolation was used to determine the concentration between mapping points. Each point was ablated 10 times, and the average spectrum was recorded. The Ga/Ce peak ratios used in the multivariate calibration model were calculated at each data point; these ratios were then used to determine the gallium concentration from Equation (1). The results of the mapping process on the three percent Ce-Ga alloy sample are shown in Figure 8.
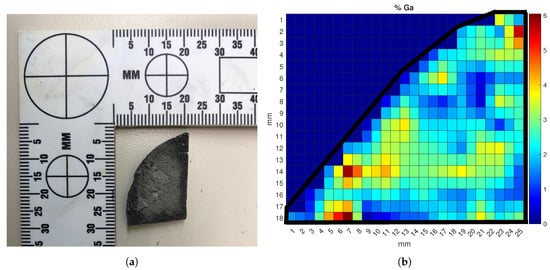
Figure 8.
(a) Photograph of the 3% Ga cerium alloy sample used in the mapping analysis and (b) surface Ga concentration map of the sample. The color map represents the localized weight percent of gallium ranging from zero to six percent.
The black line around the sample points represents the boundary of the sample piece. Each color reflects a gallium concentration between zero and six weight percent. Although the sample was created with amounts of each metal to reach a overall sample that was three percent gallium by weight, non-uniform cooling of the surface of the sample during the annealing process in the crucible led to the varying surface Ga distribution in Figure 8. The samples were created by pouring the molten metal into a room-temperature crucible to mix them; upon contacting the crucible surface, the hot molten alloy can “flash freeze”, causing phase changes and Ga crystallization along the surface boundary [32]. This rapid cooling prevents the gallium from migrating and distributing uniformly along the surface, leading to areas with higher amounts of gallium interspersed with zones of nearly no gallium [17]. This result is clearly reflected in Figure 8, where the yellow- to red-colored zones identify ablation points where gallium crystallized in the cerium lattice instead of diffusing due to the lower temperature. This experimental result proved the HH-LIBS device was capable of conducting surface concentration mapping analysis to evaluate the production quality of a cerium metal sample.
8. Conclusions
This study presented novel spectral line emission data of cerium-gallium alloys taken with a hand-held laser-induced breakdown spectroscopy device. Univariate calibration curves were built from the ratios of selected atomic emission lines of gallium and cerium, and calibration fit parameters were tabulated. A limit of detection up to 0.318% was achieved from the univariate calibration curve approach, and it was determined that for the detection of gallium in lower quantities, the Ga I 287.4-nm line was the superior calibration standard due to its strong presence even at low weight percent concentrations of gallium. Multivariate analysis was used to improve the regression model and yielded an improved LOD of 0.2435%, making it superior to the univariate calibration fits. The multivariate regression model was then used to conduct a detailed surface mapping analysis of a cerium-gallium alloy, manufactured to have an overall gallium concentration of 3%. This allowed for a detailed map of the surface gallium distribution to be made, highlighting areas in which rapid cooling of the metal alloy in the crucible occurred during the annealing process, leading to an uneven diffusion of gallium atoms in the crystal lattice of the metal.
Author Contributions
Sample creation M.T.C.; data acquisition A.P.R. and M.T.C.; spectral data processing; A.P.R. and M.B.S.; sample mapping analysis: A.P.R. and M.T.C.; project supervisor: H.L.H.
Funding
This material is based on work supported by the U.S. Department of Homeland Security under Grant Award Number 2015-DN-077-ARI093, the Air Force Office of Scientific Research (AFOSR) under Grant Award Number ENP19P906, and the Defense Threat Reduction Agency (DTRA) under Grant Award Number HDTRA 17-245-26.
Acknowledgments
The authors would like to acknowledge Duncan Brocklehurst of the Department of Nuclear Engineering at the University of Tennessee, Knoxville, for the preparation of the samples analyzed as part of this paper.
Conflicts of Interest
The views and conclusions contained in this document are those of the authors and should not be interpreted as necessarily representing the official policies, either expressed or implied, of the United States Air Force, Department of Defense, U.S. Department of Homeland Security, or the United States Government.
References
- Bhatt, B.; Hudson Angeyo, K.; Dehayem-Kamadjeu, A. LIBS development methodology for forensic nuclear materials analysis. Anal. Methods 2018, 10, 791–798. [Google Scholar] [CrossRef]
- Barefield, J.E.; Judge, E.J.; Campbell, K.R.; Colgan, J.P.; Kilcrease, D.P.; Johns, H.M.; Wiens, R.C.; Mcinroy, R.E.; Martinez, R.K.; Clegg, S.M. Analysis of geological materials containing uranium using laser-induced breakdown spectroscopy. Spectrochim. Acta B 2016, 120, 1–8. [Google Scholar] [CrossRef]
- Klus, J.; Mikysek, P.; Prochazka, D.; Porizka, P.; Prochazková, P.; Novotny, J.; Trojek, T.; Novotny, K.; Slobodník, M.; Kaiser, J. Multivariate approach to the chemical mapping of uranium in sandstone-hosted uranium ores analyzed using double pulse laser-induced breakdown spectroscopy. Spectrochim. Acta B 2016, 123, 143–149. [Google Scholar] [CrossRef]
- Sirven, J.; Pailloux, A.; Baye, Y.; Coulon, N.; Alpettaz, T.; Gosse, S. Towards the determination of the geographical origin of yellow cake samples by laser-induced breakdown spectroscopy and chemometrics. J. Anal. At. Spectrom. 2009, 24, 451–459. [Google Scholar] [CrossRef]
- Kim, Y.; Han, B.; Shin, H.S.; Kim, H.D.; Jung, E.C.; Jung, J.H.; Na, S.H. Determination of uranium concentration in an ore sample using laser-induced breakdown spectroscopy. Spectrochim. Acta B 2012, 75, 190–193. [Google Scholar] [CrossRef]
- Shattan, M.B.; Gragston, M.; Zhang, Z.; John, D.; Auxier, I.; McIntosh, K.G.; Parigger, C.G. Mapping of Uranium in Surrogate Nuclear Debris Using Laser-Induced Breakdown Spectroscopy (LIBS). Appl. Spectrosc. 2019, 73, 591–600. [Google Scholar] [CrossRef] [PubMed]
- Chinni, R.; Cremers, D.A.; Multari, R. Analysis of material collected on swipes using laser-induced breakdown spectroscopy. Appl. Opt. 2010, 49, C143–C152. [Google Scholar] [CrossRef]
- Sarkar, A.; Alamelu, D.; Aggarwal, S.K. Determination of thorium and uranium in solution by laser-induced breakdown spectrometry. Appl. Opt. 2008, 4, G58–G64. [Google Scholar] [CrossRef] [PubMed]
- Gaona, I.; Serrano, J.; Moros, J.; Laserna, J.J. Evaluation of laser-induced breakdown spectroscopy analysis potential for addressing radiological threats from a distance. Spectrochim. Acta B 2014, 96, 12–20. [Google Scholar] [CrossRef]
- Harilal, S.; Brumfield, B.; LaHaye, N.; Hartig, K.; Phillips, M. Optical spectroscopy of laser-produced plasmas for standoff isotopic analysis. Appl. Phys. Rev. 2018, 5, 021301. [Google Scholar] [CrossRef]
- SciAps. SciAps Z Brochure. 2014. Available online: https://www.sciaps.com/wp-content/uploads/2014/08/Z-brochureRGB.pdf (accessed on 21 July 2019).
- Shattan, M.B.; Miller, D.J.; Cook, M.T.; Stowe, A.C.; Auxier, J.D.; Parigger, C.; Hall, H.L. Detection of uranyl fluoride and sand surface contamination on metal substrates by hand-held laser-induced breakdown spectroscopy. Appl. Opt. 2017, 56, 9868–9875. [Google Scholar] [CrossRef]
- Manard, B.T.; Wylie, E.M.; Willson, S.P. Analysis of Rare Earth Elements in Uranium Using Handheld Laser-Induced Breakdown Spectroscopy (HH LIBS). Appl. Spectrosc. 2018, 72, 1653–1660. [Google Scholar] [CrossRef] [PubMed]
- Marra, J. Cerium as a Surrogate in the Plutonium Immobilized Form; International Atomic Energy Agency (IAEA): Vienna, Austria, 2001. [Google Scholar]
- Moore, M.; Tao, Y. Aerosol Physics Considerations for Using Cerium Oxide CeO2 as a Surrogate for Plutonium Oxide PuO2 in Airborne Release Fraction Measurements for Storage Container Investigations; Los Alamos National Lab. (LANL): Los Alamos, NM, USA, 2017. [Google Scholar]
- Zheng, H.; Yueh, F.Y.; Miller, T.; Singh, J.; Zeigler, K.E.; Marra, J.C. Analysis of plutonium oxide surrogate residue using laser-induced breakdown spectroscopy. Spectrochim. Acta B 2008, 63, 968–974. [Google Scholar] [CrossRef]
- Gibbs, F.E.; Olson, D.L.; Hutchinson, W. Identification of a physical metallurgy surrogate for the plutonium—1 wt.% gallium alloy. AIP Conf. Proc. 2000, 532, 98–101. [Google Scholar] [CrossRef]
- FY2015 Performance Evaluation Report; Technical Report; NNSA: Washington, DC, USA, 2015.
- Steinzig, M.; Harlow, F.H. Characterization Of Cast Metals With Probability Distribution Functions. MRS Proc. 1999, 538. [Google Scholar] [CrossRef]
- Hecker, S.S. Plutonium: Coping with instability. JOM 2003, 55, 13–19. [Google Scholar] [CrossRef]
- Söderlind, P.; Zhou, F.; Landa, A.; Klepeis, J. Phonon and magnetic structure in δ-plutonium from density-functional theory. Sci. Rep. 2015, 5, 15958. [Google Scholar] [CrossRef]
- Johnson, C.G. Metallurgy, 4th ed.; American Technical Society: Chicago, IL, USA, 1956. [Google Scholar]
- Rai, A.K.; Yueh, F.Y.; Singh, J.P. Laser-induced breakdown spectroscopy of molten aluminum alloy. Appl. Opt. 2003, 42, 2078–2084. [Google Scholar] [CrossRef]
- Noll, R.; Sturm, V.; Aydin, Ü.; Eilers, D.; Gehlen, C.; Höhne, M.; Lamott, A.; Makowe, J.; Vrenegor, J. Laser-induced breakdown spectroscopy—From research to industry, new frontiers for process control. Spectrochim. Acta Part B At. Spectrosc. 2008, 63, 1159–1166. [Google Scholar] [CrossRef]
- Gruber, J.; Heitz, J.; Arnold, N.; Bäuerle, D.; Ramaseder, N.; Meyer, W.; Hochörtler, J.; Koch, F. In situ Analysis of Metal Melts in Metallurgic Vacuum Devices by Laser-Induced Breakdown Spectroscopy. Appl. Spectrosc. 2004, 58, 457–462. [Google Scholar] [CrossRef]
- Schulze, G.; Jirasek, A.; Yu, M.M.L.; Lim, A.; Turner, R.F.B.; Blades, M.W. Investigation of Selected Baseline Removal Techniques as Candidates for Automated Implementation. Appl. Spectrosc. 2005, 59, 545–574. [Google Scholar] [CrossRef] [PubMed]
- Press, W.H.; Flannery, B.P.; Teukolsky, S.A.; Vetterling, W.T. Numerical Recipes in C: The Art of Scientific Computing, 2nd ed.; Cambridge University Press: Cambridge, UK, 1992. [Google Scholar]
- Guo, G.; Niu, G.; Shi, Q.; Lin, Q.; Tian, D.; Duan, Y. Multi-element quantitative analysis of soils by laser induced breakdown spectroscopy (LIBS) coupled with univariate and multivariate regression methods. Anal. Methods 2019, 11, 3006–3013. [Google Scholar] [CrossRef]
- Gottfried, J.L.; Harmon, R.S.; Lucia, F.C.D.; Miziolek, A.W. Multivariate analysis of laser-induced breakdown spectroscopy chemical signatures for geomaterial classification. Spectrochim. Acta B 2009, 64, 1009–1019. [Google Scholar] [CrossRef]
- Tiwari, P.K.; Awasthi, S.; Kumar, R.; Anand, R.K.; Rai, P.K.; Rai, A.K. Rapid analysis of pharmaceutical drugs using LIBS coupled with multivariate analysis. Lasers Med. Sci. 2018, 33, 263–270. [Google Scholar] [CrossRef] [PubMed]
- Larose, D.; Larose, C. Data Mining and Predictive Analysis; Wiley: Hoboken, NJ, USA, 2015. [Google Scholar]
- Predel, B. Ce-Ga (Cerium-Gallium). In Ca-Cd–Co-Zr; Springer: Berlin/Heidelberg, Germany, 1993; pp. 1–3. [Google Scholar] [CrossRef]
© 2019 by the authors. Licensee MDPI, Basel, Switzerland. This article is an open access article distributed under the terms and conditions of the Creative Commons Attribution (CC BY) license (http://creativecommons.org/licenses/by/4.0/).