Article

The Anti-Inflammatory Protein TNIP1 Is Intrinsically Disordered with Structural Flexibility Contributed by Its AHD1-UBAN Domain

by
Rambon Shamilov
1,
Olga Vinogradova
2 and
Brian J. Aneskievich
2,*
1
Graduate Program in Pharmacology and Toxicology, Department of Pharmaceutical Sciences, University of Connecticut, Storrs, CT 06269, USA
2
Department of Pharmaceutical Sciences, University of Connecticut, Storrs, CT 06269, USA
*
Author to whom correspondence should be addressed.
Biomolecules 2020, 10(11), 1531; https://doi.org/10.3390/biom10111531
Submission received: 6 October 2020 / Revised: 4 November 2020 / Accepted: 5 November 2020 / Published: 10 November 2020
(This article belongs to the Collection Intrinsically Disordered Proteins)

Abstract

:
TNFAIP3 interacting protein 1 (TNIP1) interacts with numerous non-related cellular, viral, and bacterial proteins. TNIP1 is also linked with multiple chronic inflammatory disorders on the gene and protein levels, through numerous single-nucleotide polymorphisms and reduced protein amounts. Despite the importance of TNIP1 function, there is limited investigation as to how its conformation may impact its apparent multiple roles. Hub proteins like TNIP1 are often intrinsically disordered proteins. Our initial in silico assessments suggested TNIP1 is natively unstructured, featuring numerous potentials intrinsically disordered regions, including the ABIN homology domain 1-ubiquitin binding domain in ABIN proteins and NEMO (AHD1-UBAN) domain associated with its anti-inflammatory function. Using multiple biophysical approaches, we demonstrate the structural flexibility of full-length TNIP1 and the AHD1-UBAN domain. We present evidence the AHD1-UBAN domain exists primarily as a pre-molten globule with limited secondary structure in solution. Data presented here suggest the previously described coiled-coil conformation of the crystallized UBAN-only region may represent just one of possibly multiple states for the AHD1-UBAN domain in solution. These data also characterize the AHD1-UBAN domain in solution as mostly monomeric with potential to undergo oligomerization under specific environmental conditions (e.g., binding partner availability, pH-dependence). This proposed intrinsic disorder across TNIP1 and within the AHD1-UBAN region is likely to impact TNIP1 function and interaction with its multiple partners.

1. Introduction

TNFAIP3 interacting protein 1 (TNIP1) (also known as ABIN-1, NAF or VAN) is a multi-domain, non-enzymatic regulator of cytoplasmic and nuclear cellular signaling. Initially identified as an inhibitor of NF-kB in conjunction with its binding partner A20 [1,2], numerous not-necessarily related interaction partners of TNIP1 have been reported including HIV proteins Nef and Matrix [3,4], ERK2 [5], ligand-bound PPARs and RARs [6,7], NEMO [8], HDAC1 [9], NLRP10 [10] and the Shigella IpaH9.8 protein [11]. The promiscuous nature of TNIP1 suggests its existence as a hub protein (defined here as having ≥10 partners [12]. A common feature shared by hub proteins is a greater degree of intrinsic structural disorder (i.e., natively unfolded conformation, structural flexibility) [13]. The vast potential for clinical importance of intrinsically disordered proteins (IDPs) has been established by recognizing their integral role in numerous signaling and other control pathways (e.g., p53, p21, BRCA1) [14,15]. Potential TNIP1 roles in normal cell physiology and several inflammatory and autoimmune pathologies have been identified through numerous genome-wide association studies, as reviewed in [16,17]. Decreased levels of TNIP1 protein have been reported in human autoimmune and inflammatory diseases such as systemic sclerosis and psoriasis [18,19]. Perhaps modeling this, TNIP1 protein degradation is enhanced in response to inflammatory signaling from interleukin-17 stimulation in vitro [20]. While many endpoints of TNIP1 function have been reported, there is to-date limited investigation of TNIP1 protein characteristics that may contribute to its control over intracellular signaling [21,22]. Further investigation of TNIP1 protein, specifically as a candidate IDP, might help explain its diverse partner interactions or degradation sensitivity, and could yield potential translational human health benefits in diverse pathologies.
An extended repertoire of protein–protein interactions based on intrinsic disorder does not require conformational flexibility to extend throughout the entirety of one of the partner proteins. Intrinsically disordered protein regions (IDPR) are localized sections lacking fixed secondary or tertiary structure. These IDPRs and other subregions of a wholly disordered protein commonly facilitate high-specificity, low affinity interactions [23,24]. Among the many regions for partner interaction along the TNIP1 protein is the ubiquitin binding domain (UBD) (later named UBD in ABIN proteins and NEMO, UBAN [25]), which facilitates TNIP1 interaction with polyubiquitin chains [26]. TNIP1–partner interactions also include the involvement of additional amino acids in the ABIN homology domain 1 (AHD1) upstream of the UBAN, which function in tandem with it to promote binding of the deubiquitinase/ubiquitin ligase protein A20 and polyubiquitin. With the intervening amino acids linking the AHD1 and UBAN domains, they span approximately from AA417 through 509 in the human protein sequence. In part via TNIP1–partner interactions mediated within this region, TNIP1 maintains proportional inflammatory responses through dampening of intracellular signaling downstream of activated membrane receptors e.g., tumor necrosis factor receptor and toll-like receptor ([16] for review). This region is also within an extended TNIP1 fragment of ~230 amino acids which when expressed via transient transfection reduced TNF-stimulated reporter expression [1]. Further truncations of the fragment, retaining the UBAN homology region but excluding its upstream AHD1 and the domain linking that to the UBAN region, were used to establish in vitro interaction with ubiquitin [25]. An aspartic acid to asparagine point mutation in the TNIP1 UBAN domain results in loss of polyubiquitin binding. When expressed in mice as a knockin gene replacing the wild-type sequence, the ubiquitin-binding defect promotes spontaneous lupus-like autoimmune disease [26]. Notably however, TNIP1 can function in signal repression even in the absence of A20 [27], suggesting innate properties or other as of yet unrecognized interaction partners.
IDPRs are often defined by molecular recognition features (MoRFs). These regions can be intrinsically disordered under basal conditions and undergo disorder-to-order transition taking on alpha helical, beta strand, or coiled conformations through interaction with a binding partner [24]. Additionally notable, is that retention of a partially unstructured conformation upon binding with self or partner proteins have also been reported [28,29,30,31,32]. As a candidate hub IDP, such properties can be expected along TNIP1 and involved in interactions with its partner proteins. Modeling these for TNIP1 is limited as a crystal structure of human full-length sequence or monomeric TNIP1 UBAN has yet to be reported. However, crystal structure studies of the UBAN domain of mouse TNIP1 [21] and a UBAN fragment with its upstream AHD1 from the TNIP1-related human TNIP2 (i.e., ABIN2) [22] indicate these regions exist as a MoRF which can form a self-associated coiled-coil dimer, bound and unbound in the case of mouse TNIP1 UBAN, by polyubiquitin. The small cohort of TNIP1-related proteins, i.e., TNIP2 (ABIN-2) and TNIP3 (ABIN-3), are more functionally related in their repression of NF-kB-mediated signaling than in their sharing protein sequence. They show minimal consensus across their protein length (TNIP2, 429AA; TNIP3, 325AA) with it mostly localized to very limited matches in aligned subdomains, such as AHD1 and UBAN [22,33]. If the AHD1 and UBAN domains are IDPRs, these crystal structures would be informative for a static image representing one phase in a possible conformational continuum in this protein region. This protein region may exist within a cohort of previously reported substantially disordered proteins that gain sufficient order in a bound form that allows for crystallization [34]. Determination of intrinsic disorder traits along the full-length TNIP1 or especially within the UBAN domain could guide further investigation on TNIP1 partner interactions and their consequences to repression of intracellular signaling.
The characteristic compositional and biophysical aspects of intrinsic disorder, including increased charge/polarity, reduced hydrophobic core formation, and increased dynamic protein backbone promotes unique challenges in expression and investigation of these proteins [35,36]. Databases of intrinsically disordered proteins such as DisProt [37], have allowed for extensive development of algorithms for prediction of disorder [38]. With some of its functional and cellular characteristics reminiscent of IDP, e.g., multiple partners and increased degradation under cell stress conditions, we undertook comprehensive computational and biophysical testing of TNIP1 as an IDP. In silico analysis of TNIP1 and the AHD1-UBAN domain by such algorithms reveals predicted intrinsic disorder, consistent with increased polar/charged amino acid residues. We found that the in silico predictions and bioinformatics approach reliably foreshadowed our in vitro results. Using methods effective at characterizing protein shape (e.g., dynamic light scattering (DLS), analytical ultracentrifugation (AUC), analytical gel filtration), secondary and tertiary structure characteristics (e.g., limited proteolysis, circular dichroism (CD)) and protein dynamics (e.g., NMR) we present data indicating that both the full-length TNIP1 and TNIP1 AHD1-UBAN regions are extended, non-structured proteins. As a potential IDPR of interest within TNIP1, we found the AHD1-UBAN region will undergo conformational shifts with appropriate stimulus (i.e., increased concentration, pH shift and addition of binding partner). This distinct investigative approach suggests anti-inflammatory, TNIP1-mediated signal repression is occurring in the context of, and may be dependent on, an unstructured flexible protein conformation. Additionally, the results emphasize the possible contribution of IDP in general to regulation of inflammatory signaling in addition to the other already well-established pathologies where IDP can be key proteins [14,39].

2. Materials and Methods

2.1. In Silico Analysis

Sequences for full-length TNIP1 were collected from UniProt release 2020_05 [40] (www.uniprot.org) (human sequence-Q15025, for a complete list of species used see supplementary materials). For review of protein disorder prediction algorithms, see [41,42,43]. For determining disorder scores of human full-length TNIP1 and TNIP1 AHD1-UBAN domains (AA417-509), web-based algorithms VL-XT, VL3, VSL2, IUPred2, MFDp2 and PONDR-FIT were used (available at http://www.pondr.com/ for VL-XT, VL3 and VSL2; https://iupred2a.elte.hu for IUPred2; http://biomine.cs.vcu.edu/servers/MFDp2/ for MFDp2; http://original.disprot.org/pondr-fit.php for PONDR-FIT). For the above algorithms, residues with scores above 0.5 are considered disordered and below 0.5 are considered ordered. Prediction of post-translation modifications was performed using D2P2 (available at http://d2p2.pro/). Prediction of coiled-coil domains for full-length TNIP1 was performed using DeepCoil [44] (available at https://toolkit.tuebingen.mpg.de/tools/deepcoil). Amino acid enrichment or depletion presented as fractional difference in composition was determined with Composition Profiler (available at http://www.cprofiler.org/index.html) using either the full-length TNIP1 or TNIP1 AHD1-UBAN region sequence compared against SwissProt database. To establish a trend of amino acid compositional bias in IDPs, a similar comparison of DisProt versus SwissProt databases was done. Cumulative distribution function (CDF) was performed in a similar manner as the above predictors (available at http://www.pondr.com). CDF plot represents the fraction of residues within an amino acid region that are scored at a given value. Largely disordered proteins will have low numbers of residues with low scores and vice versa for ordered proteins. Within a CDF plot, disordered proteins will appear mainly below the boundary line (black-dotted) and ordered proteins above. Proteins which cross the boundary line are considered a mixture of disordered and ordered. Boundary points for the CDF plot were obtained from the PONDR server. Charge–hydropathy (CH) analysis presented as absolute mean net charge versus mean scaled hydropathy plotted using provided ordered and disordered data sets as well as threshold values as established by Uversky et. al. [45] available at http://www.pondr.com/. Species homology analysis of full-length TNIP1 using default parameters of the Clustal Omega sequence alignment [46] program (available at https://www.ebi.ac.uk/Tools/msa/clustalo/) for three or more sequences analyzed. Gaps introduced by Clustal Omega were then incorporated in the PONDR-FIT raw data scores for each species to allow plotting of all species’ PONDR-FIT data to reflect sequence alignments. Percent identity matrix scores were exported as part of results generated with use of Clustal Omega algorithm.

2.2. Recombinant Protein Expression and Purification

pET28a-TNIP1 (full length and TNIP1 AHD1-UBAN construct (TNIP1417-509)) featuring a C-terminus His6 tag were transformed into BL-21(DE3) Rosetta 2 host strain E. coli (Millipore Sigma, Burlington, MA, USA). Expression was performed by diluting overnight inoculated LB grown to saturation at a 1/40 (v/v) dilution into LB. Diluted cultures were agitated at 37 °C, 250 RPM until an OD600 of ~0.2–0.3 was reached after which cultures were induced with 0.1 mM isopropyl-b-D-thiogalactopyranoside (IPTG) at 30 °C for 4 h. Cultures were then pelleted at 4000× g for 20 min before storage at −20 °C. Purification of pET28a-TNIP1 (full length and TNIP1417-509) was performed by resuspending bacterial pellets 1/20 (w/v) in 20 mM sodium phosphate buffer (pH 8.0), 500 mM NaCl, and 20 mM imidazole and lysing the pellets by placing heating in a boiling water bath for 20 min followed by immediate cooling on ice for 10 min. This lysis scheme, as established for other IDPs which remain soluble with heat treatment [47,48,49,50,51], was used to overcome poor yields from non-heat lysis methods. Lysates were clarified at 28,000× g for 35 min followed by filtering through a 0.45 micron filter before injection onto a 5 mL HisTrap HP column (GE Healthcare Life Sciences, Marlborough, MA, USA) at 1 mL/min. The column was then washed with 5 column volumes 20 mM sodium phosphate buffer (pH 8.0), 500 mM NaCl, and 40 mM imidazole and eluted in 20 mM sodium phosphate buffer (pH 8.0), 500 mM NaCl, and 300 mM imidazole. Samples were then either immediately snap frozen for storage at −80 °C or used for further purification by concentration via Amicon Ultra Centrifugal Filter Units (Millipore Sigma) and injection onto a HiLoad Superdex 75 16/60 HP column (GE Healthcare Life Sciences) pre-conditioned overnight with 20 mM sodium phosphate buffer (pH 8.0) and 200 mM NaCl. Purity of protein assessed at each stage of purification via SDS-PAGE gel analysis using ImageJ [52] and protein quantification performed using a Pierce 660 nm Protein Assay (ThermoFisher Scientific, Waltham, MA, USA). Molecular weight determination was performed using a Kodak IS400CF CCD imager (Kodak, Rochester, NY, USA) and Carestream Molecular Imaging Software. Western blot analysis was performed by transfer of electrophoretically resolved protein samples onto a Whatman Protran nitrocellulose membrane (GE Healthcare Life Sciences, Marlborough, MA, USA). Blots were then incubated with 5% nonfat dry milk in tris-buffered saline with 0.05% Tween-20 (TBST) for 1 h at room temperature followed by incubation with anti-His6 antibody (1:1000 dilution, Cell Signaling Technology, catalog number: 2366). Blots were washed with TBST before a 2-h incubation with HRP-conjugated anti-mouse secondary antibody (1:5000 dilution, Abcam, catalog number: ab97046). Proteins were imaged using chemiluminescence substrates (ThermoFisher Scientific, Waltham, MA, USA) and a Kodak IS440CF CCD imager (Kodak, Rochester, NY, USA).

2.3. Analytical Gel Filtration

Purified TNIP1417-509 construct at 1 mg/mL was injected onto a HiLoad Superdex 75 16/60 HP column preconditioned overnight with 20 mM sodium phosphate buffer (pH 8.0), and 200 mM NaCl. The column was run at 0.8 mL/minute and 2 mL fractions were collected over the course of the gel filtration run. TNIP1 elution volume was monitored by absorbance at 220 nm and 230 nm. The elution volume was plotted on a standard curve (volume of elution versus molecular weight (kDa)) of protein standards injected separately under the same conditions. The protein standards used were bovine serum albumin (BSA), ovalbumin, myoglobin, chymotrypsinogen, and cytochrome C. For comparison of hydrodynamic radii versus molecular mass, random coil and pre-molten globule-like protein standards were taken from [53] and globular proteins were taken from [54].

2.4. Light Scattering

The hydrodynamic radius and molecular weight of purified TNIP1417-509 construct was measured simultaneously using a Zetasizer Nano ZSP (Malvern Panalytical, Malvern, UK) at 1.5 and 0.75 mg/mL in 20 mM sodium phosphate buffer (pH 8.0), 200 mM NaCl and 10% glycerol (included to reduce aggregates). Molecular weight measurements were made using static light scattering (SLS) comparing TNIP1417-509 versus a toluene scattering standard. Four dilutions of TNIP1417-509 were used with samples prepared in a quartz cuvette (Malvern Panalytical) for molecular weight determination. Protein samples were prepared with centrifugation at 10,000× g for 10 min followed by filtering through a 0.2 micron filter. DLS data are presented as total percentage by volume, converted from total percentage by intensity. Heterogeneity of the samples was determined by a measured polydispersity index (PDI) obtained via DLS experiments.

2.5. Analytical Ultracentrifugation (AUC)

Purified TNIP1417-509 protein samples were prepared in 20 mM sodium phosphate buffer and 200 mM NaCl at either pH 5.8 or 8.0 by extensive buffer exchange using Amicon Ultra Centrifugal Filter Units reaching a minimal dilution factor of 1/1000. Sedimentation velocity analysis was conducted at 20 °C and 50,000 RPM using absorbance optics with a Beckman-Coulter XL-I (Beckman Coulter, Brea, CA, USA) analytical ultracentrifuge. Double sector cells equipped with quartz windows were used. The rotor was equilibrated under vacuum at 20 °C and after a period of ~30 min at 20 °C the rotor was accelerated to 50,000 RPM. Absorbance scans at 230 nm were acquired at 6 min intervals for ~20 h. Protein physical constants, buffer density and viscosity were determined using Sednterp. Data analysis was performed in Sedfit using a continuous sedimentation coefficient distribution (c(s)). The c(s) analyses were done at a resolution of 0.05 S, using maximum entropy regularization with a 95% confidence limit.

2.6. Limited Proteolysis

Protein was subjected to proteolysis under limiting protease conditions (1:1000, 1:2500 w/w protease: TNIP1417-509 and 1:250 w/w protease: full-length TNIP1 at 25 °C or 37 °C with collection of samples at 1, 5, 10, 15, and 30 min. Commercially available BSA (Thermo Fisher Scientific, Waltham, MA, USA) and alpha-casein (Millipore Sigma) were used in control experiments. Trypsin and chymotrypsin diluted from freshly made stocks were used for limited proteolysis experiments. Proteolysis was performed in 20 mM sodium phosphate buffer (pH 8.0), 200 mM NaCl, 2 mM CaCl for TNIP1417-509 and 20 mM sodium phosphate buffer (pH 8.0), 500 mM NaCl, 200 mM imidazole for studies using full-length TNIP1. Quenching of protease digestion was by addition of 5× Laemmli protein sample buffer and immediate heating at 95 °C for 5 min prior to resolving digest fragments by SDS-PAGE.

2.7. Circular Dichroism

CD spectra were collected on a Chirascan V100 spectropolarimeter (Applied photophysics, Surrey, UK) scanning from 190–250 nm with a 1 nm step and 2 nm bandwidth. 400 µL of TNIP1417-509 protein at a final 10 µM (0.13 mg/mL) concentration in 50 mM sodium phosphate buffer (pH 8.0) scanned using a quartz cuvette with a 1 mm pathlength (Starna Cells, Atascadero, CA, USA). All spectra were blanked against spectra collected from buffer-only samples. Scans done at increasing temperatures were performed using a Precision Peltier (Quantum Northwest, Liberty Lake, WA, USA) temperature controller. Secondary structure characterization studies were performed using protein samples under the same conditions as above with the addition of 10, 20, 30 or 40% (v/v) 2,2,2-trifluoroethanol (TFE) for 1 h prior to scanning. Post CD analysis done using the DichroWeb server using the Contin-LL (Provencher and Glockner Method) using database 7 from [55] and references therein. Standards for comparison of AHD1-UBAN versus random coil and pre-molten globule proteins were taken from [45].

2.8. Protein Expression for Nuclear Magnetic Resonance (NMR) Studies

15N labeled protein was expressed in minimal media consisting of 95 mM KH2PO4, 57 mM K2HPO4, 63 mM Na2HPO4, 13 mM K2SO4, 10 mM MgCl2, 0.2 mM CaCl2, 0.1 mM thiamine HCl, 13 mM EDTA, 0.4% glucose, 1× MEM vitamin solution (Thermo Fisher Scientific), 1× Trace Metal Mixture (Thermo Fisher Scientific). 15N labeling was achieved with inclusion of 20 mM (1 g/L) 15NH4Cl in expression media. Monoubiquitin (pET15b-ubiquitin) was expressed in LB media after induction with 0.1 mM IPTG at 37 °C of cultures, post-recovery after 1/40 (v/v) inoculation from saturated overnight culture, reaching an OD600 of 0.4–0.5. Induction lasted for 6 h before the culture was spun down at 4000× g for 20 min before storage at −20 °C. pET15b-ubiquitin pellets were lysed using sonication in 20 mM sodium phosphate buffer (pH 8.0), 500 mM NaCl, and 20 mM imidazole with complete, Mini, EDTA-free protease inhibitor cocktail (Millipore Sigma), 20 mg/mL lysozyme, and 5 mg/mL DNase 1. Sonicated lysates were clarified and then purified by affinity chromatography and gel filtration as described above.

2.9. NMR Spectroscopy

All NMR experiments were performed on a Varian Inova 600 MHz spectrometer equipped with a cryogenic probe (Agilent, Palo Alto, CA, USA). 1H–15N heteronuclear single quantum coherence (HSQC) experiments were performed to collect TNIP1417-509 (0.3 M) alone at pH 6.6, 5.8 and TNIP1417-509 plus monoubiquitin (1:2.2 molar ratio) spectra in 20 mM sodium phosphate buffer, 50 mM NaCl with 10% D2O at 25 °C. Data analysis performed using programs made available in NMRBox [56].

3. Results

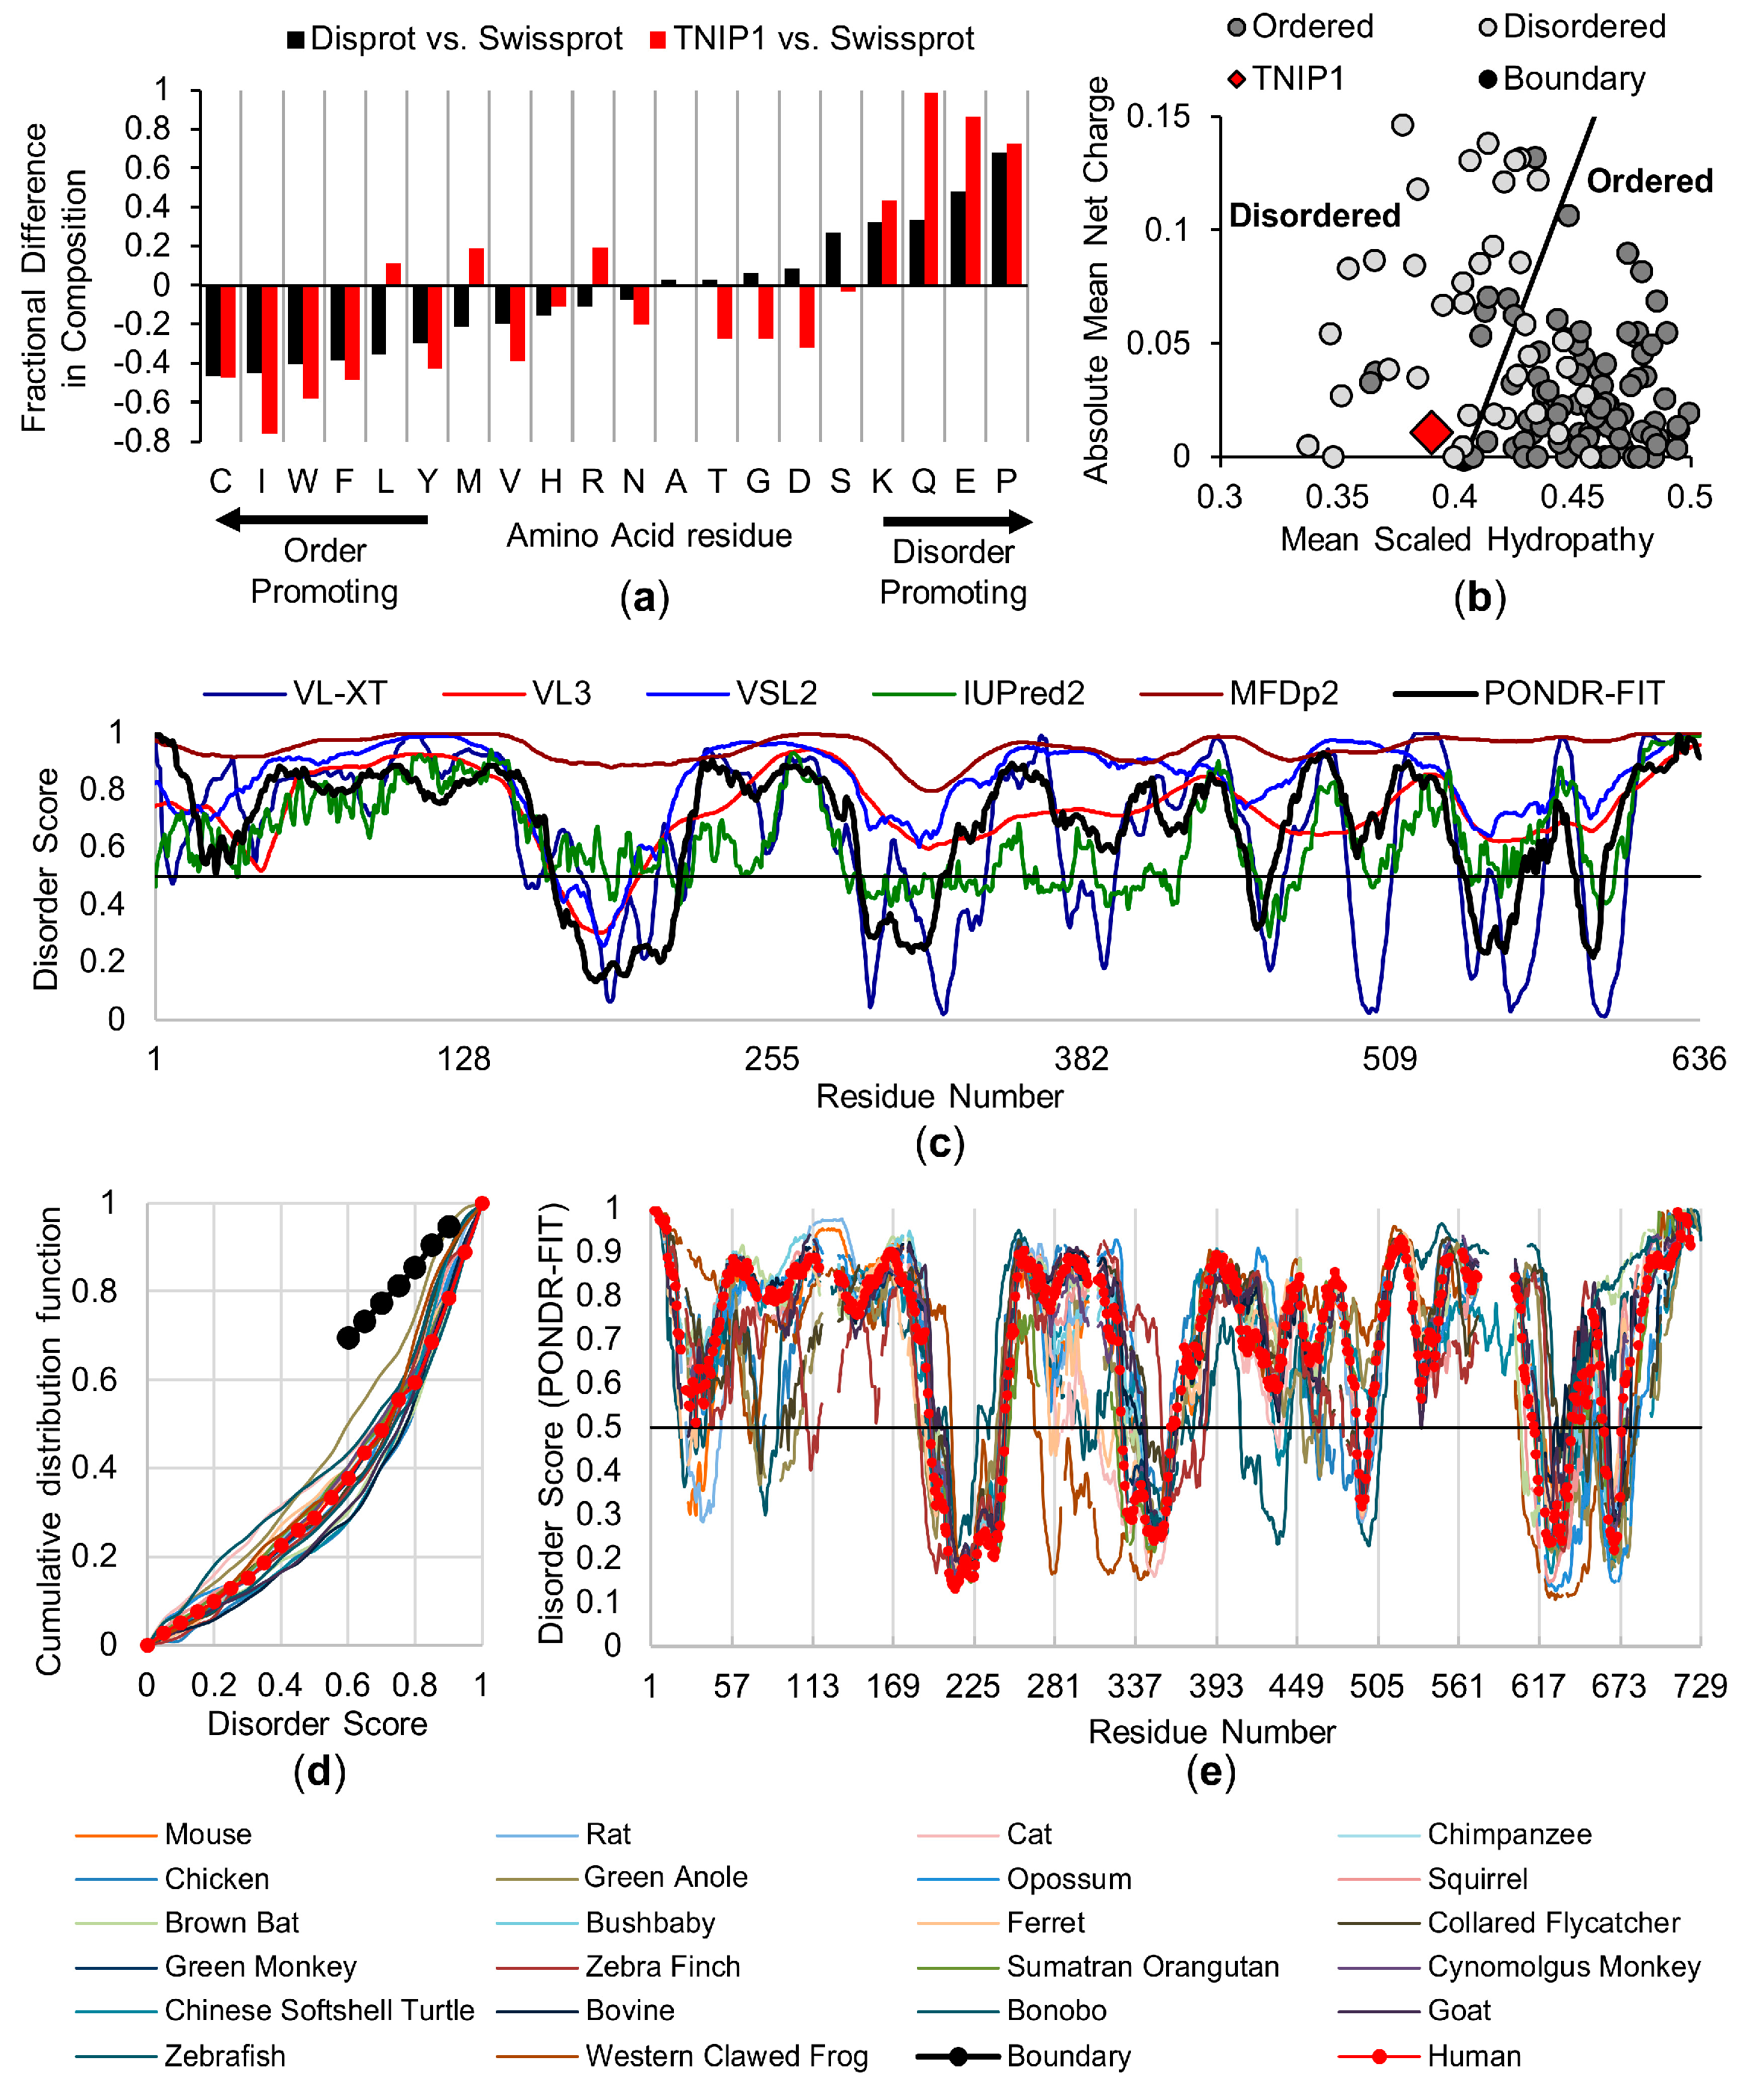
3.1. In Silico Analysis of Full-Length Human TNIP1 and Species Homologues

IDPs and IDPRs are conformationally distinct from most proteins due to a general lack of fixed three-dimensional structure, generated by low abundance of hydrophobic amino acids which typically promote tight, hydrophobic cores [57,58]. Full-length TNIP1 (636AA) is characterized by a skewed distribution of amino acids with an increase in disorder promoting (Lys, Glu, Gln, Pro) and decrease in order-promoting (Cys, Ile, Trp, Phe, Leu, Tyr) residues (Figure 1a). Disordered proteins commonly having high net charge and reduced hydrophobicity [49,59]. This allows for segregation of known disordered and ordered protein standards and predicts a protein’s intrinsic disorder based on where it lies on the spectrum (Figure 1b) of a charge–hydropathy plot. Full-length TNIP1 is grouped with the disordered proteins left of the threshold due to compositional bias favoring relatively increased numbers of hydrophilic residues and decreased hydrophobic content. Ongoing biophysical identification of disordered proteins and protein regions is improving an ever-growing number of effective disorder predictor algorithms [41,42,43], particularly those (i.e., meta-predictors) outputting collective assessment from multiple, individual programs [38]). Potential disorder for the full-length human TNIP1 protein was assessed using four standalone algorithms (VL-XT, VL3, VSL2 and IUPred2) and two meta-predictors, (MFDp2 and PONDR-FIT), in which a score above an 0.5 threshold for any amino acid residue is indicative of intrinsic disorder (Figure 1c). Looking at the residue scores generated using PONDR-FIT (reported to be ~11% more accurate than individual predictors [60]), there are reported potential regions of order (residue scores below 0.5) across amino acids regions of ~165–216, 291–327, 451–460, 539–596. This leaves a greater portion of the protein above the 0.5 threshold (average residue score being 0.671 across the entire TNIP1 protein). This trend is consistent across the standalone algorithms, where the average residue scores track closely with the meta-predictor PONDR-FIT (VL-XT-0.64, VL3-0.73, VSL2-0.83, IUPred2-0.64, MFDp2-0.95). Thus, there is very good agreement among the different platforms of a high degree of disorder across a high percentage of the full-length TNIP1 protein, with several extended lengths above the 0.5 threshold, i.e., suggestive of a mostly disordered protein with numerous IDPR (Figure 1c).
Intrinsic disorder contributing to protein functionality could be expected to be present across species protein homologues [61]. To test whether this is true for TNIP1 across species homologues, we generated a multiple sequence alignment of 23 full-length proteins (Supplemental Table S1) from various species using Clustal Omega [46] (Supplemental Figure S1). To illustrate the similarities in predicted disorder among these different species, we used a cumulative disorder fraction (CDF) algorithm (Figure 1d), which plots determined disorder scores versus the frequency of occurrence. Across all species assessed, we see the plotted values lying below the threshold (Figure 1d—dotted black line) which would indicate all these sequences belong to disordered proteins. Alignments generated through Clustal Omega were used to inform gaps within the overlaid PONDR-FIT assessment of the 23 species (Figure 1e). Across the assessed species, there is a similarity in TNIP1 protein disorder, with PONDR-FIT scores similarly trending across the different species when compared to the human sequence (Figure 1e—red-dotted line), consistent with the CDF output. The regions of disorder and predicted order are mostly conserved with traces overlapping and average PONDR-FIT scores ranging from 0.62–0.71 across the species. This is reflected in the comparison of the human TNIP1 PONDR-FIT score versus the average of all species used in the amino acid sequence alignment (Supplemental Figure S2A). Unsurprisingly, the five most similar to human in amino acid sequence identity (Supplemental Table S2A) mirrored the human PONDR-FIT disorder score (Supplemental Figure S2B). The species with less than 60% matched identity still showed similar predicted disorder and ordered regions of full-length TNIP1 (Supplemental Figure S2C). This, as well as the PONDR-FIT score similarities, is consistent with reports of predicted structural flexibility being conserved looking at families of proteins and protein domains [62] as well as protein homologs across diverse species with low conserved amino acid identity [63].

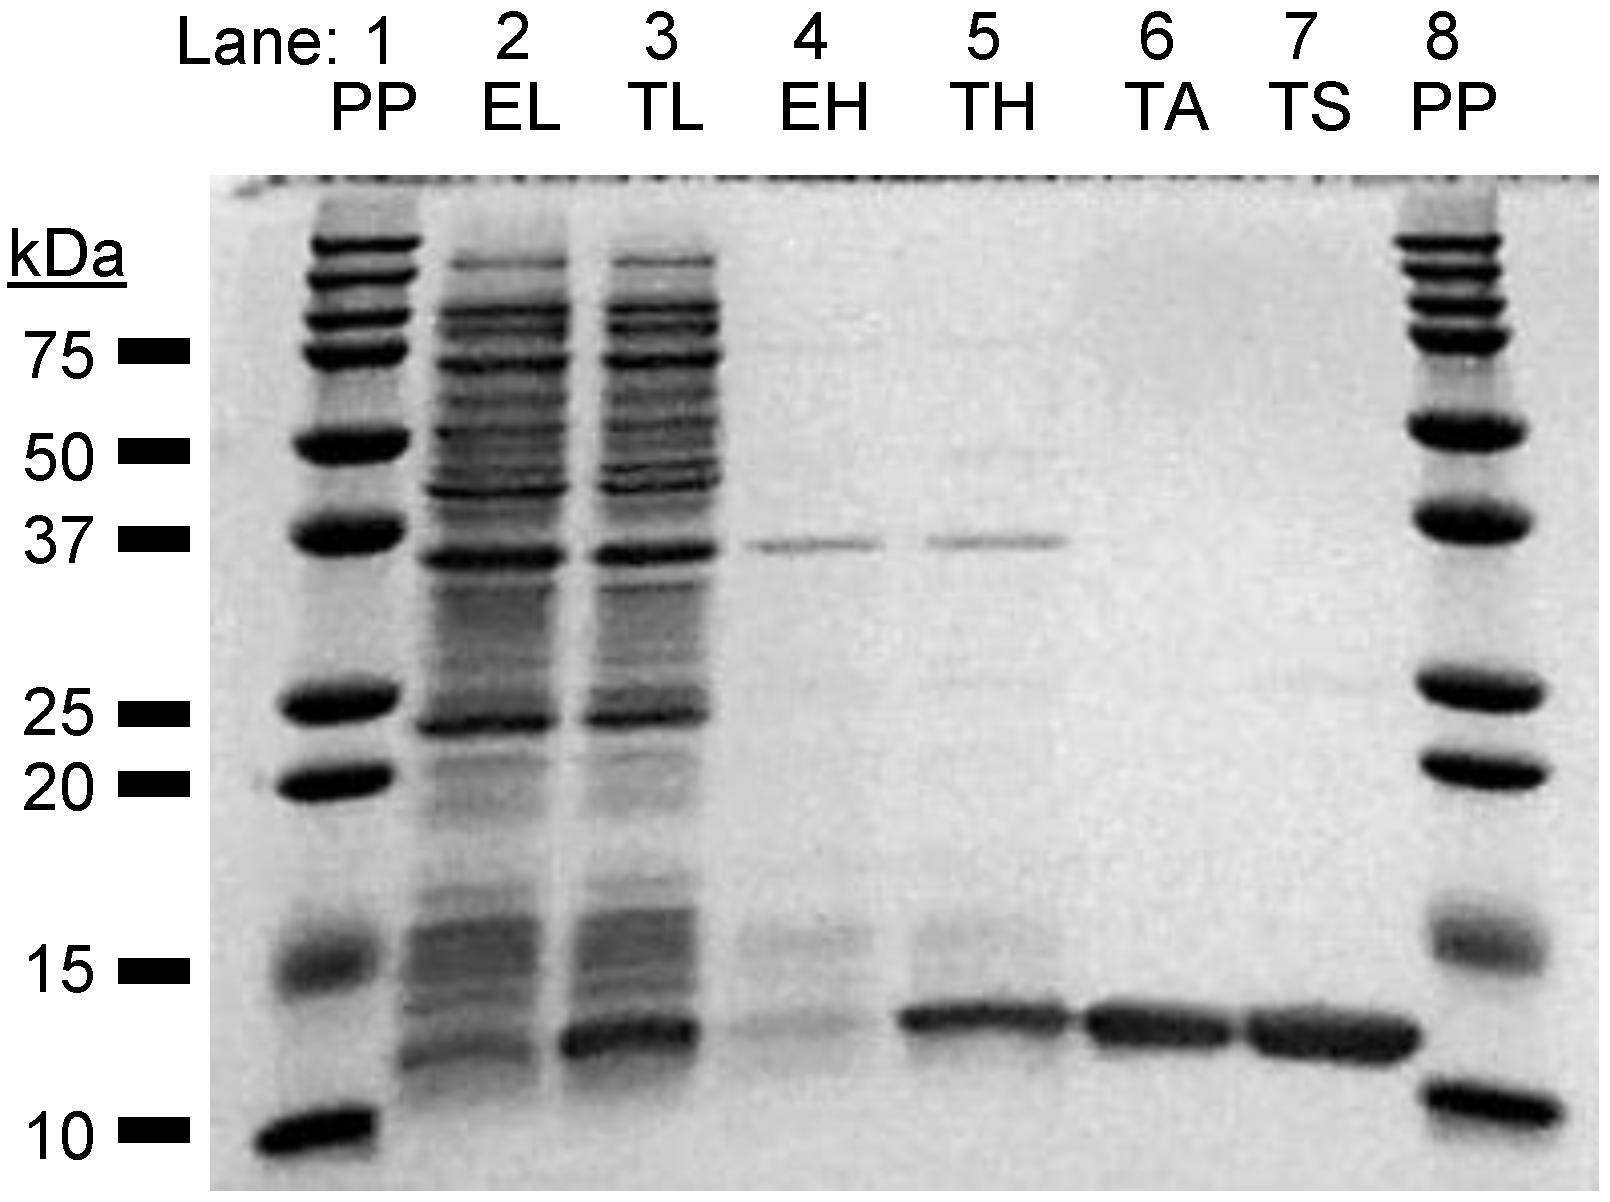
3.2. Full-Length TNIP1 Expression and Limited Proteolysis

Structural flexibility and lack of tight, packed hydrophobic regions in IDPs introduces unique challenges to expressing and purifying recombinant IDPs. Namely, with increased peptide surface exposure to the environment, IDPs are increasingly more sensitive to protease digestion by bacterial host enzymes [35,36,64,65]. Recombinant expression of full-length TNIP1 (pET28a-TNIP1 with C-terminus His6 tag) resulted in poor yields of purified protein under typical conditions (lysis by sonication with protease inhibitors present, data not shown), most likely due to degradation by proteases active in the bacteria becoming released with lysis and being retained through purification. However, taking advantage of an often IDP-associated property of thermal stability at high temperatures in solution [47,48,49,50,51], we are able to obtain an enriched protein TNIP1 band at ~81 kDa (by gel scanning analysis) (Supplemental Figure S3A). Notably, this apparent SDS-PAGE gel molecular weight from migration standards is higher than the predicted 73.92 kDa (71.82 kDa TNIP1 plus 2.1 kDa linker/HIS6 tag). This is not unexpected as this increased shift in molecular weight, often attributed to be due to poor interactions with SDS, is commonly seen with proteins featuring compositional bias typical of IDPs (increased net charge and reduced hydrophobicity) [66]. Affinity purification of full-length TNIP1 resulted in retrieval of the presumed full-length protein, as well as a pattern of smaller protein products (Supplemental Figure S3B). The larger band was confirmed as full-length TNIP1 by LC-MS/MS, with the smaller band identified as His6 tagged proteins by Western blot analysis (Supplemental Figure S3C). The presence of smaller C-terminus His6 tagged bands indicates the sensitivity of full-length recombinant TNIP1 to cleavage by endogenous bacterial proteases during expression. To delve further into the potential increased exposure due to intrinsic flexibility, we performed limited proteolysis experiments. Full-length TNIP1 was mixed with limiting trypsin (Figure 2) and chymotrypsin (Supplemental Figure S4B) (both at 1:250, enzyme: TNIP1 (w/w)) and over 30 min, five separate samples were collected with proteolysis occurring at 25 °C and 37 °C.
Over the time course at both temperatures there is a degradation of the full-length TNIP1 band by 30 min at 25 °C with almost total degradation of all starting protein bands at time zero, aside from one at ~27 kDa, by the 30 min time point. The increased rate of degradation is typical of IDPs, such as characterized IDP alpha-casein [67], especially when compared to globular bovine serum albumin (BSA) (Supplemental Figure S4A). This result indicates the inherent flexibility of TNIP1 and that it is retained in the smaller protein bands yielded during expression and purification.

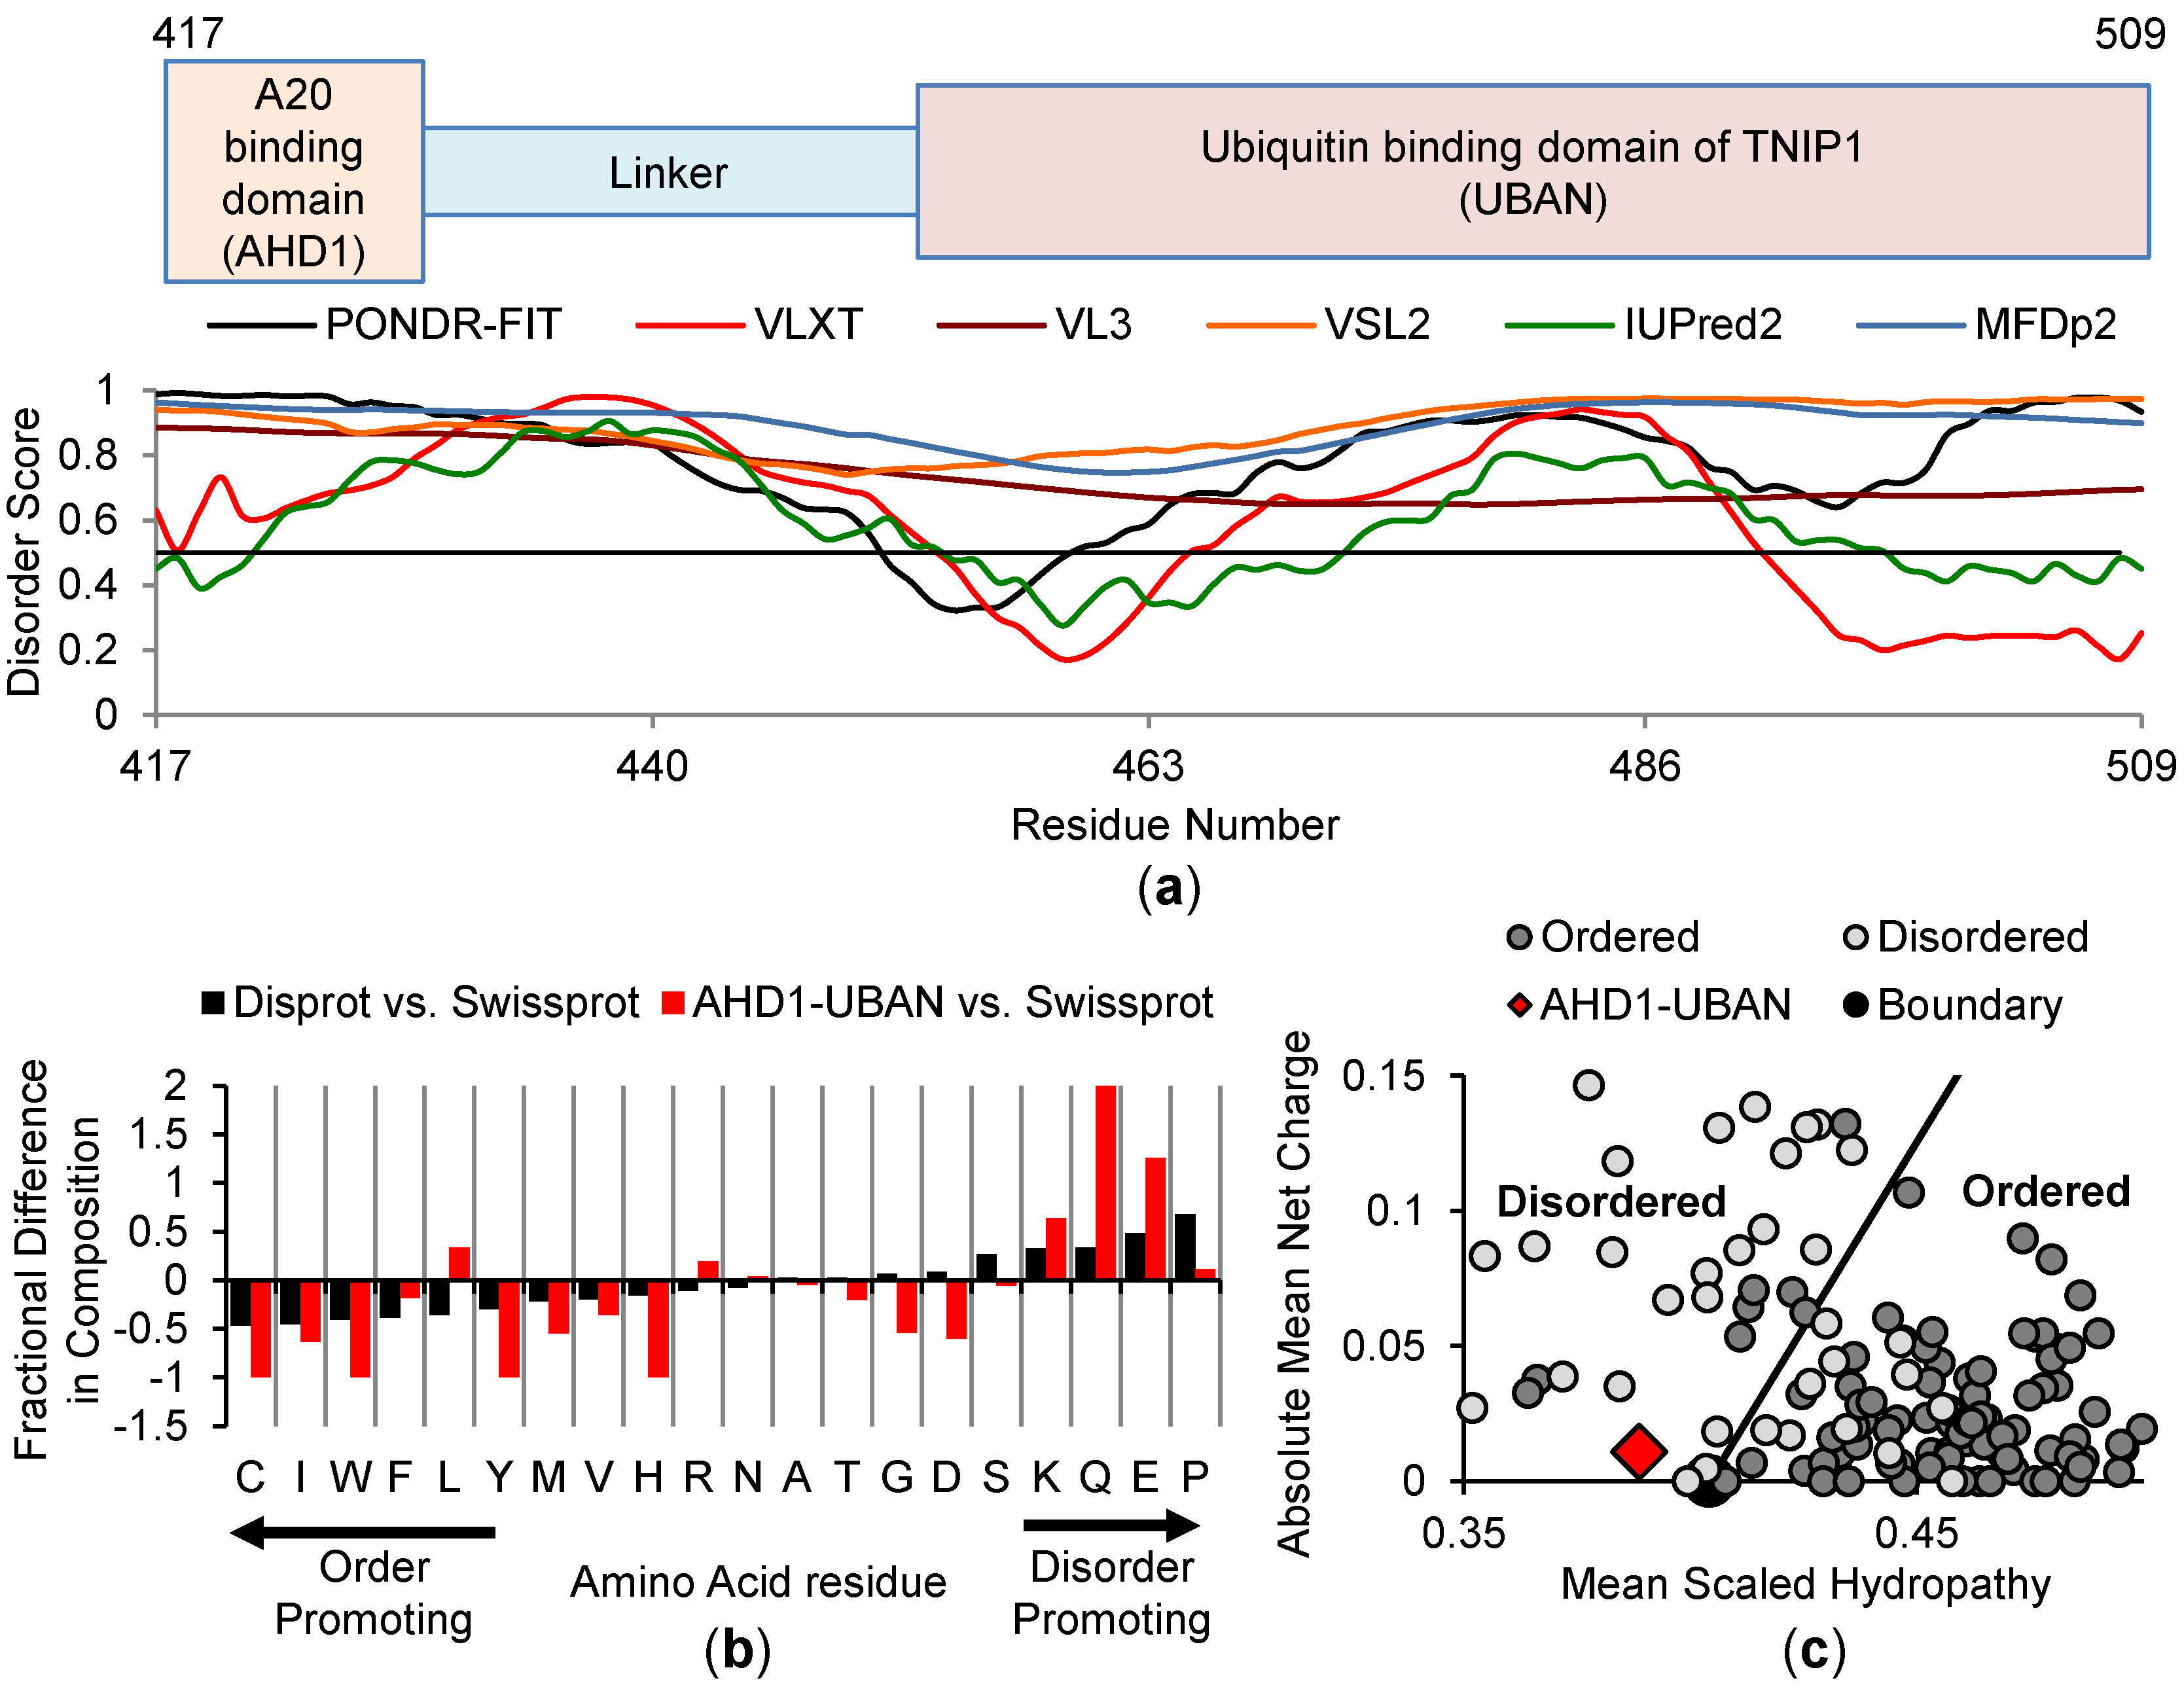
3.3. In Silico Analysis of the Anti-Inflammatory AHD1-UBAN Region of TNIP1

To investigate the AHD1 and UBAN domain structure, we first took advantage of a similar approach as with the full-length protein, performing in silico analysis of the anti-inflammatory AHD1-UBAN region [25,33,68] with complementary disorder prediction algorithms. Using AA417-509 of full-length TNIP1, we see that outputs of the standalone and meta-predictors show a consensus on most of the TNIP1 AHD1-UBAN construct being disordered (Figure 3a). Current crystal structures of the analogous regions from mouse TNIP1 and human TNIP2 proteins indicate they can achieve a coiled-coiled conformation. Thus we assessed human TNIP1 AHD1-UBAN with DeepCoil (Supplemental Figure S5) [69] and found this region was predicted to form a coiled-coil consistent with the X-ray structures despite the limited amino acid identity (~30% by Clustal Omega) shared by this TNIP1 region and the analogous region in TNIP2. Like the full-length TNIP1 protein, the TNIP1 AHD1-UBAN region shows an amino acid content bias similar to disordered proteins in the Disprot database (as compared to Swissprot) (Figure 3b). There is depletion of hydrophobic core-promoting residues with a great enrichment of polar (glutamine) and charged amino acids (glutamic acid). This is reflected in the charge–hydropathy plot of the AHD1-UBAN region construct (Figure 3c), with this TNIP1 region (red diamond) being located among disordered proteins (light grey circles) left of the boundary line among the increasingly hydrophilic IDPs. Taken together, these different in silico assessments point to the increased likelihood that this region featuring both the AHD1 and UBAN domains are extended and structurally flexible. Additional TNIP1 surface charge factors such as phosphorylation will likely affect its conformation. For instance, D2P2 analysis of TNIP1 reveals several amino acid residues along the full-length protein as sites of possible post-translational modifications (Supplemental Figure S6). In particular, within the AHD1-UBAN AA417-509 region, there are five residues for potential phosphorylation and at least two MoRF regions predicted.

3.4. Expression and Limited Proteolysis of the TNIP1 AHD1-UBAN Domain

Considering peptide regions expressed in structural studies for the analogous regions of human TNIP2 and mouse TNIP1 [21,22], we generated a human TNIP1 AA417-509 expression construct (TNIP1417-509) with a C-terminus HIS6 tag (12.7 kDa total predicted molecular weight (MW)). As with the full-length protein work above, solubilization and purification of the TNIP1417-509 protein was accomplished with heat lysis of bacterial pellets (Figure 4, TNIP1—lane five) which in multiple reports of recombinant expression of IDPs has proven to promote enrichment of the intact disordered protein and preferential reduction in other heat-denatured proteins (e.g., proteases). The TNIP1417-509 resistance to thermal denaturation provided earlier evidence of a non-globular conformation for the region. Perhaps indicating sites for endogenous bacterial proteases outside this region, the TNIP1417-509 domain, unlike the full-length TNIP1 protein, had little to no apparent breakdown products. With a combination of affinity purification followed by a final size-exclusion chromatography step (Figure 4—lane seven), the TNIP1417-509 was enriched to >95% purity by densitometry analysis of SDS-PAGE resolved samples.
From in silico analysis showing the TNIP1417-509 region as predominantly natively unfolded, we predicted increased in vitro protease sensitivity, paralleling that seen with the full-length protein. To test this, we subjected the expressed region to very limiting amounts of trypsin (trypsin: TNIP1417-509 (w/w) at 1:1000 and 1:2500) at 25 °C (Figure 5). With 1:1000 (trypsin: TNIP1417-509), there is no protein remaining at 30 min. As expected with a lower trypsin amount (1:2500 for trypsin: TNIP1417-509), there was more intact TNIP1417-509 retained with the most obvious difference to the 1:1000 ratio at the 10, 15, and 30 min digestion time points. Taken together, the lack of denaturation during the high heat, thermal-stability lysis and elevated sensitivity to protease at extremely limiting amounts point to the TNIP1417-509 construct being natively unfolded with minimal secondary structure and most of the amino acid sequence exposed to the environment.

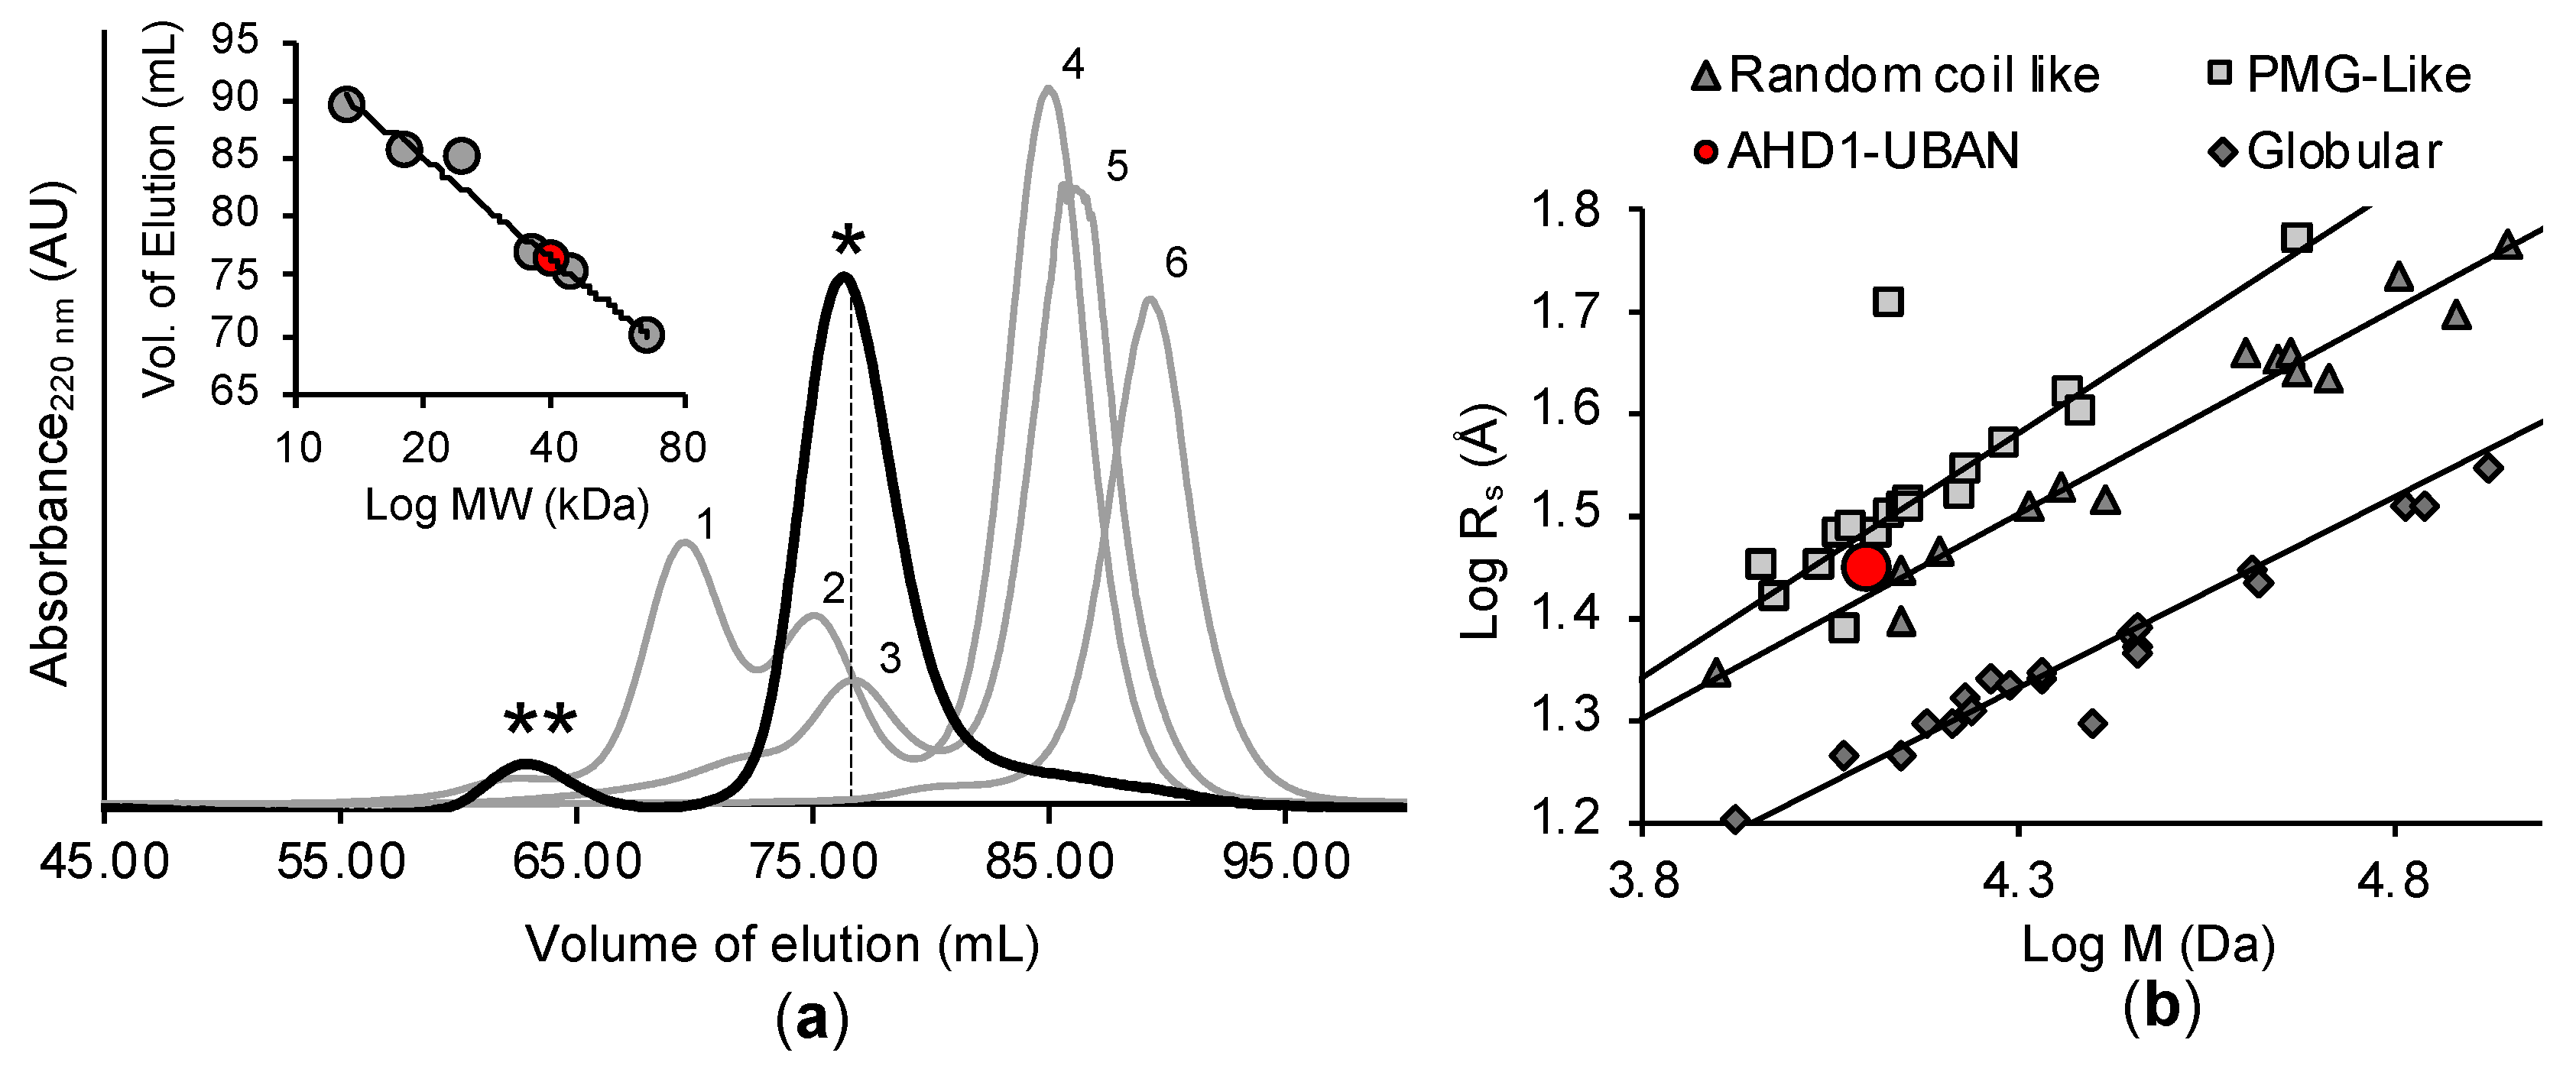
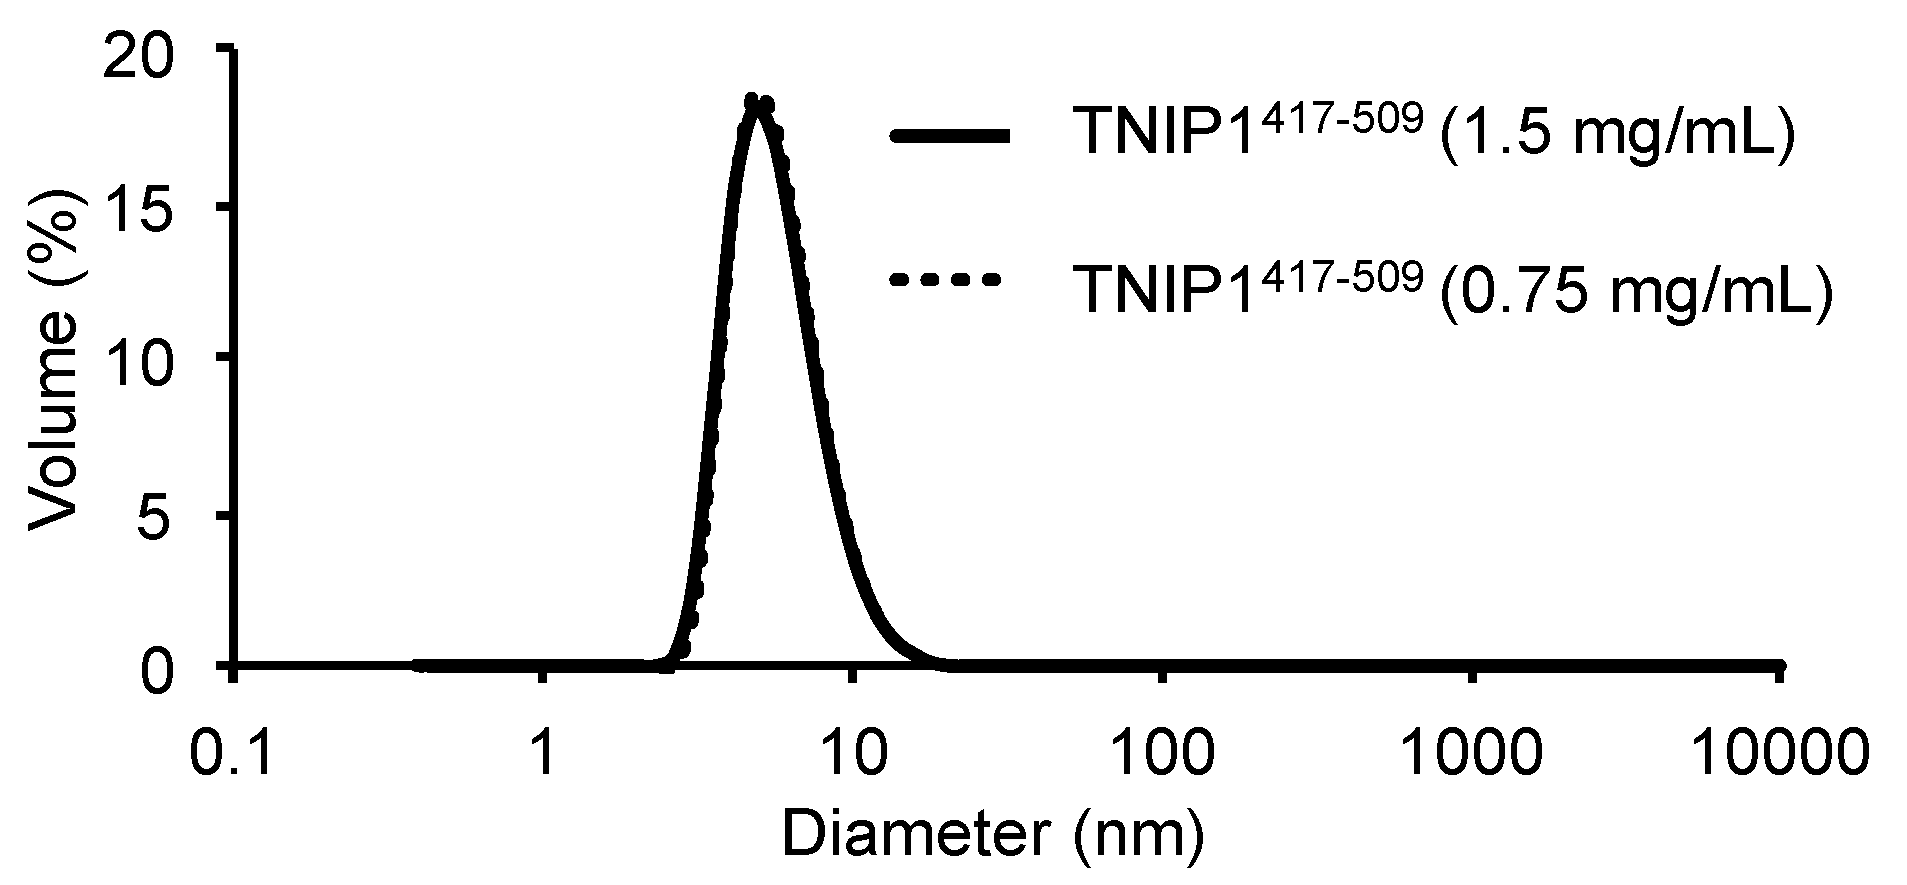
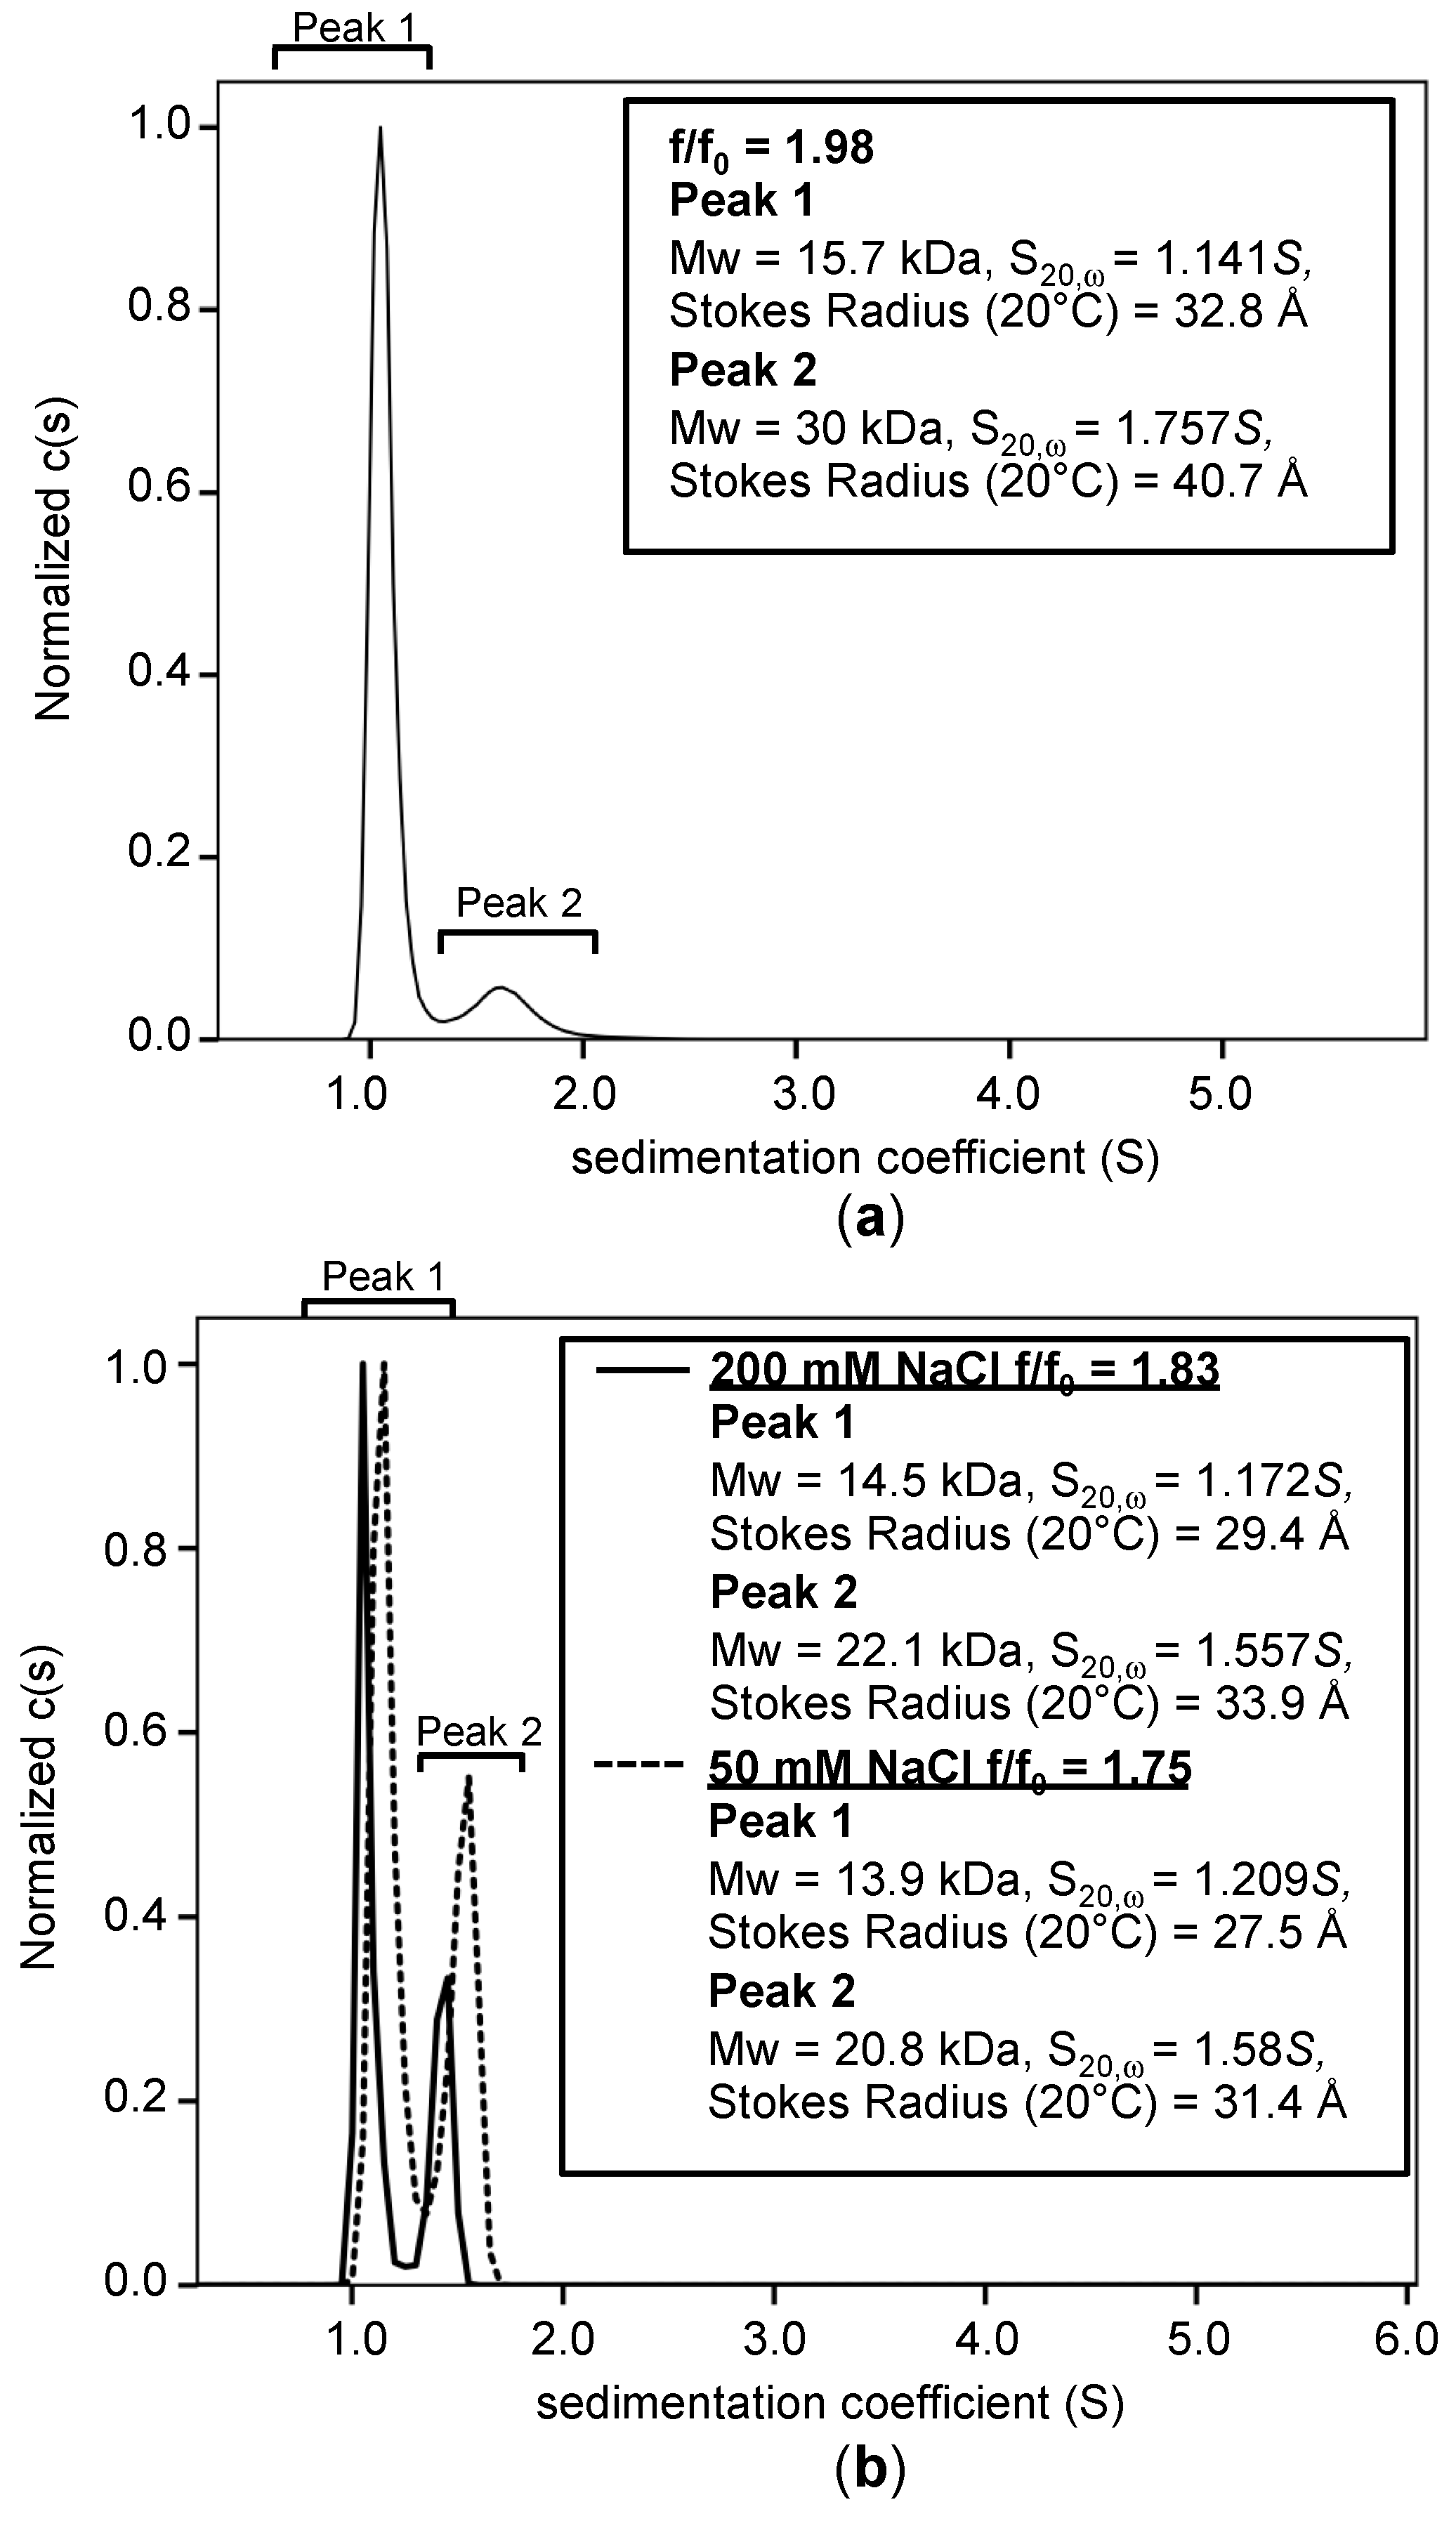
3.5. Analysis of Hydrodynamic and Oligomerization Properties of TNIP1 AHD1-UBAN Region

IDP and IDPR frequently display an extended hydrodynamic volume and apparent molecular weight in excess of that predicted from their amino acid content [66]. To assess hydrodynamic radius, we performed analytical gel-filtration with purified TNIP1417-509 comparing it against a panel of standards. The TNIP1417-509 construct eluted predominantly as one species with a minor, secondary species in an earlier elution fraction (Figure 6a—main graph). Plotting the TNIP1417-509 elution volume against the previously run molecular weight standards and their elution volume (Figure 6a—inset graph), showed the TNIP1 AHD1-UBAN region eluted with an apparent molecular weight of ~40 kDa corresponding with a hydrodynamic radius (Rs) of 28.1 Å, greater than the predicted molecular weight (12.7 kDa) and associated hydrodynamic radius (15.4Å) based on encoded amino acid content.
Comparing the characterized hydrodynamic radius in relation with the molar mass of the TNIP1 AHD1-UBAN to proteins featuring varying degrees of compactness (random coil, pre-molten globule like proteins taken from [53] and globular proteins taken from [54]) (Figure 6b), we see that the TNIP1 AHD1-UBAN domain (red dot) is among the unfolded random coil and pre-molten globule-like proteins. In addition to the prominent species, a minor, secondary species was eluted with an apparent MW of ~100 kDa (apparent hydrodynamic radius of 38 Å), suggesting it may be a self-associated dimer of the TNIP1417-509 region. Dynamic light scattering (DLS) of the TNIP1417-509 region revealed a moderately polydispersed population (PDI 0.291) measured as total volume by percentage (Figure 7) of the highest of two protein concentrations probed (1.5 mg/mL (117 µM)). One major peak was found for both concentrations probed (1.5 mg/mL (117 µM) and 0.75 mg/mL (58 µM)) with a measured average hydrodynamic radius of 29.6 Å, corresponding with an apparent molecular weight for spherical particles of ~42 kDa. In parallel, molecular weight determination via static light scattering (SLS) reported a MW of 11.3 +/− 1.18 kDa for the sample. This closely matches the monomer weight while being low when compared to the measured hydrodynamic radius, thus suggesting, while featuring some heterogeneity at the concentrations used for the light scattering experiments, that the population consists predominantly of monomeric TNIP1417-509. These results parallel and reinforce those from the analytical gel filtration, both data sets pointing to the TNIP1417-509 construct being extended and non-spherical in shape with an increased hydrodynamic radius as compared with the predicted and measured MW.
To combat DLS lacking the resolution needed to parse out the different monomer and oligomer states of the protein, we performed analytical ultracentrifugation (AUC). Sedimentation velocity experiments were conducted using 20 µM (0.25 mg/mL) TNIP1417-509 at pH 8.0 (Figure 8a). The observed major species (90% of total) at a sedimentation coefficient (s-value (20, ω) of 1.141S had a measured MW of 15.7 kDa (rms residual for fit = 0.0051 fringes), marginally different from the predicted 12.7 kDa. This minor deviation is likely due to the assessed sample consisting of a heterogeneous population. A second species (10% of total) with an s-value (20, ω) of 1.757S yielded a measured MW of 30 kDa. This is double that of the major peak and provides distinct biophysical characterization in addition to the above gel filtration and DLS for AHD1-UBAN region dimerization. Stokes radius of the major species was calculated to be 32.8 Å, which closely correlates with the Stokes radii determined by analytical gel filtration and DLS (28.1 and 29.6 Å, respectively). The frictional ratio (f/f0), which is indicative of a protein’s shape and used as a primary determining factor of a protein’s intrinsic disorder [70] was determined to be 1.98 (Figure 8a, inset). This value falls within the range that is associated with extended IDPs, whereas globular proteins are closer to 1.2–1.3 [70]. To observe potential pH-dependent oligomerization, we performed AUC at pH 5.8 with 200 mM NaCl (rms residual for fit = 0.0033) and 50 mM NaCl (rms residual for fit = 0.0041) (Figure 8b and summarized in Table 1). We found an increased amount of putative dimer with 200 mM NaCl as compared to the pH 8.0 experimental run (Figure 8), with slightly greater amounts with 50 mM NaCl (pH 5.8, 200 mM NaCl-30%, pH 5.8, 50 mM-38%, pH 8.0, 200 mM NaCl-10%). Interestingly, with increased amounts of what we are calling the dimer peak, we see (Figure 8b, inset) a reduction in the frictional ratio (at 0.25 mg/mL: pH 5.8, 50 mM NaCl-f/f0 = 1.75, pH 8.0, 50 mM NaCl-f/f0 = 1.98) (Table 1). This may be reflecting increased alpha-helical secondary structure with increased self-association (or compactness) and reduction in the overall intrinsic disorder. These AUC studies indicate TNIP1417-509 exists in a mixed population as monomer and dimer, thus supporting the implicated oligomerization from analytical gel filtration and DLS. This dimerization is pH-dependent and is increased under acidic conditions.

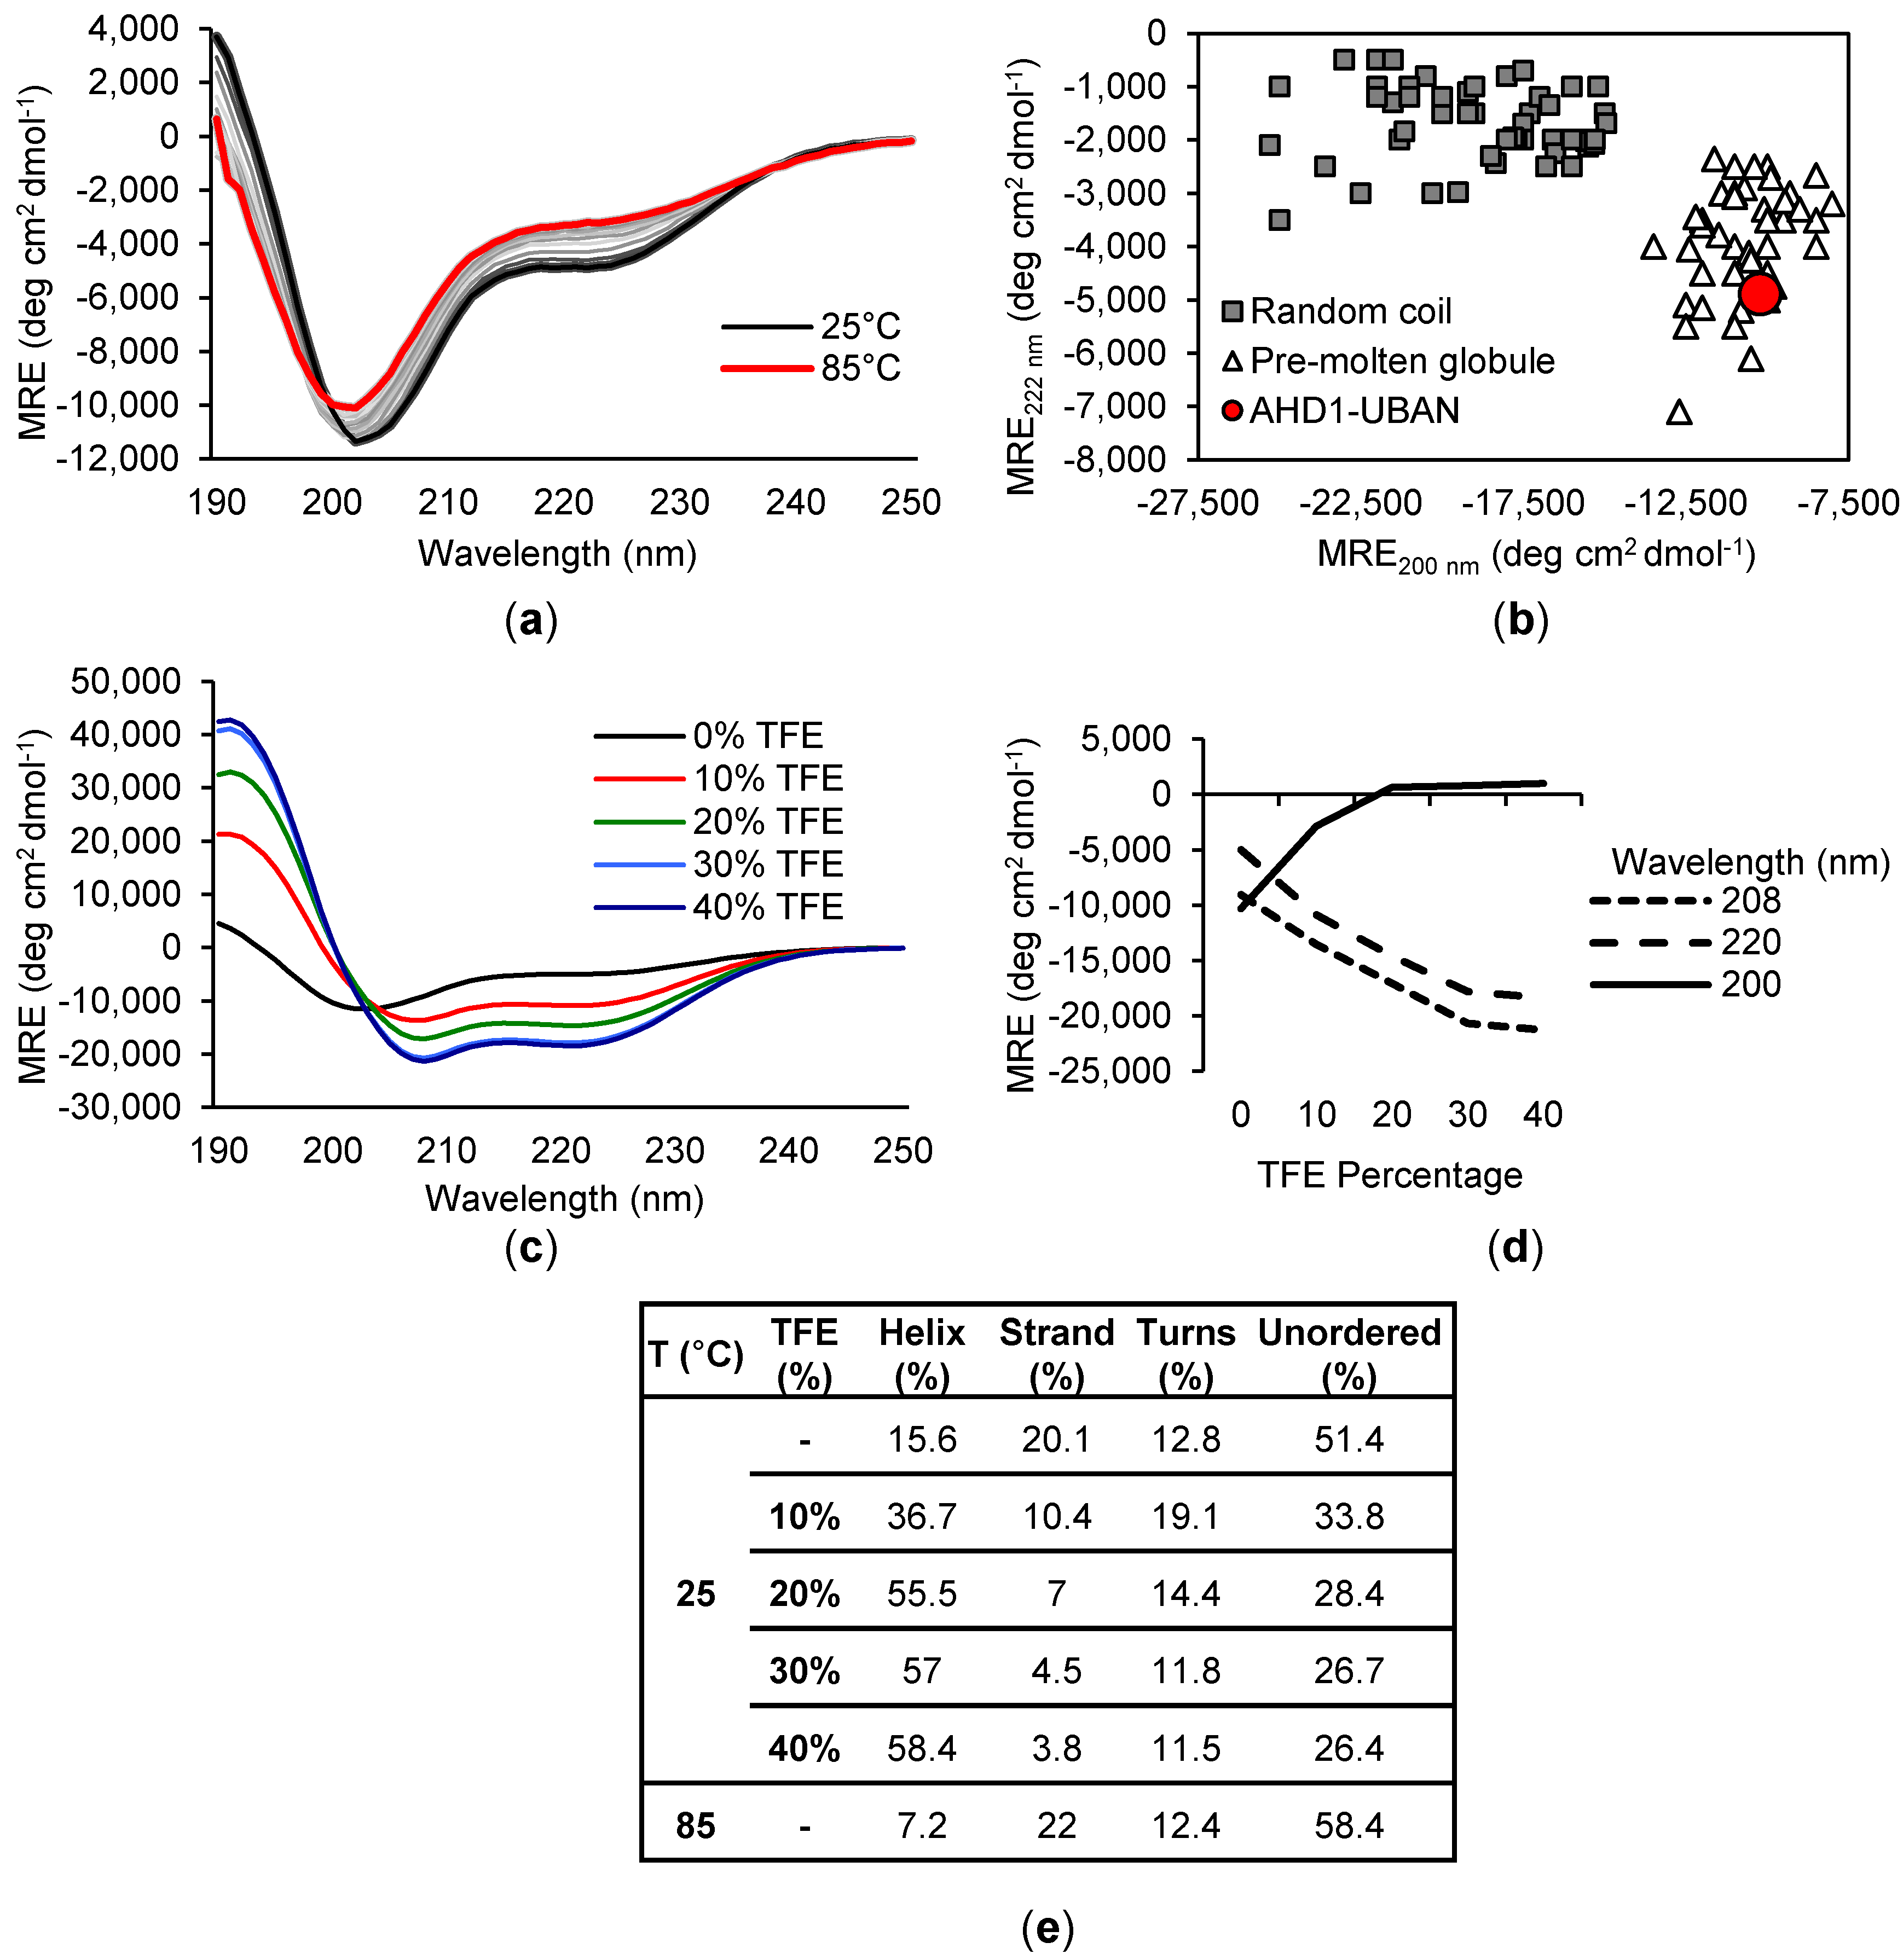
3.6. Estimation of Secondary Structure within the TNIP1 AHD1-UBAN Region by Circular Dichroism

To investigate the potential secondary structure of TNIP1417-509, we used far-UV circular dichroism (CD) spectroscopy. The obtained far-UV CD spectrum of TNIP1417-509 (10 μM) at 25 °C (Figure 9a—black line) shows a common profile associated with IDPs with a characteristic global minima at ~200 nm. However, non-negligible ellipticity between 208 and 222 nm suggests the existence of some secondary structure. Plotting the ellipticity at 200 versus 222 nm (adapted from [45]) (Figure 9b), an analysis method proposed by Uversky for discriminating between random coil and pre-molten globule proteins, shows TNIP1417-509 falls in with the pre-molten globule population. Deconvolution of the data using the Contin-LL method [55] reported 56% of the protein structure as unordered.
This percentage disorder is consistent with TNIP1417-509 being more pre-molten globule-like, featuring limiting amounts of secondary structure as compared to mostly (or entirely) unfolded random coils [45]. As expected based on the isolation protocol and commonly observed IDP-associated CD spectra, heating the protein from 25 °C to 85 °C (Figure 9a—red line) in five degree steps promoted minimal shift in the overall secondary structure, with a reduction in alpha-helical structure (15.6 to 7.2%) and minor increase in overall unordered content (51.4 to 58.4%). The addition of 2,2,2-trifluoroethanol (TFE), a commonly used co-solvent which promotes alpha-helical structure [71], induced substantial shifts in the far-UV CD spectra of the TNIP1417-509 construct (Figure 9c). With increased percent TFE, total alpha-helical content increased inversely as compared to total unordered content. This is apparent with the appearance of a local minimum at 220 nm and shifting of the global minimum from 200 nm to 208 nm (Figure 9d), both characteristic of alpha-helical secondary structure [72]. This is reflected in the deconvolution of the data (Figure 9e) with greater than 58% of the protein consisting of alpha-helices at maximal TFE from 15% alpha-helical content with no TFE. The CD spectra under baseline conditions and with TFE titration indicates that the TNIP1417-509 construct is predominantly an unordered pre-molten globule in solution and, like other IDP, has increased alpha-helical features induced by TFE.

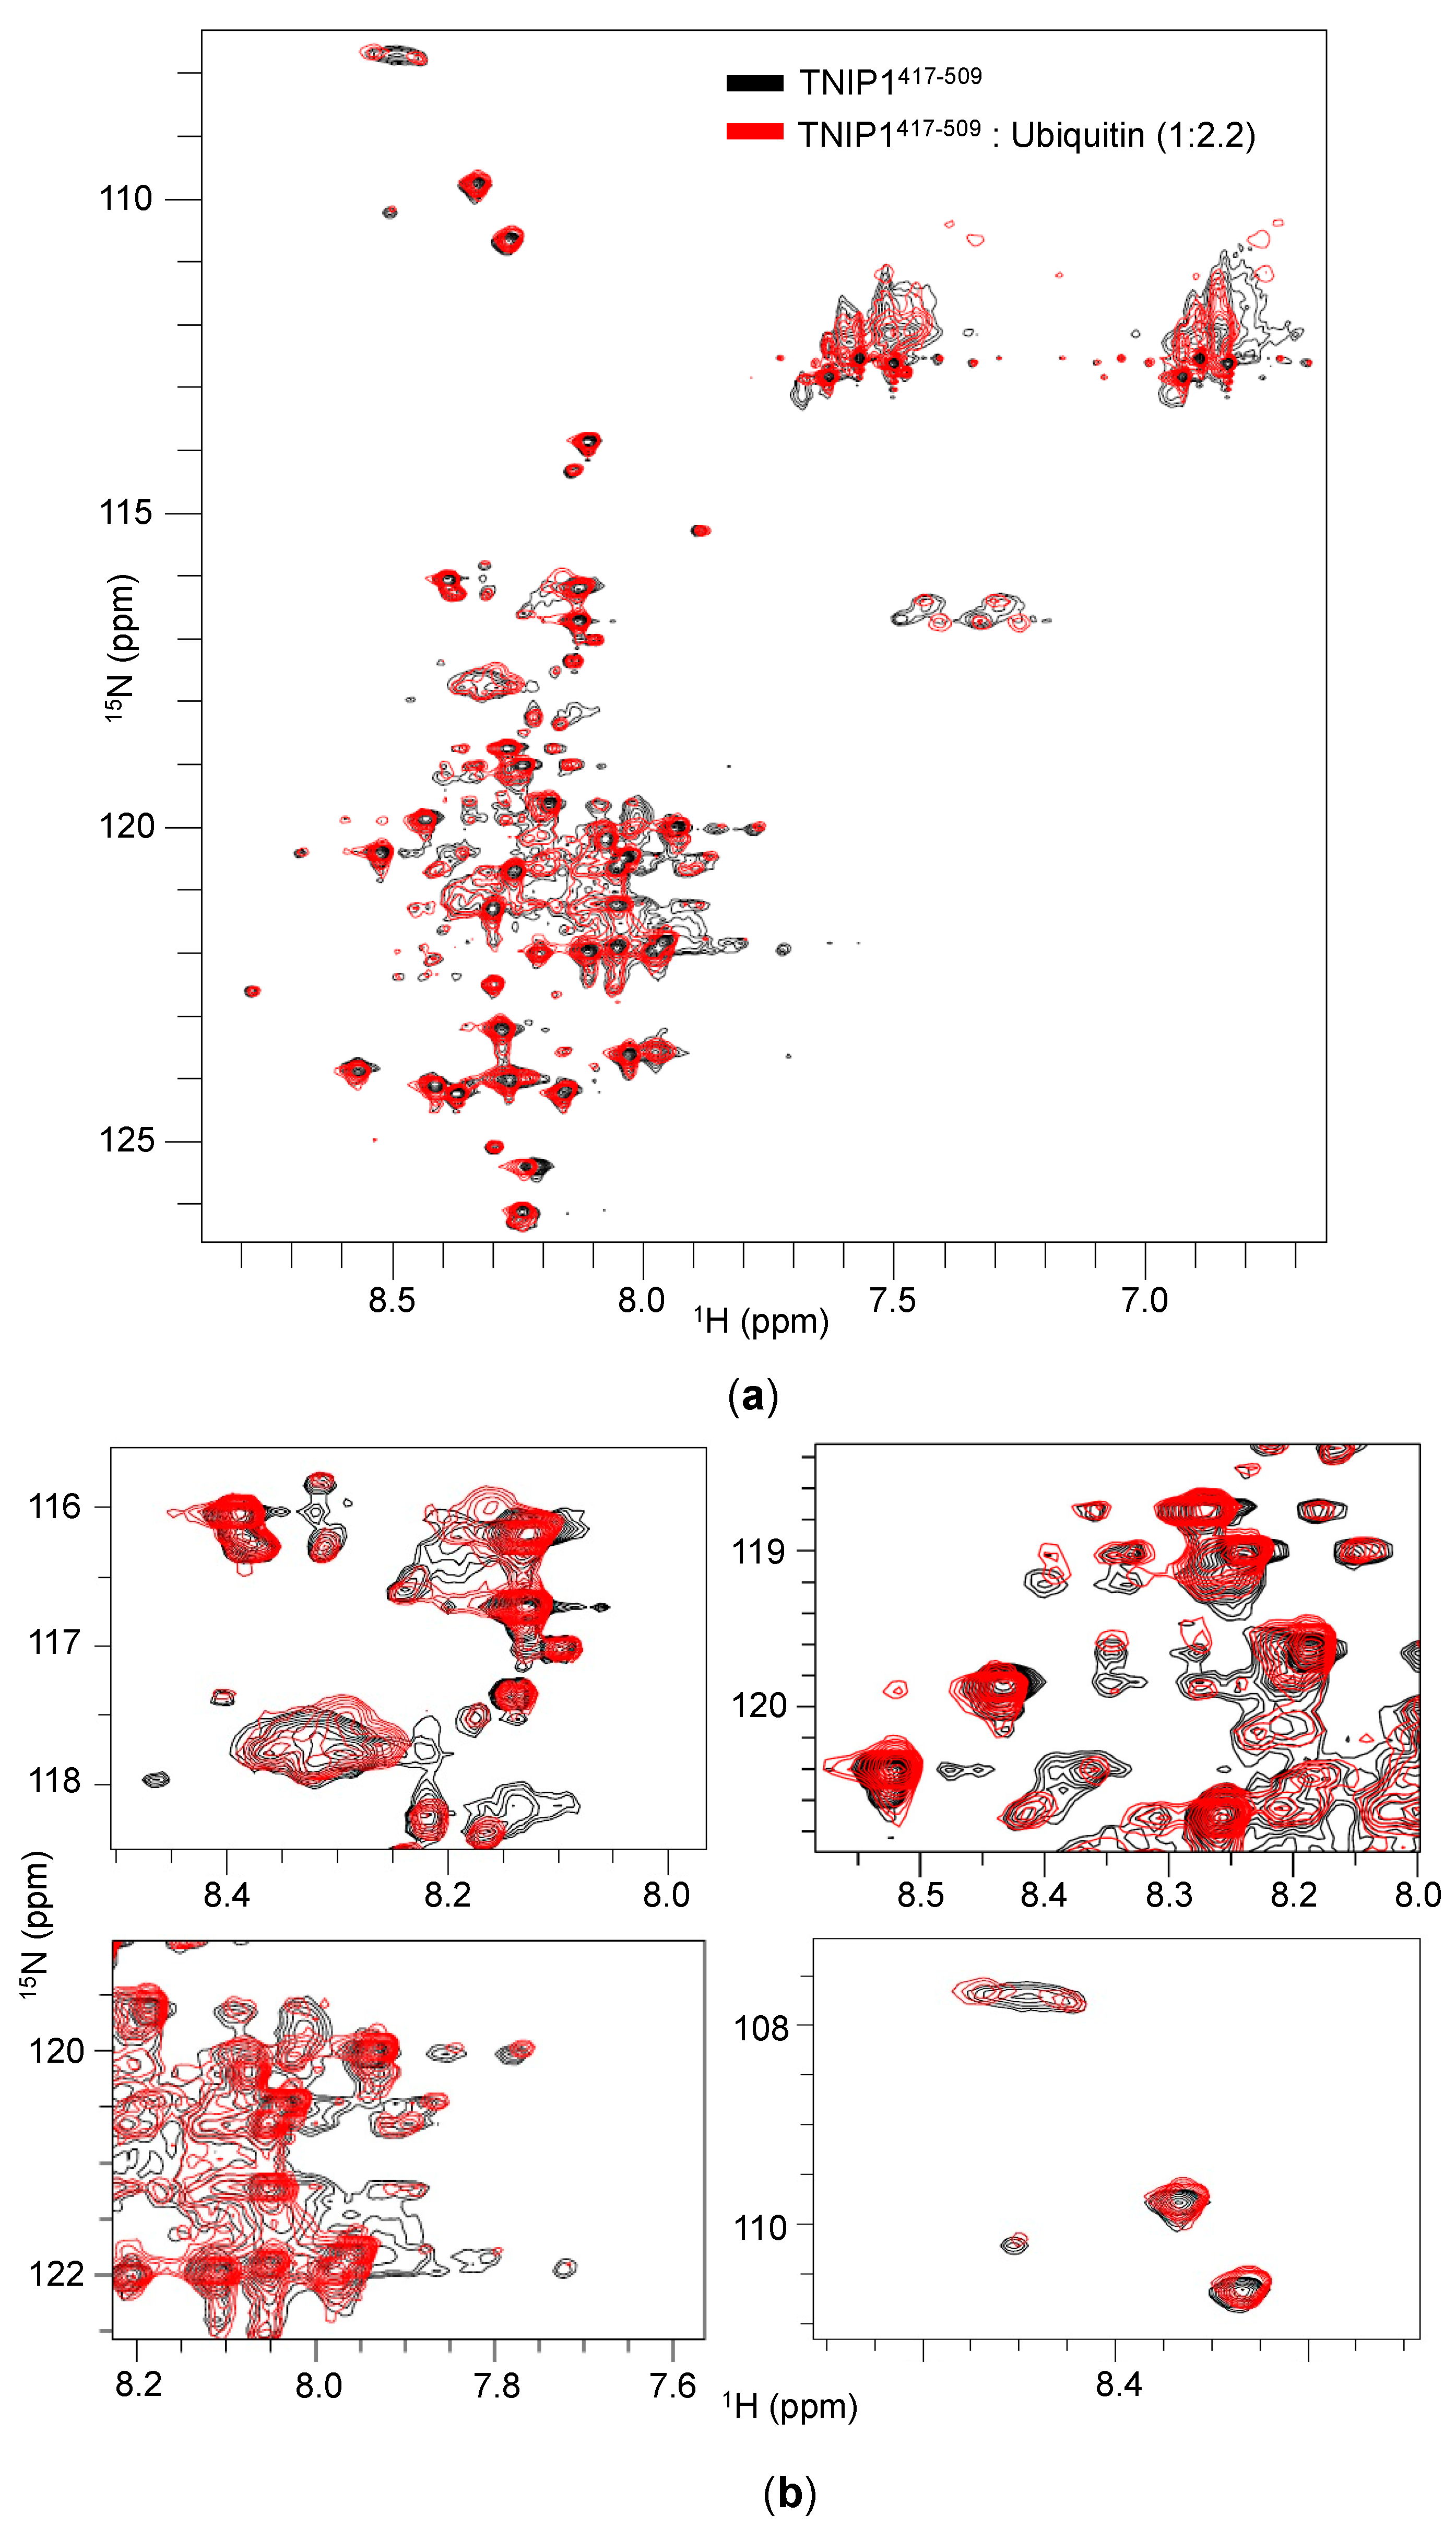
3.7. 1H–15N HSQC NMR to Visualize Structure and Dynamics of TNIP1 AHD1-UBAN in Solution

In the investigation of non-static IDP/IDPR conformations, NMR spectroscopy is a valuable tool providing residue-level information about multiple protein characteristics (e.g., backbone dynamics, overall level of secondary and tertiary structure) simultaneously [73]. We recorded 1H–15N HSQC 600 MHz NMR spectra for TNIP1417-509 alone at pH 6.6 (Supplemental Figure S7A), pH 5.8 (Figure 10a—black and Supplemental Figure S7B) and in complex with ubiquitin [25] (Figure 10a—red). Both HSQC spectra collected at pH 5.8 and 6.6 show poorly dispersed amide regions (8.7–7.8 ppm) [73] with peak proton frequencies situated mainly within the random coil values, a characteristic of disordered proteins (Supplemental Figure S7C). There are fewer amide peaks in the spectrum than expected, due to a number of potential reasons. For instance, lack of amino acid diversity, as reported above (Figure 3b) in our compositional bias analysis, promotes the overlapping of peaks. Peak overlap would be especially furthered in the absence of a folded core which could otherwise provide unique magnetic environments and better dispersion. Additionally, exchange at an intermediate rate (on an NMR timescale) between different conformations, both within the monomeric population and due to intermolecular binding/oligomerization, might result in peaks line broadening beyond detection. The latter is supported in part by the sedimentation velocity experiments performed at pH 5.8, which suggest 38% of the total protein population may exist as a dimer (with 50 mM NaCl).
This is consistent with reduced line broadening in the spectra collected at pH 5.8, potentially revealing beneficial changes in exchange rates associated with increased population of dimerized AHD1-UBAN. This reasoning, however, does not exclude other explanations. For example, sharper peaks may just reflect reduced water–amide exchange. The NMR data further adds that through dimerization, a fixed, static secondary or tertiary structure is not necessarily obtained. However, it remains possible that the putative dimer is invisible being a minor component of the total population, not able to contribute enough detectable secondary or tertiary structure features to be detectible in the spectra. With addition of molar excess amounts of ubiquitin (1:2.2, TNIP1 AHD1-UBAN: ubiquitin), we see a perturbation of resonances (Figure 10b) indicating binding.
However, perturbations are small, suggesting that overall conformational rearrangements do not occur. Several new peaks also appear while others become sharper, suggesting that one of the potential conformations may become predominant/stabilized. Still, the overall spectra remain poorly dispersed suggesting interaction with a binding partner may not facilitate complete adoption of secondary/tertiary structure. Instead, there may be a low affinity interaction that promotes a change in conformational ensemble.

4. Discussion

IDP and proteins featuring IDR are a population of proteins which, as compared to globular proteins with fixed conformations, are characterized by dynamic protein backbones, increased polarity/charge, and lack of a tight hydrophobic core. This dynamic, often extended protein structure allows for unique protein conformation assembly through specific modifications (e.g., interaction with binding partners, post-translational modifications). Protein intrinsic disorder is prevalent within proteins critical to the maintenance of human health as regulators of cellular signaling, among other functions [74]. Here, we present work which when taken together positions TNIP1 protein existing as a partially intrinsically disordered protein. Furthermore, isolation, purification and biophysical characterization of the TNIP1 AHD1-UBAN domain (i.e., TNIP1417-509) has revealed that it features significant intrinsic disorder. These endpoints were first assessed using bioinformatics methods built on common features among structurally flexible proteins and protein regions (e.g., increased net charge, high hydrophilicity, and enrichment of polar, charged or “structure-breaking” amino acids) [75,76]. We determined that both full-length TNIP1 and TNIP1417-509 have amino acid compositions in line with typical IDP and IDR, featuring increased polar and charged residues and deceased occurrence of non-charged residues featuring hydrophobic side chains (Figure 1a and Figure 3b). Consequently, the algorithms used predicted overall increased per-residue disorder scores for both the full-length TNIP1 and TNIP1417-509 proteins. This is reflected as well in the predicted disorder agreement from the D2P2 analysis of TNIP1 (Supplementary Figure S6). Included in this analysis are numerous predicted post-translational modification sites, including in the AHD1-UBAN region (Supplementary Figure S6, inset). Phosphoserine position within the local sequence can have either stabilizing or destabilizing consequences for IDR [77] and is an important consideration for TNIP1 in mammalian cells versus the bacterially expressed protein in these recombinant studies. Furthermore, TNIP1 features a phospho-mimetic residue (E470) that corresponds to a critical phosphorylation site in the UBAN of optineurin. Mutation of the E470 residue of TNIP1 promotes a decrease in affinity for polyubiquitin [21]. The expected intrinsically disordered nature of the full-length TNIP1 was found conserved across 23 species (all species had average PONDR-FIT residue scores greater than 0.6 ranging from 0.62–0.71) despite Clustal Omega alignment showing less than 50% sequence identity (Supplemental Table S2B). Conservation of structural disorder in spite of sequence differences is consistent with reports of conservation of protein disorder featuring reduced amino acid homology [78], especially when compared to retention of residue identity in ordered protein domains. This points to the importance of intrinsic disorder within these proteins, even over conserved homology of specific residues.
The recombinant full-length TNIP1 and TNIP1417-509 behave as structurally flexible proteins in solution as revealed for both through their high sensitivity to proteolytic digestion (Figure 2 and Figure 5, respectively). Additionally, both the full-length protein and TNIP1417-509 region were purified by heat extraction of overexpressed recombinant protein, a method developed for favorably enriching non-globular, non-compaction-dependent proteins. The increased protease sensitivity is likely due to increased solvent accessibility, suggesting both the full-length protein and the TNIP1417-509 region are extended and non-compact. This was supported by compatible data from analytical gel filtration and DLS (Figure 6 and Figure 7, respectively) experiments which determined the molecular radius of TNIP1417-509 at 28.1 and 29.6 Å, ~1.8× greater than would be expected for a globular form of a protein with similar predicted molecular weight. The analytical gel-filtration and DLS experiments revealed initial data with a potential dimer population of TNIP1417-509, which is not unexpected based on reports of the UBAN-only region of murine TNIP1 [21] presenting the UBAN entirely as a coiled-coil. In contrast, our data suggest a mixed population with a secondary peak (Figure 6—double asterisk) from analytical gel-filtration and PDI of 0.291, indicating only moderate polydispersity within our TNIP1417-509 samples. Static light scattering determined the molecular weight of the recombinant protein to be 11.3 +/− 1.18 kDa further suggesting the sample is mostly monomeric. For a better-resolved description of the oligomerization state of TNIP1417-509, we performed AUC and, at both pH 8.0 and pH 5.8, the major population was near the expected molecular weight of monomer TNIP1417-509 (Table 1). There was, however, a second pH sensitive species (ranging from 10 to 38% of the total peak) revealed. This species, approximately double the molecular weight of the major species, is likely dimerized TNIP1417-509 as was reported in the murine TNIP1 UBAN crystal structure suggesting the inclusion of the disordered AHD1 and linker present in our AHD1-UBAN region may have affected the extent of the oligomerization. Oligomerization and aggregation of IDPR have gained increased research importance as increasing numbers of IDPR are shown to undergo liquid–liquid phase separation (LLPS) recently reviewed here [79]. Though LLPS is an unknown about TNIP1, it has been reported that when overexpressed in a mammalian cells, TNIP1 forms “aggregates” [4,80] suggesting there may be high level oligomerization occurring at increased concentrations [81,82].
Deconvolution of the far-UV CD spectra of TNIP1417-509 (Figure 10) revealed that TNIP1417-509 is highly unstructured (56%) in solution. Its secondary structure under basal experimental conditions may also be representative of a mixed population, with the likely more-structured dimer contributing to the overall spectra. Nonetheless, the determined secondary structure was strongly affected with inclusion of the crowding agent TFE, driving the total helical content from 15 to 58%, reducing the overall unstructured component by half. This is in line with this region of TNIP1 having potentially inducible secondary structure as is commonly found in IDPR [83]. Additionally, the CD data suggest that under basal conditions, the protein is mainly unfolded, containing transient secondary structure, i.e., it exists in pre-molten globule form. This becomes especially clear when looking at the analytical gel filtration and CD data (Figure 6b and Figure 9b, respectively) in comparison with characterized IDPs, as was commonly employed in foundational IDP literature [45,53,84,85]. Consistently, the AHD1-UBAN region in solution is grouped among the disordered standards and within the pre-molten globule population. This along with the other data presented here strongly suggests the AHD1-UBAN region features intrinsic disorder when in solution and exists primarily in a monomeric form.
An important feature of intrinsic disorder within protein regions is the concept of continuous shifting between conformational states [86] and existing within a conformational ensemble [87]. The previously discussed data provide an averaged conformational snapshot of TNIP1417-509 in solution; protein dynamics are better informed by methods including NMR [87]. The 1H–15N HSQC NMR spectra of TNIP1417-509 (Figure 10a—panel 1) yields poorly dispersed cross peaks with residues mainly in the random coil spectral region, confirming likely protein disorder as determined by the other methods used in this paper. However, a limited number of peaks are resolved and this, while also in support of TNIP1417-509 as existing in a dynamic conformational state, is a limit of looking at pre-molten globule-like proteins on the 1H–15N HSQC NMR timescale. The increased intermediate exchange may be promoted by continuous dimerization of TNIP1417-509 monomers or intramolecular exchange through TNIP1417-509 existing with a conformational ensemble. However, considering the sedimentation velocity data helps to inform interpretation of NMR spectra as being compatible with some subpopulation of TNIP1417-509 being a dimer. We expect the dimer form of TNIP1417-509 comprises a minority of the overall species and likely is not the major contributor to dynamic exchange featured in the HSQC spectra. Likely, we are observing TNIP1417-509 transitioning between different conformational states as a monomer as well. Future NMR experiments are planned to examine our reasoning. Additionally of note, the more prominent peaks that do not feature any or much line broadening probably represent the most disordered aspect of the protein. The ubiquitin binding studies performed using 1H–15N HSQC NMR (Figure 10a,b) reveal that the poorly dispersed peaks do not take on a more ordered pattern and indicate the AHD1-UBAN protein does not take on a completely folded structure during such binding. This is not unexpected as the TNIP1 UBAN/monoubiquitin binding has been reported to be a low affinity interaction with a KD of ~100 µM [25]. However, further NMR binding studies need to be performed with increasing lengths of linked-ubiquitin to test whether this holds with polyubiquitin.
The TNIP1 AHD1-UBAN domain, with its role regulating inflammatory cellular signaling, is pictured to function through interaction with multiple partners forming a ternary protein complex [88]. TNIP1 facilitates recruitment and activity of A20 downstream of cell-surface receptor activation for modulation of cytoplasmic signaling [8]. This functionality and the data presented here for the subdomains of the AHD1-UBAN region suggest it, and possibly other TNIP1 regions, function as IDPR effectors, as have been demonstrated in other conformationally adaptable proteins [24]. Furthermore, the data presented here, in concert with previously published UBAN crystal structures, suggest this region features a semi-disordered alpha-MoRF [89] capable of undergoing disorder-to-order transition, a characteristic commonly associated with effector proteins [24]. If this were the case, the intrinsic disorder found within the subdomains of the AHD1-UBAN region may allow for minimal steric hindrance through increased flexibility when contributing to complex assembly triggered by cell signaling activation. Other oligomeric signaling complexes which take advantage of intrinsic disorder have been reported [90,91,92]. Ultimately, the decreased conformational rigidity within the AHD1-UBAN region may promote efficient A20 de-ubiquitination of target proteins by increasing proximity of A20 to polyubiquitin. Crystal structures of the AHD1-UBAN of human TNIP2 [22] have suggested such; however, more research will be required to determine whether this is the case for TNIP1. Related—and also understudied—is the potential role of the linker region flanked by the AHD1 and UBAN of TNIP1. Here, we predicted it to be both highly disordered and structure-breaking. Coincident with this, the linker region lacks predicted coiled-coil formation as it bridges two more-ordered regions (Figure 3a and Supplementary Figure S5). The contribution of this expectedly flexible, proline-rich linker to function within the AHD1-UBAN region will be examined in future studies as it may contribute to proper spatial distancing and independent movement for the AHD1- and UBAN-associated binding motifs [24].

5. Conclusions

We employed in silico and in vitro methods in the study of the potential contribution of intrinsic disorder to TNIP1 protein conformation. To investigate algorithm-driven assessments of TNIP1 protein intrinsic disorder, both full-length TNIP1 and the AHD1-UBAN were recombinantly expressed. Both the full-length and AHD1-UBAN construct (TNIP1417-509) showed increased structural flexibility with increased sensitivity to protease digestion. The AHD1-UBAN was characterized as having an increased hydrodynamic radius and was determined to mostly exist as a pre-molten globule monomer with inducible secondary structure and oligomerization. This region featuring the AHD1-UBAN domains of TNIP1 is characterized by a dynamic conformation and IDP-like binding characteristics including incomplete adoption of fixed structural order when bound by monoubiquitin. Taken together, the data presented here positions the AHD1-UBAN as a semi-disordered MoRF region within a likely disordered full-length protein which may affect TNIP1 function in inflammatory signal repression.

Supplementary Materials

The following are available online at https://www.mdpi.com/2218-273X/10/11/1531/s1, Figure S1: TNIP1 Clustal Omega multiple sequence alignment. Table S1: Species used in silico assessments of full-length TNIP1. Table S2: Percent identity matrix of full-length TNIP1 species comparisons. Figure S2: Comparison of PONDR-FIT residue scores of TNIP1 species homologs. Figure S3: Expression and purification of full-length TNIP1. Figure S4: Limited proteolysis of full-length TNIP1. Figure S5: Coiled-coil prediction across AHD1 UBAN domains. Figure S6. D2P2 analysis of TNIP1. Figure S7. 1H–15N HSQC spectra of AHD1-UBAN under varying acidic conditions.

Author Contributions

Conceptualization, R.S. and B.J.A.; methodology, R.S. and O.V.; validation, R.S., O.V. and B.J.A.; formal analysis, R.S., O.V. and B.J.A.; investigation, R.S., O.V. and B.J.A.; resources, O.V. and B.J.A.; data curation, R.S., O.V. and B.J.A.; writing—original draft preparation, R.S.; writing—review and editing, R.S., O.V. and B.J.A.; visualization, R.S., O.V. and B.A.; supervision, project administration, and funding acquisition, B.J.A. All authors have read and agreed to the published version of the manuscript.

Funding

This project was supported in part by a University of Connecticut PATH (Program in Accelerated Therapeutics for Healthcare) grant and a Congressionally Directed Medical Research Programs Discovery grant (W81XWH2010081) to B.J.A. R.S. received partial support through a graduate student assistantship from the Department of Pharmaceutical Sciences. R.S. is an awardee of a 2019–2020 R. Maric Fellowship and received partial summer support from a 2020 Cross-Disciplinary Fellowship in MCB and Pharmaceutical Sciences.

Acknowledgments

We thank Heidi Erlandsen and Jeremy Balsbaugh of the Center for Open Research Resources and Equipment (COR²E) at the University of Connecticut for instrument services and valuable discussion. We thank Antonio P. Costa in Diane Burgess’s research group for his assistance with light scattering analysis. We thank P. Ross Wilderman in James Halpert’s research group for use of equipment, reagents, and insightful discussions.

Conflicts of Interest

The authors declare no conflict of interest. The funders had no role in the design of the study; in the collection, analyses, or interpretation of data; in the writing of the manuscript, or in the decision to publish the results.

References

  1. Heyninck, K.; Kreike, M.M.; Beyaert, R. Structure-function analysis of the A20-binding inhibitor of NF-kappa B activation, ABIN-1. FEBS Lett. 2003, 536, 135–140. [Google Scholar]
  2. Heyninck, K.; De Valck, D.; Vanden Berghe, W.; Van Criekinge, W.; Contreras, R.; Fiers, W.; Haegeman, G.; Beyaert, R. The zinc finger protein A20 inhibits TNF-induced NF-kappaB-dependent gene expression by interfering with an RIP- or TRAF2-mediated transactivation signal and directly binds to a novel NF-kappaB-inhibiting protein ABIN. J. Cell Biol. 1999, 145, 1471–1482. [Google Scholar]
  3. Fukushi, M.; Dixon, J.; Kimura, T.; Tsurutani, N.; Dixon, M.J.; Yamamoto, N. Identification and cloning of a novel cellular protein Naf1, nef-associated factor 1, that increases cell surface CD4 expression. FEBS Lett. 1999, 442, 83–88. [Google Scholar]
  4. Gupta, K.; Ott, D.; Hope, T.J.; Siliciano, R.F.; Boeke, J.D. A human nuclear shuttling protein that interacts with human immunodeficiency virus type 1 matrix is packaged into virions. J. Virol. 2000, 74, 11811–11824. [Google Scholar]
  5. Zhang, S.; Fukushi, M.; Hashimoto, S.; Gao, C.; Huang, L.; Fukuyo, Y.; Nakajima, T.; Amagasa, T.; Enomoto, S.; Koike, K.; et al. A new ERK2 binding protein, Naf1, attenuates the EGF/ERK2 nuclear signaling. Biochem. Biophys. Res. Commun. 2002, 297, 17–23. [Google Scholar] [CrossRef]
  6. Flores, A.M.; Gurevich, I.; Zhang, C.; Ramirez, V.P.; Devens, T.R.; Aneskievich, B.J. TNIP1 is a corepressor of agonist-bound PPARs. Arch. Biochem. Biophys. 2011, 516, 58–66. [Google Scholar] [CrossRef] [Green Version]
  7. Gurevich, I.; Aneskievich, B.J. Liganded RARalpha and RARgamma interact with but are repressed by TNIP1. Biochem. Biophys. Res. Commun. 2009, 389, 409–414. [Google Scholar] [CrossRef] [Green Version]
  8. Mauro, C.; Pacifico, F.; Lavorgna, A.; Mellone, S.; Iannetti, A.; Acquaviva, R.; Leonardi, A. ABIN-1 binds to NEMO/IKKgamma and co-operates with A20 in inhibiting NF-kappaB. J. Biol. Chem. 2006, 281, 18482–18488. [Google Scholar]
  9. Ma, Y.; Yuan, S.; Tian, X.; Lin, S.; Wei, S.; Hu, T.; Chen, S.; Li, X.; Chen, S.; Wu, D.; et al. ABIN1 inhibits HDAC1 ubiquitination and protects it from both proteasome- and lysozyme-dependent degradation. J. Cell Biochem. 2018, 119, 3030–3043. [Google Scholar] [CrossRef]
  10. Mirza, N.; Sowa, A.S.; Lautz, K.; Kufer, T.A. NLRP10 affects the stability of abin-1 to control inflammatory responses. J. Immunol. 2019, 202, 218–227. [Google Scholar] [CrossRef] [Green Version]
  11. Ashida, H.; Kim, M.; Schmidt-Supprian, M.; Ma, A.; Ogawa, M.; Sasakawa, C. A bacterial E3 ubiquitin ligase IpaH9.8 targets NEMO/IKKgamma to dampen the host NF-kappaB-mediated inflammatory response. Nat. Cell. Biol. 2010, 12, 1–9. [Google Scholar] [CrossRef] [Green Version]
  12. Vandereyken, K.; Van Leene, J.; de Coninck, B.; Cammue, B.P.A. Hub protein controversy: Taking a closer look at plant stress response hubs. Front. Plant Sci. 2018, 9, 694. [Google Scholar] [CrossRef] [Green Version]
  13. Haynes, C.; Oldfield, C.J.; Ji, F.; Klitgord, N.; Cusick, M.E.; Radivojac, P.; Uversky, V.N.; Vidal, M.; Iakoucheva, L.M. Intrinsic disorder is a common feature of hub proteins from four eukaryotic interactomes. PLoS Comput. Biol. 2006, 2, e100. [Google Scholar]
  14. Uversky, V.N.; Oldfield, C.J.; Dunker, A.K. Intrinsically disordered proteins in human diseases: Introducing the D2 concept. Annu. Rev. Biophys. 2008, 37, 215–246. [Google Scholar] [CrossRef]
  15. Hu, G.; Wu, Z.; Uversky, V.N.; Kurgan, L. Functional analysis of human hub proteins and their interactors involved in the intrinsic disorder-enriched interactions. Int. J. Mol. Sci. 2017, 18, 2761. [Google Scholar] [CrossRef] [Green Version]
  16. Shamilov, R.; Aneskievich, B.J. TNIP1 in autoimmune diseases: Regulation of toll-like receptor signaling. J. Immunol. Res. 2018, 2018, 3491269. [Google Scholar]
  17. G’Sell, R.T.; Gaffney, P.M.; Powell, D.W. A20-binding inhibitor of NF-kappaB activation 1 is a physiologic inhibitor of NF-kappaB: A molecular switch for inflammation and autoimmunity. Arthritis Rheumatol. 2015, 67, 2292–2302. [Google Scholar] [CrossRef] [Green Version]
  18. Allanore, Y.; Saad, M.; Dieude, P.; Avouac, J.; Distler, J.H.; Amouyel, P.; Matucci-Cerinic, M.; Riemekasten, G.; Airo, P.; Melchers, I.; et al. Genome-wide scan identifies TNIP1, PSORS1C1, and RHOB as novel risk loci for systemic sclerosis. PLoS Genet. 2011, 7, e1002091. [Google Scholar] [CrossRef]
  19. Chen, Y.; Yan, H.; Song, Z.; Chen, F.; Wang, H.; Niu, J.; Shi, X.; Zhang, D.; Zhang, N.; Zhai, Z.; et al. Downregulation of TNIP1 expression leads to increased proliferation of human keratinocytes and severer psoriasis-like conditions in an imiquimod-induced mouse model of dermatitis. PLoS ONE 2015, 10. [Google Scholar] [CrossRef]
  20. Cruz, J.A.; Childs, E.E.; Amatya, N.; Garg, A.V.; Beyaert, R.; Kane, L.P.; Aneskievich, B.J.; Ma, A.; Gaffen, S.L. Interleukin-17 signaling triggers degradation of the constitutive NF-kappaB inhibitor ABIN-1. Immunohorizons 2017, 1, 133–141. [Google Scholar] [CrossRef] [Green Version]
  21. Herhaus, L.; van den Bedem, H.; Tang, S.; Maslennikov, I.; Wakatsuki, S.; Dikic, I.; Rahighi, S. Molecular recognition of M1-linked ubiquitin chains by native and phosphorylated UBAN domains. J. Mol. Biol. 2019, 431, 3146–3156. [Google Scholar]
  22. Lin, S.M.; Lin, S.C.; Hong, J.Y.; Su, T.W.; Kuo, B.J.; Chang, W.H.; Tu, Y.F.; Lo, Y.-C. Structural insights into linear tri-ubiquitin recognition by A20-binding inhibitor of NF-kappaB, ABIN-2. Structure 2017, 25, 66–78. [Google Scholar]
  23. Babu, M.M. The contribution of intrinsically disordered regions to protein function, cellular complexity, and human disease. Biochem. Soc. Trans. 2016, 44, 1185–1200. [Google Scholar]
  24. van der Lee, R.; Buljan, M.; Lang, B.; Weatheritt, R.J.; Daughdrill, G.W.; Dunker, A.K.; Fuxreiter, M.; Gough, J.; Gsponer, J.; Jones, D.T.W.; et al. Classification of intrinsically disordered regions and proteins. Chem. Rev. 2014, 114, 6589–6631. [Google Scholar] [CrossRef]
  25. Wagner, S.; Carpentier, I.; Rogov, V.; Kreike, M.; Ikeda, F.; Lohr, F.; Wu, C.-J.; Ashwell, J.D.; Dotsch, V.; Dikic, I.; et al. Ubiquitin binding mediates the NF-kappaB inhibitory potential of ABIN proteins. Oncogene 2008, 27, 3739–3745. [Google Scholar] [CrossRef] [Green Version]
  26. Nanda, S.K.; Venigalla, R.K.; Ordureau, A.; Patterson-Kane, J.C.; Powell, D.W.; Toth, R.; Arthur, J.S.C.; Cohen, P. Polyubiquitin binding to ABIN1 is required to prevent autoimmunity. J. Exp. Med. 2011, 208, 1215–1228. [Google Scholar] [CrossRef] [Green Version]
  27. Kattah, M.G.; Shao, L.; Rosli, Y.Y.; Shimizu, H.; Whang, M.I.; Advincula, R.; Achacoso, P.; Shah, S.; Duong, B.H.; Onizawa, M.; et al. A20 and ABIN-1 synergistically preserve intestinal epithelial cell survival. J. Exp. Med. 2018, 215, 1839–1852. [Google Scholar] [CrossRef]
  28. Reed, B.J.; Locke, M.N.; Gardner, R.G. A conserved deubiquitinating enzyme uses intrinsically disordered regions to scaffold multiple protein interaction sites. J. Biol. Chem. 2015, 290, 20601–20612. [Google Scholar] [CrossRef] [Green Version]
  29. Sigalov, A.B. Unusual biophysics of immune signaling-related intrinsically disordered proteins. Self Nonself 2010, 1, 271–281. [Google Scholar] [CrossRef] [Green Version]
  30. Sigalov, A.B.; Zhuravleva, A.V.; Orekhov, V.Y. Binding of intrinsically disordered proteins is not necessarily accompanied by a structural transition to a folded form. Biochimie 2007, 89, 419–421. [Google Scholar]
  31. Wang, W.; Wang, D. Extreme fuzziness: Direct interactions between two IDPs. Biomolecules 2019, 9, 81. [Google Scholar] [CrossRef] [Green Version]
  32. Borgia, A.; Borgia, M.B.; Bugge, K.; Kissling, V.M.; Heidarsson, P.O.; Fernandes, C.B.; Sottini, A.; Soranno, A.; Buholzer, K.J.; Nettels, D.; et al. Extreme disorder in an ultrahigh-affinity protein complex. Nature 2018, 555, 61–66. [Google Scholar] [CrossRef] [Green Version]
  33. Verstrepen, L.; Carpentier, I.; Verhelst, K.; Beyaert, R. ABINs: A20 binding inhibitors of NF-kappa B and apoptosis signaling. Biochem. Pharmacol. 2009, 78, 105–114. [Google Scholar] [CrossRef] [Green Version]
  34. Oldfield, C.J.; Xue, B.; Van, Y.Y.; Ulrich, E.L.; Markley, J.L.; Dunker, A.K.; Uversky, V.N. Utilization of protein intrinsic disorder knowledge in structural proteomics. Biochim. Biophys. Acta 2013, 1834, 487–498. [Google Scholar] [CrossRef] [Green Version]
  35. Fontana, A.; de Laureto, P.P.; Spolaore, B.; Frare, E. Identifying disordered regions in proteins by limited proteolysis. Methods Mol. Biol. 2012, 896, 297–318. [Google Scholar] [CrossRef]
  36. Suskiewicz, M.J.; Sussman, J.L.; Silman, I.; Shaul, Y. Context-dependent resistance to proteolysis of intrinsically disordered proteins. Protein Sci. 2011, 20, 1285–1297. [Google Scholar] [CrossRef] [Green Version]
  37. Piovesan, D.; Tabaro, F.; Mičetić, I.; Necci, M.; Quaglia, F.; Oldfield, C.J.; Aspromonte, M.C.; Davey, N.E.; Davidović, R.; Dosztányi, Z.; et al. DisProt 7.0: A major update of the database of disordered proteins. Nucleic Acids Res. 2017, 45, D219–D227. [Google Scholar] [CrossRef] [Green Version]
  38. Li, J.; Feng, Y.; Wang, X.; Li, J.; Liu, W.; Rong, L.; Zhou, S. An overview of predictors for intrinsically disordered proteins over 2010–2014. Int. J. Mol. Sci. 2015, 16, 23446–23462. [Google Scholar] [CrossRef]
  39. Martinelli, A.H.S.; Lopes, F.C.; John, E.B.O.; Carlini, C.R.; Ligabue-Braun, R. Modulation of disordered proteins with a focus on neurodegenerative diseases and other pathologies. Int. J. Mol. Sci. 2019, 20, 1322. [Google Scholar] [CrossRef] [Green Version]
  40. UniProt Consortium, T. UniProt: The universal protein knowledgebase. Nucleic Acids Res. 2018, 46, 2699. [Google Scholar] [CrossRef] [Green Version]
  41. Meng, F.; Uversky, V.N.; Kurgan, L. Comprehensive review of methods for prediction of intrinsic disorder and its molecular functions. Cell. Mol. Life Sci. 2017, 74, 3069–3090. [Google Scholar] [CrossRef]
  42. Nielsen, J.T.; Mulder, F.A.A. Quality and bias of protein disorder predictors. Sci. Rep. 2019, 9, 5137. [Google Scholar] [CrossRef] [Green Version]
  43. Katuwawala, A.; Oldfield, C.J.; Kurgan, L. Accuracy of protein-level disorder predictions. Brief. Bioinform. 2019, 21, 1509–1522. [Google Scholar] [CrossRef]
  44. Ludwiczak, J.; Winski, A.; Szczepaniak, K.; Alva, V.; Dunin-Horkawicz, S. DeepCoil-a fast and accurate prediction of coiled-coil domains in protein sequences. Bioinformatics 2019, 35, 2790–2795. [Google Scholar] [CrossRef]
  45. Uversky, V.N. Natively unfolded proteins: A point where biology waits for physics. Protein Sci. 2002, 11, 739–756. [Google Scholar] [CrossRef] [Green Version]
  46. Sievers, F.; Wilm, A.; Dineen, D.; Gibson, T.J.; Karplus, K.; Li, W.; Lopez, R.; McWilliam, H.; Remmert, M.; Söding, J.; et al. Fast, scalable generation of high-quality protein multiple sequence alignments using clustal omega. Mol. Syst. Biol. 2011, 7, 539. [Google Scholar] [CrossRef]
  47. Livernois, A.M.; Hnatchuk, D.J.; Findlater, E.E.; Graether, S.P. Obtaining highly purified intrinsically disordered protein by boiling lysis and single step ion exchange. Anal. Biochem. 2009, 392, 70–76. [Google Scholar] [CrossRef]
  48. Ferrari, L.; Rudiger, S.G.D. Recombinant production and purification of the human protein tau. Protein Eng. Des. Sel. 2018, 31, 447–455. [Google Scholar] [CrossRef]
  49. Uversky, V.N.; Gillespie, J.R.; Fink, A.L. Why are “natively unfolded” proteins unstructured under physiologic conditions? Proteins 2000, 41, 415–427. [Google Scholar]
  50. KrishnaKumar, V.G.; Gupta, S. Simplified method to obtain enhanced expression of tau protein from E. coli and one-step purification by direct boiling. Prep. Biochem. Biotechnol. 2017, 47, 530–538. [Google Scholar] [CrossRef]
  51. Kalthoff, C. A novel strategy for the purification of recombinantly expressed unstructured protein domains. J. Chromatogr. B Analyt. Technol. Biomed. Life Sci. 2003, 786, 247–254. [Google Scholar]
  52. Schneider, C.A.; Rasband, W.S.; Eliceiri, K.W. NIH image to ImageJ: 25 years of image analysis. Nat. Methods 2012, 9, 671–675. [Google Scholar] [CrossRef]
  53. Uversky, V.N. What does it mean to be natively unfolded? Eur. J. Biochem. 2002, 269, 2649. [Google Scholar]
  54. Tcherkasskaya, O.; Uversky, V.N. Denatured collapsed states in protein folding: Example of apomyoglobin. Proteins 2001, 44, 244–254. [Google Scholar] [CrossRef]
  55. Sreerama, N.; Woody, R.W. Estimation of protein secondary structure from circular dichroism spectra: Comparison of CONTIN, SELCON, and CDSSTR methods with an expanded reference set. Anal. Biochem. 2000, 287, 252–260. [Google Scholar] [CrossRef]
  56. Maciejewski, M.W.; Schuyler, A.D.; Gryk, M.R.; Moraru, I.I.; Romero, P.R.; Ulrich, E.L.; Eghbalnia, H.R.; Livny, M.; Delaglio, F.; Hoch, J.C. NMRbox: A resource for biomolecular NMR computation. Biophys. J. 2017, 112, 1529–1534. [Google Scholar]
  57. Dunker, A.K.; Oh, J.; Oldfield, C.; Romero, P.; Ratliff, C.; Hipps, K.W.; Reeves, R.; Ausió, J.; Kissinger, C.; Bailey, R.; et al. Intrinsically disordered protein. J. Mol. Graph. Model. 2001, 19, 26–59. [Google Scholar]
  58. Uversky, V.N. Intrinsically disordered proteins from A to Z. Int. J. Biochem. Cell Biol. 2011, 43, 1090–1103. [Google Scholar] [CrossRef] [Green Version]
  59. Chen, P.; Huang, J.Z.; Gao, X. LigandRFs: Random forest ensemble to identify ligand-binding residues from sequence information alone. BMC Bioinform. 2014, 15 (Suppl. S15). [Google Scholar] [CrossRef] [Green Version]
  60. Xue, B.; Dunbrack, R.L.; Williams, R.W.; Dunker, A.K.; Uversky, V.N. PONDR-FIT: A meta-predictor of intrinsically disordered amino acids. Biochim. Biophys. Acta 2010, 1804, 996–1010. [Google Scholar] [CrossRef] [Green Version]
  61. Zhou, J.; Oldfield, C.J.; Yan, W.; Shen, B.; Dunker, A.K. Intrinsically disordered domains: Sequence disorder function relationships. Protein Sci. 2019, 28, 1652–1663. [Google Scholar] [CrossRef]
  62. Chen, J.W.; Romero, P.; Uversky, V.N.; Dunker, A.K. Conservation of intrinsic disorder in protein domains and families: II. functions of conserved disorder. J. Proteome Res. 2006, 5, 888–898. [Google Scholar] [CrossRef] [Green Version]
  63. Uversky, V.N.; El-Baky, N.A.; El-Fakharany, E.M.; Sabry, A.; Mattar, E.H.; Uversky, A.V.; Redwan, E.M. Functionality of intrinsic disorder in tumor necrosis factor-alpha and its receptors. FEBS J. 2017, 284, 3589–3618. [Google Scholar] [CrossRef] [Green Version]
  64. . Moncoq, K.; Broutin, I.; LaRue, V.; Perdereau, M.; Cailliau, K.; Browaeys-Poly, E.; Burnol, A.-F.; Ducruix, A. The PIR domain of Grb14 is an intrinsically unstructured protein: Implication in insulin signaling. FEBS Lett. 2003, 554, 240–246. [Google Scholar]
  65. Csokova, N.; Skrabana, R.; Liebig, H.D.; Mederlyova, A.; Kontsek, P.; Novak, M. Rapid purification of truncated tau proteins: Model approach to purification of functionally active fragments of disordered proteins, implication for neurodegenerative diseases. Protein Expr. Purif. 2004, 35, 366–372. [Google Scholar] [CrossRef]
  66. Schramm, A.; Bignon, C.; Brocca, S.; Grandori, R.; Santambrogio, C.; Longhi, S. An arsenal of methods for the experimental characterization of intrinsically disordered proteins—How to choose and combine them? Arch. Biochem. Biophys. 2019, 676, 108055. [Google Scholar]
  67. Kim, T.D.; Ryu, H.J.; Cho, H.I.; Yang, C.H.; Kim, J. Thermal behavior of proteins: Heat-resistant proteins and their heat-induced secondary structural changes. Biochemistry 2000, 39, 14839–14846. [Google Scholar]
  68. Verstrepen, L.; Carpentier, I.; Beyaert, R. The biology of A20-binding inhibitors of NF-kappaB activation (ABINs). Adv. Exp. Med. Biol. 2014, 809, 13–31. [Google Scholar]
  69. Zimmermann, L.; Stephens, A.; Nam, S.-Z.; Rau, D.; Kübler, J.; Lozajic, M.; Gabler, F.; Söding, J.; Lupas, A.N.; Alva, V. A completely reimplemented MPI bioinformatics toolkit with a new HHpred server at its core. J. Mol. Biol. 2018, 430, 2237–2243. [Google Scholar]
  70. Salvay, A.G.; Communie, G.; Ebel, C. Sedimentation velocity analytical ultracentrifugation for intrinsically disordered proteins. Methods Mol. Biol. 2012, 896, 91–105. [Google Scholar] [CrossRef]
  71. Buck, M. Trifluoroethanol and colleagues: Cosolvents come of age. recent studies with peptides and proteins. Q. Rev. Biophys. 1998, 31, 297–355. [Google Scholar] [CrossRef]
  72. Chemes, L.B.; Alonso, L.G.; Noval, M.G.; de Prat-Gay, G. Circular dichroism techniques for the analysis of intrinsically disordered proteins and domains. Methods Mol. Biol. 2012, 895, 387–404. [Google Scholar] [CrossRef]
  73. Konrat, R. NMR contributions to structural dynamics studies of intrinsically disordered proteins. J. Magn. Reson. 2014, 241, 74–85. [Google Scholar] [CrossRef] [Green Version]
  74. Uversky, V.N.; Davé, V.; Iakoucheva, L.M.; Malaney, P.; Metallo, S.J.; Pathak, R.R.; Joerger, A.C. Pathological unfoldomics of uncontrolled chaos: Intrinsically disordered proteins and human diseases. Chem. Rev. 2014, 114, 6844–6879. [Google Scholar] [CrossRef] [Green Version]
  75. Romero, P.; Obradovic, Z.; Li, X.; Garner, E.C.; Brown, C.J.; Dunker, A.K. Sequence complexity of disordered protein. Proteins 2001, 42, 38–48. [Google Scholar]
  76. Theillet, F.X.; Kalmar, L.; Tompa, P.; Han, K.H.; Selenko, P.; Dunker, A.K.; Daughdrill, G.W.; Uversky, N.V. The alphabet of intrinsic disorder: I. act like a pro: On the abundance and roles of proline residues in intrinsically disordered proteins. Intrinsic. Disord. Proteins 2013, 1, e24360. [Google Scholar]
  77. Bah, A.; Forman-Kay, J.D. Modulation of intrinsically disordered protein function by post-translational modifications. J. Biol. Chem. 2016, 291, 6696–6705. [Google Scholar] [CrossRef] [Green Version]
  78. Chen, J.W.; Romero, P.; Uversky, V.N.; Dunker, A.K. Conservation of intrinsic disorder in protein domains and families: I. A database of conserved predicted disordered regions. J. Proteome Res. 2006, 5, 879–887. [Google Scholar] [CrossRef] [Green Version]
  79. Yoshizawa, T.; Nozawa, R.S.; Jia, T.Z.; Saio, T.; Mori, E. Biological phase separation: Cell biology meets biophysics. Biophys. Rev. 2020, 12, 519–539. [Google Scholar] [CrossRef] [Green Version]
  80. Chen, S.; Yang, X.; Cheng, W.; Ma, Y.; Shang, Y.; Cao, L.; Chen, S.; Chen, Y.; Wang, M.; Guo, D. Immune regulator ABIN1 suppresses HIV-1 transcription by negatively regulating the ubiquitination of tat. Retrovirology 2017, 14, 12. [Google Scholar] [CrossRef] [Green Version]
  81. Renaud, L.; Picher-Martel, V.; Codron, P.; Julien, J.P. Key role of UBQLN2 in pathogenesis of amyotrophic lateral sclerosis and frontotemporal dementia. Acta Neuropathol. Commun. 2019, 7, 103. [Google Scholar] [CrossRef]
  82. Kanaan, N.M.; Hamel, C.; Grabinski, T.; Combs, B. Liquid-liquid phase separation induces pathogenic tau conformations in vitro. Nat. Commun. 2020, 11, 2809. [Google Scholar] [CrossRef]
  83. Uversky, V.N. Functional roles of transiently and intrinsically disordered regions within proteins. FEBS J. 2015, 282, 1182–1189. [Google Scholar] [CrossRef]
  84. Uversky, V.N. Unusual biophysics of intrinsically disordered proteins. Biochim. Biophys. Acta 2013, 1834, 932–951. [Google Scholar] [CrossRef]
  85. Oldfield, C.J.; Cheng, Y.; Cortese, M.S.; Brown, C.J.; Uversky, V.N.; Dunker, A.K. Comparing and combining predictors of mostly disordered proteins. Biochemistry 2005, 44, 1989–2000. [Google Scholar] [CrossRef]
  86. Choi, U.B.; Sanabria, H.; Smirnova, T.; Bowen, M.E.; Weninger, K.R. Spontaneous switching among conformational ensembles in intrinsically disordered proteins. Biomolecules 2019, 9, 114. [Google Scholar] [CrossRef] [Green Version]
  87. Dyson, H.J.; Wright, P.E. Unfolded proteins and protein folding studied by NMR. Chem. Rev. 2004, 104, 3607–3622. [Google Scholar] [CrossRef]
  88. Cohen, P.; Strickson, S. The role of hybrid ubiquitin chains in the MyD88 and other innate immune signalling pathways. Cell Death Differ. 2017, 24, 1153–1159. [Google Scholar] [CrossRef] [Green Version]
  89. Oldfield, C.J.; Cheng, Y.; Cortese, M.S.; Romero, P.; Uversky, V.N.; Dunker, A.K. Coupled folding and binding with alpha-helix-forming molecular recognition elements. Biochemistry 2005, 44, 12454–12470. [Google Scholar] [CrossRef]
  90. Li, J.; McQuade, T.; Siemer, A.B.; Napetschnig, J.; Moriwaki, K.; Hsiao, Y.-S.; Damko, E.; Moquin, D.; Walz, T.; McDermott, A.; et al. The RIP1/RIP3 necrosome forms a functional amyloid signaling complex required for programmed necrosis. Cell 2012, 150, 339–350. [Google Scholar] [CrossRef] [Green Version]
  91. Cumberworth, A.; Lamour, G.; Babu, M.M.; Gsponer, J. Promiscuity as a functional trait: Intrinsically disordered regions as central players of interactomes. Biochem. J. 2013, 454, 361–369. [Google Scholar] [CrossRef] [Green Version]
  92. Wright, P.E.; Dyson, H.J. Intrinsically disordered proteins in cellular signalling and regulation. Nat. Rev. Mol. Cell Biol. 2015, 16, 18–29. [Google Scholar] [CrossRef]
Figure 1. In silico analysis of TNIP1 highlights intrinsic disorder characteristics. (a) Amino acid compositional bias of full-length TNFAIP3 interacting protein 1 (TNIP1) (shown in red) generated comparing TNIP1 versus database of globular proteins (Swissprot) overlaid as comparison against database of disordered proteins (DisProt) versus SwissProt (shown in black). (b) Charge–hydropathy plot of full-length TNIP1 (red diamond) with ordered (dark grey circles) and disordered (light grey circles) plotted with boundary representing likely delineation of trends in charge and hydrophobicity between plotted proteins. (c) Full-length TNIP1 (636AA) disorder predictions as generated by independent algorithms where disorder score above 0.5 threshold indicates prediction of disorder. (d,e) Colored lines represent 23 species that were used for comparison to human (dotted red line) (d) Cumulative distribution function (CDF) with 23 species inputs plotted along with boundary (dotted black line) separating potential disordered (found mostly below line) from ordered proteins (found above line). (e) PONDR-FIT-fit analysis of 23 species (human—dotted red line) after alignment using Clustal Omega. Gaps introduced after amino acid sequence alignment maintained in graphed data.
Biomolecules 10 01531 g001
Figure 2. Limited proteolysis of full-length TNIP1. Limited proteolysis performed with full-length TNIP1 with 1:250 trypsin to protein ratio (w/w) at 25 °C and 37 °C. Samples collected up to 30 min at times indicated at top of lane. Reactions were quenched by adding 5× Laemmli buffer and heating at 95 °C for 5 min prior to loading 6 μg for analysis by SDS-PAGE.
Biomolecules 10 01531 g002
Figure 3. In silico analysis of the TNIP1 AHDI-UBAN domain. (a) A20-binding (AHD1) and ubiquitin binding domain of TNIP1 (UBAN) (AA417-509) disorder predictions as generated by independent algorithms where residue disorder score above 0.5 threshold indicates prediction of disorder. (b) Amino acid compositional bias of AHD1-UBAN generated comparing AHD1-UBAN versus database of ordered, globular proteins (shown in red) overlaid as comparison against database of disordered proteins (DisProt) versus SwissProt (shown in black). (c) Charge–hydropathy plot of AHD1-UBAN (red diamond) with ordered (dark grey circles) and disordered (light grey circles) plotted with boundary representing likely delineation of trends in charge and hydrophobicity between plotted proteins (disordered more likely appearing left of the boundary line).
Biomolecules 10 01531 g003
Figure 4. Expression and purification of TNIP1417-509. pET28a—empty control (EL) and pET28a-TNIP1417-509 (TL) expressed in BL-21 Rosetta 2 E. coli released through lysis in Laemmli sample buffer (EL, TL) or by heating to 99 °C (pET28a-empty control heat lysate (EH), pET28a-TNIP1417-509 heat lysate (TH)). TNIP1 UBAN fragment purified first by affinity chromatography (TA) followed by FPLC as final purification step in 20 mM sodium phosphate buffer (pH 8.0) and 200 mM NaCl (TS). PP—precision plus pre-stained protein ladder.
Biomolecules 10 01531 g004
Figure 5. Limited proteolysis of TNIP1417-509. Limited proteolysis performed with UBAN fragment with 1:1000 and 1:2500 trypsin to TNIP1417-509 protein ratios (w/w) at 25 °C. Samples collected over 30 min with reactions quenched with addition of 5× Laemmli buffer and heating at 95 °C for 5 min prior to loading 5 μg on a 15% acrylamide gel for analysis by SDS-PAGE.
Biomolecules 10 01531 g005
Figure 6. TNIP1417-509 domain apparent molecular weight is larger than that predicted from amino acid sequence. Main graph. (a) Protein standards (thin lines and numbered peaks) ranging in MW were injected on s75 16/60 high performance column preconditioned with 20 mM sodium phosphate buffer (pH 8.0), 200 mM NaCl: 1—BSA (66 kDa, hydrodynamic radius (Rs)–35 Å); 2—Ovalbumin (44 kDa, Rs–28 Å); 3—Myoglobin dimer (36 Å); 4—Chymotrypsinogen (24 kDa, Rs–21 Å); 5—Myoglobin (18 kDa, Rs–19 Å); 6—Cytochrome C (13 kDa, Rs–17 Å). TNIP1417-509 (bold line) eluted as minor (**) and major (*) peaks. Inset graph. Elution volume of protein standards (gray dots) from main graph was plotted against their MW (kDa) and used to determine AHD1-UBAN region apparent MW (red dot). (b) Plotted log values of hydrodynamic radii (Å) versus log values of the molecular mass (M) of pre-molten globule like (PMG-like, grey squares), random coil-like (dark grey triangles), and globular proteins (dark grey diamonds). TNIP1417-509 (AHD1-UBAN) is presented as a red circle. See Materials and Methods for source of standards used in panel (b).
Biomolecules 10 01531 g006
Figure 7. Dynamic light scattering analysis of TNIP1417-509. Hydrodynamic radius of AHD1-UBAN fragment measured as percentage of total volume contribution of measurements performed with purified TNIP1417-509 in 20 mM sodium phosphate at pH 8.0, 200 mM NaCl, 10% glycerol at two different concentrations (1.5 mg/mL—solid line, 0.75 mg/mL—dotted line).
Biomolecules 10 01531 g007
Figure 8. Sedimentation velocity of TNIP1417-509 reveals oligomerization potential. Analytical ultracentrifugation sedimentation velocity of purified TNIP1417-509 at 20 mM was performed in (a) 20 mM sodium phosphate buffer (pH 8.0) and 200 mM NaCl or (b) 20 mM sodium phosphate buffer (pH 5.8) and either 50 mM (dotted line) or 200 mM (solid line) NaCl with protein at 20 μM. Experimental runs were performed at 20 °C with scans at 6-min intervals at 230 nm for a total of 20 h. (a, b insets) Data analysis performed using SedFit.
Biomolecules 10 01531 g008
Figure 9. Assessment of TNIP1417-509 secondary structure by circular dichroism. Far-UV circular dichroism (CD) spectrum of TNIP1417-509 protein at 10 mM in 50 mM sodium phosphate buffer (pH 8.0) scanned from 190–250 nm at (a) 25 °C (black line) ramping up to 85 °C (red line). (b) Two wavelength plot (222 versus 200 nm) of characterized random coil (grey square) and pre-molten globule (open triangle) like proteins (see Material and Methods) with TNIP1417-509 (red circle) grouped among the pre-molten globule group. (c) Far-UV CD spectra of TNIP1417-509 with increasing titration of 2,2,2-trifluoroethanol (TFE) totaling final 40% (v/v). (d) 208, 220 and 200 nm wavelength measurements from panel B plotted with increasing total TFE percentage. (e) Deconvolution of data presented in panel A and C using the Contin-LL (Provencher and Glockner Method) (see Section 2).
Biomolecules 10 01531 g009
Figure 10. TNIP1 interaction with ubiquitin through NMR. 1H-15N heteronuclear single quantum coherence (HSQC) spectra at 600 MHz collected for (a) TNIP1417-509 at 0.3 M only (black) or TNIP1417-509 + ubiquitin (red) at a 1:2.2 (TNIP1: ubiquitin) molar ratio at 25 °C in 20 mM sodium phosphate buffer (pH 5.8) and 50 mM NaCl. (b) Insets of overlay taken to show details of regions featuring crowding or increased peak shifting with inclusion of ubiquitin.
Biomolecules 10 01531 g010
Table 1. Summary of all analytical ultracentrifugation (AUC) experiments. Sedimentation velocity experiments performed across varying pH and salt conditions. Data are summarized from graphs in referenced figures. S, Svedberg unit.
pHNaCl
Concentration
Spectra
(Total %)
Protein Concentrationf/f0MW
(kDa)
s-Value (20, ω)Stokes Radius
(Å)
Figure
8.0200 mMPeak 1 (90%)0.25 mg/mL
(20 μM)
1.9815.71.141S32.8Figure 8a
Peak 2 (10%)301.757S40.7
5.8200 mMPeak 1 (70%)0.25 mg/mL
(20 μM)
1.8314.51.172S29.4Figure 8b
(solid line)
Peak 2 (30%)22.11.557S33.9
5.850 mMPeak 1 (62%)0.25 mg/mL
(20 μM)
1.7513.91.209S27.5Figure 8b
(dotted line)
Peak 2 (38%)20.81.582S31.4
Publisher’s Note: MDPI stays neutral with regard to jurisdictional claims in published maps and institutional affiliations.

