Combining Virtual Screening Protocol and In Vitro Evaluation towards the Discovery of BACE1 Inhibitors

 , , and
Abstract
:
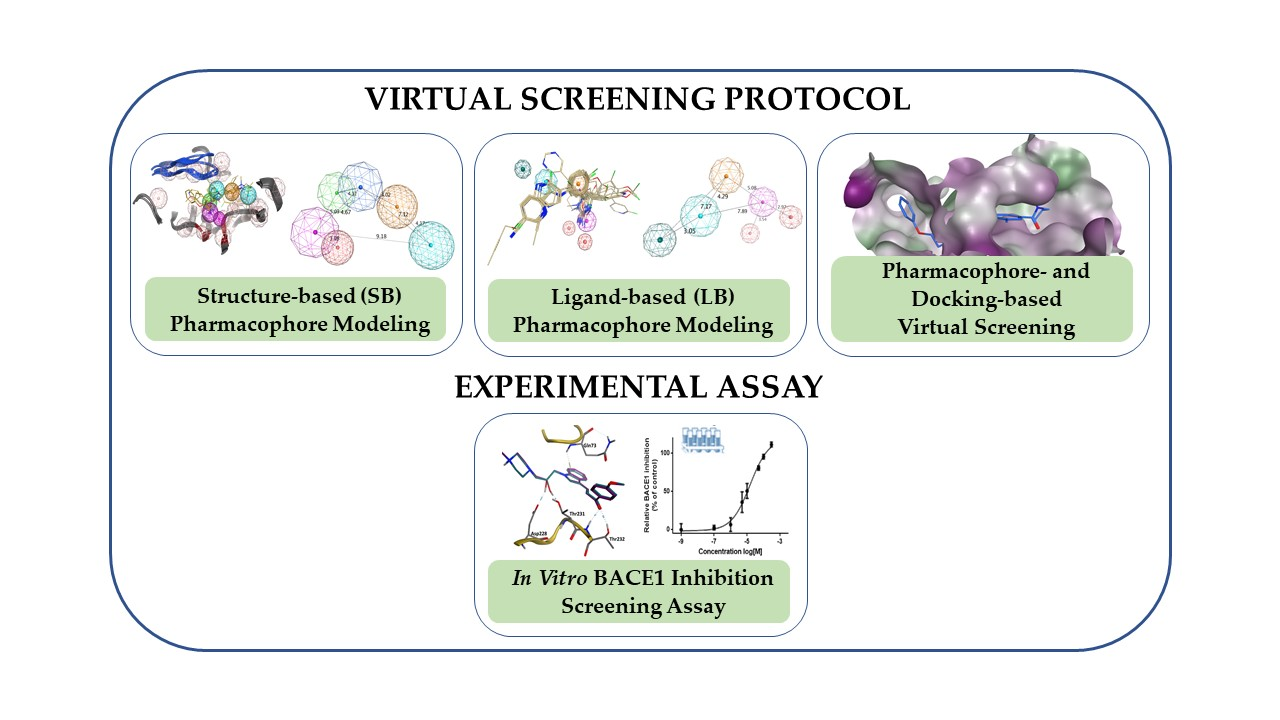
1. Introduction
2. Materials and Methods
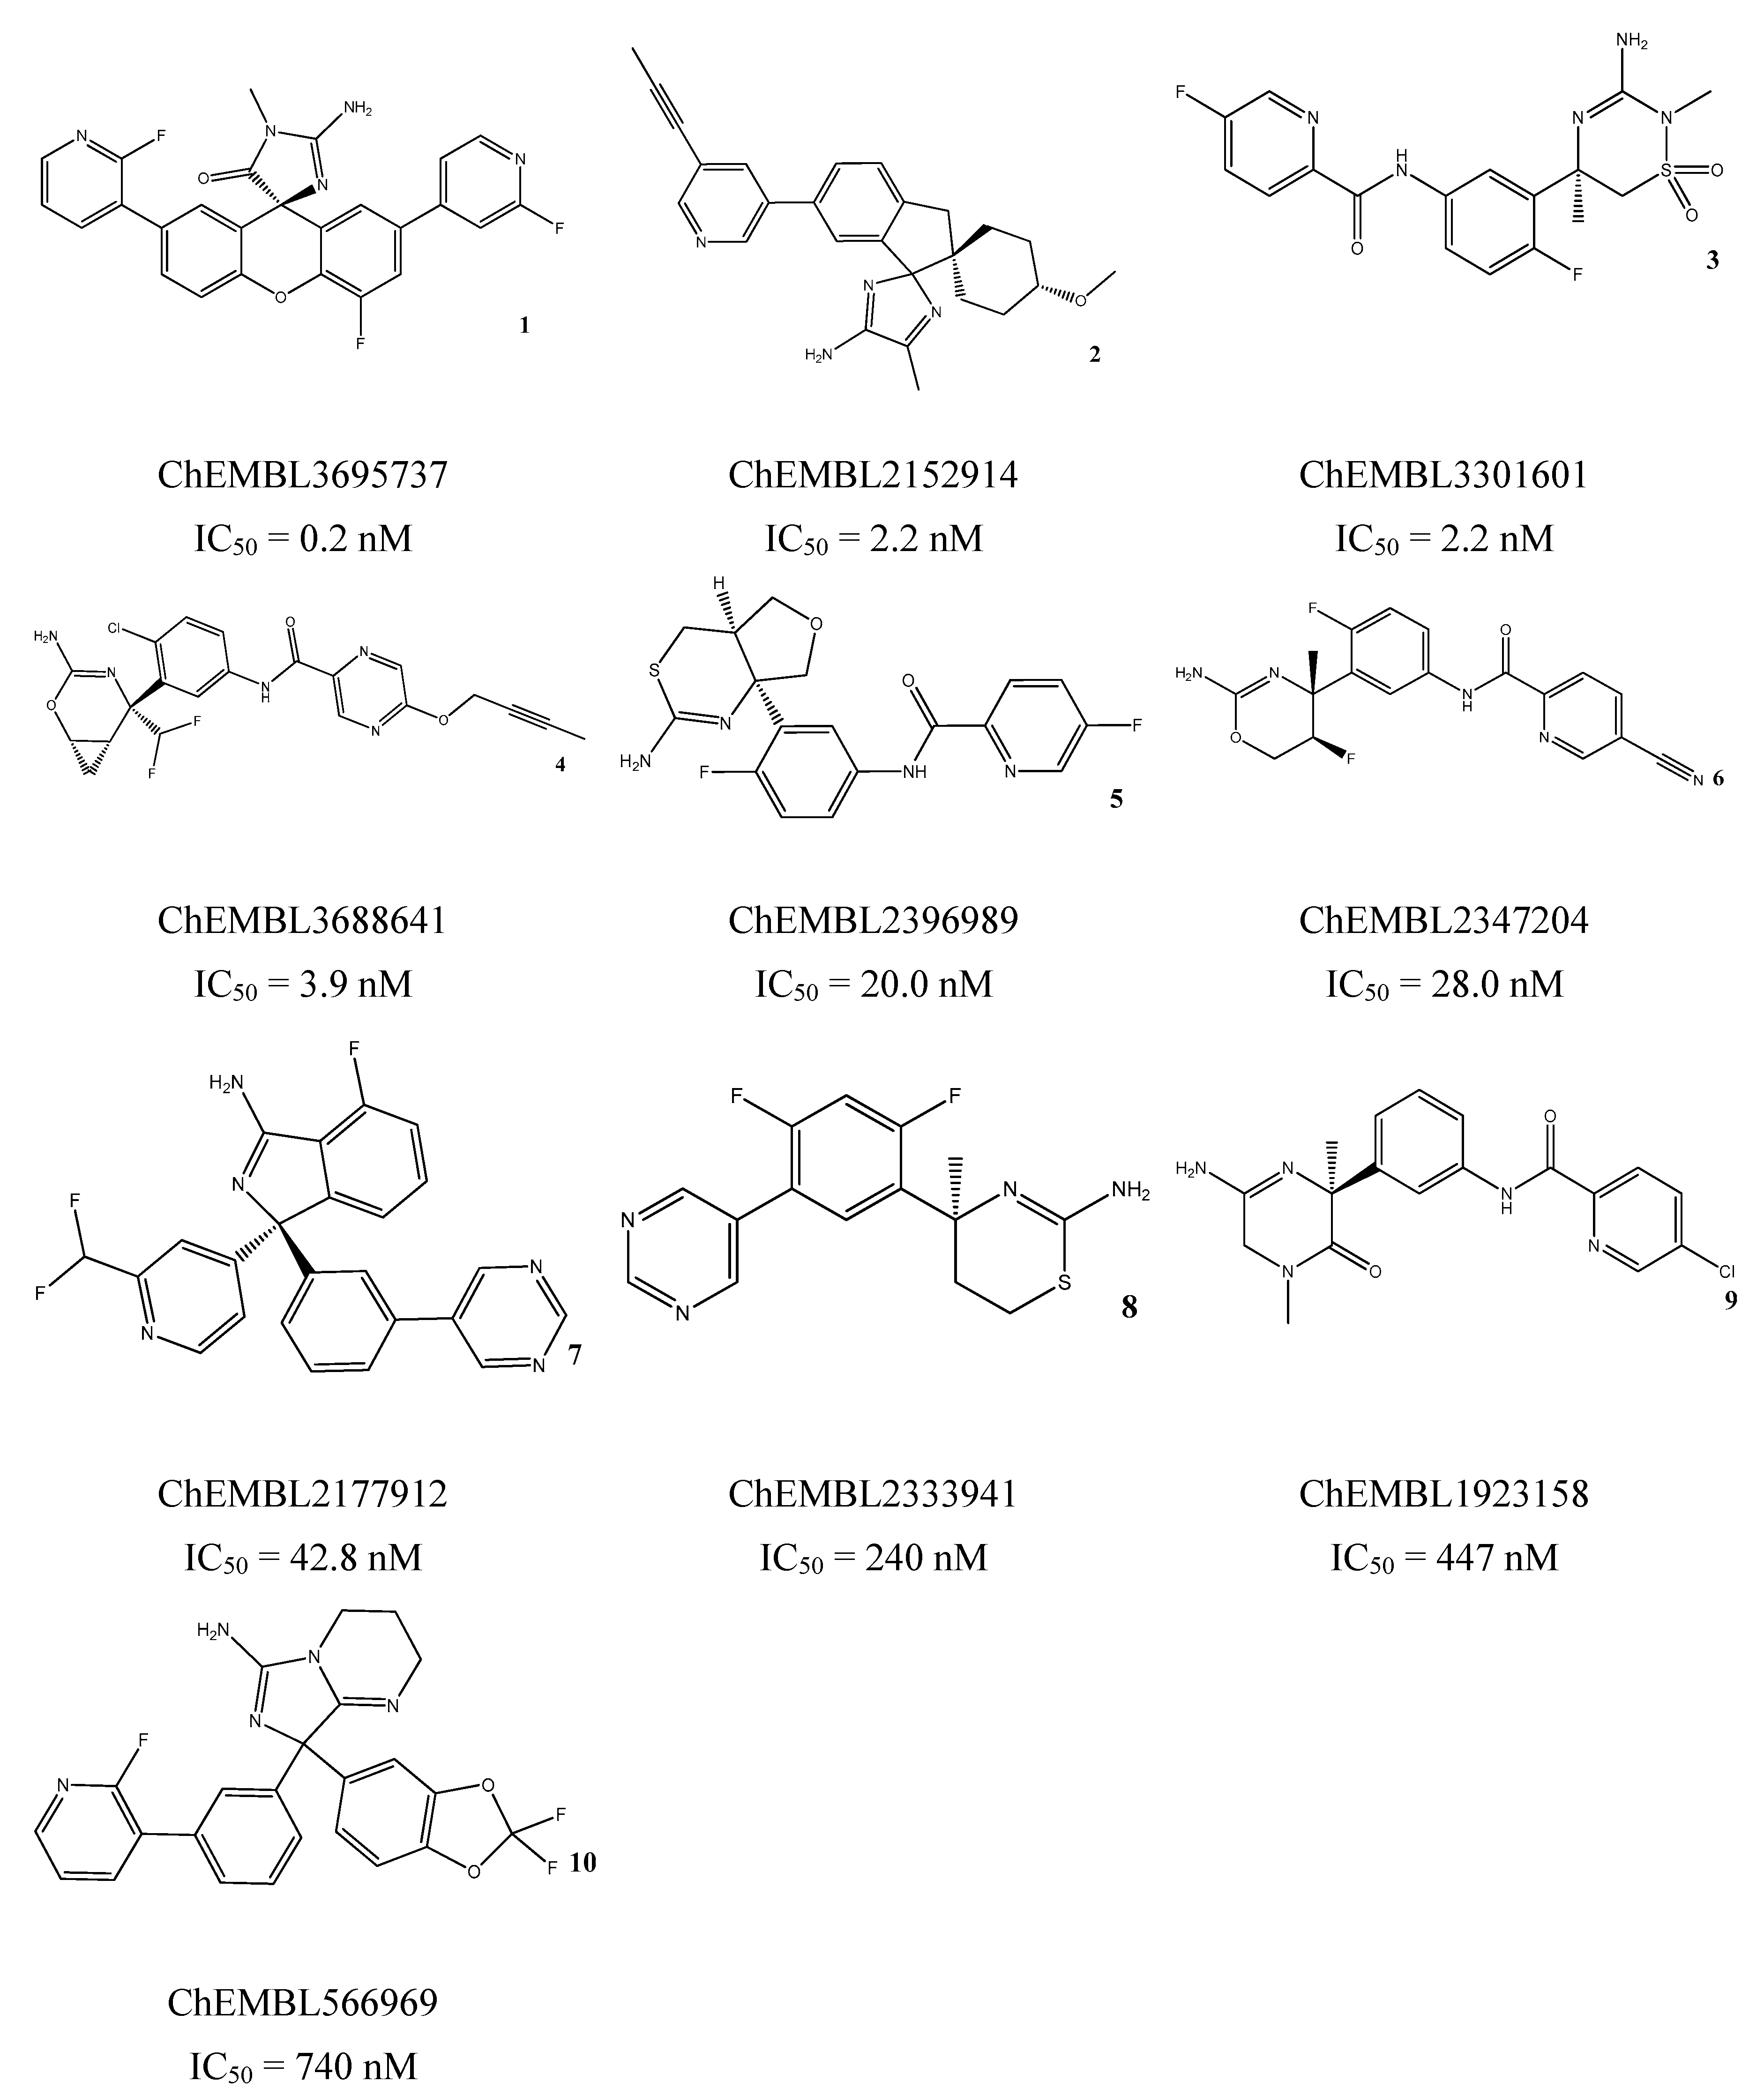
2.1. Dataset Preparation
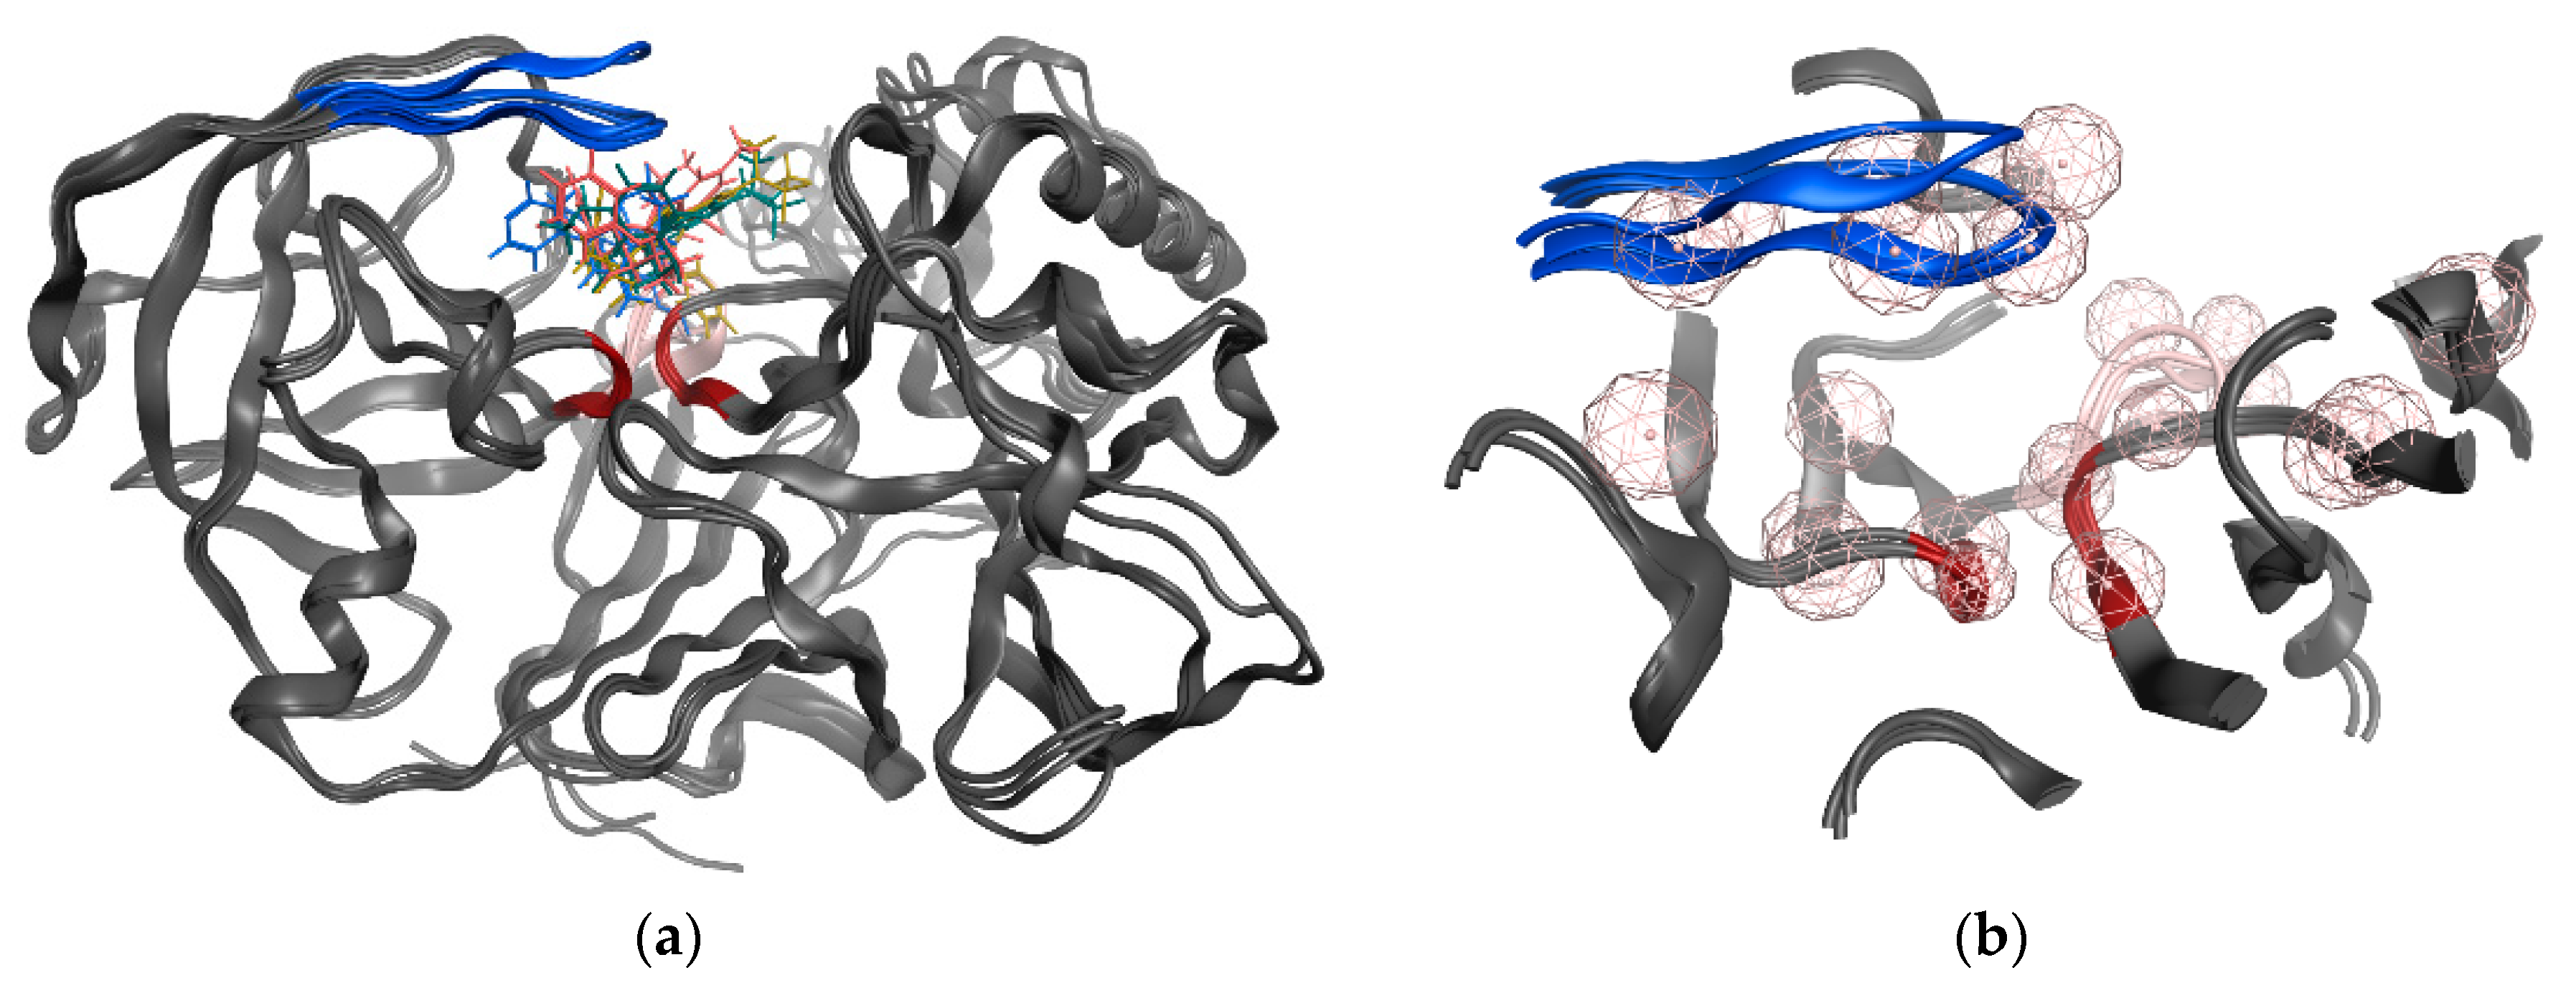
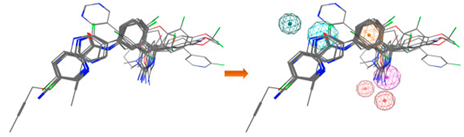
2.2. Structure-Based (SB) Pharmacophore Modelling
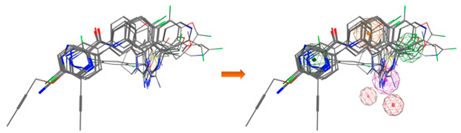
2.3. Ligand-Based (LB) Pharmacophore Modelling
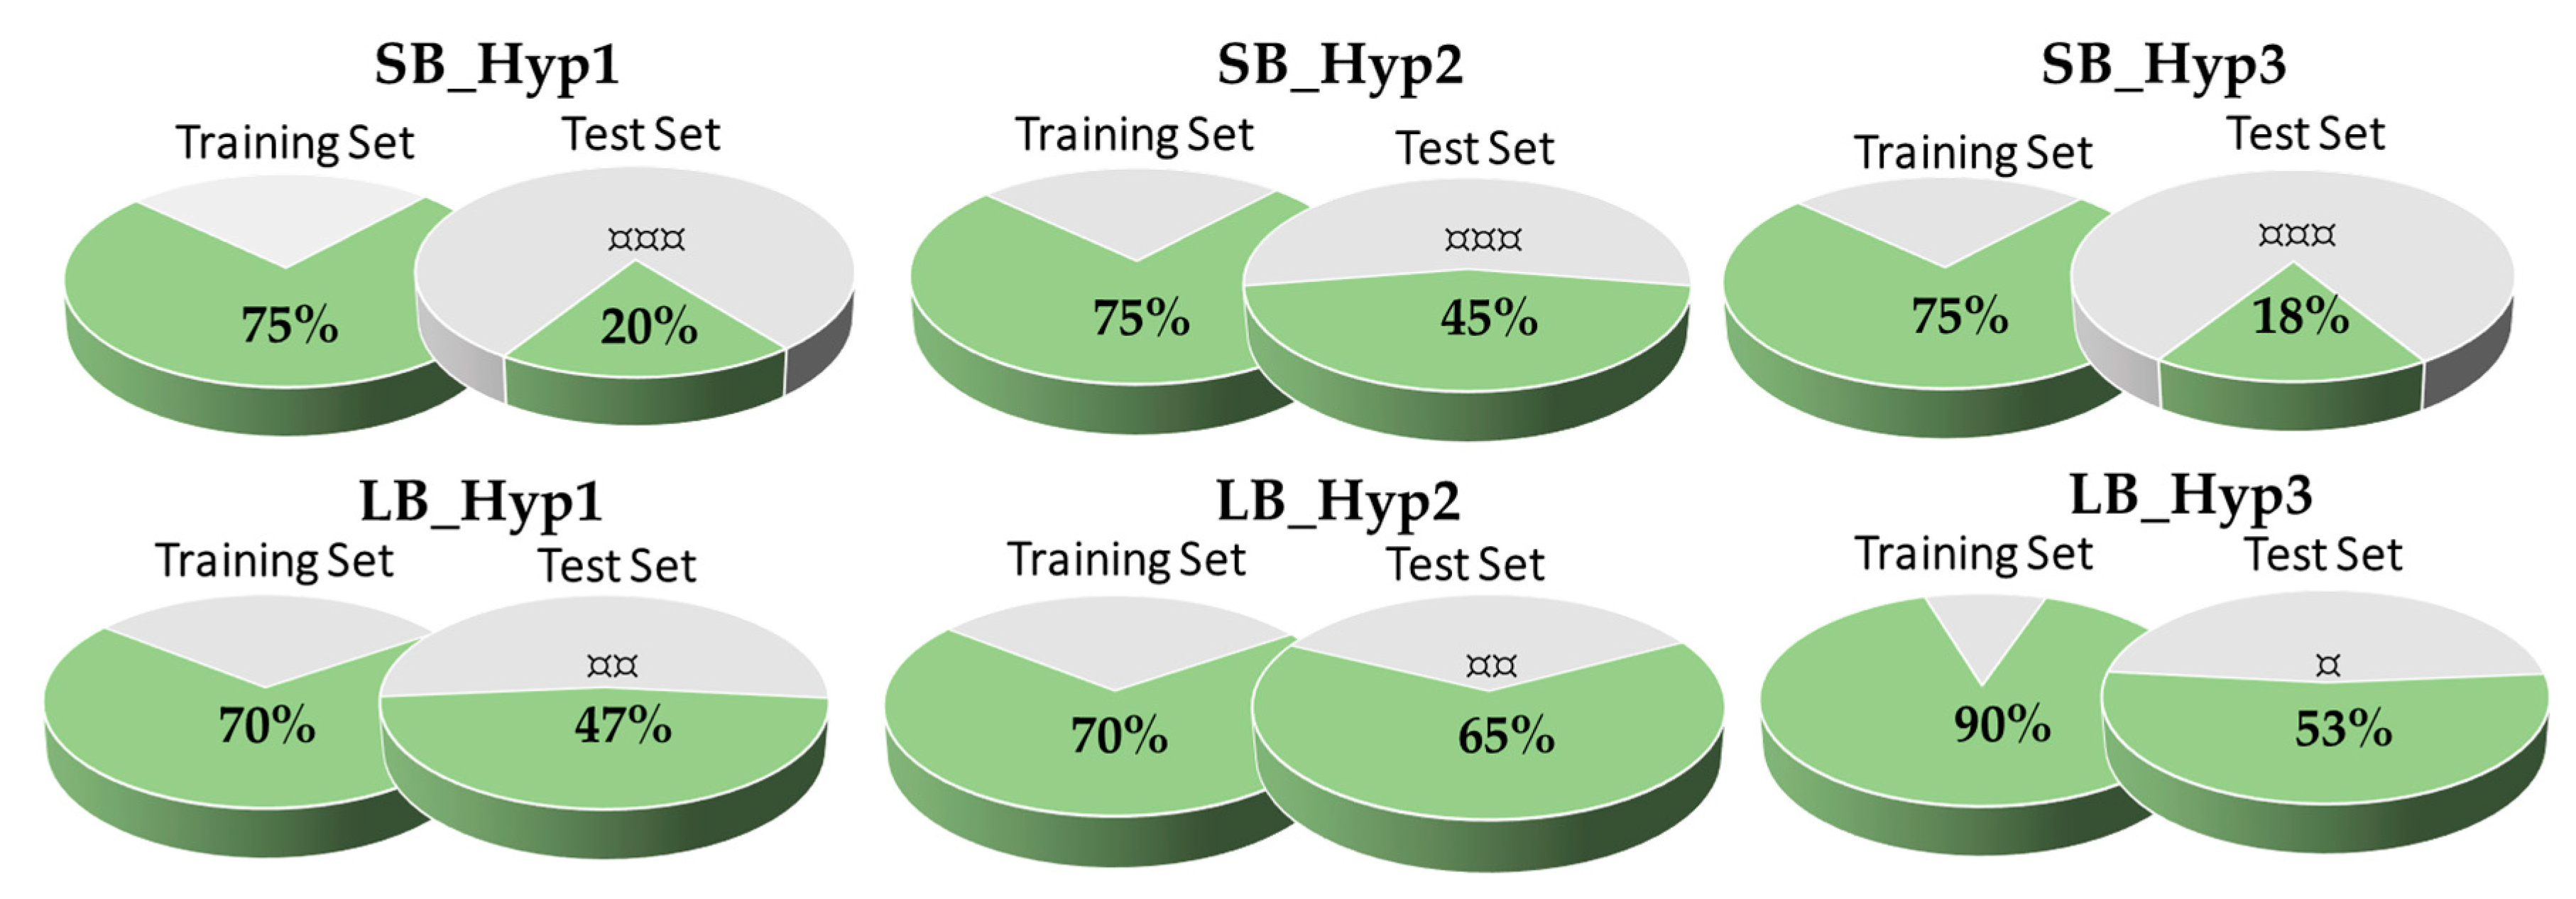
2.4. Validation of Pharmacophore Modelling
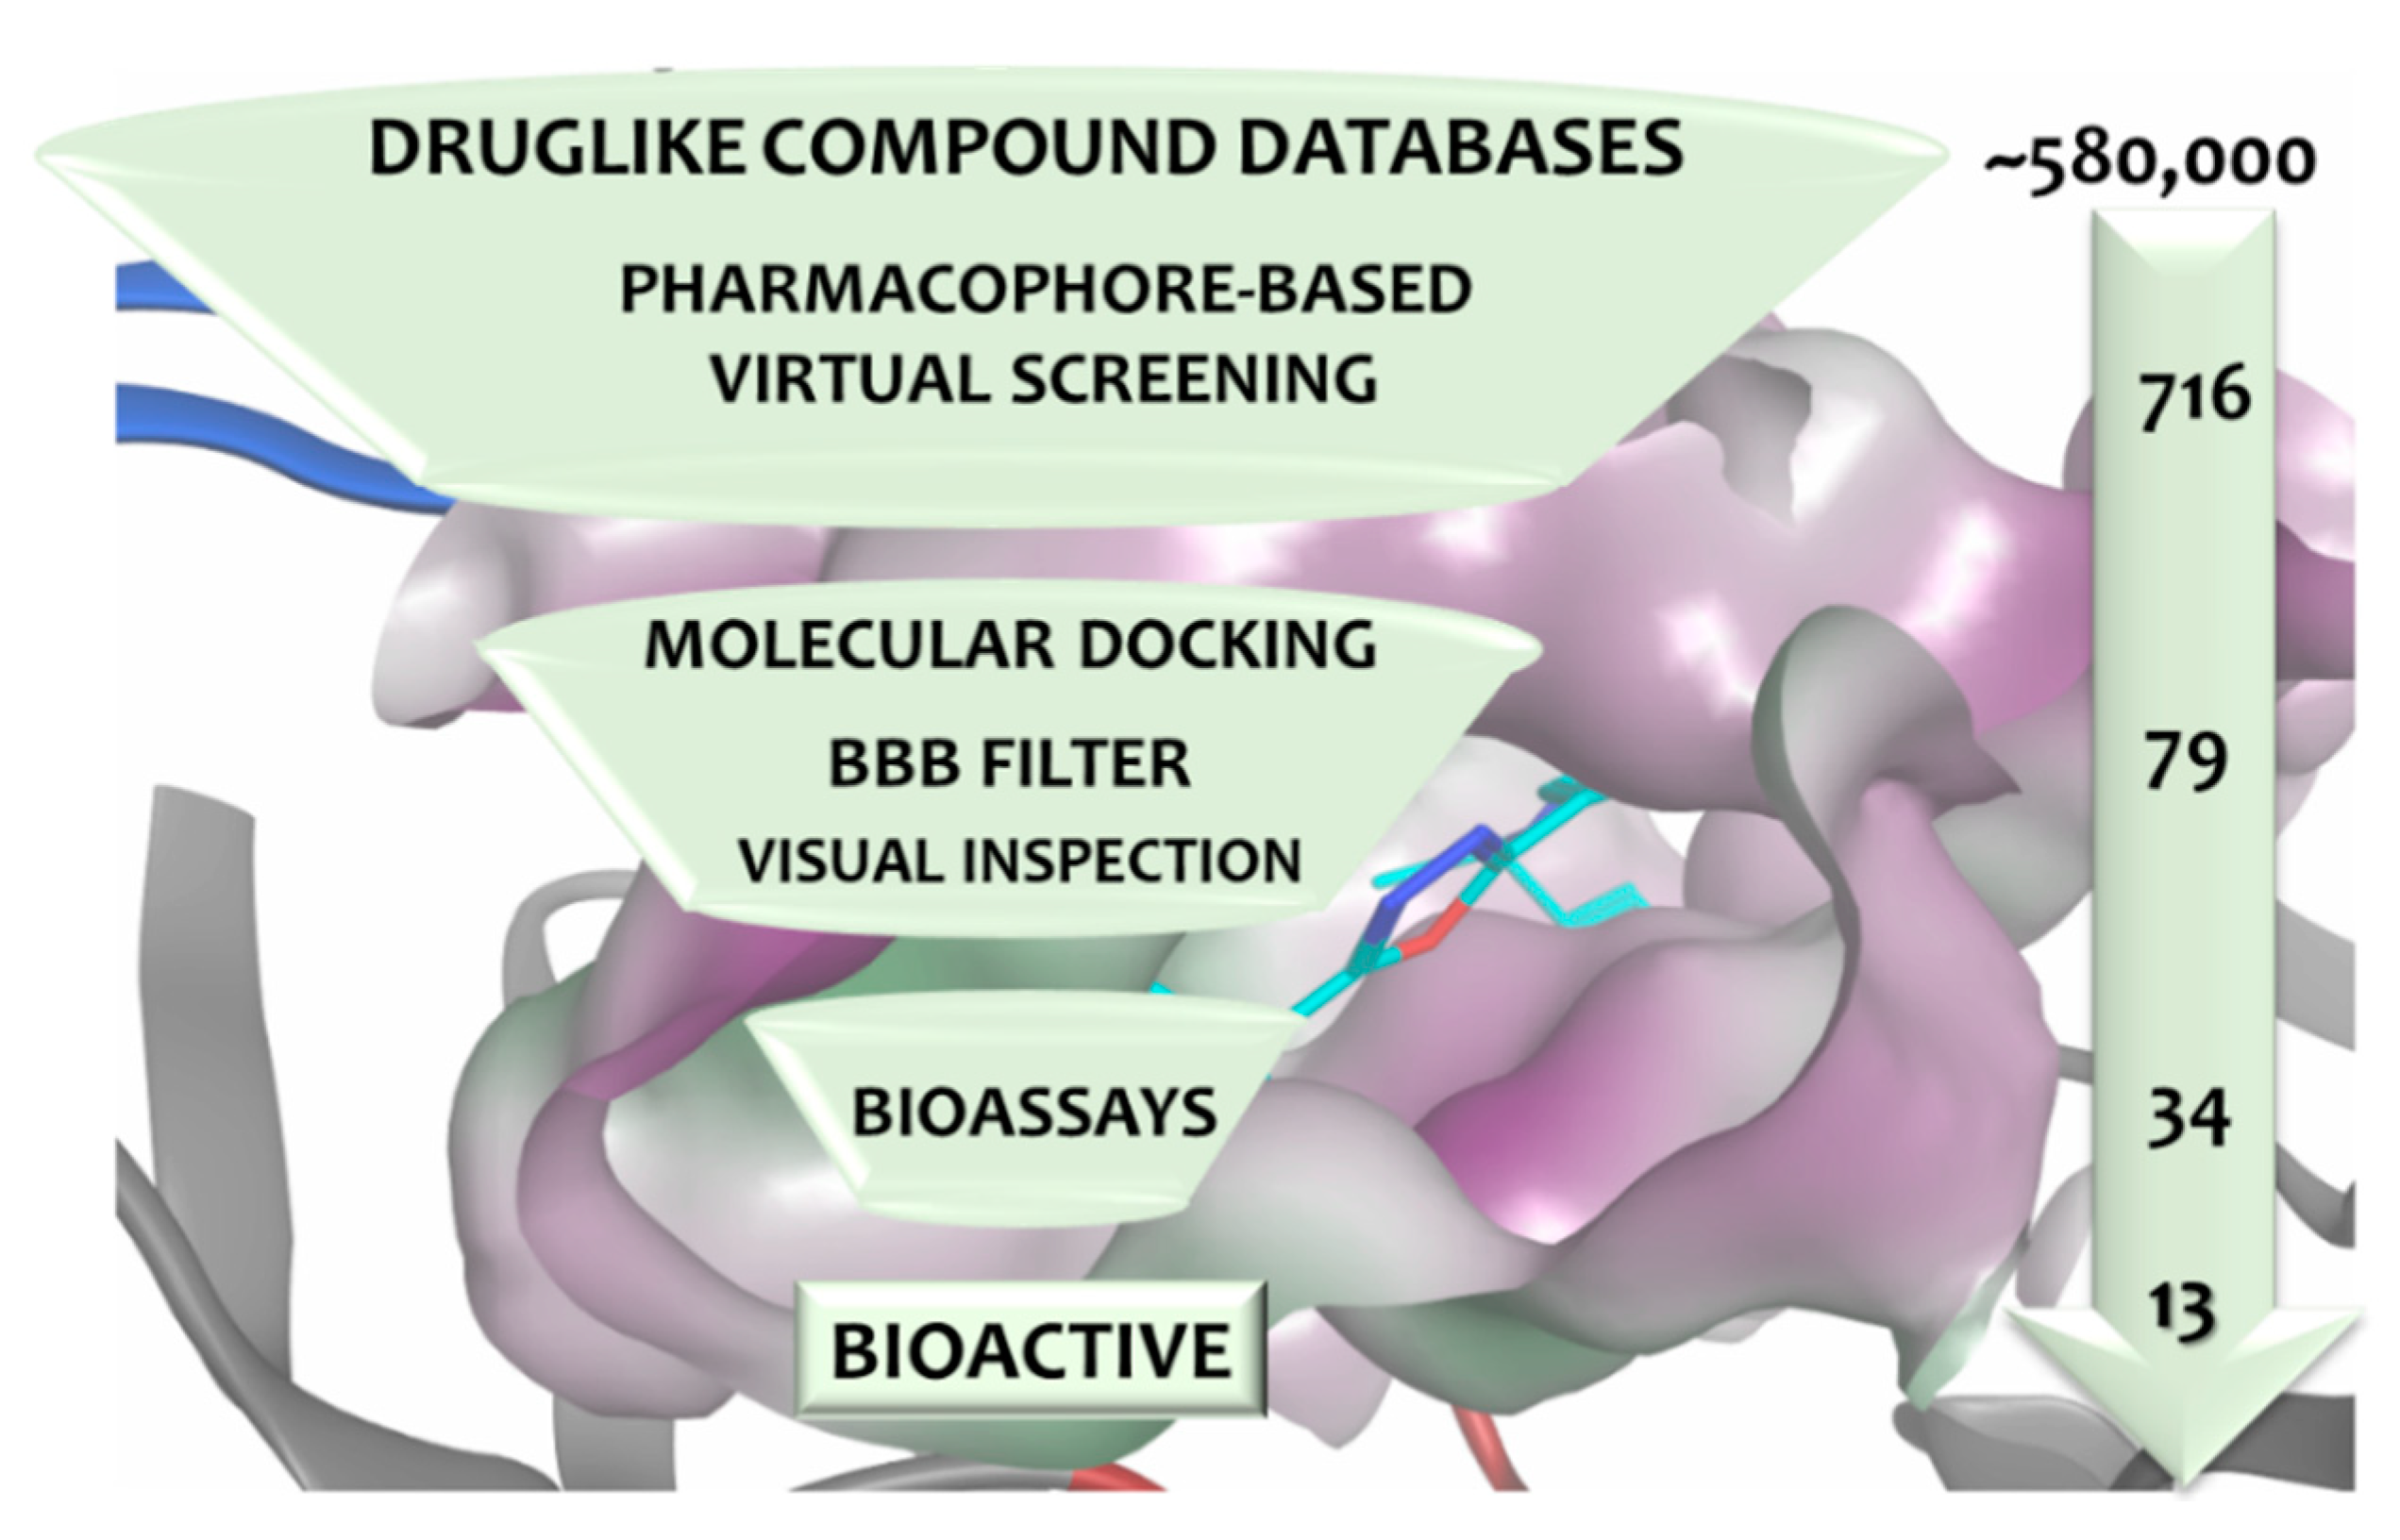
2.5. Pharmacophore-Based Virtual Screening and Molecular Docking
2.6. Blood–Brain Barrier Penetration Prediction
2.7. Cell-free Assay for BACE1 Activity
2.8. Descriptors
3. Results
3.1. Structure-Based Pharmacophore’ Generation
3.2. Ligand-Based Pharmacophore’ Generation
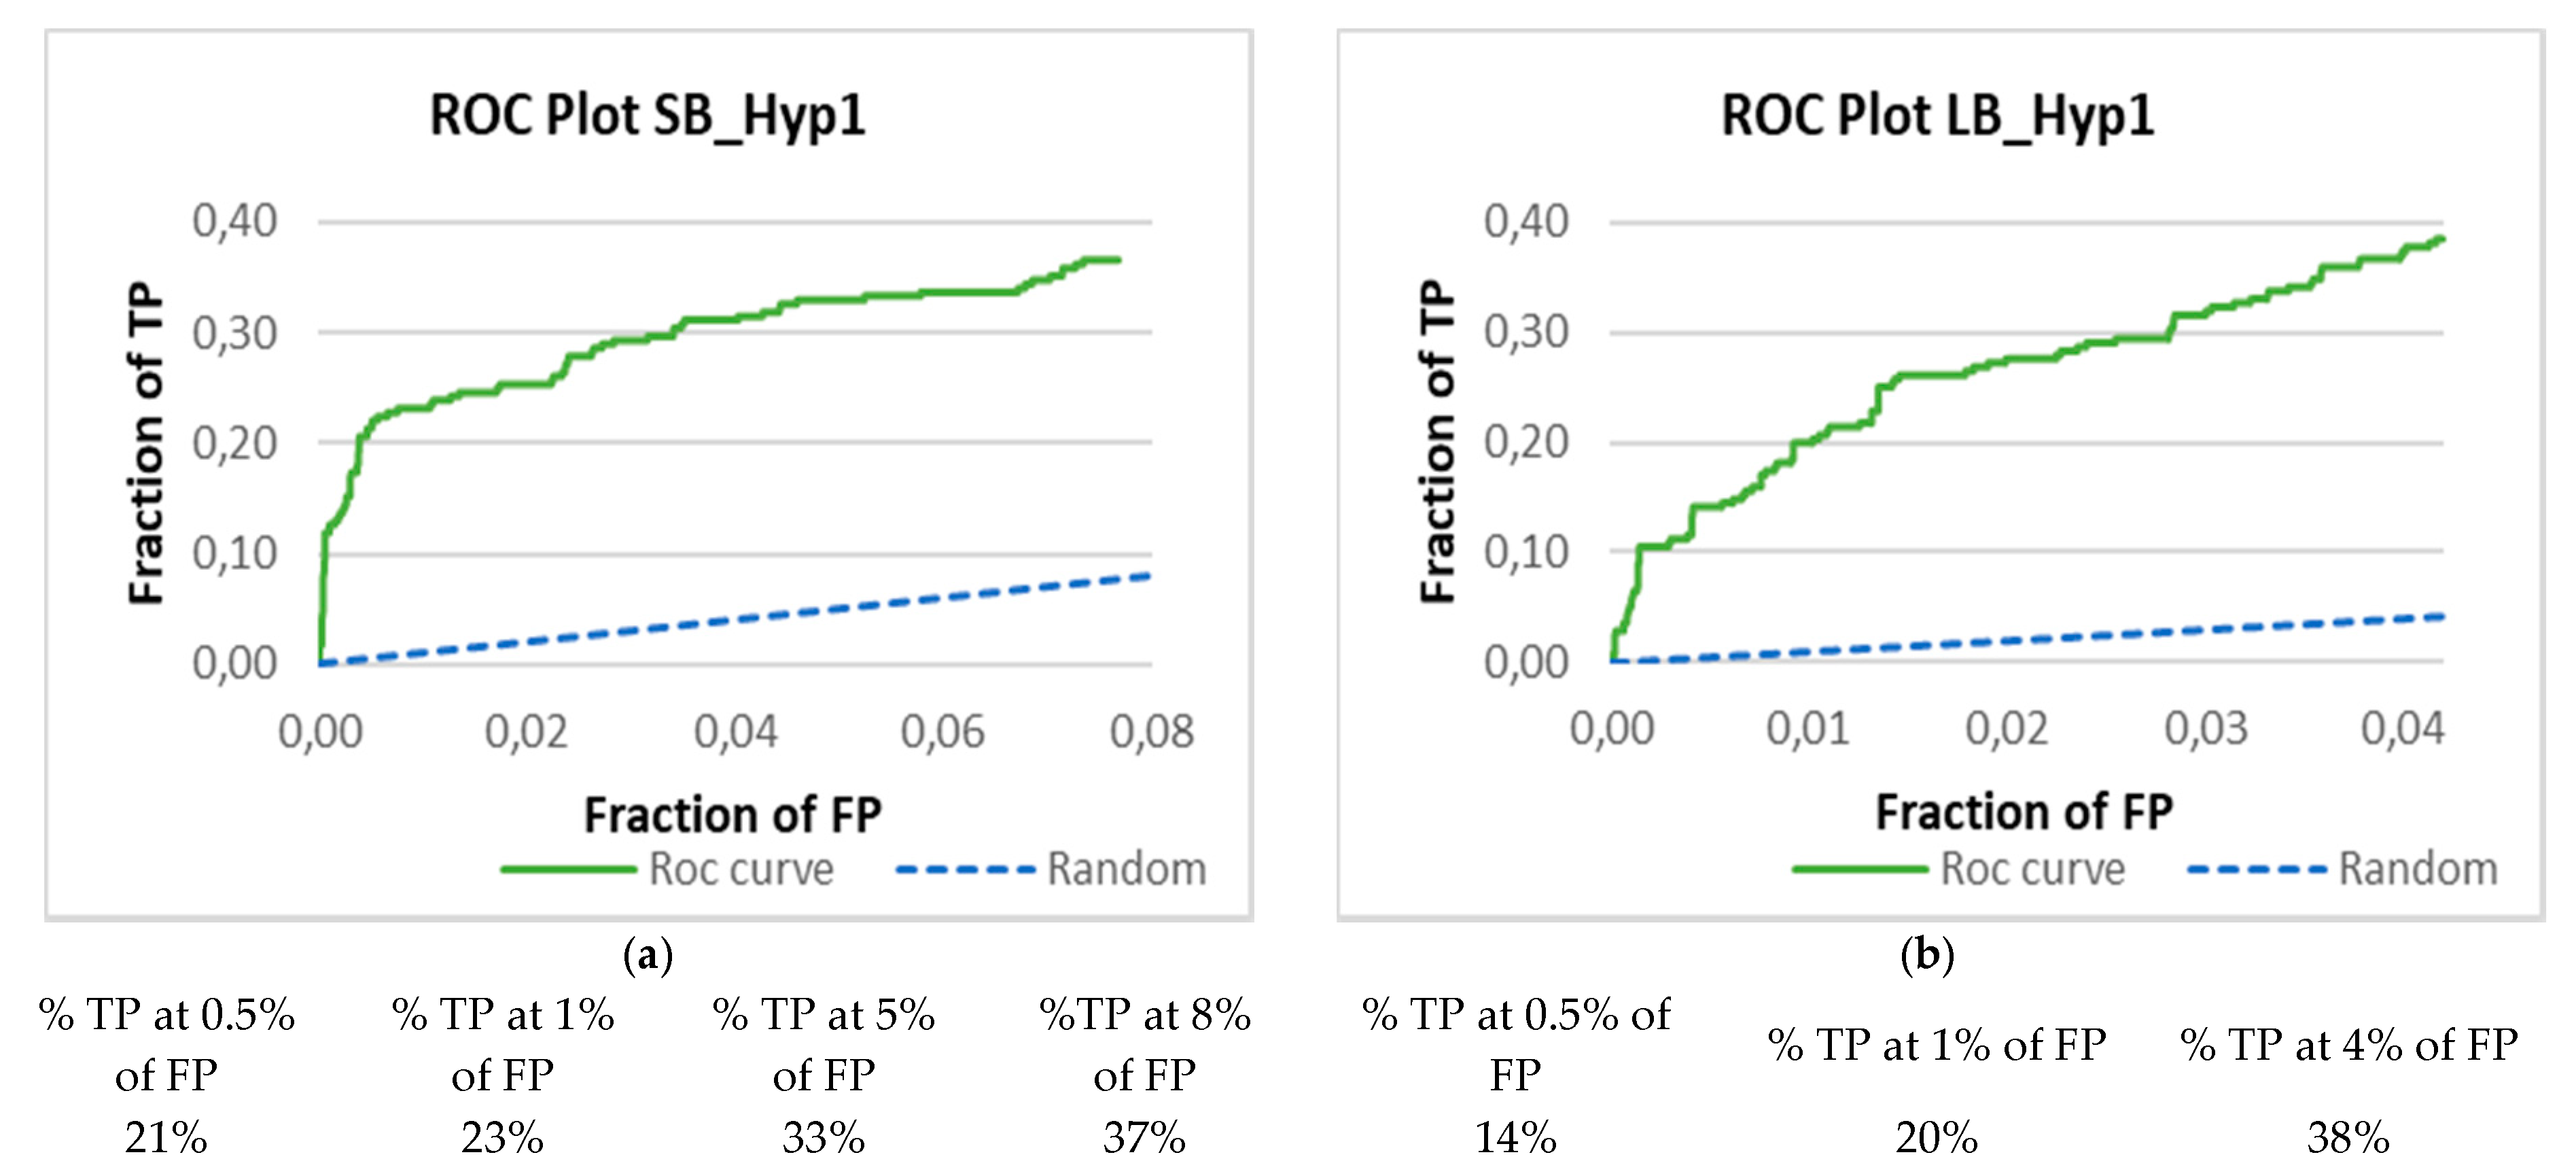
3.3. Validation of the Pharmacophore Modelling Protocol
Enrichment Metrics
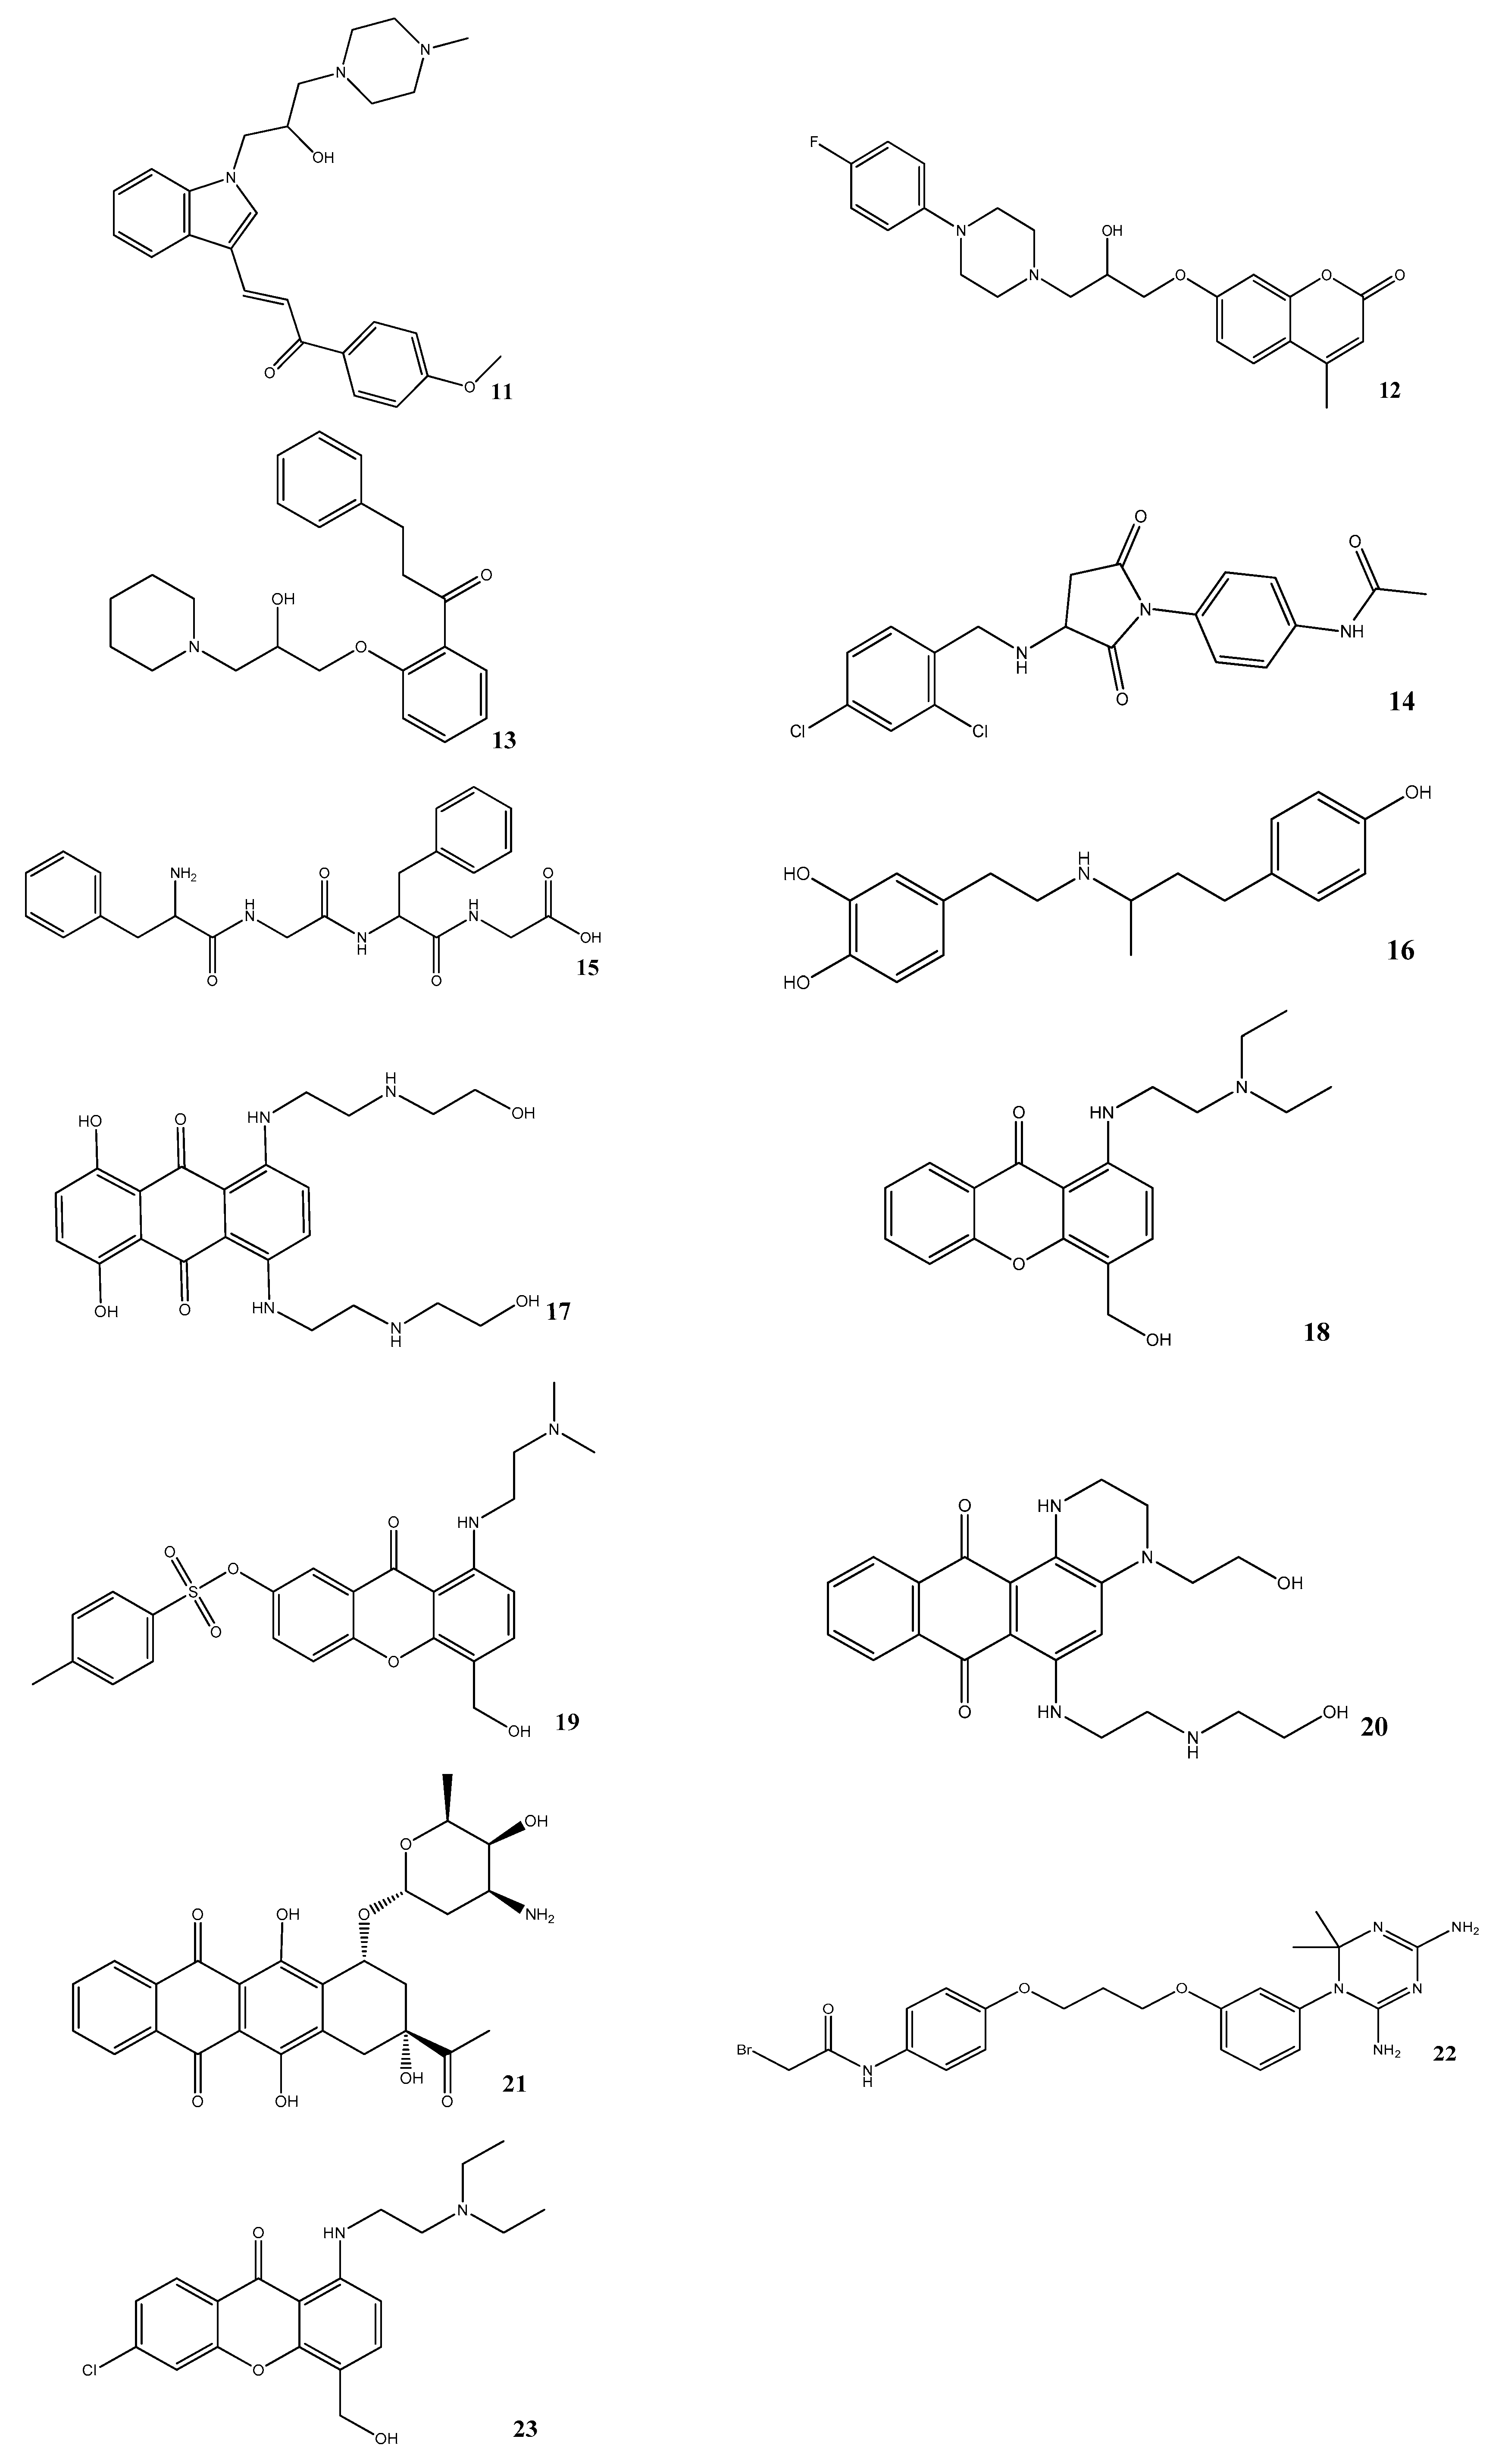
3.4. Virtual Screening
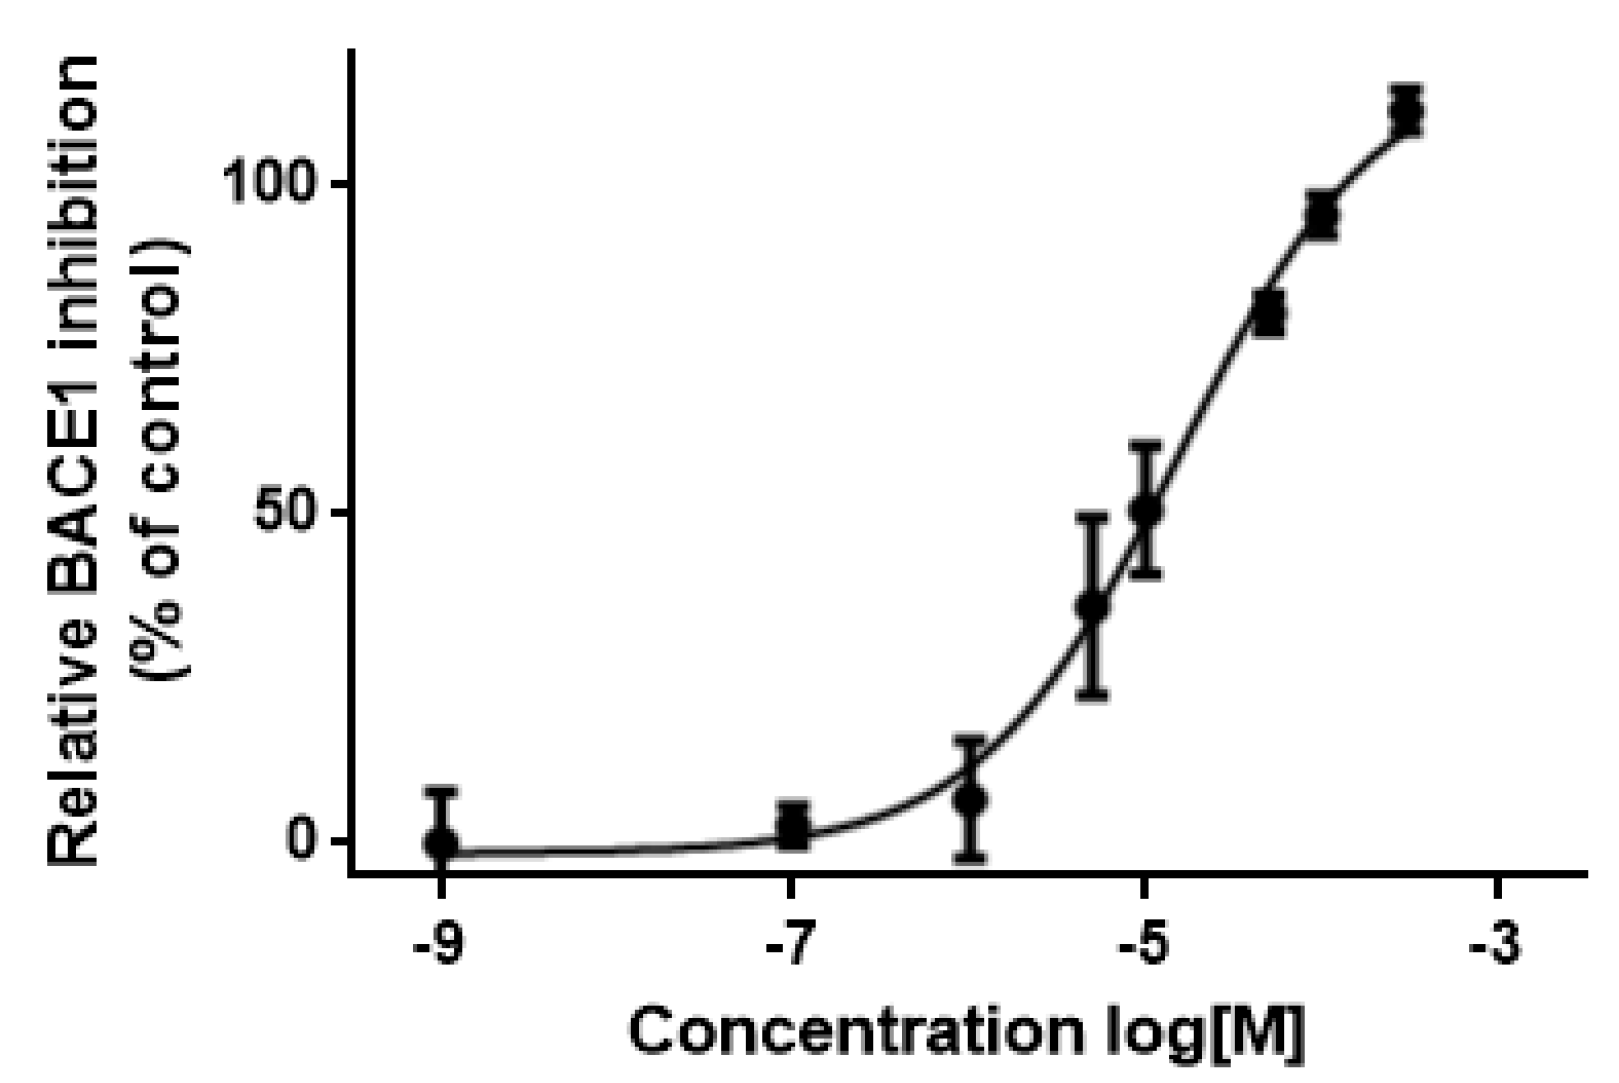
3.5. In Vitro Assessment of BACE1 Inhibition
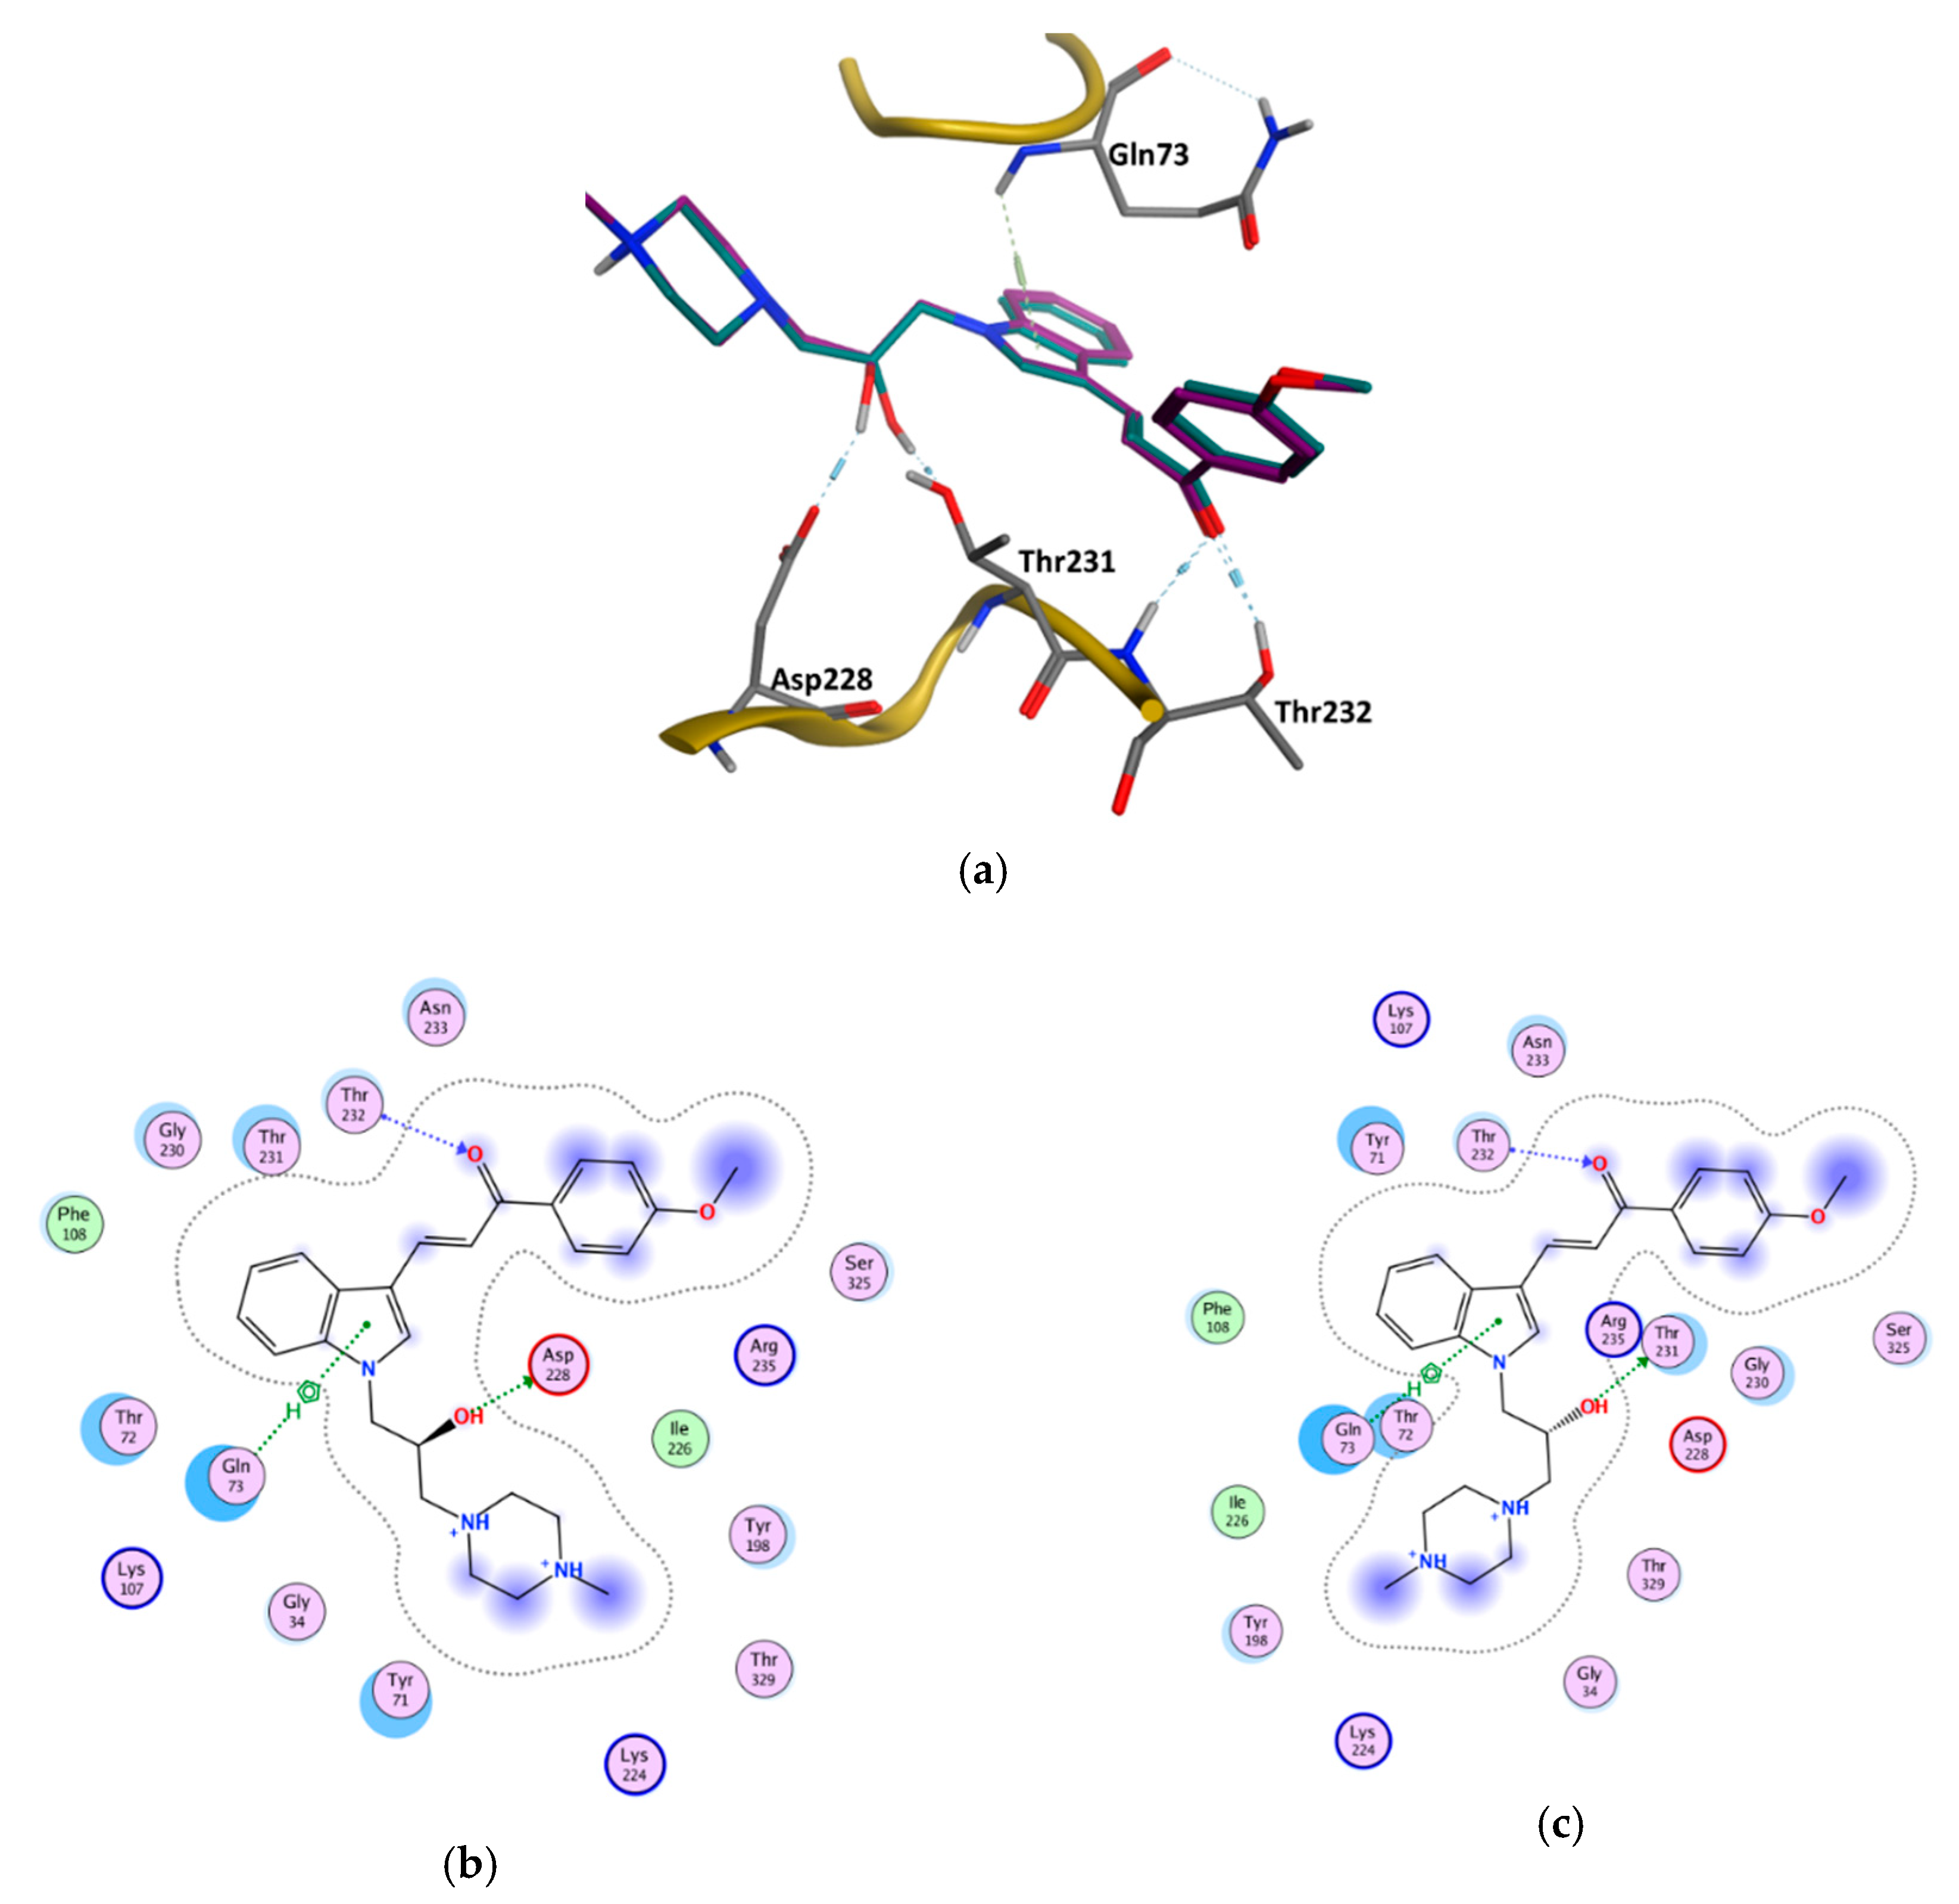
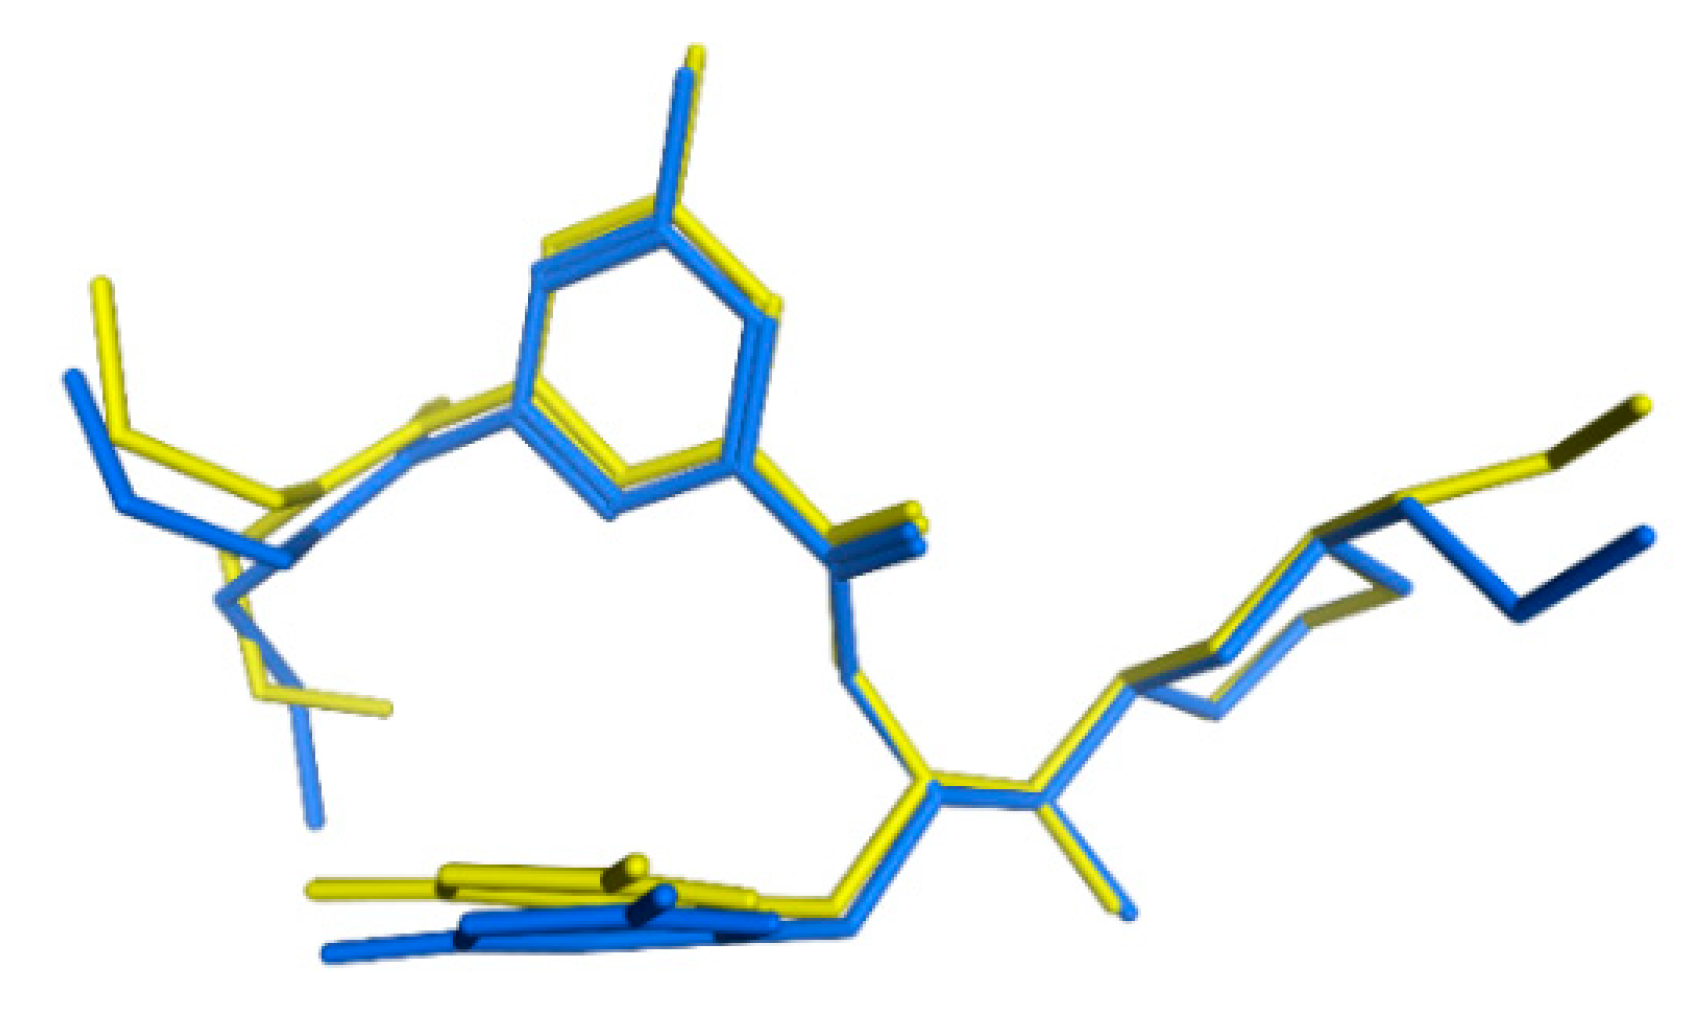
3.6. GOLD Binding Modes
4. Discussion
5. Conclusions
Supplementary Materials
Author Contributions
Funding
Conflicts of Interest
References
- Querfurth, H.; LaFerla, F. Alzheimer’s Disease. N. Engl. J. Med. 2010, 362, 329–344. [Google Scholar] [CrossRef] [PubMed] [Green Version]
- Meldolesi, J. Alzheimer’s disease: Key developments support promising perspectives for therapy. Pharmacol. Res. 2019, 146, 104316. [Google Scholar] [CrossRef] [PubMed]
- Cao, J.; Hou, J.; Ping, J.; Cai, D. Advances in developing novel therapeutic strategies for Alzheimer’s disease. Mol. Neurodegener. 2018, 13, 64. [Google Scholar] [CrossRef] [PubMed] [Green Version]
- Kulshreshtha, A.; Piplani, P. Current pharmacotherapy and putative disease-modifying therapy for Alzheimer’s disease. Neurol. Sci. 2016, 37, 1403–1435. [Google Scholar] [CrossRef]
- Tamagno, E.; Guglielmotto, M.; Monteleone, D.; Manassero, G.; Vasciaveo, V.; Tabaton, M. The Unexpected Role of Aβ1-42 Monomers in the Pathogenesis of Alzheimer’s Disease. J. Alzheimers Dis. 2018, 62, 1241–1245. [Google Scholar] [CrossRef] [Green Version]
- De Strooper, B.; Vassar, R.; Golde, T. The secretases: Enzymes with therapeutic potential in Alzheimer disease. Nat. Rev. Neurol. 2010, 6, 99–107. [Google Scholar] [CrossRef] [Green Version]
- Coimbra, J.R.M.; Marques, D.F.F.; Baptista, S.J.; Pereira, C.M.F.; Moreira, P.I.; Dinis, T.C.P.; Santos, A.E.; Salvador, J.A.R. Highlights in BACE1 Inhibitors for Alzheimer’s Disease Treatment. Front. Chem. 2018, 6, 178. [Google Scholar] [CrossRef] [Green Version]
- Vassar, R. BACE1 inhibition as a therapeutic strategy for Alzheimer’s disease. J. Sport Health Sci. 2016, 5, 388–390. [Google Scholar] [CrossRef] [Green Version]
- Yuan, J.; Venkatraman, S.; Zheng, Y.; McKeever, B.M.; Dillard, L.W.; Singh, S.B. Structure-based design of beta-site APP cleaving enzyme 1 (BACE1) inhibitors for the treatment of Alzheimer’s disease. J. Med. Chem. 2013, 56, 4156–4180. [Google Scholar] [CrossRef]
- Ghosh, A.K.; Osswald, H.L. BACE1 (beta-secretase) inhibitors for the treatment of Alzheimer’s disease. Chem. Soc. Rev. 2014, 43, 6765–6813. [Google Scholar] [CrossRef] [Green Version]
- Gu, T.; Wu, W.Y.; Dong, Z.X.; Yu, S.P.; Sun, Y.; Zhong, Y.; Lu, Y.T.; Li, N.G. Development and Structural Modification of BACE1 Inhibitors. Molecules 2016, 22, 4. [Google Scholar] [CrossRef] [PubMed] [Green Version]
- Ben Halima, S.; Mishra, S.; Raja, K.M.P.; Willem, M.; Baici, A.; Simons, K.; Brustle, O.; Koch, P.; Haass, C.; Caflisch, A.; et al. Specific Inhibition of beta-Secretase Processing of the Alzheimer Disease Amyloid Precursor Protein. Cell Rep. 2016, 14, 2127–2141. [Google Scholar] [CrossRef] [PubMed] [Green Version]
- Vassar, R.; Kuhn, P.H.; Haass, C.; Kennedy, M.E.; Rajendran, L.; Wong, P.C.; Lichtenthaler, S.F. Function, therapeutic potential and cell biology of BACE proteases: Current status and future prospects. J. Neurochem. 2014, 130, 4–28. [Google Scholar] [CrossRef] [PubMed] [Green Version]
- Das, B.; Yan, R. A Close Look at BACE1 Inhibitors for Alzheimer’s Disease Treatment. CNS Drugs 2019, 33, 251–263. [Google Scholar] [CrossRef]
- Piton, M.; Hirtz, C.; Desmetz, C.; Milhau, J.; Lajoix, A.D.; Bennys, K.; Lehmann, S.; Gabelle, A. Alzheimer’s Disease: Advances in Drug Development. J. Alzheimers Dis. 2018, 65, 3–13. [Google Scholar] [CrossRef] [PubMed]
- Hu, X.; Das, B.; Hou, H.; He, W.; Yan, R. BACE1 deletion in the adult mouse reverses preformed amyloid deposition and improves cognitive functions. J. Exp. Med. 2018, 215, 927–940. [Google Scholar] [CrossRef]
- Peters, F.; Salihoglu, H.; Rodrigues, E.; Herzog, E.; Blume, T.; Filser, S.; Dorostkar, M.; Shimshek, D.R.; Brose, N.; Neumann, U.; et al. BACE1 inhibition more effectively suppresses initiation than progression of beta-amyloid pathology. Acta Neuropathol. 2018, 135, 695–710. [Google Scholar] [CrossRef] [Green Version]
- Munro, K.M.; Nash, A.; Pigoni, M.; Lichtenthaler, S.F.; Gunnersen, J.M. Functions of the Alzheimer’s Disease Protease BACE1 at the Synapse in the Central Nervous System. J. Mol. Neurosci. 2016, 60, 305–315. [Google Scholar] [CrossRef] [Green Version]
- McConlogue, L.; Buttini, M.; Anderson, J.P.; Brigham, E.F.; Chen, K.S.; Freedman, S.B.; Games, D.; Johnson-Wood, K.; Lee, M.; Zeller, M.; et al. Partial reduction of BACE1 has dramatic effects on Alzheimer plaque and synaptic pathology in APP Transgenic Mice. J. Biol. Chem. 2007, 282, 26326–26334. [Google Scholar] [CrossRef] [Green Version]
- Sliwoski, G.; Kothiwale, S.; Meiler, J.; Lowe, E.W. Computational Methods in Drug Discovery. Pharmacol. Rev. 2014, 66, 334–395. [Google Scholar] [CrossRef] [Green Version]
- Klebe, G. Virtual ligand screening: Strategies, perspectives and limitations. Drug Discov. Today 2006, 11, 580–594. [Google Scholar] [CrossRef] [PubMed]
- Molecular Operating Environment (MOE), version 2016.08; Chemical Computing Group ULC: Montreal, QC, Canada, 2016.
- Lipinski, C.A.; Lombardo, F.; Dominy, B.W.; Feeney, P.J. Experimental and computational approaches to estimate solubility and permeability in drug discovery and development settings. Adv. Drug Deliver. Rev. 1997, 23, 3–25. [Google Scholar] [CrossRef]
- Gaulton, A.; Hersey, A.; Nowotka, M.; Bento, A.P.; Chambers, J.; Mendez, D.; Mutowo, P.; Atkinson, F.; Bellis, L.J.; Cibrián-Uhalte, E.; et al. The ChEMBL database in 2017. Nucleic Acids Res. 2016, 45, D945–D954. [Google Scholar] [CrossRef] [PubMed]
- Mysinger, M.M.; Carchia, M.; Irwin, J.J.; Shoichet, B.K. Directory of Useful Decoys, Enhanced (DUD-E): Better Ligands and Decoys for Better Benchmarking. J. Med. Chem. 2012, 55, 6582–6594. [Google Scholar] [CrossRef]
- Jorgensen, W.L.; Maxwell, D.S.; Tirado-Rives, J. Development and Testing of the OPLS All-Atom Force Field on Conformational Energetics and Properties of Organic Liquids. J. Am. Chem. Soc. 1996, 118, 11225–11236. [Google Scholar] [CrossRef]
- Jain, A.N.; Nicholls, A. Recommendations for evaluation of computational methods. J. Comput. Aided Mol. Des. 2008, 22, 133–139. [Google Scholar] [CrossRef] [Green Version]
- Mackey, M.D.; Melville, J.L. Better than Random? The Chemotype Enrichment Problem. J. Chem. Inf. Model. 2009, 49, 1154–1162. [Google Scholar] [CrossRef]
- Cole, J.; Nissink, J.; Taylor, R. Protein-ligand docking and virtual screening with GOLD. In Virtual Screening in Drug Discovery; Alvarez, J., Shoichet, B., Eds.; Taylor & Francis CRC Press: Boca Raton, FL, USA, 2005; pp. 379–415. [Google Scholar]
- Jones, G.; Willett, P.; Glen, R.C.; Leach, A.R.; Taylor, R. Development and validation of a genetic algorithm for flexible docking. J. Mol. Biol. 1997, 267, 727–748. [Google Scholar] [CrossRef] [Green Version]
- Cross, J.B.; Thompson, D.C.; Rai, B.K.; Baber, J.C.; Fan, K.Y.; Hu, Y.; Humblet, C. Comparison of several molecular docking programs: Pose prediction and virtual screening accuracy. J. Chem. Inf. Model. 2009, 49, 1455–1474. [Google Scholar] [CrossRef]
- Daina, A.; Michielin, O.; Zoete, V. SwissADME: A free web tool to evaluate pharmacokinetics, drug-likeness and medicinal chemistry friendliness of small molecules. Sci. Rep. 2017, 7, 42717. [Google Scholar] [CrossRef] [Green Version]
- Daina, A.; Zoete, V. A BOILED-Egg To Predict Gastrointestinal Absorption and Brain Penetration of Small Molecules. ChemMedChem 2016, 11, 1117–1121. [Google Scholar] [CrossRef] [PubMed] [Green Version]
- Stachel, S.J.; Coburn, C.A.; Steele, T.G.; Jones, K.G.; Loutzenhiser, E.F.; Gregro, A.R.; Rajapakse, H.A.; Lai, M.T.; Crouthamel, M.C.; Xu, M.; et al. Structure-based design of potent and selective cell-permeable inhibitors of human beta-secretase (BACE-1). J. Med. Chem. 2004, 47, 6447–6450. [Google Scholar] [CrossRef] [PubMed]
- Voet, A.; Qing, X.; Lee, X.Y.; De Raeymaecker, J.; Tame, J.; Zhang, K.; De Maeyer, M. Pharmacophore modeling: Advances, limitations, and current utility in drug discovery. J. Recept. Ligand Channel Res. 2014, 7, 81–92. [Google Scholar] [CrossRef] [Green Version]
- Berman, H.M.; Westbrook, J.; Feng, Z.; Gilliland, G.; Bhat, T.N.; Weissig, H.; Shindyalov, I.N.; Bourne, P.E. The Protein Data Bank. Nucleic Acids Res. 2000, 28, 235–242. [Google Scholar] [CrossRef] [Green Version]
- Greenidge, P.A.; Carlsson, B.; Bladh, L.-G.; Gillner, M. Pharmacophores Incorporating Numerous Excluded Volumes Defined by X-ray Crystallographic Structure in Three-Dimensional Database Searching: Application to the Thyroid Hormone Receptor. J. Med. Chem. 1998, 41, 2503–2512. [Google Scholar] [CrossRef]
- Kumalo, H.M.; Bhakat, S.; Soliman, M.E. Investigation of flap flexibility of beta-secretase using molecular dynamic simulations. J. Biomol. Struct. Dyn. 2016, 34, 1008–1019. [Google Scholar] [CrossRef]
- Meagher, K.L.; Carlson, H.A. Incorporating Protein Flexibility in Structure-Based Drug Discovery: Using HIV-1 Protease as a Test Case. J. Am. Chem. Soc. 2004, 126, 13276–13281. [Google Scholar] [CrossRef]
- Jones, G.; Willett, P.; Glen, R.C. A genetic algorithm for flexible molecular overlay and pharmacophore elucidation. J. Comput. Aided Mol. Des. 1995, 9, 532–549. [Google Scholar] [CrossRef]
- Lionta, E.; Spyrou, G.; Vassilatis, D.K.; Cournia, Z. Structure-based virtual screening for drug discovery: Principles, applications and recent advances. Curr. Top. Med. Chem. 2014, 14, 1923–1938. [Google Scholar] [CrossRef]
- Xu, Y.; Li, M.J.; Greenblatt, H.; Chen, W.; Paz, A.; Dym, O.; Peleg, Y.; Chen, T.; Shen, X.; He, J.; et al. Flexibility of the flap in the active site of BACE1 as revealed by crystal structures and molecular dynamics simulations. Acta Crystallogr. D Biol. Crystallogr. 2012, 68, 13–25. [Google Scholar] [CrossRef]


| Model | Features | Inter-Features Distance Range (Å) |
|---|---|---|
| SB_Hyp1 | HBA&ML; HBA; HBD&Cat; PHBD; Aro; Hyd; 23ExcV |  |
| SB_Hyp2 | HBA; HBD&Cat; HBD; PHBD; Hyd; Aro; 23ExcV |  |
| SB_Hyp3 | HBA&ML; HBA; HBD&Cat; HBD; PHBD; Hyd; Aro; 23ExcV | 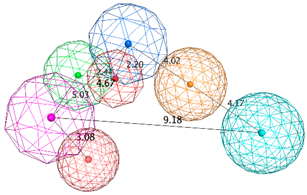 |
| Model | Original Features | Cover | Overlap Score | Refined Features | Inter-Features Distance Range (Å) and Molecular Alignment |
|---|---|---|---|---|---|
| LB_Hyp1 | Aro; PHBD; PHBA; HBD | 10 | 6.971 | HBA; PHBA; HBD; 2PHBD; Aro |  |
 | |||||
| LB_Hyp2 | Aro; PHBD; HBD; HBA | 10 | 6.826 | HBD; 2PHBD; Aro/Hyd; Aro; Hyd | 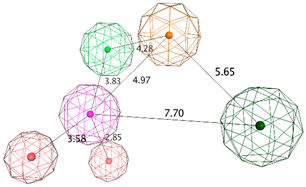 |
 | |||||
| LB_Hyp3 | Hyd; PHBD; PHBA; HBD; HBA | 10 | 6.899 | HBA; PHBA; HBD; PHBD; Aro; Hyd |  |
 | |||||
| Pharmacophore Models | D | A | Ht | TP | TN | FN | FP | % Se | % Sp | % Accuracy | EF0.5% | EF |
|---|---|---|---|---|---|---|---|---|---|---|---|---|
| SB_Hyp1 | 18017 | 276 | 1462 | 101 | 16380 | 175 | 1361 | 37 | 92 | 91 | 30.5 | 4.5 |
| SB_Hyp2 | 18017 | 276 | 1206 | 94 | 16629 | 182 | 1112 | 34 | 94 | 93 | 16.7 | 5.1 |
| SB_Hyp3 | 18017 | 276 | 595 | 78 | 17224 | 198 | 517 | 28 | 97 | 96 | 31.9 | 8.6 |
| LB_Hyp1 | 18017 | 276 | 851 | 106 | 16996 | 170 | 745 | 38 | 96 | 95 | 22.5 | 8.1 |
| LB_Hyp2 | 18017 | 276 | 1105 | 96 | 16732 | 180 | 1009 | 35 | 94 | 93 | 12.3 | 5.7 |
| LB_Hyp3 | 18017 | 276 | 1774 | 93 | 16060 | 183 | 1681 | 34 | 91 | 90 | 13.1 | 3.4 |
| Compound | Compound Code | Average Percent Inhibition at 10 μM | MW | PSA | LogPo/w | BBB |
|---|---|---|---|---|---|---|
| 11 | AE-848/42798994 | 50.3 | 434.6 | 59.1 | 3.6 | Yes |
| 12 | AP-124/43383636 | 33.5 | 413.5 | 63.4 | 2.8 | Yes |
| 13 | AK-778/11348007 | 34.7 | 368.5 | 51.0 | 3.8 | Yes |
| 14 | AN-919/15527216 | 31.3 | 407.3 | 83.1 | 2.9 | Yes |
| 15 | NSC343027 | 30.7 | 426.5 | 155.1 | 0.4 | No |
| 16 | NSC299583 | 29.9 | 302.4 | 77.3 | 3.7 | Yes |
| 17 | NSC279836 | 22.6 | 446.5 | 172.3 | −0.5 | No |
| 18 | NSC166368 | 20.6 | 341.4 | 63.0 | 2.3 | Yes |
| 19 | NSC354677 | 21.2 | 483.6 | 106.4 | 3.0 | No |
| 20 | NSC270924 | 19.5 | 411.5 | 118.5 | 0.1 | No |
| 21 | NSC256439 | 18.1 | 498.5 | 178.2 | 1.4 | No |
| 22 | NSC109833 | 18.1 | 504.4 | 126.8 | 4.5 | No |
| 23 | NSC166370 | 15.5 | 375.9 | 63.0 | 3.0 | Yes |
| Reference compound | β-Secretase Inhibitor IV | 52.9 * | ||||
| Enantiomer | Type of Interaction | ChemPLP Score |
|---|---|---|
| (S) | Gln73—Aromatic interaction −3.80 Asp228—Hydrogen bond interaction −3.30 Thr232—Hydrogen bond interaction −1.20 Thr232—Hydrogen bond interaction −1.80 | 91.70 |
| (R) | Gln73—Aromatic interaction −3.40 Thr231—Hydrogen bond interaction −1.00 Thr232—Hydrogen bond interaction −1.00 Thr232—Hydrogen bond interaction −1.70 | 89.56 |
© 2020 by the authors. Licensee MDPI, Basel, Switzerland. This article is an open access article distributed under the terms and conditions of the Creative Commons Attribution (CC BY) license (http://creativecommons.org/licenses/by/4.0/).
Share and Cite
Coimbra, J.R.M.; Baptista, S.J.; Dinis, T.C.P.; Silva, M.M.C.; Moreira, P.I.; Santos, A.E.; Salvador, J.A.R. Combining Virtual Screening Protocol and In Vitro Evaluation towards the Discovery of BACE1 Inhibitors. Biomolecules 2020, 10, 535. https://doi.org/10.3390/biom10040535
Coimbra JRM, Baptista SJ, Dinis TCP, Silva MMC, Moreira PI, Santos AE, Salvador JAR. Combining Virtual Screening Protocol and In Vitro Evaluation towards the Discovery of BACE1 Inhibitors. Biomolecules. 2020; 10(4):535. https://doi.org/10.3390/biom10040535
Chicago/Turabian StyleCoimbra, Judite R. M., Salete J. Baptista, Teresa C. P. Dinis, Maria M. C. Silva, Paula I. Moreira, Armanda E. Santos, and Jorge A. R. Salvador. 2020. "Combining Virtual Screening Protocol and In Vitro Evaluation towards the Discovery of BACE1 Inhibitors" Biomolecules 10, no. 4: 535. https://doi.org/10.3390/biom10040535