
Cytotoxicity and Mitochondrial Effects of Phenolic and Quinone-Based Mitochondria-Targeted and Untargeted Antioxidants on Human Neuronal and Hepatic Cell Lines: A Comparative Analysis

 , , ,
, , ,  , ,
, ,
Abstract
:1. Introduction
2. Material and Methods
2.1. Reagents and Cells
2.2. Chemical Synthesis
2.2.1. General Conditions
2.2.2. General Procedure for Synthesis of TPP+-Based Antioxidants
2.3. Cell Culture Conditions and Treatments with Compounds
2.3.1. HepG2 Cells
2.3.2. Differentiated SH-SY5Y Cells
2.4. Compound Treatments
2.5. Cell Mass
2.6. Cell Metabolic Activity
2.7. Intracellular ATP Levels
2.8. Mitochondrial Polarization
2.9. Cellular Oxygen Consumption and Extracellular Acidification Rates
2.10. Data Preprocessing and Statistical Analysis
2.10.1. Data Preprocessing
2.10.2. Statistical Analysis
3. Results
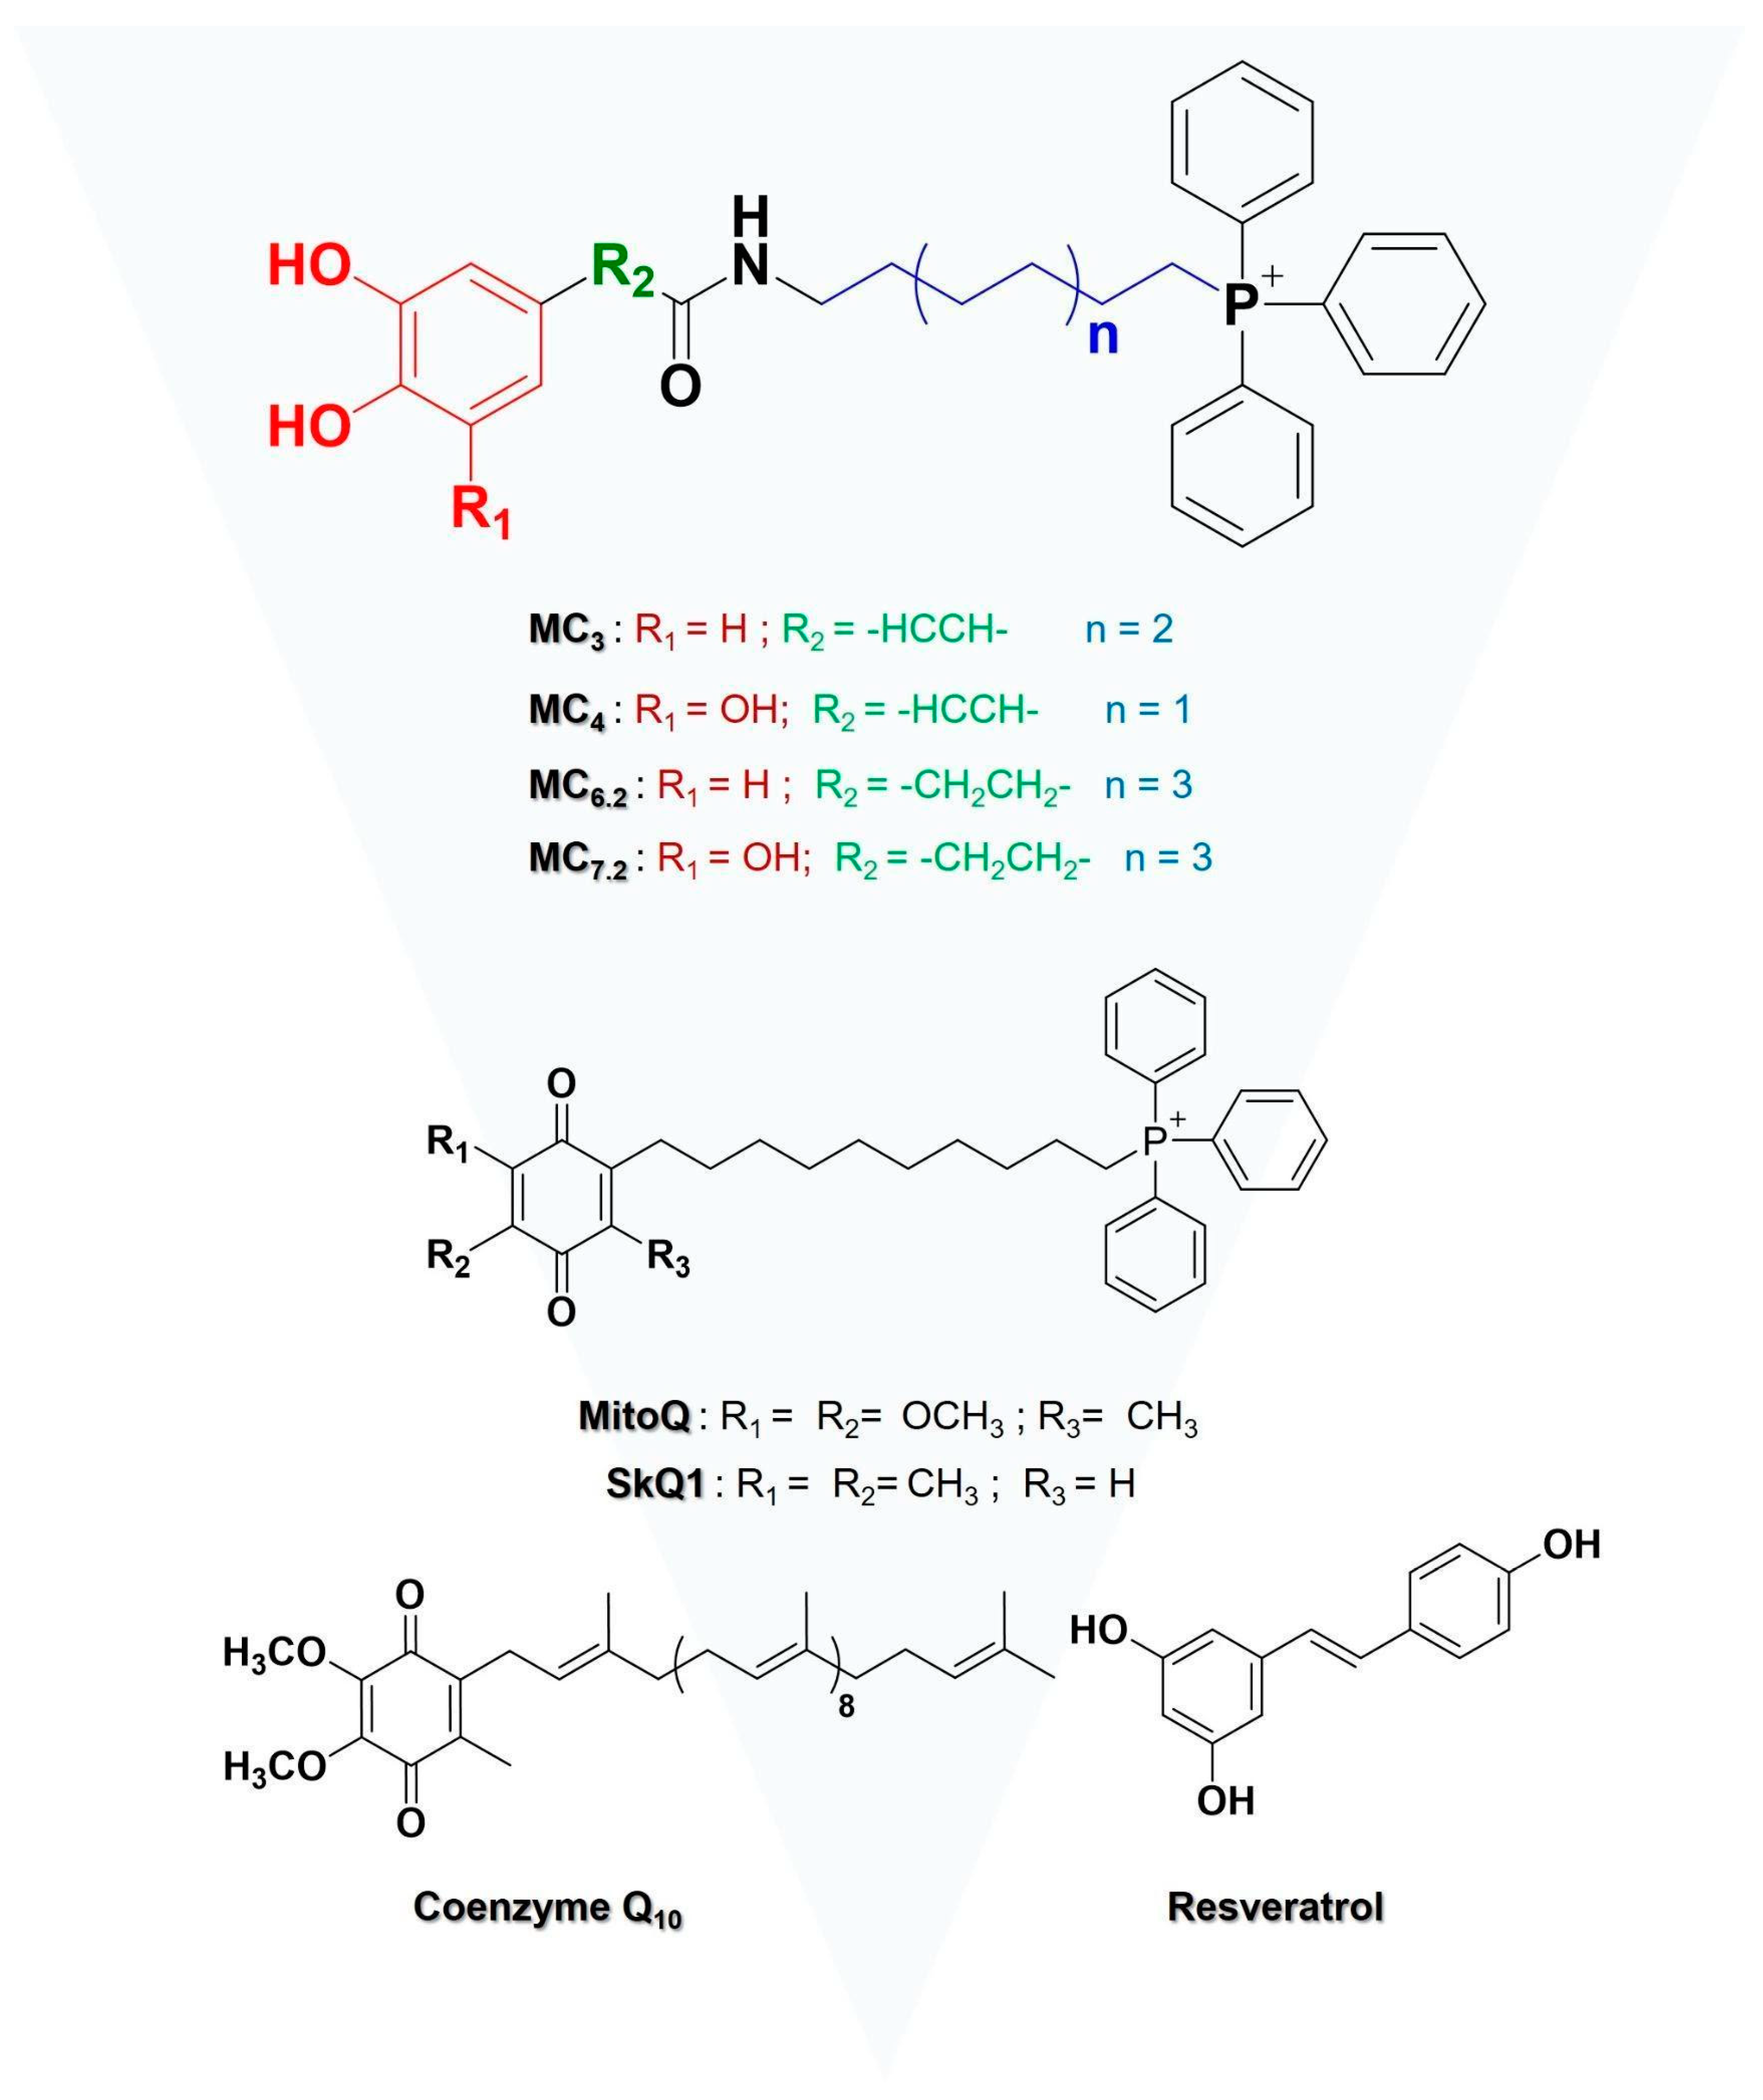
3.1. Chemistry
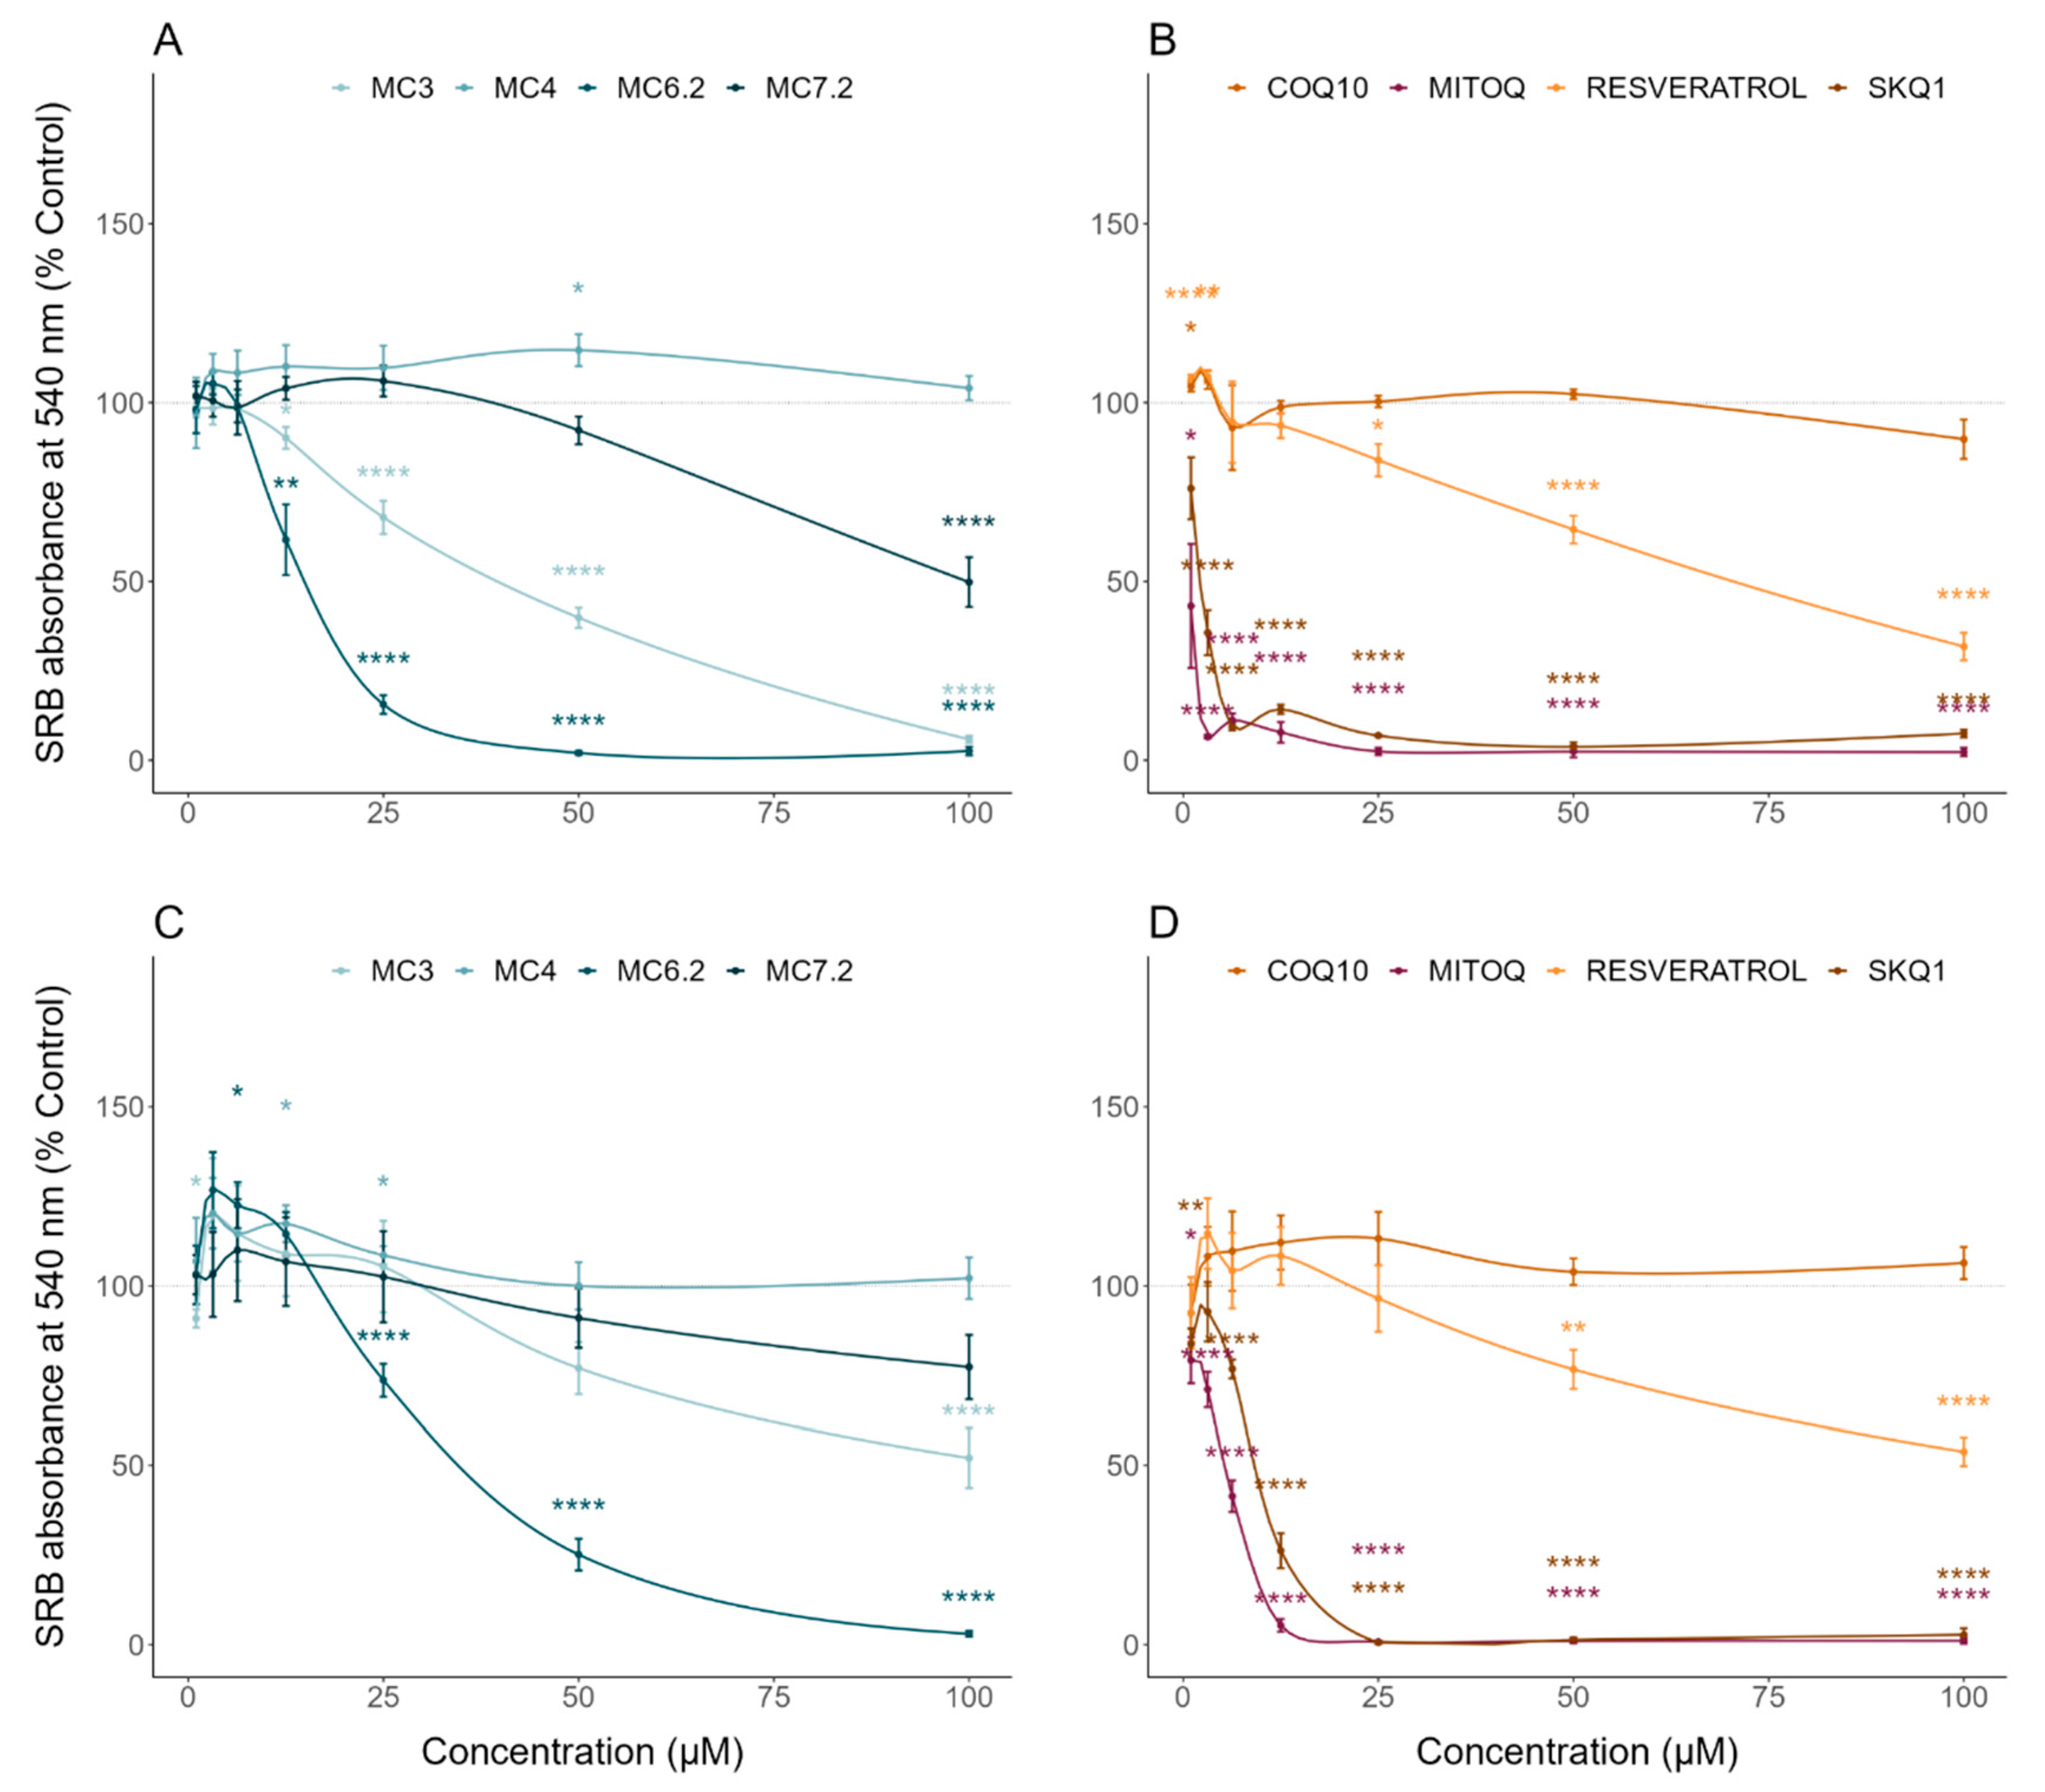
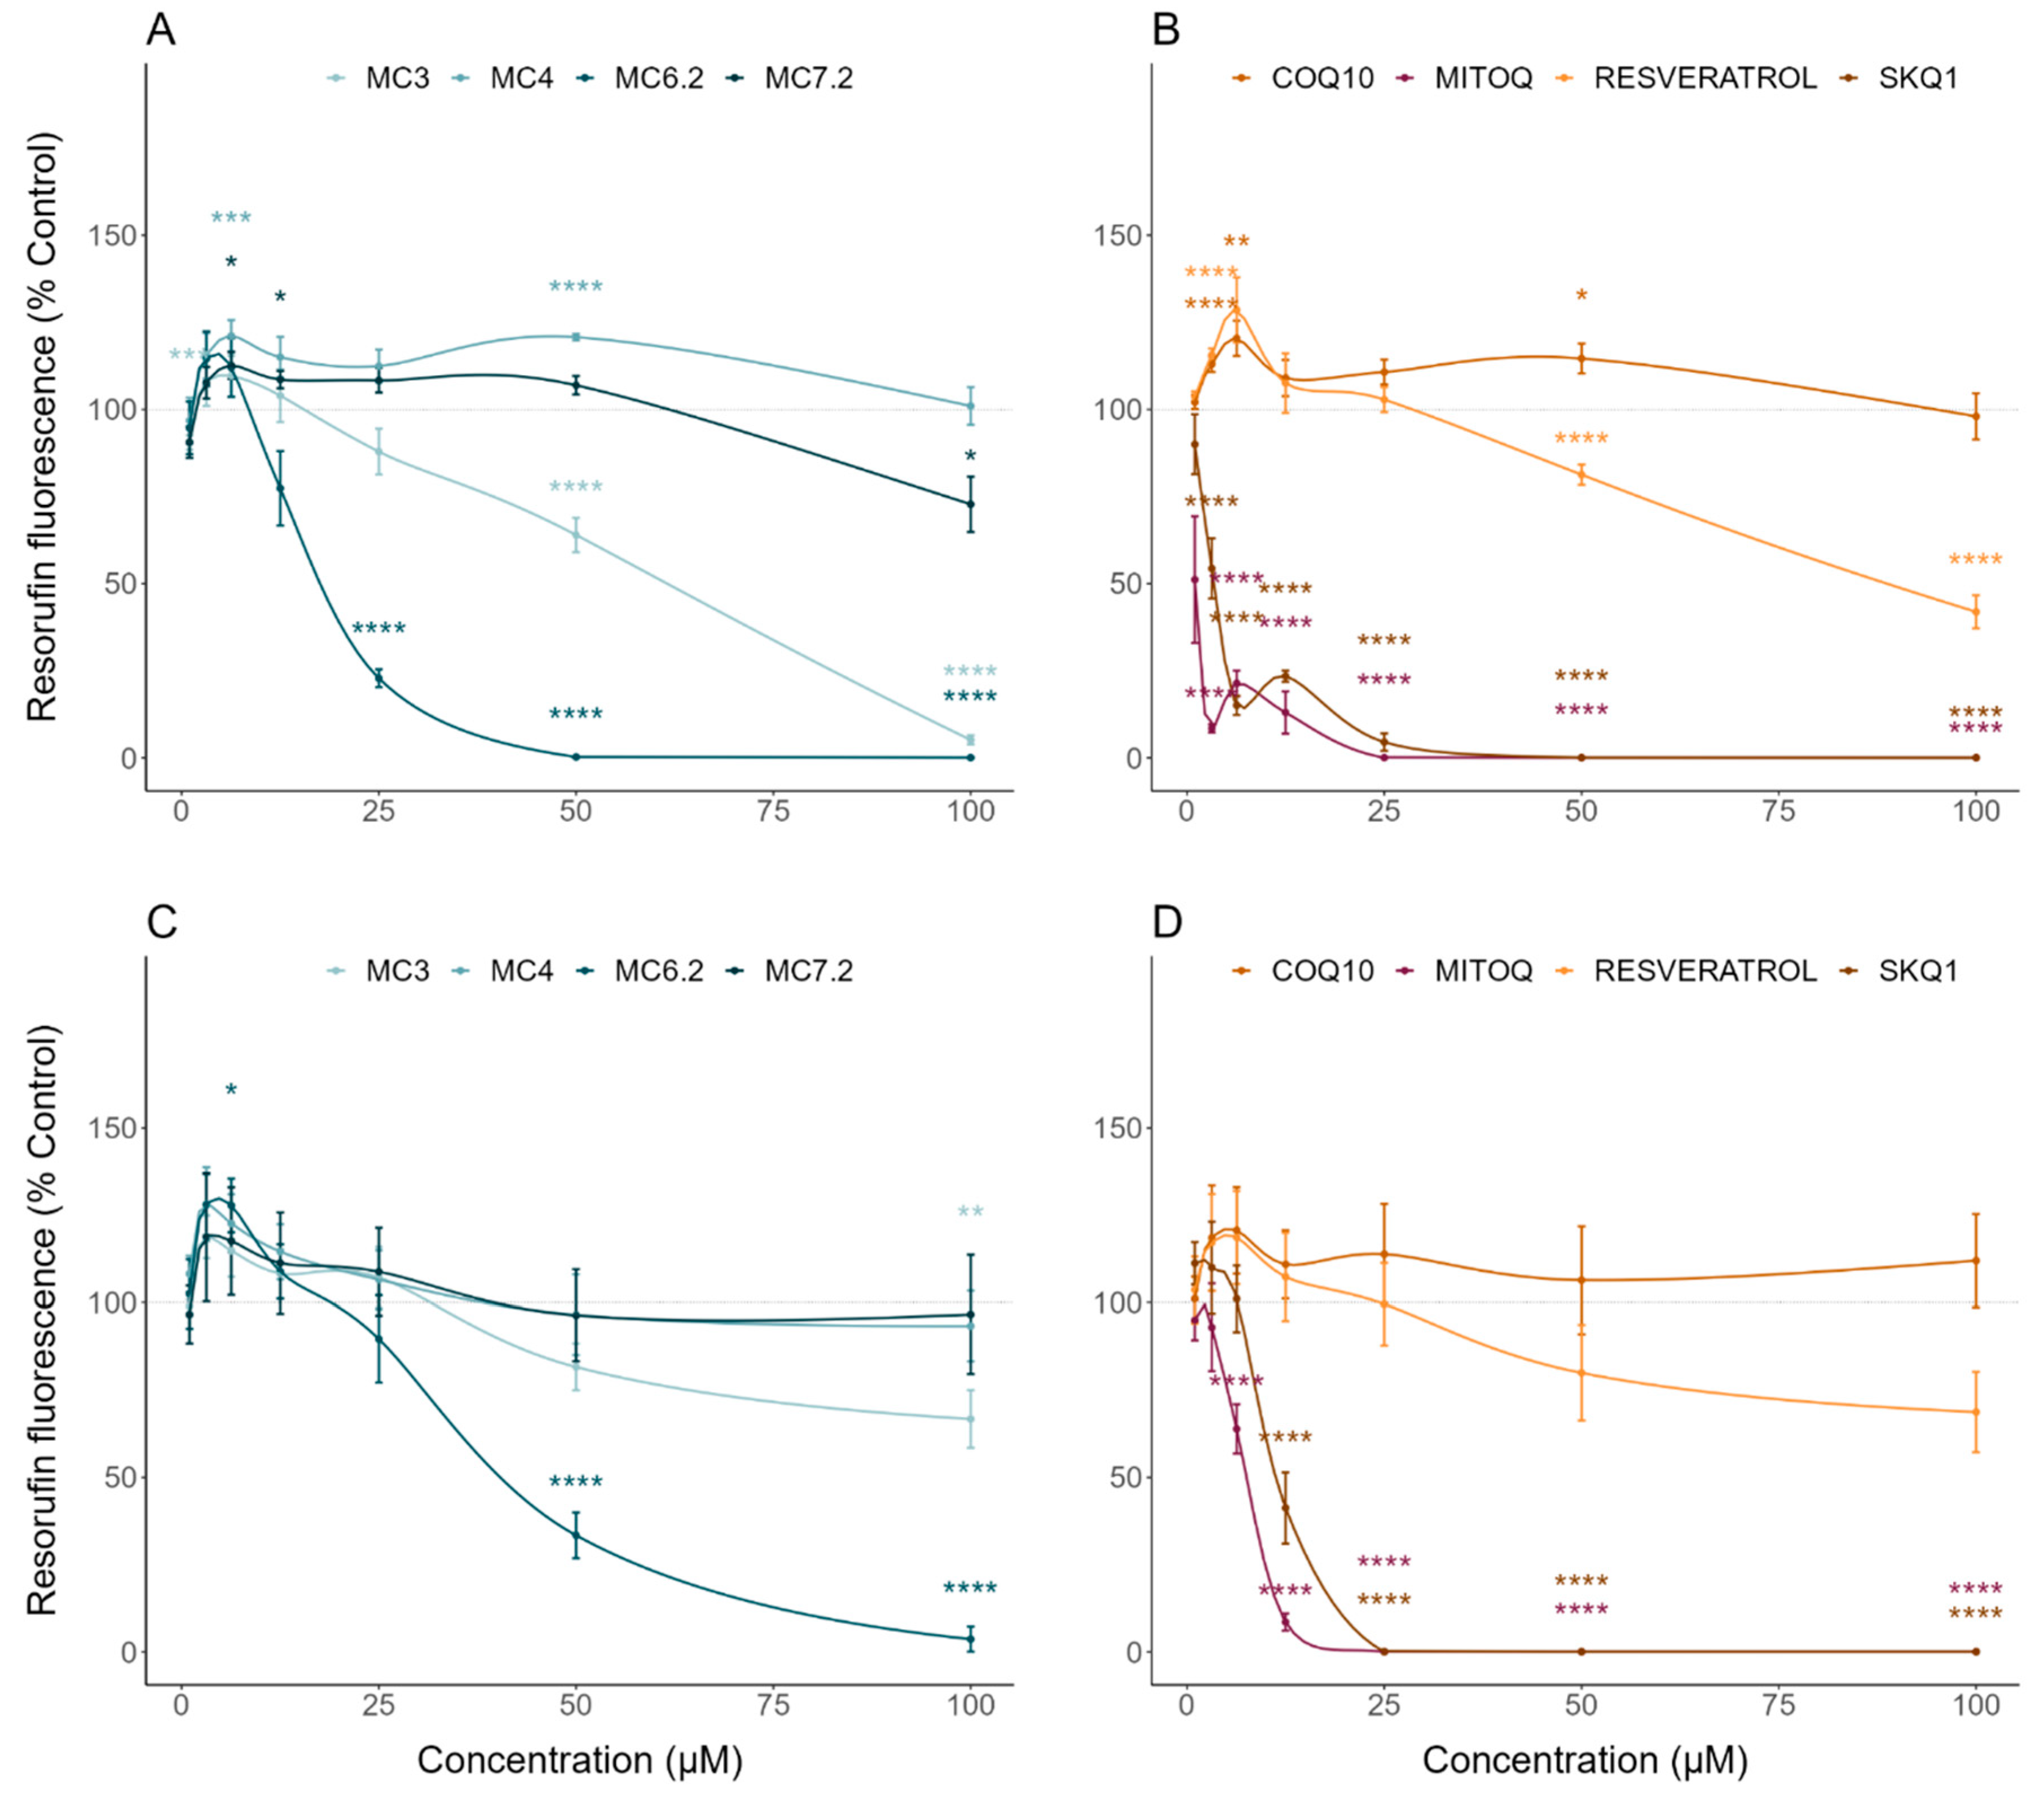
3.2. Comparative Cytotoxicity between MitoCINs and Targeted- and Non-Targeted Antioxidants
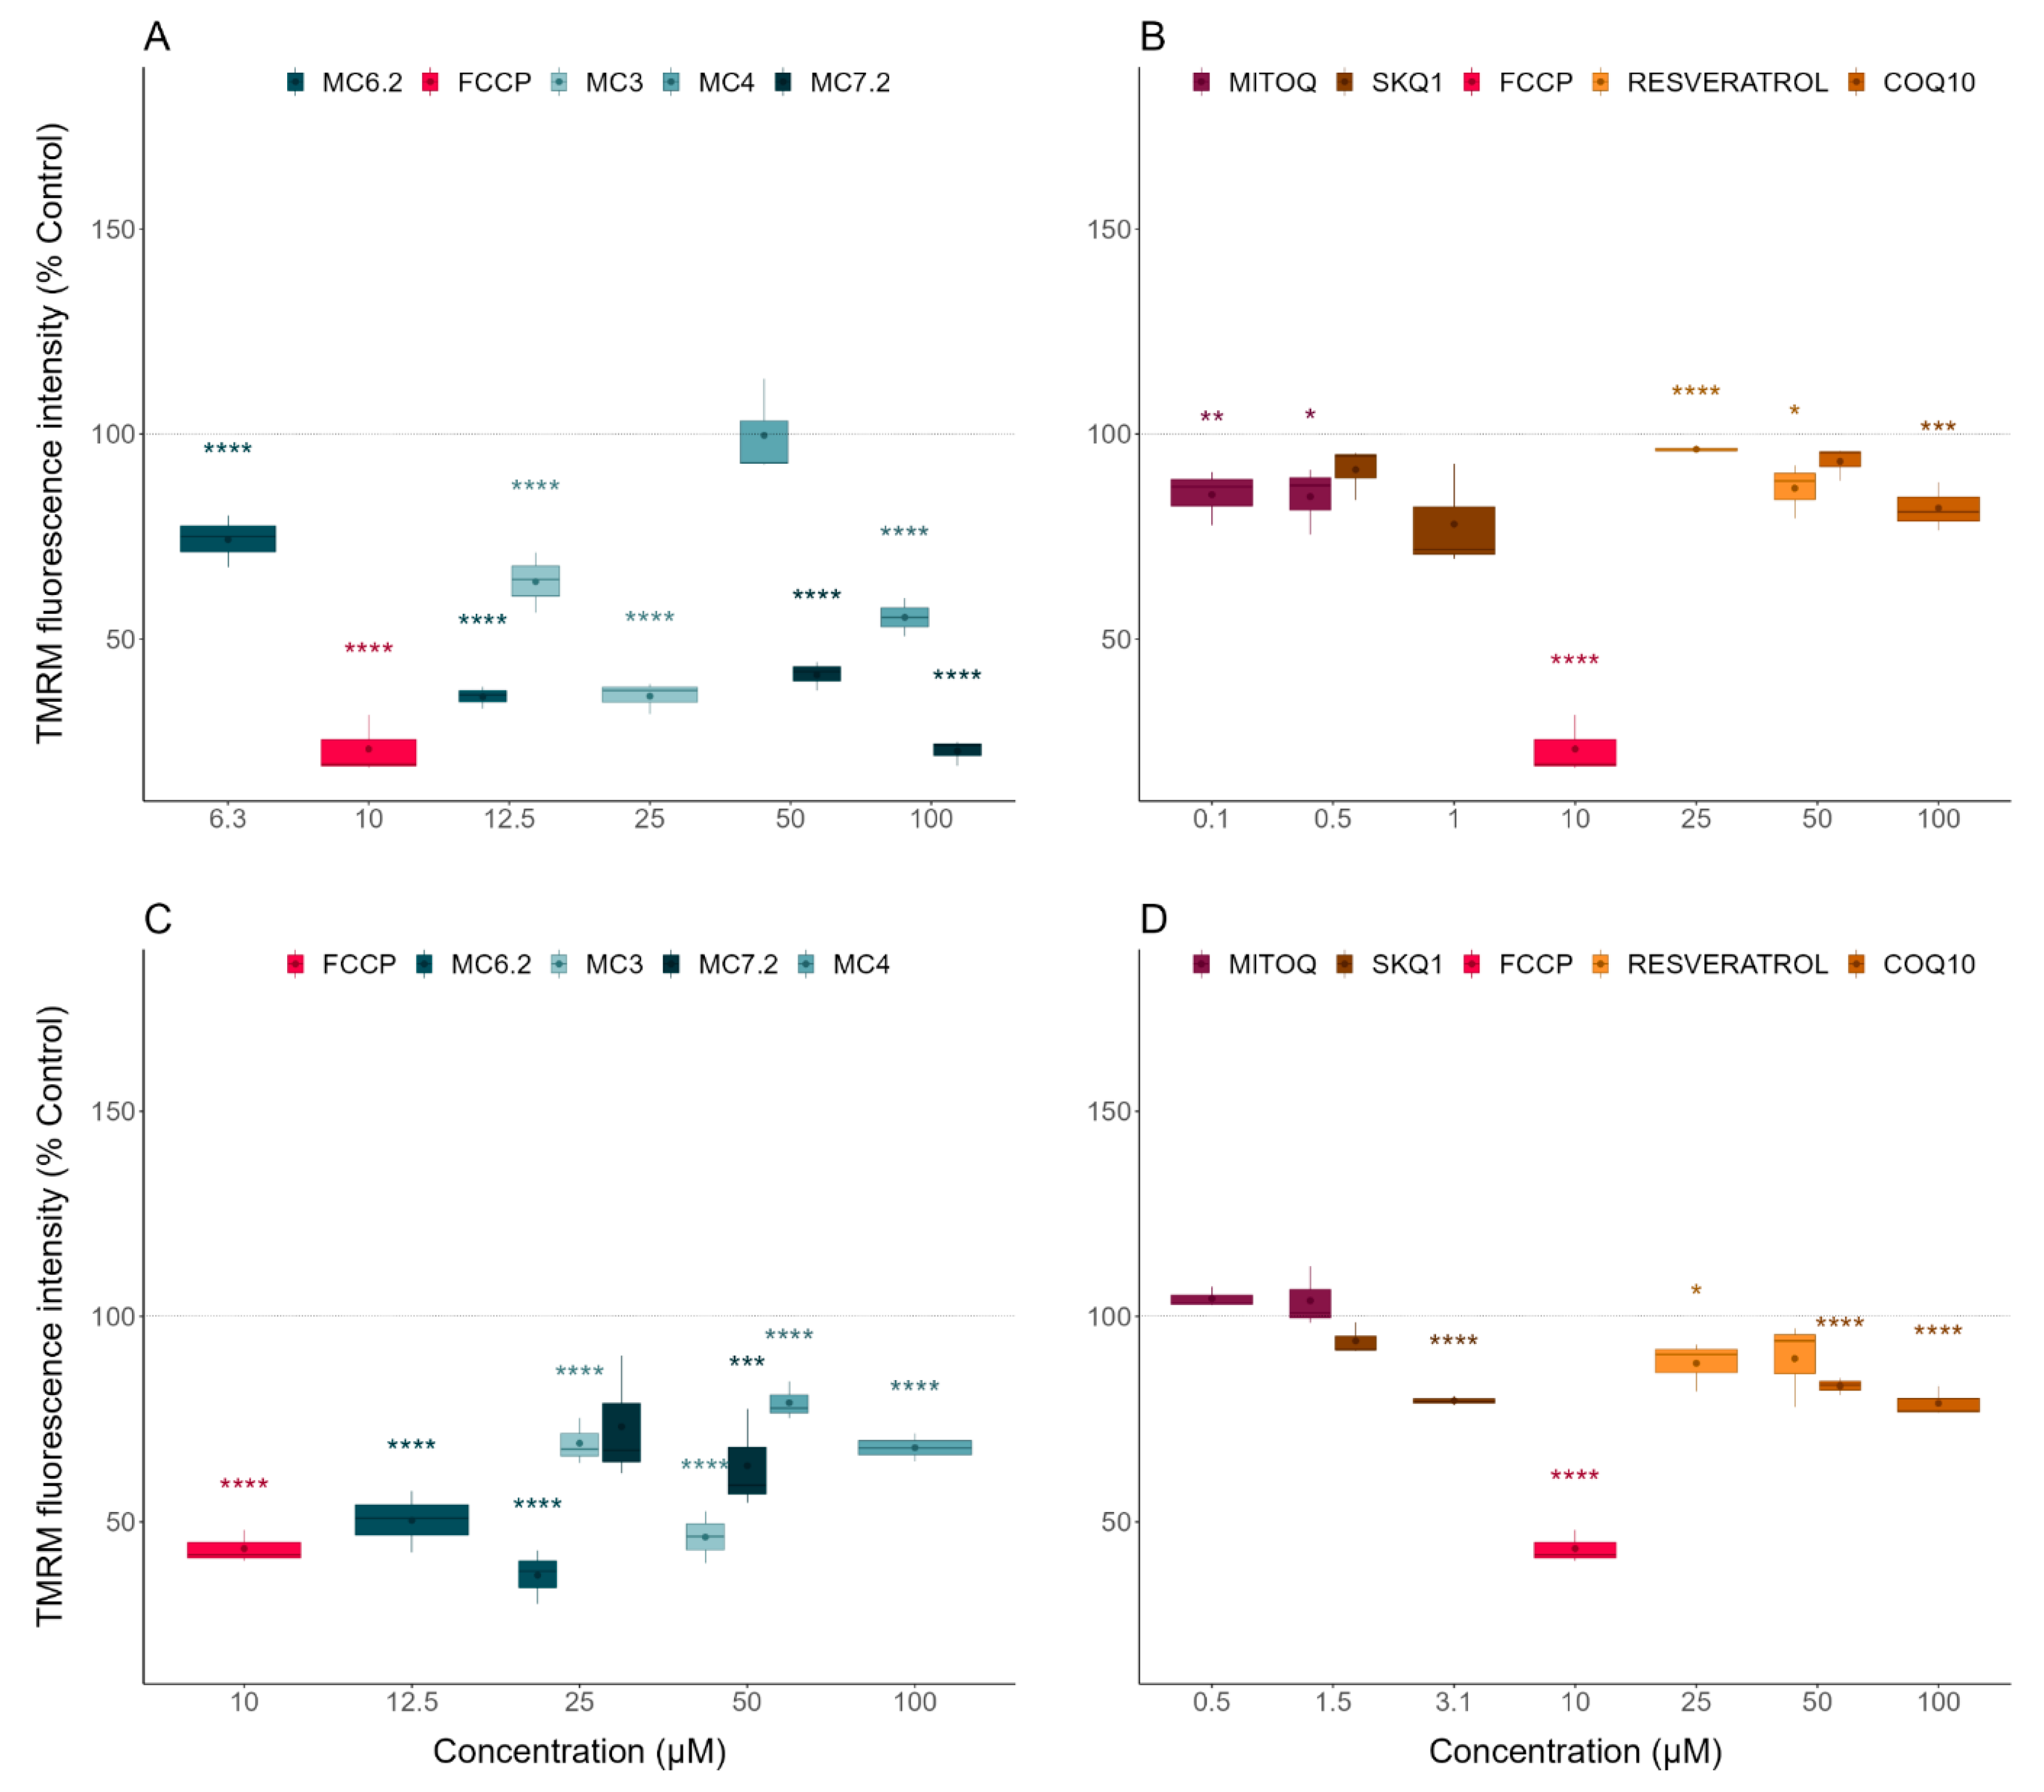
3.3. Comparative Effects of MitoCINs and Targeted- and Non-Targeted Antioxidants on Mitochondrial Membrane Potential and Cellular OCR/ECAR
3.3.1. Alterations in Mitochondrial Membrane Potential
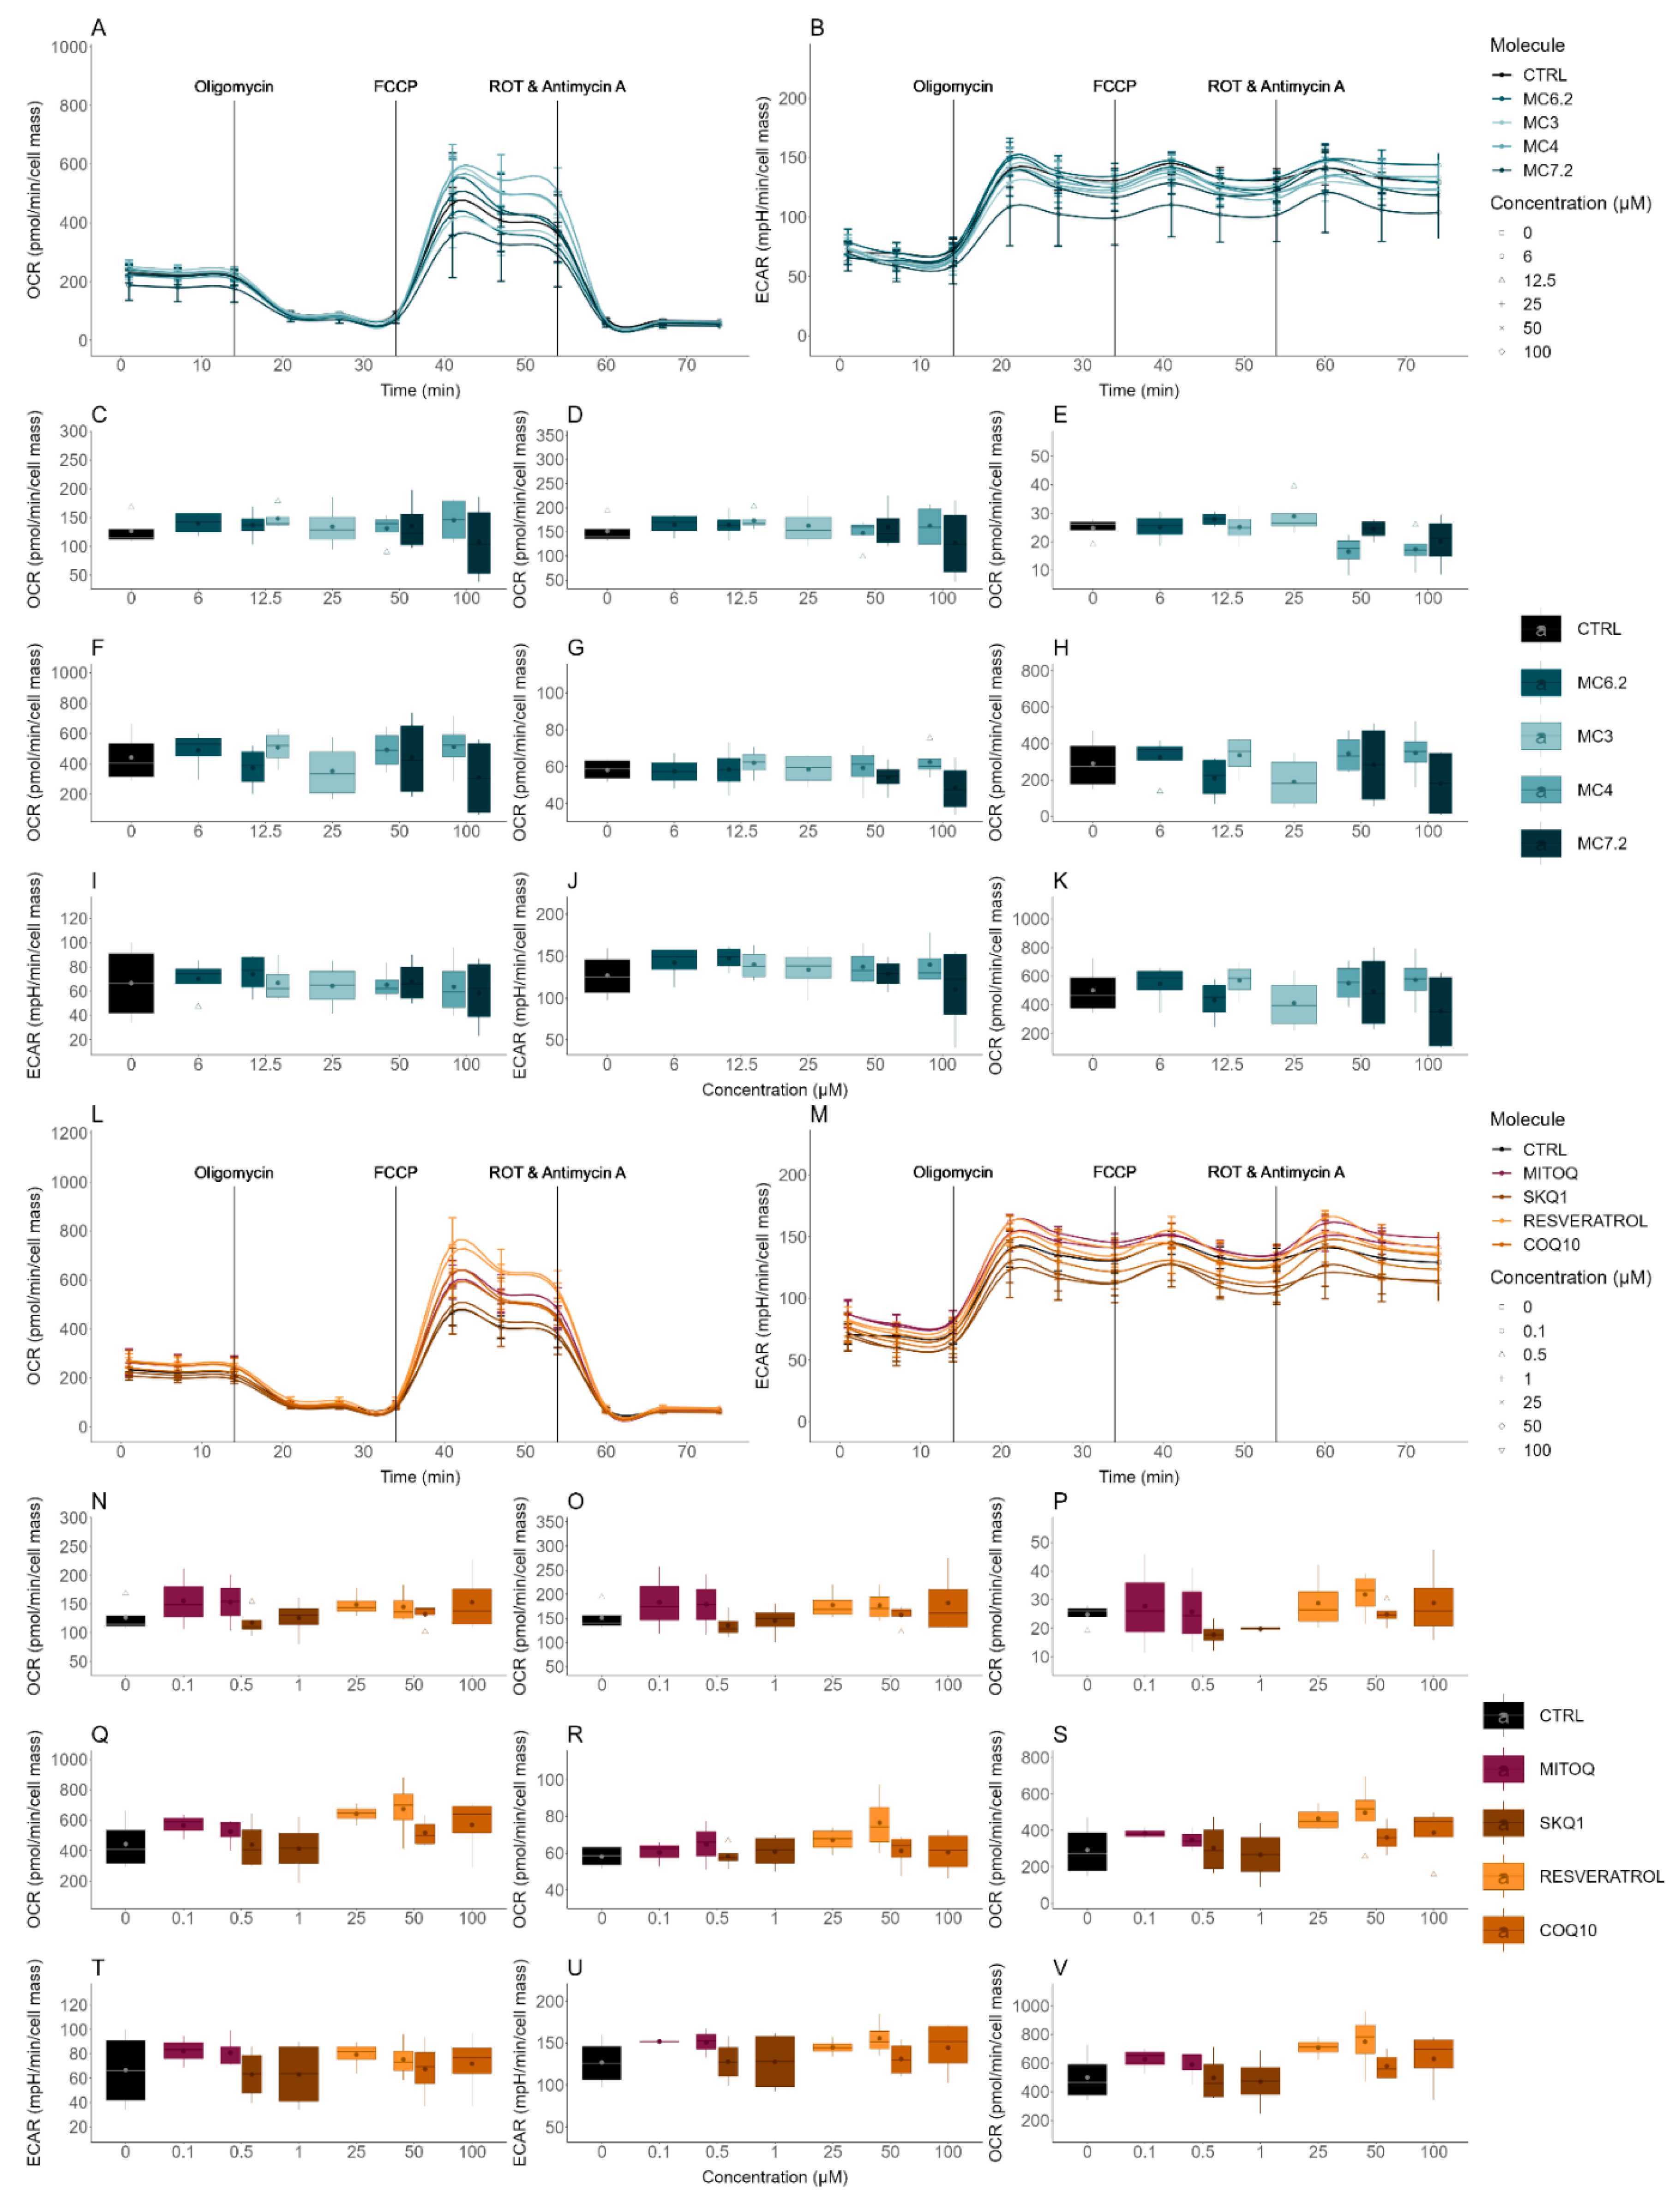
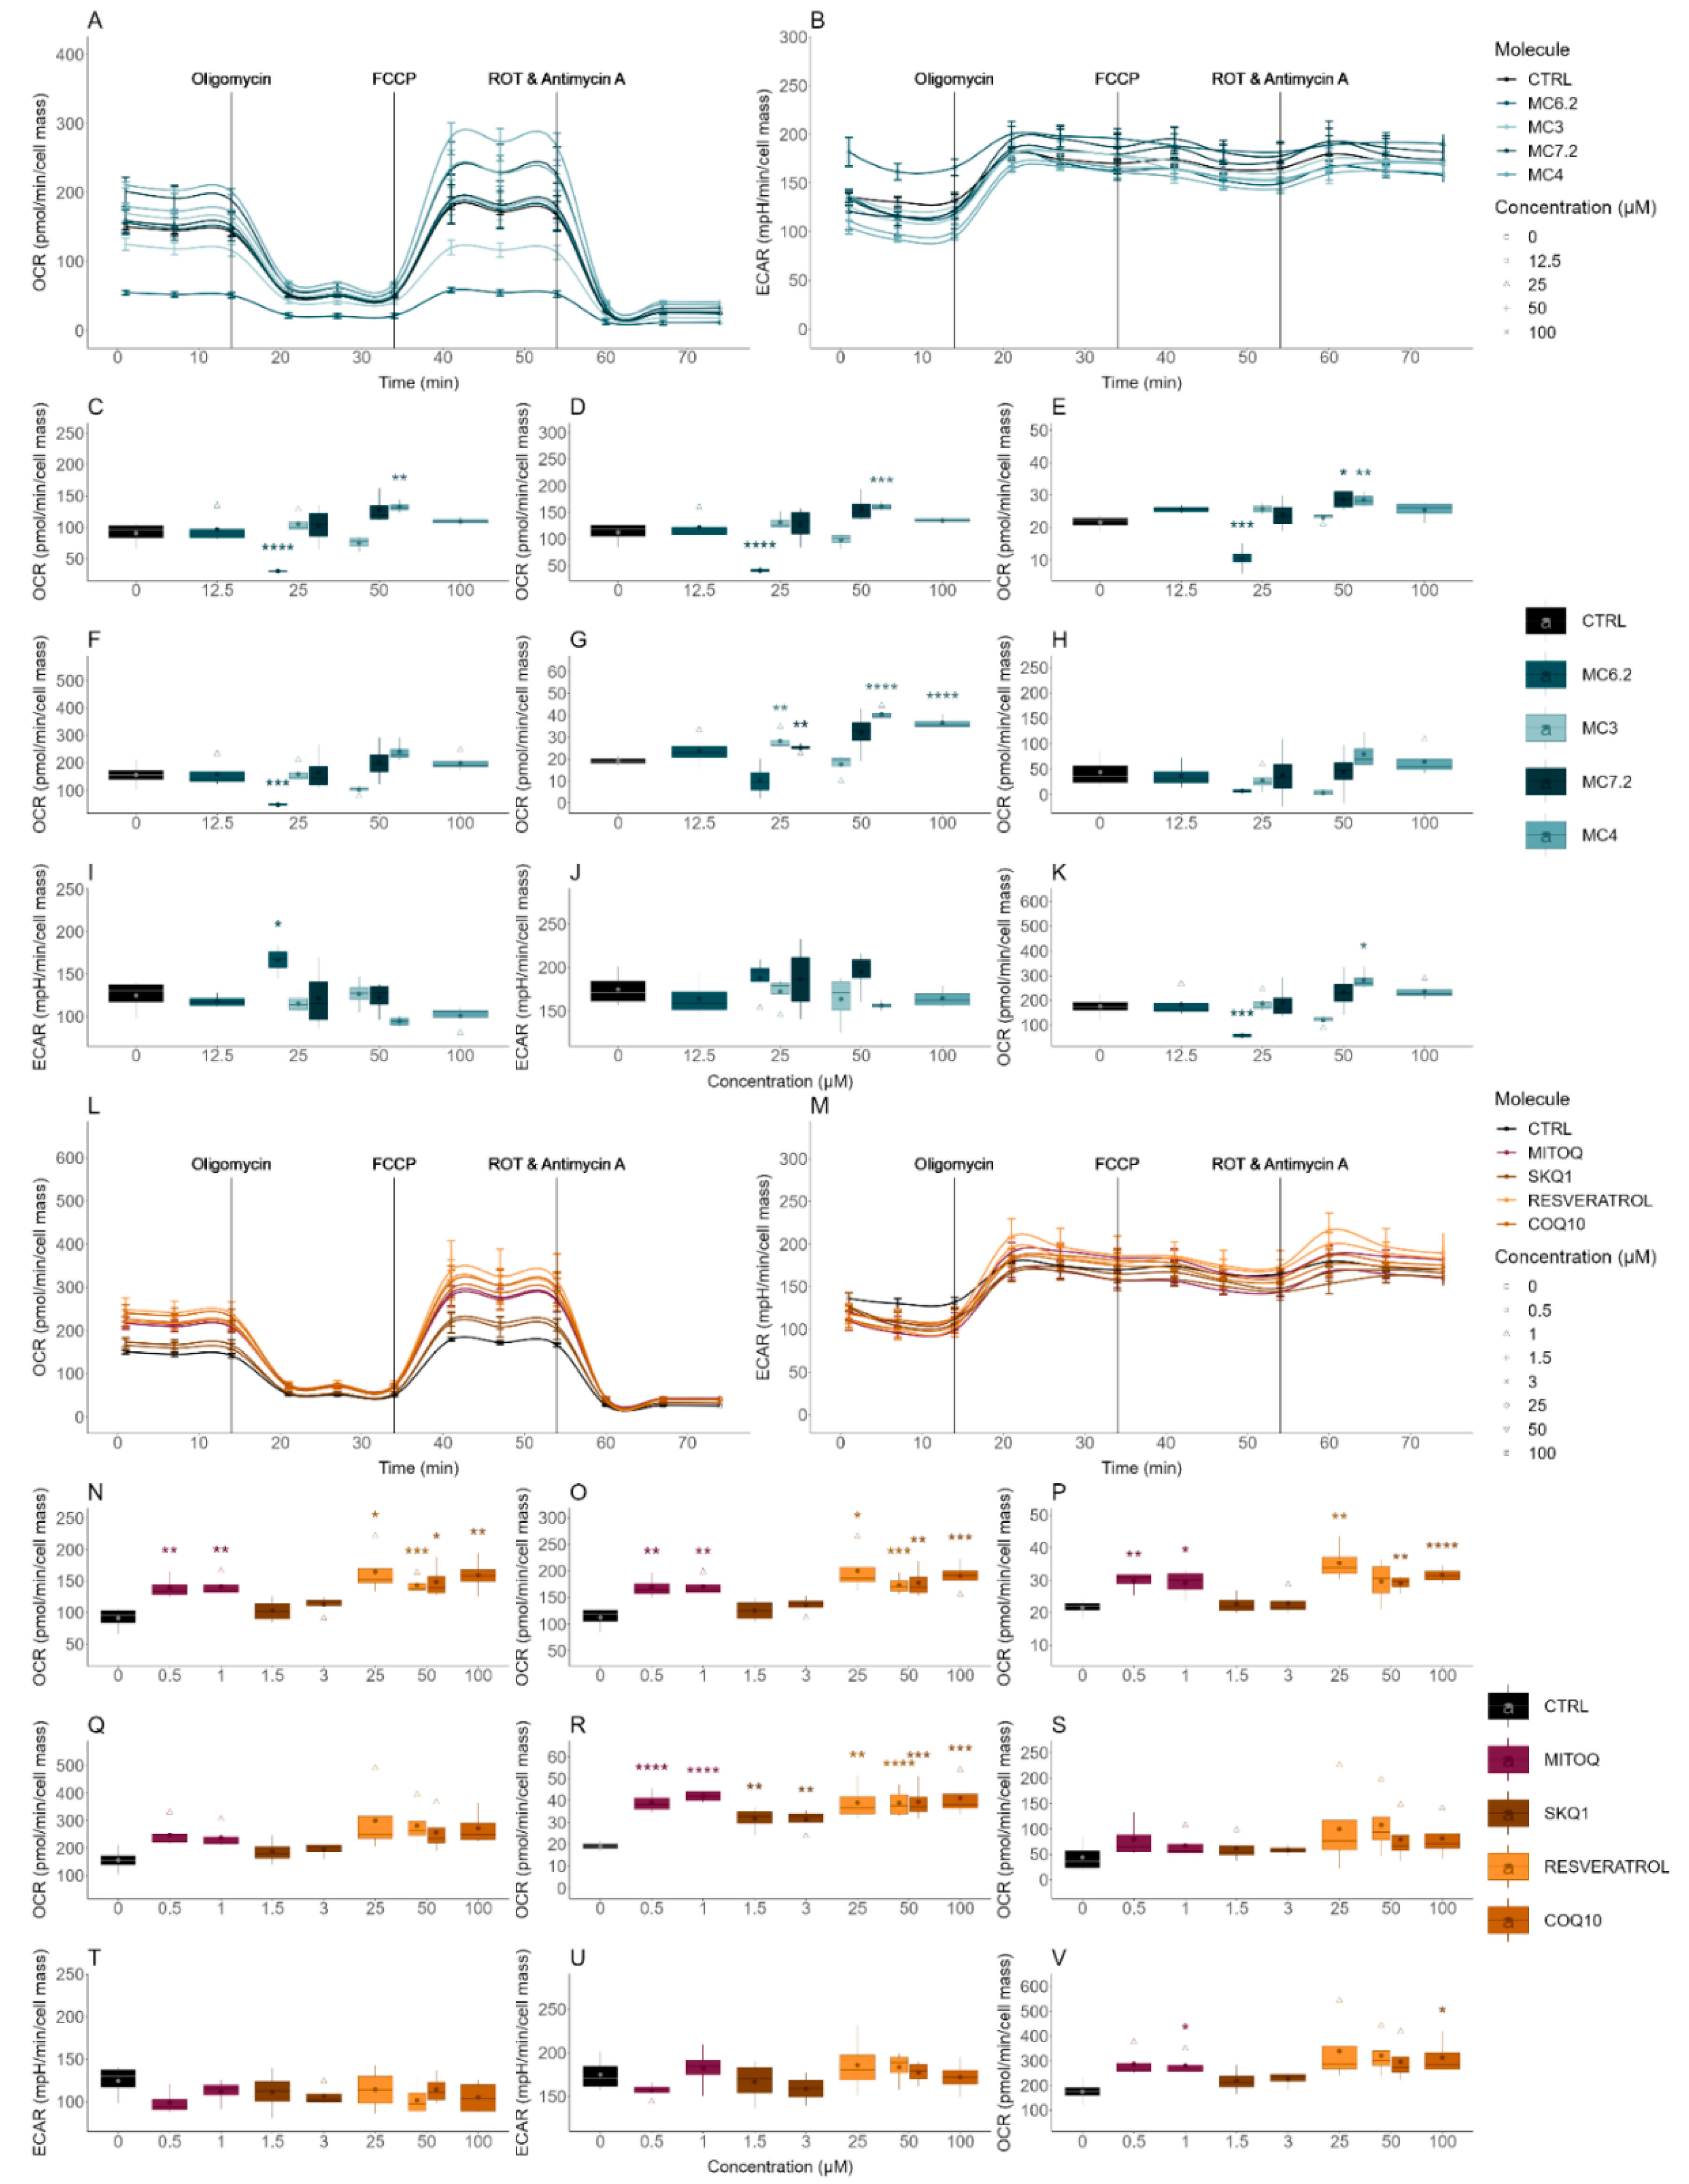
3.3.2. Alterations in Cellular OCR and ECAR
4. Discussion
Supplementary Materials
Author Contributions
Funding
Institutional Review Board Statement
Informed Consent Statement
Data Availability Statement
Acknowledgments
Conflicts of Interest
Abbreviations
| AA | Antimycin A |
| ANOVA | Analysis of Variance |
| ATP | Adenosine Triphosphate |
| BBB | Blood-Brain Barrier |
| DMEM | Dulbecco’s Modified Eagle Medium |
| DMSO | Dimethyl Sulfoxide |
| ECAR | Extracellular Acidification Rate |
| FBS | Fetal Bovine Serum |
| FCCP | Carbonyl cyanide 4-(trifluoromethoxy)phenylhydrazone |
| FDA | Food and Drug Administration |
| GSH | Glutathione |
| HCA | Hydroxycinnamic Acid |
| HPPA | Hydroxyphenylpropanoic acid |
| HEPES | 2-[4-(2-hydroxyethyl)piperazin-1-yl]ethanesulfonic acid |
| IQR | Interquartile Range |
| OCR | Oxygen Consumption Rate |
| OS | Oxidative Stress |
| OXPHOS | Oxidative Phosphorylation |
| PPh3 | Triphenylphosphine |
| RA | Retinoic Acid |
| ROS | Reactive Oxygen Species |
| ROT | Rotenone |
| SRB | Sulforhodamine B |
| TMRM | Tetramethylrhodamine methyl ester perchlorate |
| TPA | 12-O-tetradecanoylphorbol-13-acetate |
| TPP+ | Triphenylphosphonium cation |
References
- Smith, R.A.; Hartley, R.; Cochemé, H.M.; Murphy, M. Mitochondrial pharmacology. Trends Pharmacol. Sci. 2012, 33, 341–352. [Google Scholar] [CrossRef] [Green Version]
- Kudryavtseva, A.V.; Krasnov, G.S.; Dmitriev, A.; Alekseev, B.Y.; Kardymon, O.; Sadritdinova, A.F.; Fedorova, M.S.; Pokrovsky, A.V.; Melnikova, N.V.; Kaprin, A.D.; et al. Mitochondrial dysfunction and oxidative stress in aging and cancer. Oncotarget 2016, 7, 44879–44905. [Google Scholar] [CrossRef] [PubMed] [Green Version]
- Bhatti, J.S.; Bhatti, G.K.; Reddy, P.H. Mitochondrial dysfunction and oxidative stress in metabolic disorders—A step towards mitochondria based therapeutic strategies. Biochim. Biophys. Acta BBA Mol. Basis Dis. 2017, 1863, 1066–1077. [Google Scholar] [CrossRef]
- Chistiakov, D.A.; Sobenin, I.A.; Revin, V.V.; Orekhov, A.N.; Bobryshev, Y.V. Mitochondrial aging and age-related dysfunction of mitochondria. BioMed Res. Int. 2014, 2014, 238463. [Google Scholar] [CrossRef] [PubMed] [Green Version]
- Battogtokh, G.; Choi, Y.S.; Kang, D.S.; Park, S.J.; Shim, M.S.; Huh, K.M.; Cho, Y.-Y.; Lee, J.Y.; Lee, H.S.; Kang, H.C. Mitochondria-targeting drug conjugates for cytotoxic, anti-oxidizing and sensing purposes: Current strategies and future perspectives. Acta Pharm. Sin. B 2018, 8, 862–880. [Google Scholar] [CrossRef]
- Tauskela, J.S. MitoQ—A mitochondria-targeted antioxidant. IDrugs Investig. Drugs J. 2007, 10, 399–412. [Google Scholar]
- Kelso, G.F.; Porteous, C.M.; Coulter, C.V.; Hughes, G.; Porteous, W.K.; Ledgerwood, E.C.; Smith, R.A.; Murphy, M.P. Selective targeting of a redox-active ubiquinone to mitochondria within cells: Antioxidant and antiapoptotic properties. J. Biol. Chem. 2001, 276, 4588–4596. [Google Scholar] [CrossRef] [Green Version]
- Antonenko, Y.N.; Avetisyan, A.V.; Bakeeva, L.E.; Chernyak, B.V.; Chertkov, V.A.; Domnina, L.V.; Ivanova, O.Y.; Izyumov, D.S.; Khailova, L.S.; Klishin, S.S.; et al. Mitochondria-targeted plastoquinone derivatives as tools to interrupt execution of the aging program. 1. Cationic plastoquinone derivatives: Synthesis and in vitro studies. Biochemistry 2008, 73, 1273–1287. [Google Scholar] [CrossRef] [PubMed]
- Cochemé, H.M.; Kelso, G.F.; James, A.M.; Ross, M.F.; Trnka, J.; Mahendiran, T.; Asin-Cayuela, J.; Blaikie, F.H.; Manas, A.-R.B.; Porteous, C.M.; et al. Mitochondrial targeting of quinones: Therapeutic implications. Mitochondrion 2007, 7, S94–S102. [Google Scholar] [CrossRef]
- Skulachev, V.P.; Anisimov, V.N.; Antonenko, Y.N.; Bakeeva, L.E.; Chernyak, B.V.; Erichev, V.P.; Filenko, O.F.; Kalinina, N.I.; Kapelko, V.I.; Kolosova, N.G.; et al. An attempt to prevent senescence: A mitochondrial approach. Biochim. Biophys. Acta BBA Bioenerg. 2009, 1787, 437–461. [Google Scholar] [CrossRef] [PubMed] [Green Version]
- Gottwald, E.M.; Duss, M.; Bugarski, M.; Haenni, D.; Schuh, C.D.; Landau, E.M.; Hall, A.M. The targeted anti-oxidant MitoQ causes mitochondrial swelling and depolarization in kidney tissue. Physiol. Rep. 2018, 6, e13667. [Google Scholar] [CrossRef] [PubMed]
- James, A.M.; Cochemé, H.M.; Smith, R.A.J.; Murphy, M. Interactions of mitochondria-targeted and untargeted ubiquinones with the mitochondrial respiratory chain and reactive oxygen species. J. Biol. Chem. 2005, 280, 21295–21312. [Google Scholar] [CrossRef] [PubMed] [Green Version]
- Doughan, A.K.; Dikalov, S.I. Mitochondrial redox cycling of mitoquinone leads to superoxide production and cellular apoptosis. Antioxid. Redox Signal. 2007, 9, 1825–1836. [Google Scholar] [CrossRef]
- Snow, B.J.; Rolfe, F.L.; Lockhart, M.M.; Frampton, C.M.; O′Sullivan, J.D.; Fung, V.; Smith, R.A.; Murphy, M.P.; Taylor, K.M. A double-blind, placebo-controlled study to assess the mitochondria-targeted antioxidant MitoQ as a disease-modifying therapy in Parkinson’s disease. Mov. Disord. 2010, 25, 1670–1674. [Google Scholar] [CrossRef]
- Sandoval-Acuña, C.; Ferreira, J.; Speisky, H. Polyphenols and mitochondria: An update on their increasingly emerging ROS-scavenging independent actions. Arch. Biochem. Biophys. 2014, 559, 75–90. [Google Scholar] [CrossRef]
- Fernandes, C.; Pinto, M.; Martins, C.; Gomes, M.J.; Sarmento, B.; Oliveira, P.J.; Remião, F.; Borges, F.M. Development of a PEGylated-based platform for efficient delivery of dietary antioxidants across the blood–brain barrier. Bioconjug. Chem. 2018, 29, 1677–1689. [Google Scholar] [CrossRef]
- Crozier, A.; Jaganath, I.B.; Clifford, M.N. Dietary phenolics: Chemistry, bioavailability and effects on health. Nat. Prod. Rep. 2009, 26, 1001–1043. [Google Scholar] [CrossRef]
- Singh, M.; Arseneault, M.; Sanderson, T.; Murthy, V.; Ramassamy, C. Challenges for research on polyphenols from foods in Alzheimer′s disease: Bioavailability, metabolism, and cellular and molecular mechanisms. J. Agric. Food Chem. 2008, 56, 4855–4873. [Google Scholar] [CrossRef]
- Gao, S.; Hu, M. Bioavailability challenges associated with development of anti-cancer phenolics. Mini Rev. Med. Chem. 2010, 10, 550–567. [Google Scholar] [CrossRef] [Green Version]
- Boveris, A.; Chance, B. The mitochondrial generation of hydrogen peroxide. General properties and effect of hyperbaric oxygen. Biochem. J. 1973, 134, 707–716. [Google Scholar] [CrossRef] [PubMed]
- Turrens, J.F. Mitochondrial formation of reactive oxygen species. J. Physiol. 2003, 552, 335–344. [Google Scholar] [CrossRef]
- Murphy, M.P. How mitochondria produce reactive oxygen species. Biochem. J. 2009, 417, 1–13. [Google Scholar] [CrossRef] [PubMed] [Green Version]
- Teixeira, J.; Cagide, F.; Benfeito, S.; Soares, P.; Garrido, J.; Baldeiras, I.; Ribeiro, J.A.; Pereira, C.M.; Silva, A.F.; Andrade, P.B.; et al. Development of a mitochondriotropic antioxidant based on caffeic acid: Proof of concept on cellular and mitochondrial oxidative stress models. J. Med. Chem. 2017, 60, 7084–7098. [Google Scholar] [CrossRef] [PubMed]
- Teixeira, J.C.S.; Soares, P.; Benfeito, S.; Gaspar, A.; Garrido, J.; Murphy, M.P.; Borges, F. Rational discovery and development of a mitochondria-targeted antioxidant based on cinnamic acid scaffold. Free Radic. Res. 2012, 46, 600–611. [Google Scholar] [CrossRef]
- Benfeito, S.; Oliveira, C.; Fernandes, C.; Cagide, F.; Teixeira, J.; Amorim, R.; Garrido, J.; Martins, C.; Sarmento, B.; Silva, R.; et al. Fine-tuning the neuroprotective and blood-brain barrier permeability profile of multi-target agents designed to prevent progressive mitochondrial dysfunction. Eur. J. Med. Chem. 2019, 167, 525–545. [Google Scholar] [CrossRef] [PubMed]
- Hernández-Camacho, J.D.; Bernier, M.; López-Lluch, G.; Navas, P. Coenzyme Q10 supplementation in aging and disease. Front. Physiol. 2018, 9, 44. [Google Scholar] [CrossRef] [Green Version]
- Forman, H.J.; Zhang, H. Targeting oxidative stress in disease: Promise and limitations of antioxidant therapy. Nat. Rev. Drug Discov. 2021, 20, 689–709. [Google Scholar] [CrossRef] [PubMed]
- Cvenkel, B.; Kolko, M. Current medical therapy and future trends in the management of glaucoma treatment. J. Ophthalmol. 2020, 2020, 6138132. [Google Scholar] [CrossRef]
- Navarro-Cruz, A.R.; Ayala, R.R.Y.; Ochoa-Velasco, C.; Brambila, E.; Avila-Sosa, R.; Pérez-Fernández, S.; Morales-Medina, J.C.; Aguilar-Alonso, P. Effect of chronic administration of resveratrol on cognitive performance during aging process in rats. Oxid. Med. Cell. Longev. 2017, 2017, 8510761. [Google Scholar] [CrossRef] [Green Version]
- Li, Y.-R.; Li, S.; Lin, C.-C. Effect of resveratrol and pterostilbene on aging and longevity. BioFactors 2018, 44, 69–82. [Google Scholar] [CrossRef]
- Sawda, C.; Moussa, C.; Turner, R.S. Resveratrol for Alzheimer′s disease. Ann. N. Y. Acad. Sci. 2017, 1403, 142–149. [Google Scholar] [CrossRef] [PubMed]
- Albani, D.; Polito, L.; Forloni, G. Sirtuins as novel targets for Alzheimer′s disease and other neurodegenerative disorders: Experimental and genetic evidence. J. Alzheimer Dis. 2010, 19, 11–26. [Google Scholar] [CrossRef]
- Anekonda, T.S. Resveratrol—A boon for treating Alzheimer′s disease? Brain Res. Rev. 2006, 52, 316–326. [Google Scholar] [CrossRef]
- Gräff, J.; Kahn, M.; Samiei, A.; Gao, J.; Ota, K.T.; Rei, D.; Tsai, L.-H. A dietary regimen of caloric restriction or pharmacological activation of SIRT1 to delay the onset of neurodegeneration. J. Neurosci. 2013, 33, 8951–8960. [Google Scholar] [CrossRef] [PubMed] [Green Version]
- Giorgi, C.; Marchi, S.; Simoes, I.C.; Ren, Z.; Morciano, G.; Perrone, M.; Patalas-Krawczyk, P.; Borchard, S.; Jędrak, P.; Pierzynowska, K.; et al. Mitochondria and reactive oxygen species in aging and age-related diseases. Int. Rev. Cell Mol. Biol. 2018, 340, 209–344. [Google Scholar] [CrossRef] [Green Version]
- Christensen, E.R.; Stegger, M.; Jensen-Fangel, S.; Laursen, A.L.; Ostergaard, L. Mitochondrial DNA levels in fat and blood cells from patients with lipodystrophy or peripheral neuropathy and the effect of 90 days of high-dose coenzyme Q treatment: A randomized, double-blind, placebo-controlled pilot study. Clin. Infect. Dis. 2004, 39, 1371–1379. [Google Scholar] [CrossRef]
- McGarry, A.; McDermott, M.; Kieburtz, K.; De Blieck, E.A.; Beal, F.; Marder, K.; Ross, C.; Shoulson, I.; Gilbert, P.; Mallonee, W.M.; et al. A randomized, double-blind, placebo-controlled trial of coenzyme Q10 in Huntington disease. Neurology 2017, 88, 152–159. [Google Scholar] [CrossRef] [Green Version]
- Liu, J.; Wang, L.-N. Mitochondrial enhancement for neurodegenerative movement disorders: A systematic review of trials involving creatine, coenzyme Q10, idebenone and mitoquinone. CNS Drugs 2013, 28, 63–68. [Google Scholar] [CrossRef]
- Jakubczyk, K.; Skonieczna-Żydecka, K.; Kałduńska, J.; Stachowska, E.; Gutowska, I.; Janda, K. Effects of resveratrol supplementation in patients with non-alcoholic fatty liver disease—A meta-analysis. Nutrients 2020, 12, 2435. [Google Scholar] [CrossRef]
- De Ligt, M.; Bergman, M.; Fuentes, R.M.; Essers, H.; Moonen-Kornips, E.; Havekes, B.; Schrauwen-Hinderling, V.B.; Schrauwen, P. No effect of resveratrol supplementation after 6 months on insulin sensitivity in overweight adults: A randomized trial. Am. J. Clin. Nutr. 2020, 112, 1029–1038. [Google Scholar] [CrossRef] [PubMed]
- Presgraves, S.P.; Ahmed, T.; Borwege, S.; Joyce, J.N. Terminally differentiated SH-SY5Y cells provide a model system for studying neuroprotective effects of dopamine agonists. Neurotox. Res. 2003, 5, 579–598. [Google Scholar] [CrossRef] [PubMed]
- Clothier, R.; Gómez-Lechón, M.; Kinsner-Ovaskainen, A.; Kopp-Schneider, A.; O′Connor, J.; Prieto, P.; Stanzel, S. Comparative analysis of eight cytotoxicity assays evaluated within the ACuteTox project. Toxicol. Vitr. 2013, 27, 1347–1356. [Google Scholar] [CrossRef]
- Kizhedath, A.; Wilkinson, S.; Glassey, J. Assessment of hepatotoxicity and dermal toxicity of butyl paraben and methyl paraben using HepG2 and HDFn in vitro models. Toxicol. Vitr. 2019, 55, 108–115. [Google Scholar] [CrossRef] [PubMed]
- Donato, M.; Tolosa, L.; Gómez-Lechón, M.J. Culture and functional characterization of human hepatoma HepG2 cells. In Protocols in In Vitro Hepatocyte Research; Springer Science and Business Media LLC: Berlin/Heidelberg, Germany, 2014; Volume 1250, pp. 77–93. [Google Scholar]
- Khailova, L.S.; Nazarov, P.A.; Sumbatyan, N.; Korshunova, G.A.; Rokitskaya, T.; Dedukhova, V.I.; Antonenko, Y.N.; Skulachev, V. Uncoupling and toxic action of alkyltriphenylphosphonium cations on mitochondria and the bacterium Bacillus subtilis as a function of alkyl chain length. Biochemistry 2015, 80, 1589–1597. [Google Scholar] [CrossRef]
- Korshunova, G.A.; Shishkina, A.V.; Skulachev, M.V. Design, synthesis, and some aspects of the biological activity of mitochondria-targeted antioxidants. Biochemistry 2017, 82, 760–777. [Google Scholar] [CrossRef]
- Barbosa, D.J.; Capela, J.P.; Silva, R.; Vilas-Boas, V.; Ferreira, L.; Branco, P.; Fernandes, E.; Bastos, M.D.L.; Carvalho, F. The mixture of “ecstasy” and its metabolites is toxic to human SH-SY5Y differentiated cells at in vivo relevant concentrations. Arch. Toxicol. 2013, 88, 455–473. [Google Scholar] [CrossRef]
- Silva, F.S.; Starostina, I.G.; Ivanova, V.V.; Rizvanov, A.A.; Oliveira, P.J.; Pereira, S.P. Determination of metabolic viability and cell mass using a tandem resazurin/sulforhodamine B assay. Curr. Protoc. Toxicol. 2016, 68, 2–24. [Google Scholar] [CrossRef]
- Creed, S.; McKenzie, M. Measurement of mitochondrial membrane potential with the fluorescent dye tetramethylrhodamine methyl ester (TMRM). Methods Mol. Biol. 2019, 1928, 69–76. [Google Scholar] [CrossRef] [PubMed]
- Murphy, M.P. Targeting lipophilic cations to mitochondria. Biochim. Biophys. Acta BBA Bioenerg. 2008, 1777, 1028–1031. [Google Scholar] [CrossRef] [Green Version]
- Bond, S.T.; Kim, J.; Calkin, A.; Drew, B.G. The antioxidant moiety of MitoQ imparts minimal metabolic effects in adipose tissue of high fat fed mice. Front. Physiol. 2019, 10, 543. [Google Scholar] [CrossRef]
- Bolton, J.L.; Dunlap, T. Formation and biological targets of quinones: Cytotoxic versus cytoprotective effects. Chem. Res. Toxicol. 2017, 30, 13–37. [Google Scholar] [CrossRef]
- Feng, Z.; Nadikudi, M.; Woolley, K.; Hemasa, A.; Chear, S.; Smith, J.; Gueven, N. Bioactivity profiles of cytoprotective short-chain quinones. Molecules 2021, 26, 1382. [Google Scholar] [CrossRef]
- Teixeira, J.; Oliveira, C.; Amorim, R.; Cagide, F.; Garrido, J.; Ribeiro, J.A.; Pereira, C.M.; Silva, A.F.; Andrade, P.B.; Oliveira, P.J.; et al. Development of hydroxybenzoic-based platforms as a solution to deliver dietary antioxidants to mitochondria. Sci. Rep. 2017, 7, 6842. [Google Scholar] [CrossRef] [PubMed]
- Reddy, P.H.; Beal, M.F. Amyloid beta, mitochondrial dysfunction and synaptic damage: Implications for cognitive decline in aging and Alzheimer′s disease. Trends Mol. Med. 2008, 14, 45–53. [Google Scholar] [CrossRef] [Green Version]
- Reddy, P.H. Mitochondrial medicine for aging and neurodegenerative diseases. NeuroMolecular Med. 2008, 10, 291–315. [Google Scholar] [CrossRef] [Green Version]
- Sukhanova, E.I.; Trendeleva, T.A.; Zvyagilskaya, R.A. Interaction of yeast mitochondria with fatty acids and mitochondria-targeted lipophilic cations. Biochemistry 2010, 75, 139–144. [Google Scholar] [CrossRef] [PubMed]
- Trnka, J.; Elkalaf, M.; Anděl, M. Lipophilic triphenylphosphonium cations inhibit mitochondrial electron transport chain and induce mitochondrial proton leak. PLoS ONE 2015, 10, e0121837. [Google Scholar] [CrossRef] [Green Version]
- Reily, C.; Mitchell, T.; Chacko, B.K.; Benavides, G.A.; Murphy, M.P.; Darley-Usmar, V.M. Mitochondrially targeted compounds and their impact on cellular bioenergetics. Redox Biol. 2013, 1, 86–93. [Google Scholar] [CrossRef] [PubMed] [Green Version]
- Yokoyama, Y.; Sasaki, Y.; Terasaki, N.; Kawataki, T.; Takekawa, K.; Iwase, Y.; Shimizu, T.; Sanoh, S.; Ohta, S. Comparison of drug metabolism and its related hepatotoxic effects in HepaRG, cryopreserved human hepatocytes, and HepG2 cell cultures. Biol. Pharm. Bull. 2018, 41, 722–732. [Google Scholar] [CrossRef] [Green Version]
- Choi, J.M.; Oh, S.J.; Lee, S.Y.; Im, J.H.; Oh, J.M.; Ryu, C.S.; Kwak, H.C.; Lee, J.-Y.; Kang, K.W.; Kim, S.K. HepG2 cells as an in vitro model for evaluation of cytochrome P450 induction by xenobiotics. Arch. Pharm. Res. 2014, 38, 691–704. [Google Scholar] [CrossRef] [PubMed]


| Assay | Key Finding | Potency/Effect Size |
|---|---|---|
| Sulforhodamine B | Cell mass/Cytotoxicity | HepG2: MC4 < MC7.2 < MC3 < MC6.2 SH-SY5Y: MC4 ≈ MC7.2 < MC3 < MC6.2 |
| Resazurin | Cell metabolic activity/Cytotoxicity | HepG2: MC4 < MC7.2 < MC3 < MC6.2 SH-SY5Y: MC4 ≈ MC7.2 < MC3 < MC6.2 |
| Intracellular ATP levels | Cytotoxicity | HepG2: MC4 = MC7.2 < MC3 ≈ MC6.2 SH-SY5Y: MC4 < MC7.2 ≈ MC3 < MC6.2 |
| TMRM | Mitochondrial polarization | HepG2: MC4 < MC6.2 ≈ MC3 < MC7.2 SH-SY5Y: MC4 ≈ MC7.2 < MC3 < MC6.2 |
| Cellular OCR/ECAR | Cellular respiration and indirect measurement of cellular glycolytic activity | HepG2: MC4 ≈ MC7.2 ≈ MC3 ≈ MC6.2 SH-SY5Y: MC4 < MC7.2 < MC3 < MC6.2 |
Publisher’s Note: MDPI stays neutral with regard to jurisdictional claims in published maps and institutional affiliations. |
© 2021 by the authors. Licensee MDPI, Basel, Switzerland. This article is an open access article distributed under the terms and conditions of the Creative Commons Attribution (CC BY) license (https://creativecommons.org/licenses/by/4.0/).
Share and Cite
Fernandes, C.; Videira, A.J.C.; Veloso, C.D.; Benfeito, S.; Soares, P.; Martins, J.D.; Gonçalves, B.; Duarte, J.F.S.; Santos, A.M.S.; Oliveira, P.J.; et al. Cytotoxicity and Mitochondrial Effects of Phenolic and Quinone-Based Mitochondria-Targeted and Untargeted Antioxidants on Human Neuronal and Hepatic Cell Lines: A Comparative Analysis. Biomolecules 2021, 11, 1605. https://doi.org/10.3390/biom11111605
Fernandes C, Videira AJC, Veloso CD, Benfeito S, Soares P, Martins JD, Gonçalves B, Duarte JFS, Santos AMS, Oliveira PJ, et al. Cytotoxicity and Mitochondrial Effects of Phenolic and Quinone-Based Mitochondria-Targeted and Untargeted Antioxidants on Human Neuronal and Hepatic Cell Lines: A Comparative Analysis. Biomolecules. 2021; 11(11):1605. https://doi.org/10.3390/biom11111605
Chicago/Turabian StyleFernandes, Carlos, Afonso J. C. Videira, Caroline D. Veloso, Sofia Benfeito, Pedro Soares, João D. Martins, Beatriz Gonçalves, José F. S. Duarte, António M. S. Santos, Paulo J. Oliveira, and et al. 2021. "Cytotoxicity and Mitochondrial Effects of Phenolic and Quinone-Based Mitochondria-Targeted and Untargeted Antioxidants on Human Neuronal and Hepatic Cell Lines: A Comparative Analysis" Biomolecules 11, no. 11: 1605. https://doi.org/10.3390/biom11111605