
Na+,K+-ATPase with Disrupted Na+ Binding Sites I and III Binds Na+ with Increased Affinity at Site II and Undergoes Na+-Activated Phosphorylation with ATP
 ,
,
Abstract
:
1. Introduction
2. Materials and Methods
2.1. Site-Directed Mutagenesis and Expression
2.2. Isolation of the Plasma Membrane Vesicles and ATPase Activity Measurements
2.3. Phosphorylation Experiments
2.4. Electrophysiological Experiments
2.5. Data Analysis and Statistics
3. Results
3.1. Expression of the Ser777 Mutants
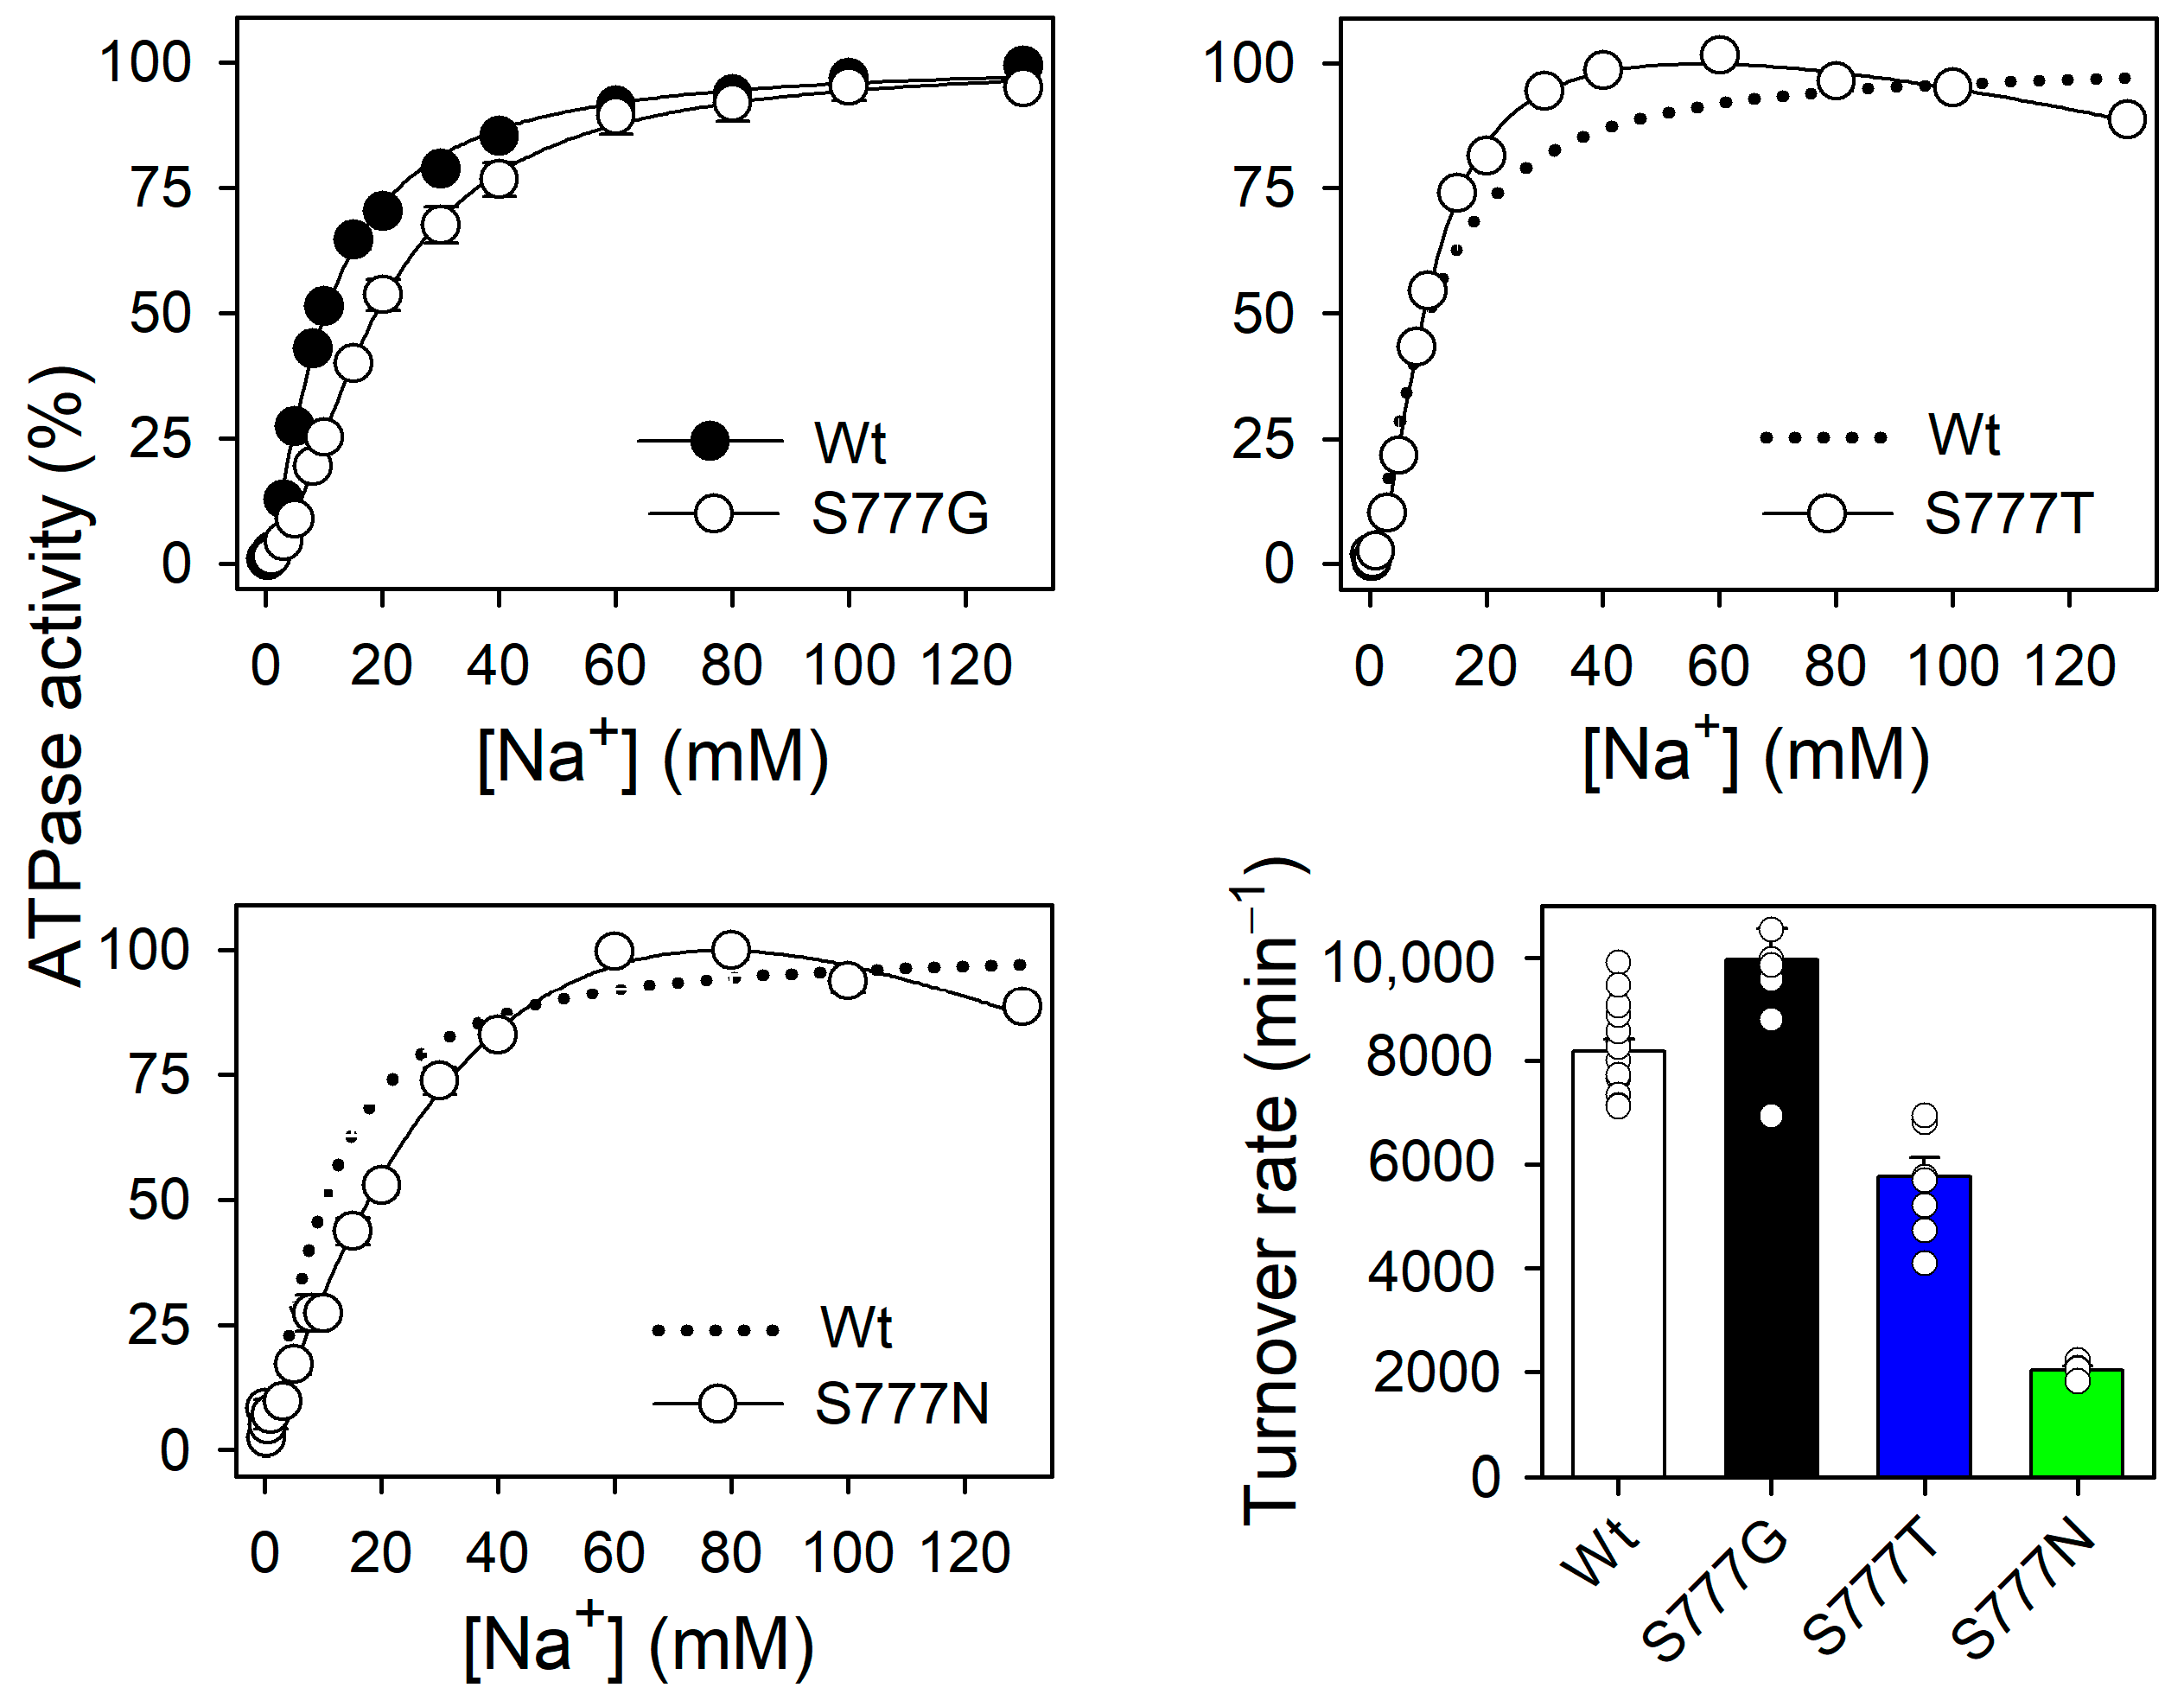
3.2. Na+,K+-ATPase Activity and Na+ Dependence of the Active Mutants S777G, S777T, and S777N

| Turnover Rate | Na+ Activation | K+ Inhibition | E2P | ||
|---|---|---|---|---|---|
| ATPase Activity K0.5 (Na+) | Phosphorylation K0.5 (Na+) | Phosphorylation K0.5 (K+) | |||
| min−1 | mM | (%) | |||
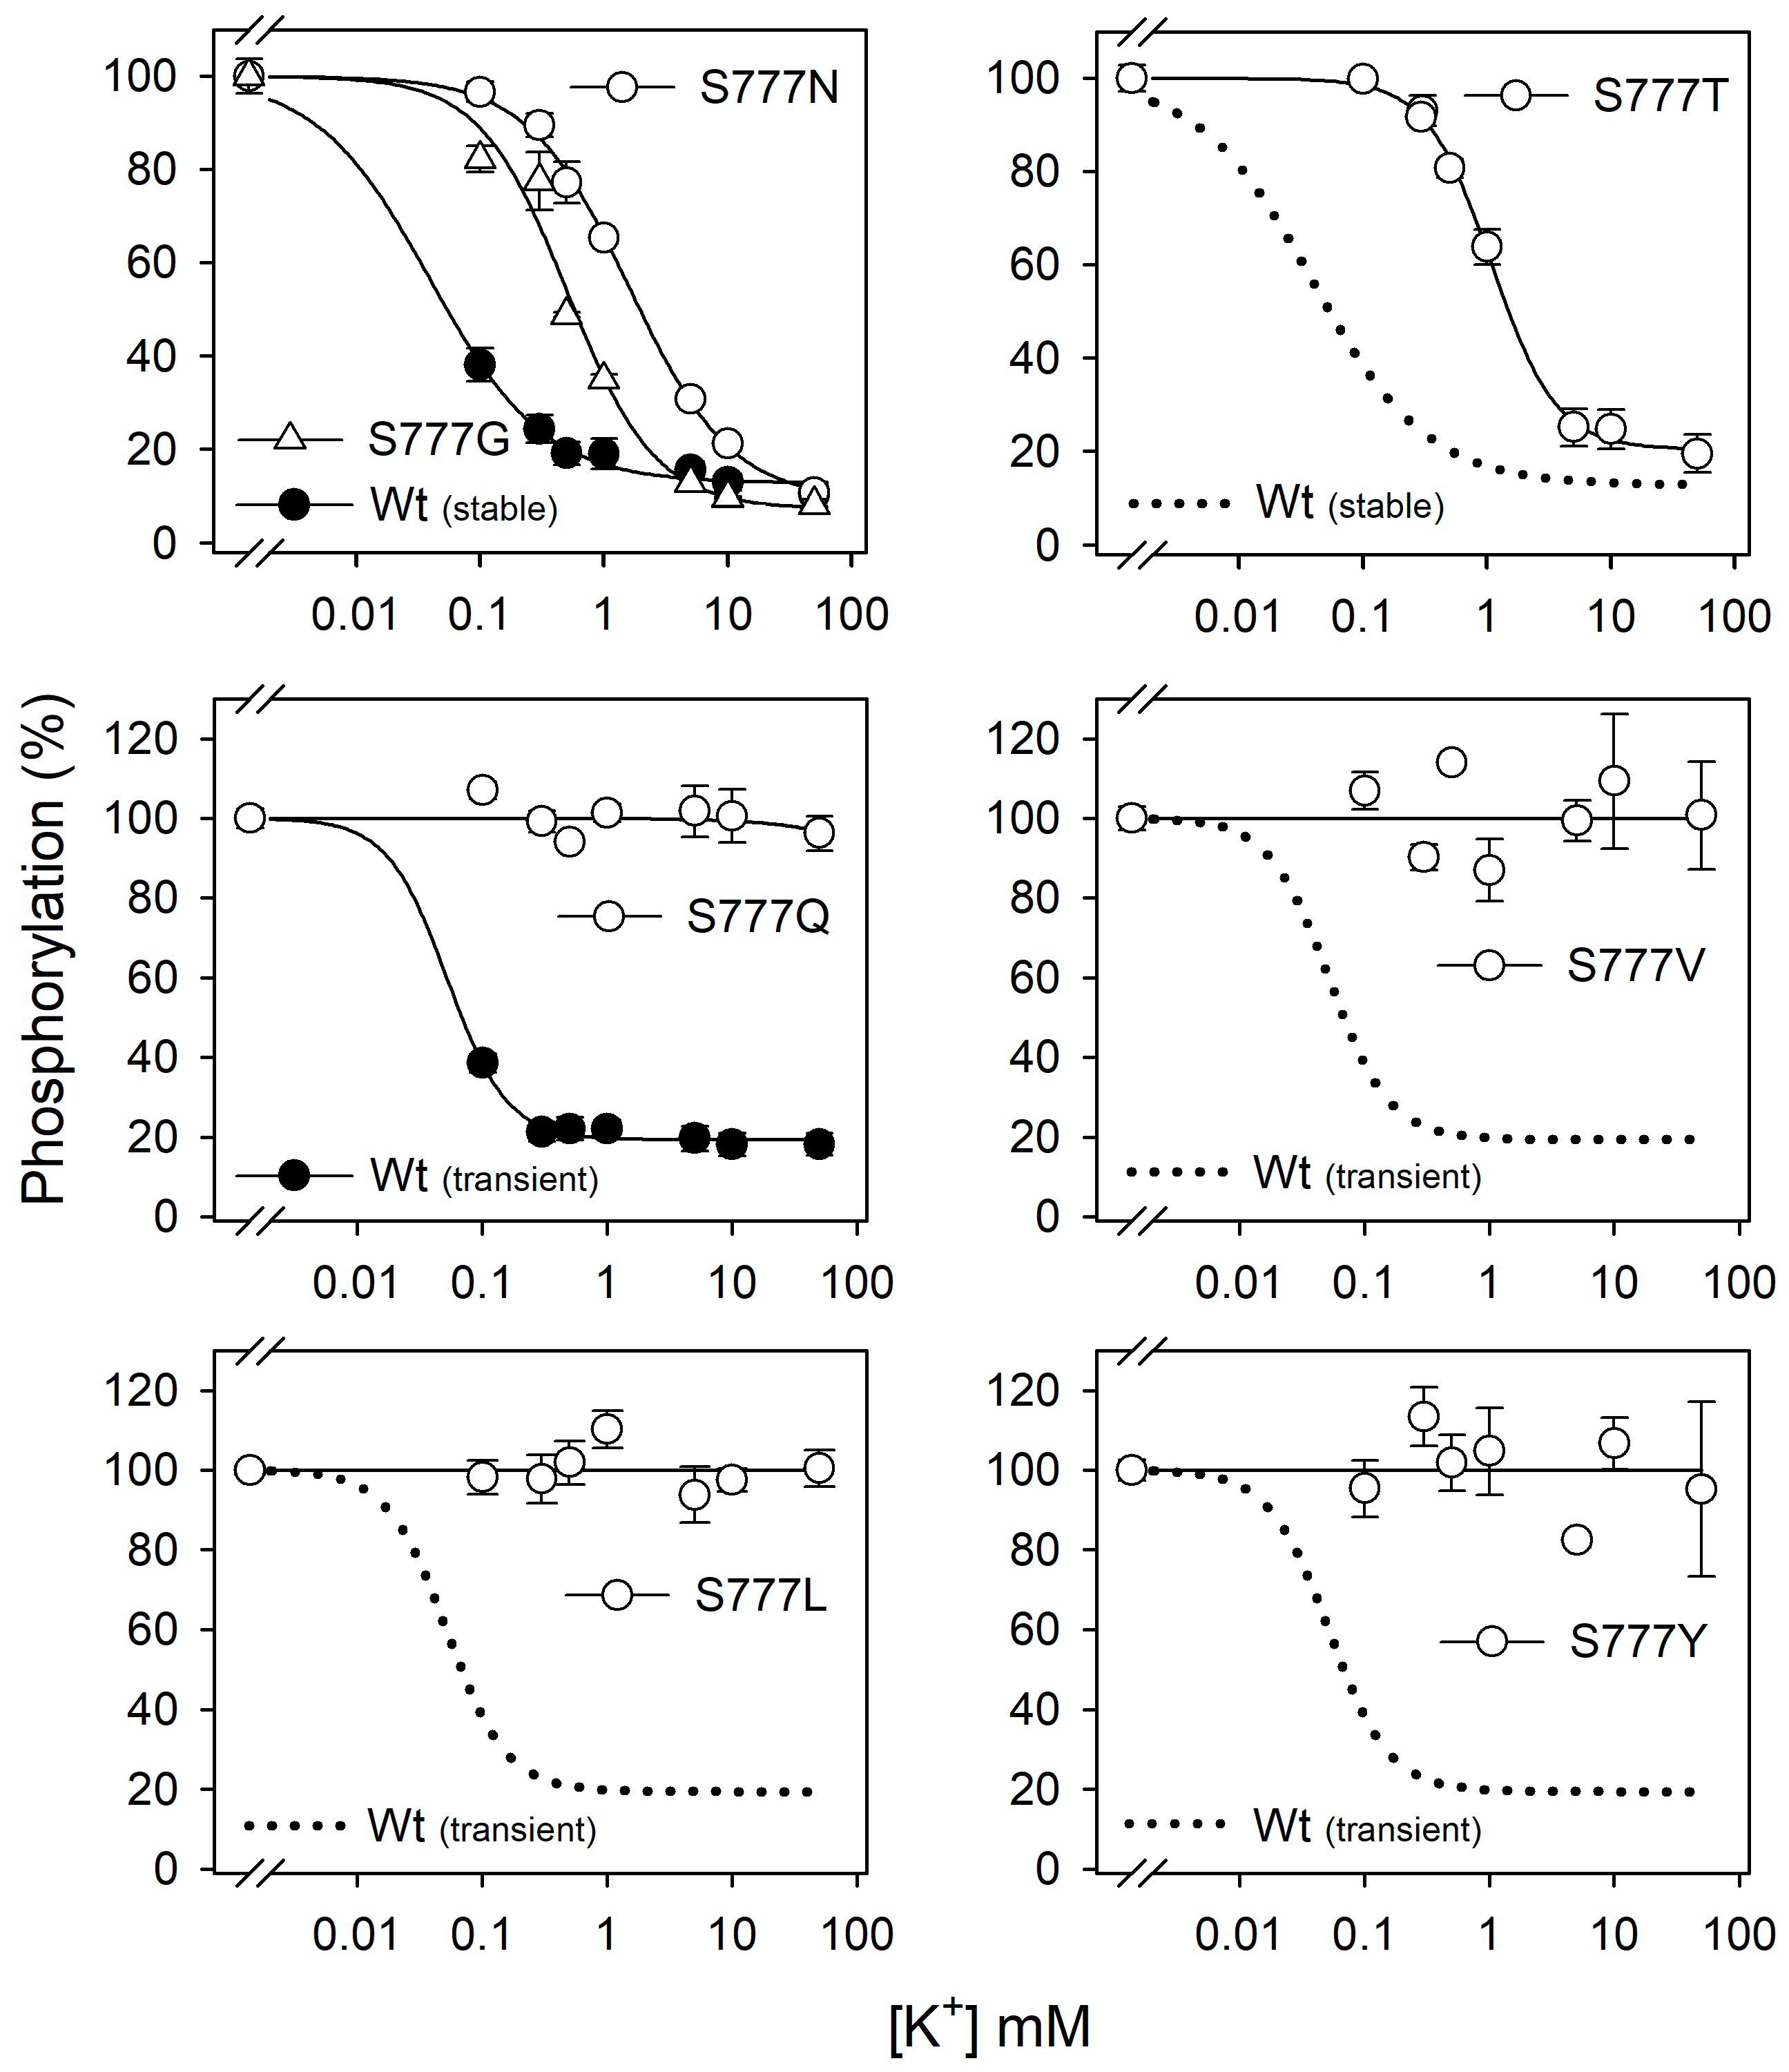
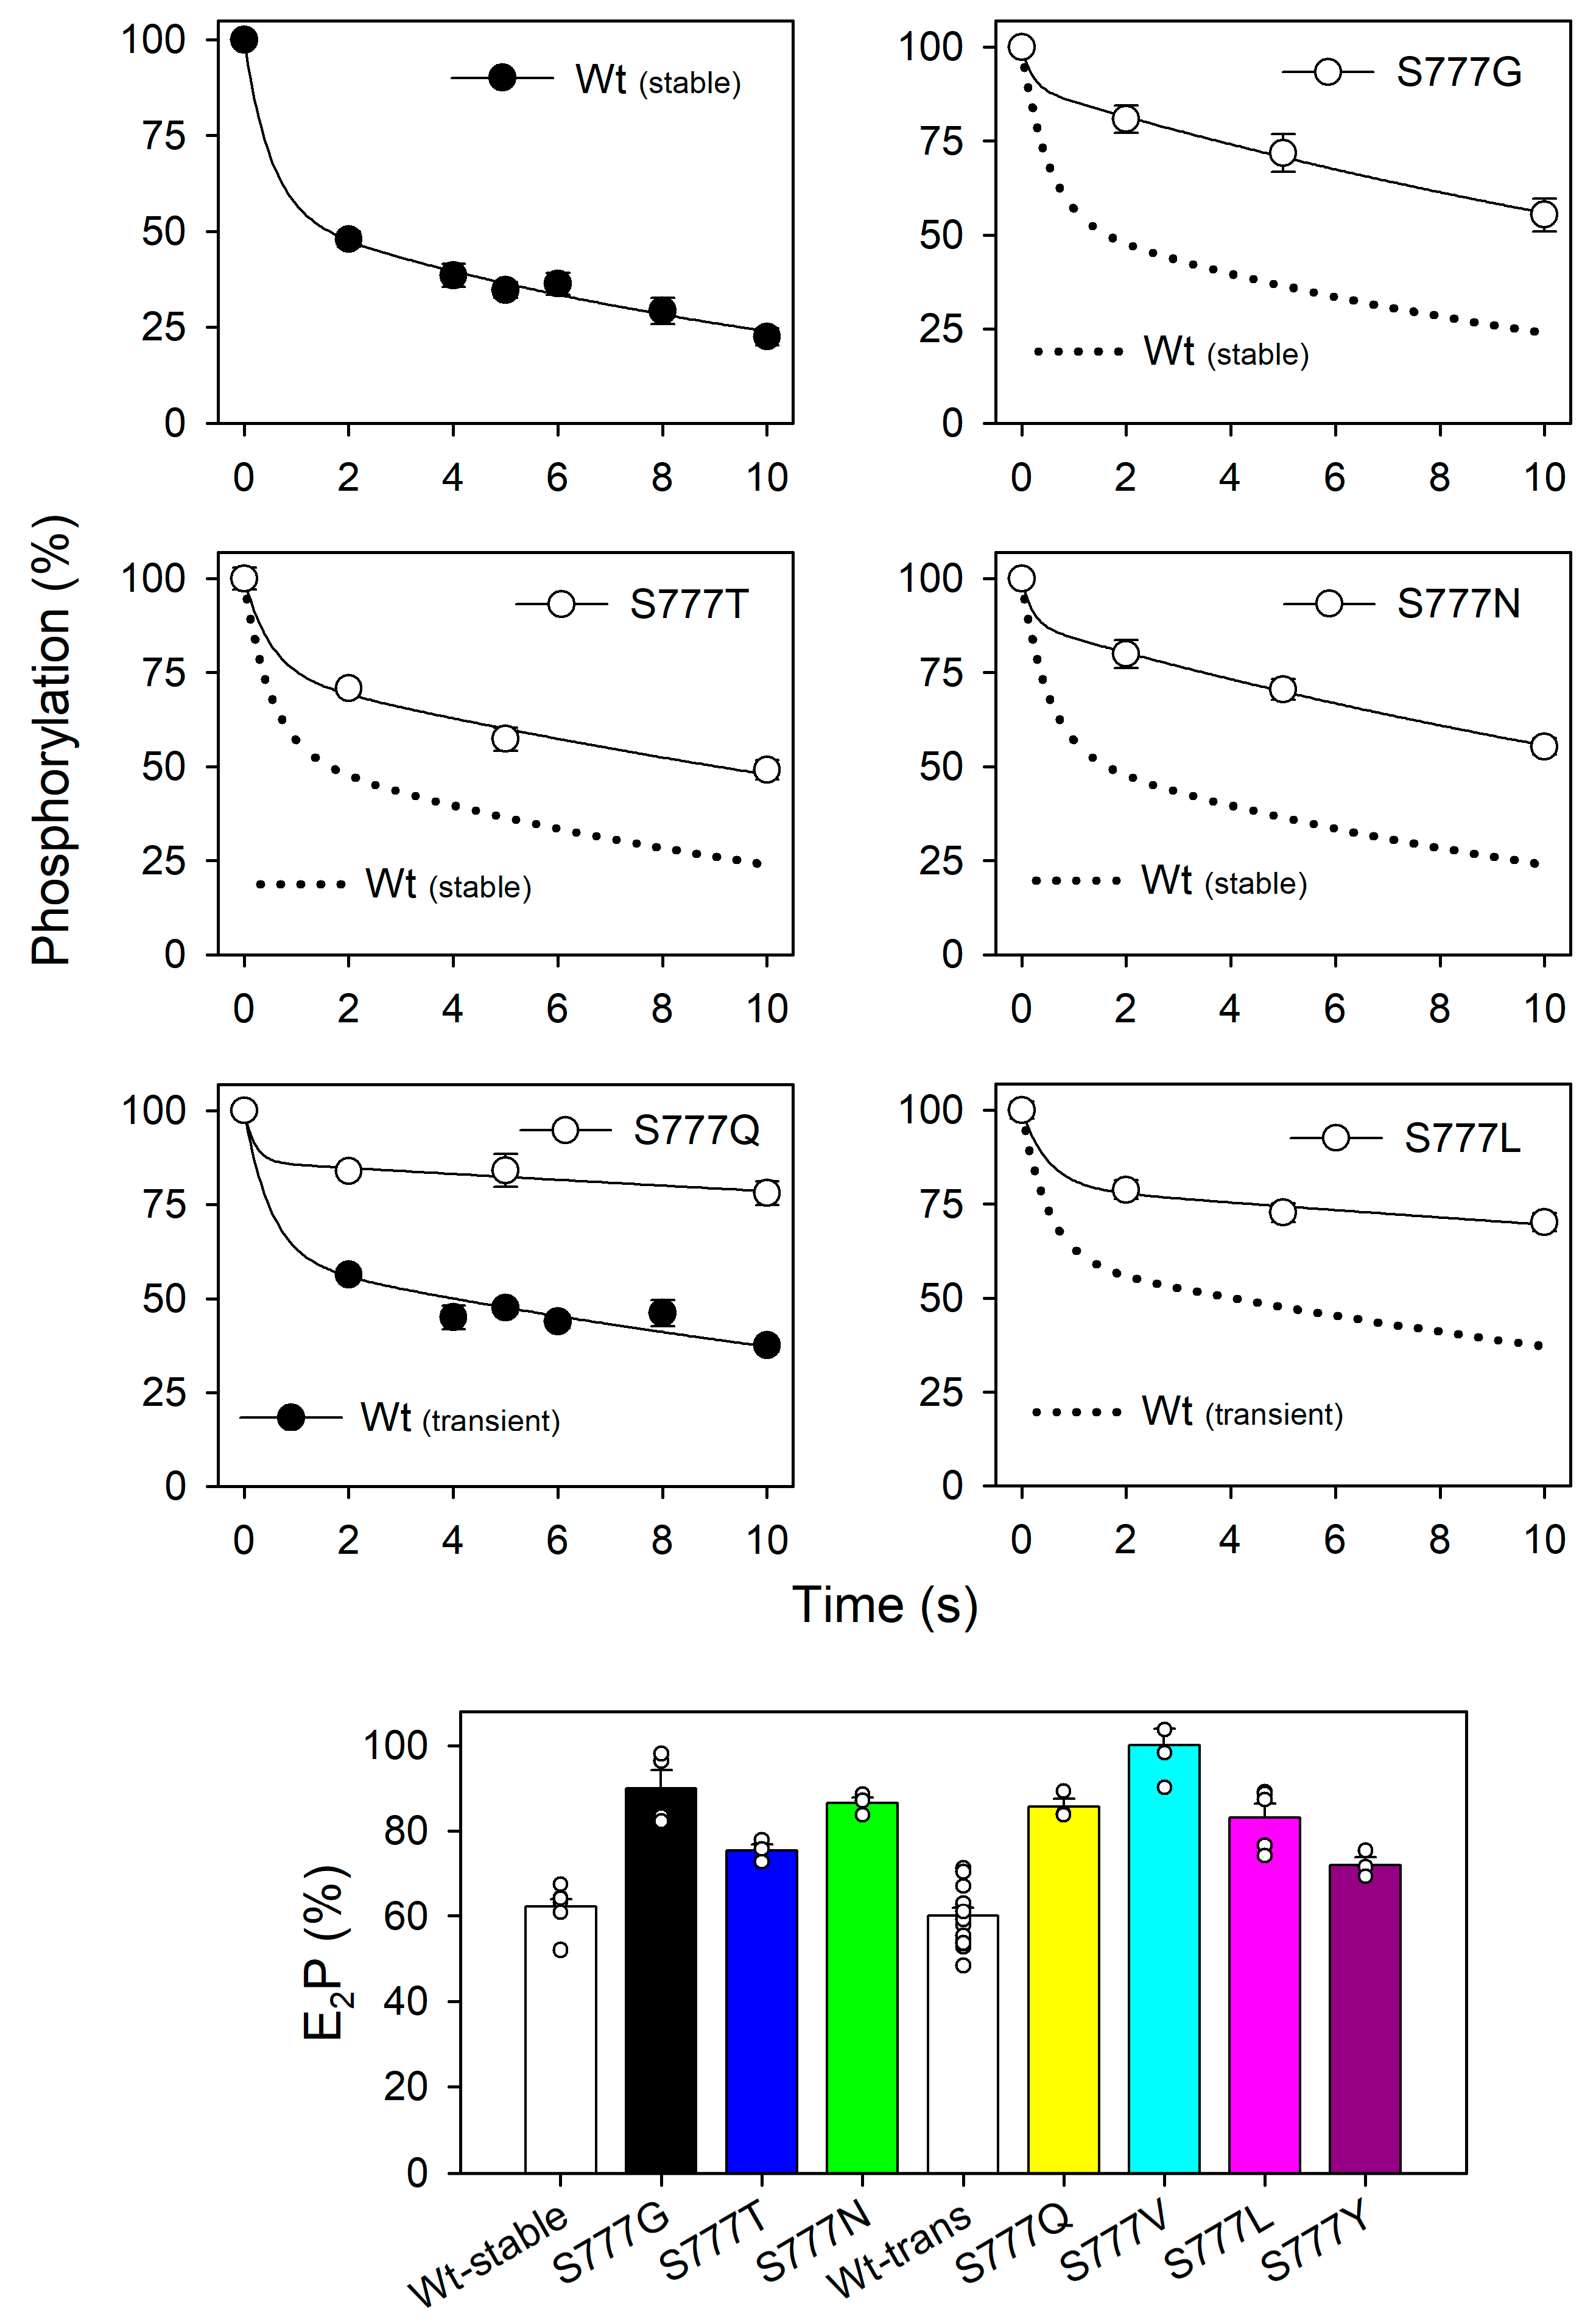
| Wt (stable) | 8187 ± 227 | 10 ± 0.8 | 0.50 ± 0.10 | 0.052 ± 0.026 | 62 ± 5 |
| (n = 15) | (n = 6) | (n = 13) | (n = 6) | (n = 7) | |
| Wt (transient) | ND | ND | 0.47 ± 0.09 | 0.050 ± 0.028 | 61 ± 7 |
| (n = 20) | (n = 21) | (n = 15) | |||
| S777G | 9965 ± 1698 | 19 ± 2 | 3.03 ± 0.57 | 0.563 ± 0.105 | 90 ± 8 |
| (n = 8) | (n = 3) | (n = 4) | (n = 4) | (n = 4) | |
| S777T | 5760 ± 1057 | 9.3 ± 0.2 | 0.72 ± 0.13 | 1.14 ± 0.16 | 75 ± 3 |
| (n = 8) | (n = 3) | (n = 4) | (n = 3) | (n = 3) | |
| S777N | 2041 ± 166 | 18 ± 2 | 3.23 ± 0.24 | 1.96 ± 0.67 | 87 ± 3 |
| (n = 4) | (n = 3) | (n = 3) | (n = 3) | (n = 3) | |
| S777Q | ND | ND | 0.17 ± 0.05 | >50 | 86 ± 3 |
| (n = 5) | (n = 3) | ||||
| S777V | ND | ND | 0.049 ± 0.044 | >50 | 100 ± 8 |
| (n = 6) | (n = 4) | ||||
| S777L | ND | ND | 0.068 ± 0.019 | >50 | 83 ± 7 |
| (n = 5) | (n = 5) | ||||
| S777Y | ND | ND | 0.018 ± 0.019 | >50 | 72 ± 3 |
| (n = 3) | (n = 3) | ||||
3.3. Na+ Dependence of Phosphorylation in All Ser777 Mutants
3.4. K+ Inhibition of Phosphorylation
3.5. Distribution between the ADP-Sensitive and ADP-Insensitive Phosphoenzyme Intermediates
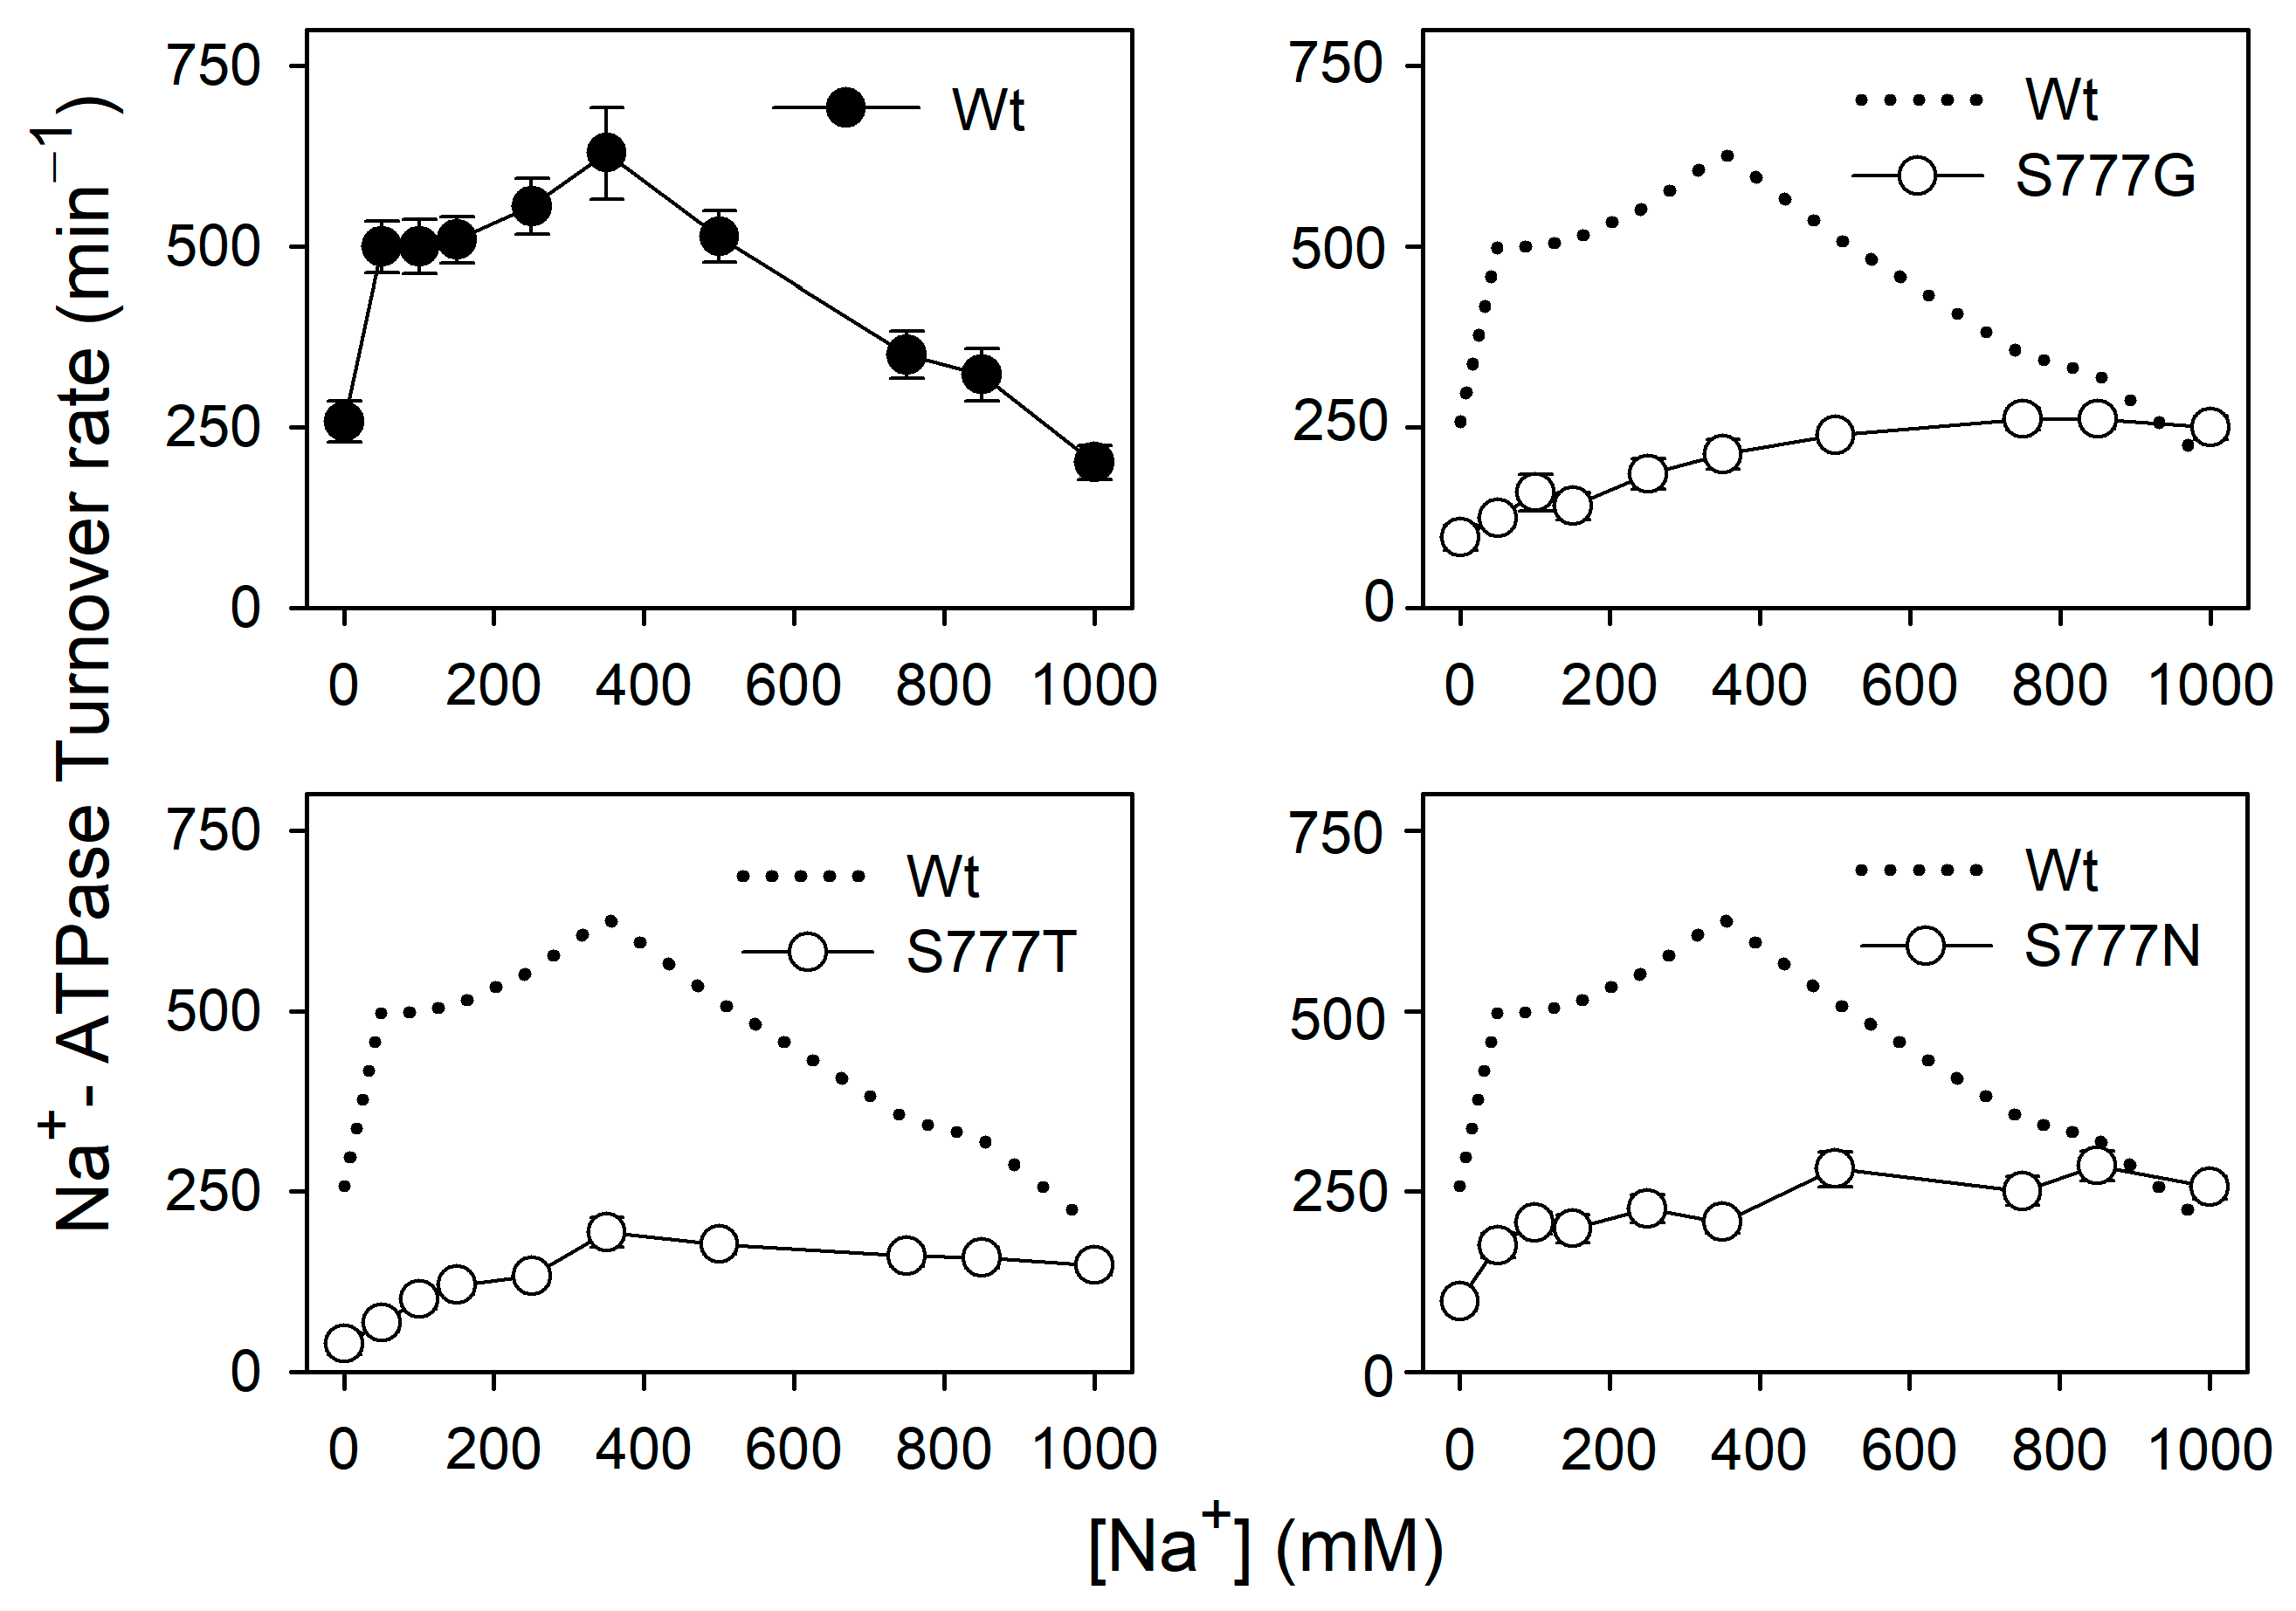
3.6. Na+ Dependence of Na+-ATPase Activity in the Active Mutants S777G, S777T, and S777N
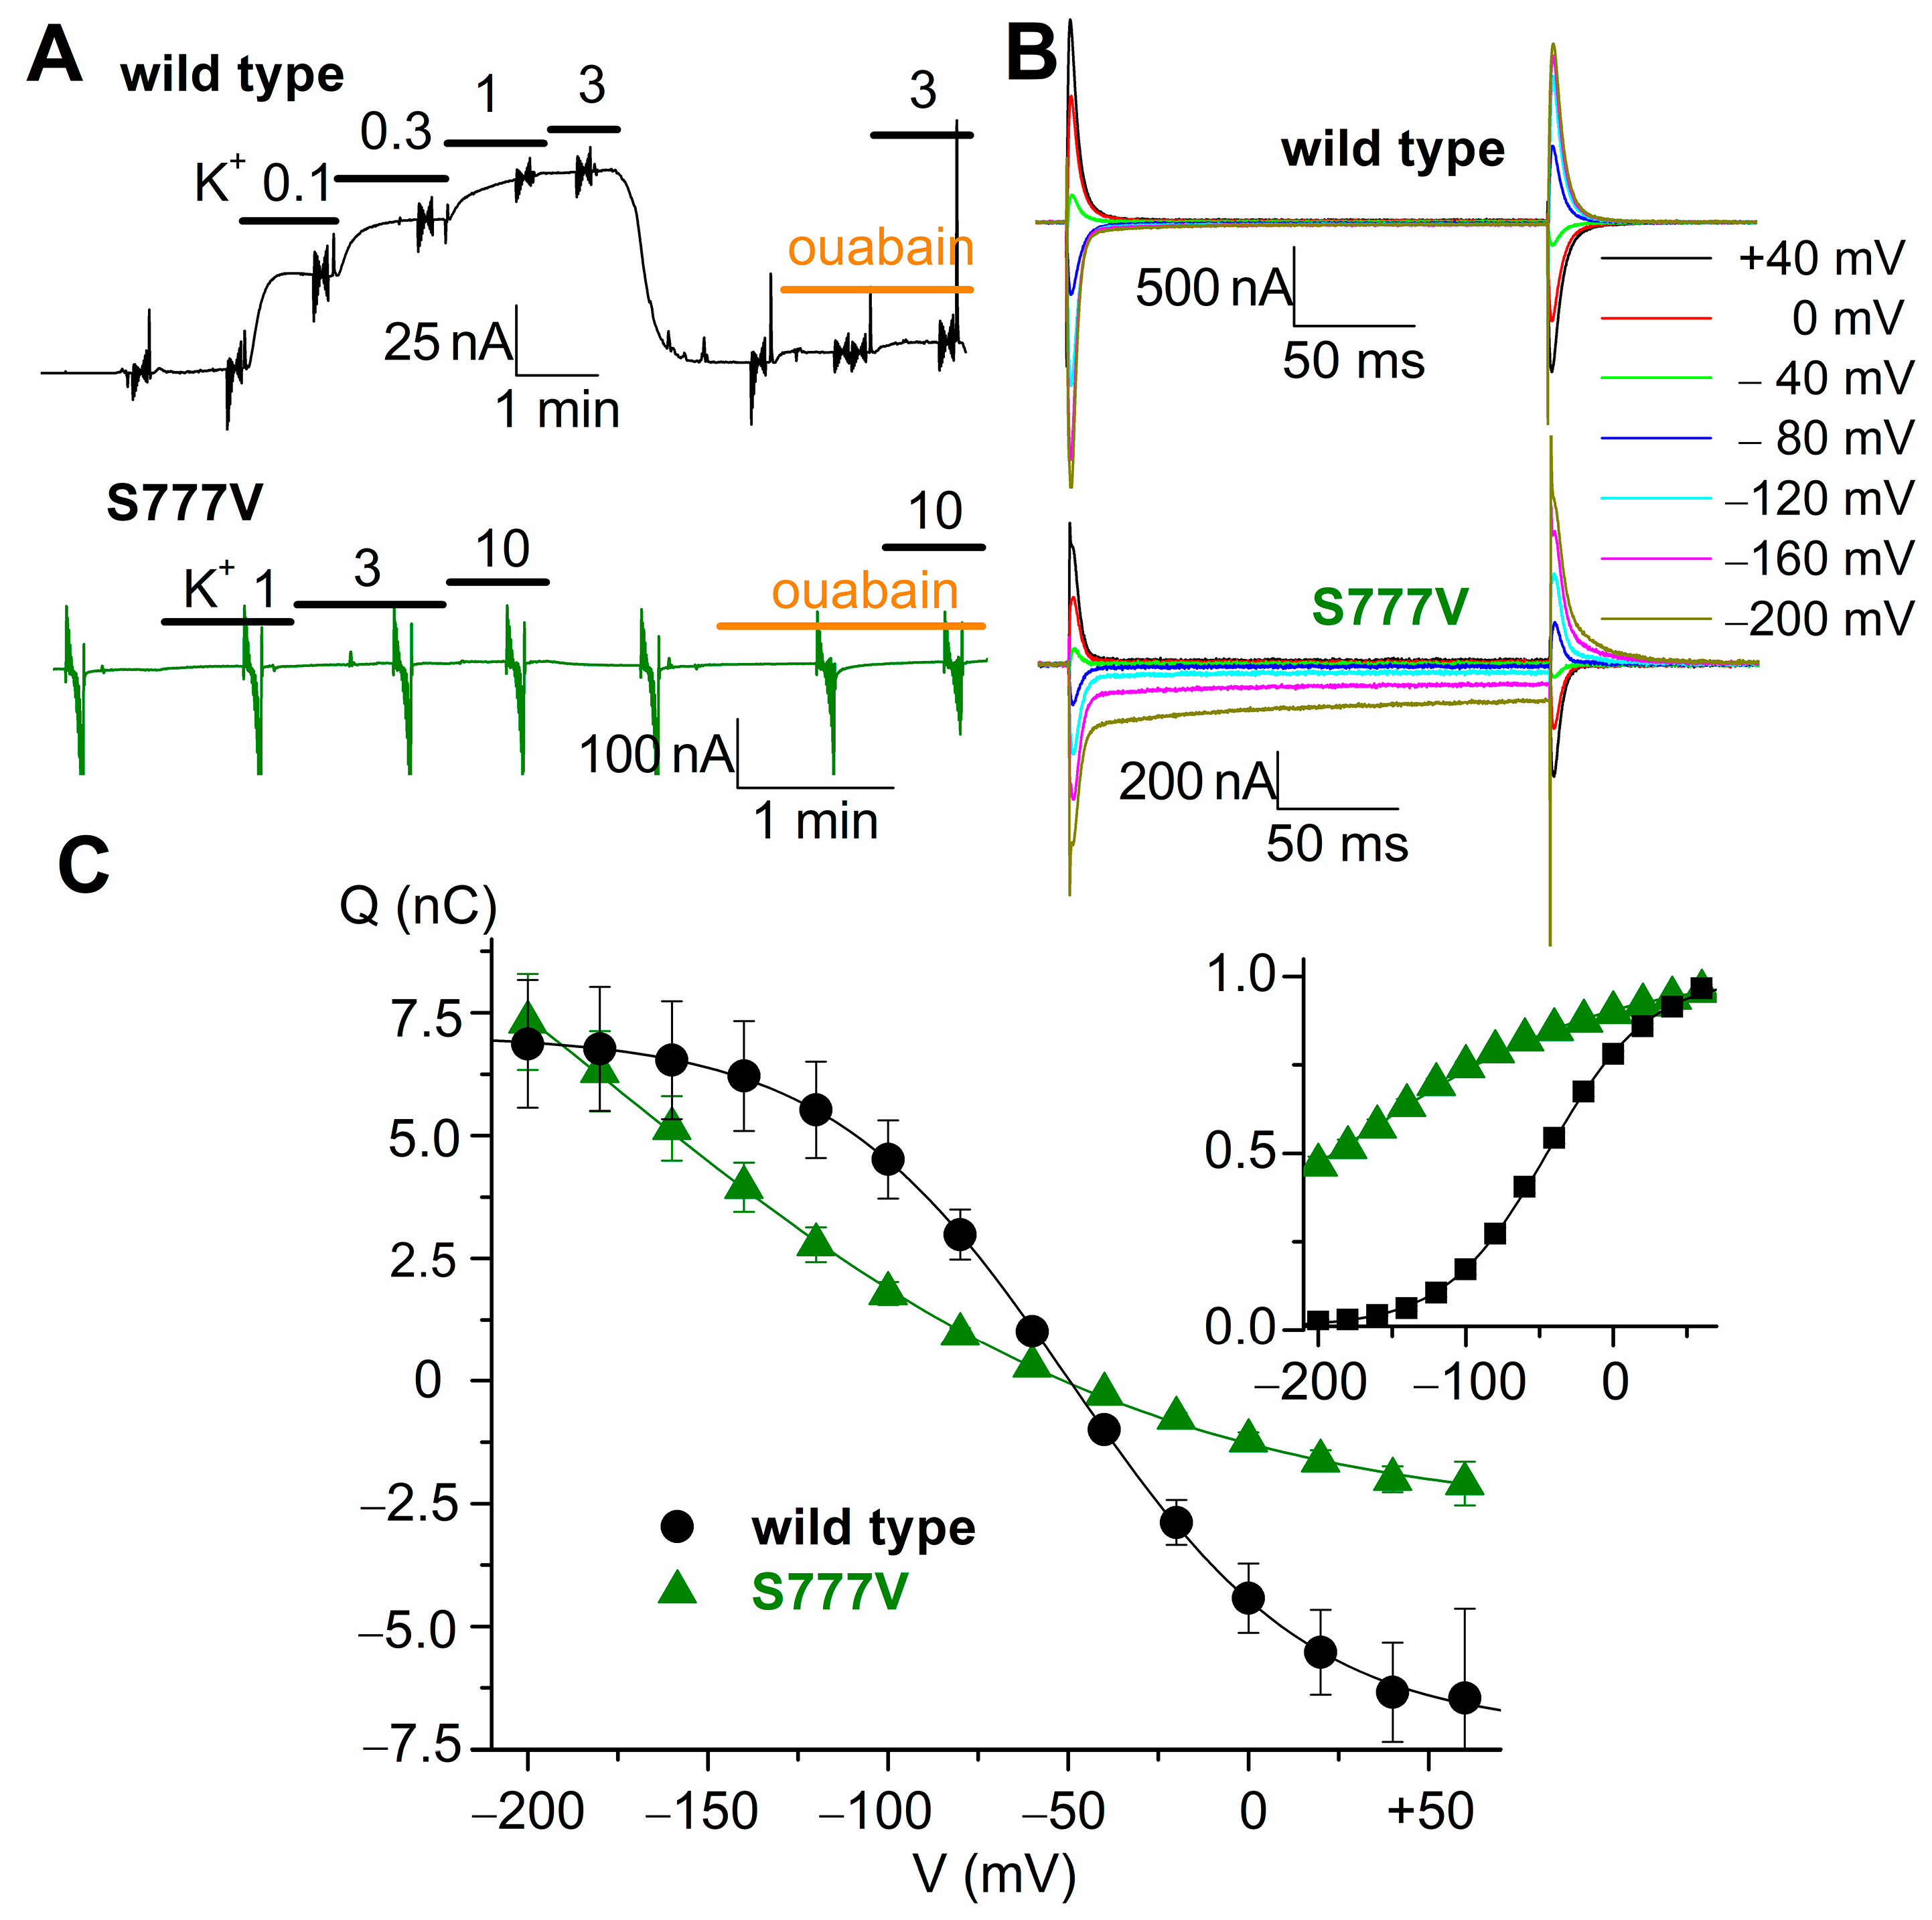
3.7. Electrophysiological Evaluation of S777V
4. Discussion
5. Conclusions
Author Contributions
Funding
Institutional Review Board Statement
Informed Consent Statement
Data Availability Statement
Acknowledgments
Conflicts of Interest
References
- Skou, J.C. The influence of some cations on an adenosine triphosphatase from peripheral nerves. Biochim. Biophys. Acta 1957, 23, 394–401. [Google Scholar] [CrossRef]
- Post, R.L.; Hegyvary, C.; Kume, S. Activation by adenosine triphosphate in the phosphorylation kinetics of sodium and potassium ion transport adenosine triphosphatase. J. Biol. Chem. 1972, 247, 6530–6540. [Google Scholar] [CrossRef]
- Glynn, I.M. Annual review prize lecture. ‘All hands to the sodium pump’. J. Physiol. 1993, 462, 1–30. [Google Scholar] [CrossRef]
- Kaplan, J.H. Biochemistry of Na,K-ATPase. Annu. Rev. Biochem. 2002, 71, 511–535. [Google Scholar] [CrossRef]
- Morth, J.P.; Pedersen, B.P.; Toustrup-Jensen, M.S.; Sørensen, T.L.; Petersen, J.; Andersen, J.P.; Vilsen, B.; Nissen, P. Crystal structure of the sodium-potassium pump. Nature 2007, 450, 1043–1049. [Google Scholar] [CrossRef]
- Shinoda, T.; Ogawa, H.; Cornelius, F.; Toyoshima, C. Crystal structure of the sodium-potassium pump at 2.4 A resolution. Nature 2009, 459, 446–450. [Google Scholar] [CrossRef]
- Kanai, R.; Ogawa, H.; Vilsen, B.; Cornelius, F.; Toyoshima, C. Crystal structure of a Na+-bound Na+,K+-ATPase preceding the E1P state. Nature 2013, 502, 201–206. [Google Scholar] [CrossRef]
- Young, V.C.; Nakanishi, H.; Meyer, D.J.; Nishizawa, T.; Oshima, A.; Artigas, P.; Abe, K. Structure and function of H+/K+ pump mutants reveal Na+/K+ pump mechanisms. Nat. Commun. 2022, 13, 5270. [Google Scholar] [CrossRef]
- Kanai, R.; Vilsen, B.; Cornelius, F.; Toyoshima, C. Crystal structures of Na+,K+-ATPase reveal the mechanism that converts the K+-bound form to Na+-bound form and opens and closes the cytoplasmic gate. FEBS Lett. 2023, 597, 1957–1976. [Google Scholar] [CrossRef]
- Albers, R.W. Biochemical aspects of active transport. Annu. Rev. Biochem. 1967, 36, 727–756. [Google Scholar] [CrossRef]
- Apell, H.J.; Karlish, S.J. Functional properties of Na,K-ATPase, and their structural implications, as detected with biophysical techniques. J. Membr. Biol. 2001, 180, 1–9. [Google Scholar] [CrossRef] [PubMed]
- Jewell-Motz, E.A.; Lingrel, J.B. Site-directed mutagenesis of the Na,K-ATPase: Consequences of substitutions of negatively-charged amino acids localized in the transmembrane domains. Biochemistry 1993, 32, 13523–13530. [Google Scholar] [CrossRef] [PubMed]
- Arguello, J.M.; Lingrel, J.B. Substitutions of serine 775 in the alpha subunit of the Na,K-ATPase selectively disrupt K+ high affinity activation without affecting Na+ interaction. J. Biol. Chem. 1995, 270, 22764–22771. [Google Scholar] [CrossRef] [PubMed]
- Blostein, R.; Wilczynska, A.; Karlish, S.J.; Argüello, J.M.; Lingrel, J.B. Evidence that Ser775 in the α subunit of the Na,K-ATPase is a residue in the cation binding pocket. J. Biol. Chem. 1997, 272, 24987–24993. [Google Scholar] [CrossRef] [PubMed]
- Pedersen, P.A.; Rasmussen, J.H.; Nielsen, J.M.; Jorgensen, P.L. Identification of Asp804 and Asp808 as Na+ and K+ coordinating residues in α-subunit of renal Na,K-ATPase. FEBS Lett. 1997, 400, 206–210. [Google Scholar] [CrossRef] [PubMed]
- Pedersen, P.A.; Nielsen, J.M.; Rasmussen, J.H.; Jorgensen, P.L. Contribution to Tl+, K+, and Na+ binding of Asn776, Ser775, Thr774, Thr772, and Tyr771 in cytoplasmic part of fifth transmembrane segment in α-subunit of renal Na,K-ATPase. Biochemistry 1998, 37, 17818–17827. [Google Scholar] [CrossRef] [PubMed]
- Holm, R.; Toustrup-Jensen, M.S.; Einholm, A.P.; Schack, V.R.; Andersen, J.P.; Vilsen, B. Neurological disease mutations of α3 Na+,K+-ATPase: Structural and functional perspectives and rescue of compromised function. Biochim. Biophys. Acta Bioenerg. 2016, 1857, 1807–1828. [Google Scholar] [CrossRef]
- Toyoshima, C.; Nakasako, M.; Nomura, H.; Ogawa, H. Crystal structure of the calcium pump of sarcoplasmic reticulum at 2.6 A resolution. Nature 2000, 405, 647–655. [Google Scholar] [CrossRef] [PubMed]
- Ogawa, H.; Toyoshima, C. Homology modeling of the cation binding sites of Na+,K+-ATPase. Proc. Natl. Acad. Sci. USA 2002, 99, 15977–15982. [Google Scholar] [CrossRef]
- Abe, K.; Nishizawa, T.; Artigas, P. An unusual conformation from Na+-sensitive non-gastric proton pump mutants reveals molecular mechanisms of cooperative Na+-binding. Biochim. Biophys. Acta Mol. Cell Res. 2023, 1870, 119543. [Google Scholar] [CrossRef]
- Yang, X.; Gao, H.; Zhang, J.; Xu, X.; Liu, X.; Wu, X.; Wei, L.; Zhang, Y. ATP1A3 mutations and genotype-phenotype correlation of alternating hemiplegia of childhood in Chinese patients. PLoS ONE 2014, 9, e97274. [Google Scholar] [CrossRef] [PubMed]
- Castañeda, M.S.; Zanoteli, E.; Scalco, R.S.; Scaramuzzi, V.; Caldas, V.M.; Reed, U.C.; da Silva, A.M.S.; O’Callaghan, B.; Phadke, R.; Bugiardini, E.; et al. A novel ATP1A2 mutation in a patient with hypokalaemic periodic paralysis and CNS symptoms. Brain 2018, 141, 3308–3318. [Google Scholar] [CrossRef] [PubMed]
- Nielsen, H.N.; Spontarelli, K.; Holm, R.; Andersen, J.P.; Einholm, A.P.; Artigas, P.; Vilsen, B. Distinct effects of Q925 mutation on intracellular and extracellular Na+ and K+ binding to the Na+, K+-ATPase. Sci. Rep. 2019, 9, 13344. [Google Scholar] [CrossRef] [PubMed]
- Chen, C.; Okayama, H. High-efficiency transformation of mammalian cells by plasmid DNA. Mol. Cell. Biol. 1987, 7, 2745–2752. [Google Scholar] [PubMed]
- Price, E.M.; Lingrel, J.B. Structure-function relationships in the Na,K-ATPase α subunit: Site-directed mutagenesis of glutamine-111 to arginine and asparagine-122 to aspartic acid generates a ouabain-resistant enzyme. Biochemistry 1988, 27, 8400–8408. [Google Scholar] [CrossRef]
- Baginski, E.S.; Foa, P.P.; Zak, B. Microdetermination of inorganic phosphate, phospholipids, and total phosphate in biologic materials. Clin. Chem. 1967, 13, 326–332. [Google Scholar]
- Holm, R.; Khandelwal, J.; Einholm, A.P.; Andersen, J.P.; Artigas, P.; Vilsen, B. Arginine substitution of a cysteine in transmembrane helix M8 converts Na+,K+-ATPase to an electroneutral pump similar to H+,K+-ATPase. Proc. Natl. Acad. Sci. USA 2017, 114, 316–321. [Google Scholar] [CrossRef]
- Lee, K.H.; Blostein, R. Red cell sodium fluxes catalysed by the sodium pump in the absence of K+ and ADP. Nature 1980, 285, 338–339. [Google Scholar] [CrossRef]
- Kaplan, J.H.; Hollis, R.J. External Na dependence of ouabain-sensitive ATP:ADP exchange initiated by photolysis of intracellular caged-ATP in human red cell ghosts. Nature 1980, 288, 587–589. [Google Scholar] [CrossRef]
- Holmgren, M.; Rakowski, R.F. Charge translocation by the Na+/K+ pump under Na+/Na+ exchange conditions: Intracellular Na+ dependence. Biophys. J. 2006, 90, 1607–1616. [Google Scholar] [CrossRef]
- Tsunekawa, N.; Ogawa, H.; Tsueda, J.; Akiba, T.; Toyoshima, C. Mechanism of the E2 to E1 transition in Ca2+ pump revealed by crystal structures of gating residue mutants. Proc. Natl. Acad. Sci. USA 2018, 115, 12722–12727. [Google Scholar] [CrossRef] [PubMed]
- Kabashima, Y.; Ogawa, H.; Nakajima, R.; Toyoshima, C. What ATP binding does to the Ca2+ pump and how nonproductive phosphoryl transfer is prevented in the absence of Ca2+. Proc. Natl. Acad. Sci. USA 2020, 117, 18448–18458. [Google Scholar] [CrossRef] [PubMed]
- Creighton, T.E. Proteins, Structures and Molecular Properties, 2nd ed.; W.H. Freeman and Company: New York, NY, USA, 1993; p. 141. [Google Scholar]
- Artigas, P.; Meyer, D.J.; Young, V.C.; Spontarelli, K.; Eastman, J.; Strandquist, E.; Rui, H.; Roux, B.; Birk, M.A.; Nakanishi, H.; et al. A Na pump with reduced stoichiometry is up-regulated by brine shrimp in extreme salinities. Proc. Natl. Acad. Sci. USA 2023, 120, e2313999120. [Google Scholar] [CrossRef] [PubMed]
- Guerini, D.; Zecca-Mazza, A.; Carafoli, E. Single amino acid mutations in transmembrane domain 5 confer to the plasma membrane Ca2+ pump properties typical of the Ca2+ pump of endo(sarco)plasmic reticulum. J. Biol. Chem. 2000, 275, 31361–31368. [Google Scholar] [CrossRef]
- Yamamoto, K.; Dubey, V.; Irie, K.; Nakanishi, H.; Khandelia, H.; Fujiyoshi, Y.; Abe, K. A single K+-binding site in the crystal structure of the gastric proton pump. eLife 2019, 8, e47701. [Google Scholar] [CrossRef]
- Koenderink, J.B.; Swarts, H.G.P.; Willems, P.H.G.M.; Krieger, E.; De Pont, J.J.H.H.M. A conformation-specific interhelical salt bridge in the K+ binding site of gastric H,K-ATPase. J. Biol. Chem. 2004, 279, 16417–16424. [Google Scholar] [CrossRef]
- Bernèche, S.; Roux, B. Energetics of ion conduction through the K+ channel. Nature 2001, 414, 73–77. [Google Scholar] [CrossRef]
- Kanai, R.; Cornelius, F.; Vilsen, B.; Toyoshima, C. Cryoelectron microscopy of Na+,K+-ATPase in the two E2P states with and without cardiotonic steroids. Proc. Natl. Acad. Sci. USA 2022, 119, e2123226119. [Google Scholar] [CrossRef]


Disclaimer/Publisher’s Note: The statements, opinions and data contained in all publications are solely those of the individual author(s) and contributor(s) and not of MDPI and/or the editor(s). MDPI and/or the editor(s) disclaim responsibility for any injury to people or property resulting from any ideas, methods, instructions or products referred to in the content. |
© 2024 by the authors. Licensee MDPI, Basel, Switzerland. This article is an open access article distributed under the terms and conditions of the Creative Commons Attribution (CC BY) license (https://creativecommons.org/licenses/by/4.0/).
Share and Cite
Nielsen, H.N.; Holm, R.; Sweazey, R.; Andersen, J.P.; Artigas, P.; Vilsen, B. Na+,K+-ATPase with Disrupted Na+ Binding Sites I and III Binds Na+ with Increased Affinity at Site II and Undergoes Na+-Activated Phosphorylation with ATP. Biomolecules 2024, 14, 135. https://doi.org/10.3390/biom14010135
Nielsen HN, Holm R, Sweazey R, Andersen JP, Artigas P, Vilsen B. Na+,K+-ATPase with Disrupted Na+ Binding Sites I and III Binds Na+ with Increased Affinity at Site II and Undergoes Na+-Activated Phosphorylation with ATP. Biomolecules. 2024; 14(1):135. https://doi.org/10.3390/biom14010135
Chicago/Turabian StyleNielsen, Hang N., Rikke Holm, Ryan Sweazey, Jens Peter Andersen, Pablo Artigas, and Bente Vilsen. 2024. "Na+,K+-ATPase with Disrupted Na+ Binding Sites I and III Binds Na+ with Increased Affinity at Site II and Undergoes Na+-Activated Phosphorylation with ATP" Biomolecules 14, no. 1: 135. https://doi.org/10.3390/biom14010135