Article

The Cerebrospinal Fluid Free-Glycans Hex1 and HexNAc1Hex1Neu5Ac1 as Potential Biomarkers of Alzheimer’s Disease

1
Institute of Diagnostic Laboratory Medicine, Clinical Chemistry, Charité—Universitätsmedizin Berlin, Corporate Member of Freie Universität Berlin and Humboldt-Universität zu Berlin, Augustenburger Platz 1, 13353 Berlin, Germany
2
Department of Human Medicine, Medical School Berlin, Rüdesheimer Str. 50, 14197 Berlin, Germany
3
Department of Psychiatry and Psychotherapy, Charité—Universitätsmedizin Berlin, Corporate Member of Freie Universität Berlin and Humboldt-Universität zu Berlin, Hindenburgdamm 30, 12203 Berlin, Germany
*
Author to whom correspondence should be addressed.
Biomolecules 2024, 14(5), 512; https://doi.org/10.3390/biom14050512
Submission received: 10 November 2023 / Revised: 18 April 2024 / Accepted: 19 April 2024 / Published: 24 April 2024
(This article belongs to the Special Issue Advances in Biomarkers for Neurodegenerative Diseases)

Abstract

:
Alzheimer’s disease (AD) is the most common neurodegenerative disorder, affecting a growing number of elderly people. In order to improve the early and differential diagnosis of AD, better biomarkers are needed. Glycosylation is a protein post-translational modification that is modulated in the course of many diseases, including neurodegeneration. Aiming to improve AD diagnosis and differential diagnosis through glycan analytics methods, we report the glycoprotein glycome of cerebrospinal fluid (CSF) isolated from a total study cohort of 262 subjects. The study cohort consisted of patients with AD, healthy controls and patients suffering from other types of dementia. CSF free-glycans were also isolated and analyzed in this study, and the results reported for the first time the presence of 19 free glycans in this body fluid. The free-glycans consisted of complete or truncated N-/O-glycans as well as free monosaccharides. The free-glycans Hex1 and HexNAc1Hex1Neu5Ac1 were able to discriminate AD from controls and from patients suffering from other types of dementia. Regarding CSF N-glycosylation, high proportions of high-mannose, biantennary bisecting core-fucosylated N-glycans were found, whereby only about 20% of the N-glycans were sialylated. O-Glycans and free-glycan fragments were less sialylated in AD patients than in controls. To conclude, this comprehensive study revealed for the first time the biomarker potential of free glycans for the differential diagnosis of AD.

1. Introduction

Alzheimer’s disease (AD), characterized by slow cognitive decline, is the most common neurodegenerative disorder in elderly people and represents about 70% of diagnosed cases of dementia [1]. In 2021, it was estimated that about 55 million people were affected by dementia worldwide and predictions state 139 million cases by 2050, whereby the greatest increase is expected in developing and semi-developed countries [2,3]. In AD demented individuals, neurodegeneration results from the formation of amyloid plaques and from the aggregation of the tau protein. The amyloid β-peptide (Aβ) is a 4 kDa peptide that is cleaved by the secretase complex (β- and γ-secretase) from the amyloid precursor protein (APP) present in neuronal membranes [4]. After cleavage, the amyloid β-peptide switches from a random coil or α-helix conformation to a β-hairpin, which facilitates its polymerization and accumulation into plaques [5]. In addition, abnormal phosphorylation of the intracellular microtubule-associated protein tau plays an important role in the neurobiological processes underlying AD. The O-GlcNAcylation of the tau protein was found to regulate the phosphorylation of tau in AD patients [6,7,8]. The downregulation of tau O-GlcNAcylation results in hyperphosphorylation, which renders the tau protein dysfunctional [9]. The ability to promote assembly and to stabilize microtubules is not only lost but hyperphosphorylated tau sequesters normal tau and other neuronal microtubule-associated proteins, leading to the formation of neurofibrillary tangles [10]. The disruption of the microtubule network can affect axonal transport, causing retrograde degeneration and further dementia [11].
Although age, sex or other exogenous factors, such as traumatic brain injury or a persons’ lifestyle, are the main causes of Alzheimer’s disease, there is also a rare genetic origin; about 1% of dominantly inherited familiar AD is caused by mutations of the genes coding for the amyloid precursor protein, presenilin-1 and presenilin-2 [12,13,14,15,16]. Moreover, the isoform ε4 of the cholesterol transporter apolipoprotein E is considered a high genetic risk factor for AD [17]. Knowing the evolution of dynamic biomarkers, it is estimated that neuronal degeneration also starts occurring in the brain as early as 10–30 years before the first symptoms are observed in the most common spontaneous cases of AD [18,19]. When the brain is not able to compensate for the neuronal degeneration, the first signs of mild cognitive impairment (MCI) will appear [20]. Patients with MCI suffer from noticeable changes in their thinking abilities but are still able to do their daily activities, whereas the daily life of AD patients is impaired due to more severe cognitive losses [20].
The diagnosis of AD is based on history and physical examination, psychological testing, brain-imaging and CSF biomarkers to exclude other brain diseases, but the definitive diagnosis of AD can only be carried out post-mortem by a neuropathological examination [21]. Generally, there are no Alzheimer’s-related physical changes. However, in rare cases, affected individuals showed signs of progressive apraxia, aphasia or visual impairment [22,23,24,25,26,27,28,29]. Psychological testing is performed by clinicians through questionnaires such as the Mini-Mental State Examination (MMSE). At a molecular level, fibrillar Aβ can be visualized with positron emission tomography using 11C-labeled Pittsburgh compound B (PiB) or 18F-based tracers, such as NeuraCeqTM or Amyvid® [30,31,32,33]. These compounds bind to insoluble fibrillary amyloid plaques. However, tracer binding is observed in patients suffering from dementia with Lewy bodies as well as in healthy elderly; e.g., 30–40% at the age of 80 years show high PiB binding [34]. Computed tomography scanning and magnetic resonance imaging serve as further imaging techniques. CSF is in direct contact with the extracellular space of the brain and reflects to a certain extent its biochemical status. The collection of CSF is invasive, but it remains the best body fluid to perform a biomarker-based analysis of the type of brain disorders, although serum-based biomarkers have been developed in recent years but are yet to be implemented in the routine diagnostics [19]. In order to support the diagnosis of AD, the total tau protein (t-tau), phosphorylated tau (p-tau), β-amyloid proteins Aβ1–42 (Aβ)/Aβ1–40 and the ratio Aβ1–42/Aβ1–40 are the markers that are quantified routinely in CSF, but they are not sensitive and specific enough to be used exclusively; this is why they are used in combination with imaging techniques [19,35]. High t-tau and p-tau correlate with a fast progression of cognitive decline, corresponding to a transition from MCI to AD [36,37]. The Aβ-peptides, which are secreted during cellular metabolism as normal components of the CSF [38,39], are downregulated by 50% in AD patients [40]. Multiparameter assays combining the measurements of CSF t-tau, p-tau and Aβ-peptides have recently shown better diagnostic performances (sensitivity and specificity of 80–90%) than when the markers were analyzed alone [41,42]. However, it remains difficult to distinguish AD from other forms of dementia, such as Lewy body dementia and vascular dementia [43]. At a plasma level, biomarker discovery has so far been limited to pilot studies. For example, measurements of plasma Aβ were contradictory, possibly due to its hydrophobicity, which makes it prone to plasma protein binding, resulting in inaccurate measurements [44].
Glycosylation is a protein post-translational modification that is essential for cell–cell recognition processes, cell differentiation and development, immune response, secretion and protein processing and folding [45,46,47]. Glycans are modulated in many inborn and acquired diseases, such as congenital disorders of glycosylation, infections, immune reactions or even in the development or detection of cancer [48,49,50,51,52]. A correlation was already established between glycome profiles of the brain and biochemical modifications of the corresponding glycosyltransferases in the context of neurological diseases such as AD [53,54,55,56,57]. A decrease in sialyltransferase levels and activity were reported in patients with AD [56,57,58]. In addition, increased expression of N-acetylglucosaminyltransferase III (GnT-III), the enzyme responsible for bisection [54], correlated with increased levels of bisecting GlcNAc in CSF [59].
Due to the growing prevalence of Alzheimer’s disease and the rising interest in reliable biomarkers for the early diagnosis of the disease, we evaluated the glycoprotein glycome as a possible source of biomarkers. In recent years, several groups have established analytical workflows designed to analyze N-glycome in CSF [60,61,62]. Interestingly, Fogli et al. and Goyallon et al. reported a permethylated glycan structure at m/z 1601. Goyallon and coworkers [60] showed using ion trap tandem mass spectrometry (MS) that this signal corresponded to Neu5Ac3Hex1HexNAc1, suggesting the presence of free-glycans in the CSF samples. In other words, non-covalently attached glycans derived from glycoproteins are present in CSF. The occurrence of free-glycans has been well described for serum [63,64], urine [65,66,67], and seminal plasma [68], but not for CSF so far. This is why we developed a multi-step workflow to examine the entire glycoprotein N-, O- and free-glycome from CSF and plasma using a large cohort composed of 262 patients (Alzheimer’s, other types of dementia and healthy controls). Our aims were, first, to study the free-glycans in detail and then to propose sets of glycans as biomarkers for AD that were modulated differently in controls or in the other types of dementia.

2. Materials and Methods

2.1. Materials

Trypsin, sodium dihydrogen phosphate monohydrate, di-sodium hydrogen phosphate dihydrate, 1,4-dithioerythritol (DTE), 2-iodoacetamide (IAA), sodium borohydride, Dowex 50WX8 ion exchange resins, sodium hydroxide (NaOH), iodomethane, sDHB (9:1 mixture of 2,5-dihydroxybenzoic acid and 2-hydroxy-5-methoxy benzoic acid) and dextran were purchased from Merck (Taufkirchen, Germany). Acetonitrile (ACN) and anhydrous dimethyl sulfoxide (DMSO) were purchased from VWR International GmbH (Dresden, Germany). Trifluoroacetic acid (TFA) and acetic acid were purchased from Thermo Fisher Scientific (Schwerte, Germany). Peptide N-glycosidase F (PNGase F) was purchased from N-Zyme Scientifics (Doylestown, PA, USA). Methanol (MeOH) was purchased from Carl Roth GmbH + Co. KG (Karlsruhe, Germany). Milli-Q grade water was produced using a MilliQ Plus water purification system (Merck KGaA, Darmstadt, Germany). All the reagents were obtained in p.a. quality.

2.2. Patient Population

The patient populations used in this study consisted of 89 patients with AD, 86 disease control patients (patients diagnosed with frontotemporal dementia, dementia with Lewy bodies or Parkinson’s dementia) and 87 healthy controls (fully characterized healthy controls with no cognitive concerns). The Ethics Committee of the Charité—Universitätsmedizin Berlin, Germany (EA4/175/16 and EA4/066/17) approved the use of the samples.

2.3. Sample Collection and Characterization

CSF was collected and analyzed according to a standardized protocol [69]. Briefly, 12 mL of CSF was collected into polypropylene tubes. Immediately after collection, the tubes were gently shaken and centrifuged (room temperature, 2000× g, 10 min), aliquoted (500 µL), frozen within 30 min and stored at −80 °C. To quantify Aβ peptides in CSF, the Lumipulse® G β -Amyloid 1–42 and Lumipulse® G β -Amyloid 1–40 assays (Fujirebio Germany GmbH, Hannover, Germany) were used. For total (t-)tau and phosphorylated (p-)tau quantification, the Lumipulse® G Total Tau and Lumipulse® G p-Tau 181 assays (Fujirebio Germany GmbH, Hannover, Germany) were used, respectively. All the measurements were carried out fully automatically on the LUMIPULSE® G600II instrument. Under these conditions, the following CSF biomarker values were rated as indicative of AD: Aβ (1–42) < 680 pg/mL, Aβ (1–42)/Aβ (1–40) ratio < 0.055, t-tau > 400 pg/mL and p-tau > 62 pg/mL. Patient diagnosis was performed using a combination of MMSE scoring, brain imaging and CSF parameters (Aβ40, Aβ42, Aβ-ratio, p-tau, t-tau). The patients’ data is summarized in Table 1.

2.4. Isolation and Purification of Free-Glycans

Aliquots of 100 µL CSF were used for glycome analysis. Samples were enzymatically digested with trypsin (15 µg) immediately after thawing. Overnight incubations were performed at 37 °C for at least 16 h. The following day, trypsin was heat-inactivated for 5 min at 95 °C and samples were acidified with trifluoroacetic acid (TFA) to a final concentration of 0.1%. Free-glycans were isolated from CSF using reversed-phase C4 solid-phase extraction cartridges (Macherey-Nagel, Düren, Germany). Cartridges were pre-equilibrated according to the manufacturer’s instructions. After equilibration, acidified samples were added, and cartridges were washed three times with 0.1% TFA. The sample flow-through, containing free-glycans, was collected and subsequently desalted on Supelclean ENVI-Carb solid-phase extraction cartridges (Sigma-Aldrich Chemie, Hamburg/Taufkirchen, Germany). Afterwards, free-glycan samples were gradually eluted with 25% and 50% aqueous acetonitrile (ACN) containing 0.1% TFA and dried under reduced atmospheric pressure by using a centrifugal vacuum concentrator [70].

2.5. N-Glycan Release and Purification

Glycopeptides bound to the C4 cartridges were gradually eluted using 25%, 50% and 80% aqueous ACN containing 0.1% TFA and subsequently dried under reduced atmospheric pressure as well. Dried samples were dissolved in 200 mM phosphate buffer (pH 6.5), reduced with 200 mM DTE at 60 °C for 45 min and alkylated with 200 mM IAA at room temperature for 1 h in the dark. The reaction was terminated using 200 mM DTE. Samples were diluted with Milli-Q water and 200 mM phosphate buffer. PNGase F (1 μg/sample) was added to release N-glycans and the reaction mixture was incubated overnight at 37 °C. N-Glycans were isolated from peptides, desalted, and dried as previously described in 2.4 for free-glycans.

2.6. O-Glycan Release and Purification

De-N-glycosylated peptides eluted from the C4 cartridges during N-glycan purification were dried in a vacuum concentrator. Then, samples were resuspended with 1 M sodium borohydride in 0.1 M NaOH. Chemical release of O-glycans was allowed to proceed overnight at 45 °C. The next day, samples were placed on ice and 10% aqueous acetic acid was added until gas development stopped (pH-value ≤ 4). O-Glycans were isolated using C18 solid-phase extraction cartridges (Sigma-Aldrich Chemie, Hamburg/Taufkirchen, Germany) filled with Dowex 50WX8 ion exchange resins in H+ form. Prior to that, C18 cartridges were pre-equilibrated with 100% MeOH. Afterwards, Dowex was added and the cartridges were washed three times with MeOH and 10% aqueous acetic acid. After adding the samples, the resulting flow-through and three washing fractions, containing O-glycans, were collected. O-Glycan samples were dried under reduced atmospheric pressure using a centrifugal vacuum concentrator. Salts were finally evaporated by adding 500 μL MeOH and then drying the sample in a vacuum concentrator. This step was repeated five times.

2.7. Permethylation

Permethylation was carried out according to standard protocols [71,72]. Briefly, glycan samples were permethylated using freshly prepared NaOH/DMSO suspension (~0.2 g NaOH per mL of DMSO) and iodomethane. Finally, the reaction was stopped by addition of chloroform. The organic phase was washed with water several times until the pH of the water phase became neutral. The inorganic phase was evaporated under a reduced atmosphere. Finally, samples were dissolved in 75% aqueous ACN for MALDI-TOF measurements.

2.8. Mass Spectrometry

Each glycan sample (1 μL) was mixed on target with 1 μL matrix (5 μg/μL sDHB in 10% aqueous ACN). The mixture was allowed to dry at room temperature. MALDI-TOF-MS spectra were acquired in positive reflector mode on an Ultraflex III mass spectrometer (Bruker Daltonics, Bremen, Germany), equipped with a Smartbeam laser (337 nm) and a LIFT-MS/MS facility. Calibration was performed using a glucose ladder. In total, 5000 laser shots were accumulated for each mass spectrum. Spectra for free-glycan and O-glycan analyses were recorded in the mass range of 0–3000 Da, whereas a mass range of 1000–5000 Da was used for N-glycans. Collision-induced dissociation was performed using a collision energy of 29 kV. LIFT spectra consisted of at least 2500 laser shots. FlexAnalysis version 3.4 (Bruker Daltonics, Bremen, Germany) was used for baseline correction and peak picking. Glycan structures were annotated using GlycoPeakfinder [73] and assigned glycan structures were generated with the GlycoWorkbench software version 2.1 [74,75]. Relative areas were determined for all glycan structures in all the samples.

2.9. Statistical Analysis

Statistical analysis was performed using SPSS version 27 (IBM, Armonk, NY, USA). Before a comprehensive statistical analysis was conducted, a two-way analysis of variance was carried out to assess whether the datasets were gender-dependent (Supplementary Material Tables S1–S3). This was the case for N-glycans and O-glycans but not for free-glycans. Then, a one-sample Shapiro–Wilk test was carried out to estimate the distribution normality. Due to a skewed distribution between the groups, non-parametric tests were used for the following analysis. A Mann–Whitney U test was used when comparing two groups and a Kruskal–Wallis one-way analysis of variance was used when comparing the three disease groups. p-values ≤ 0.05 were considered as statistically significant and p-values ≤ 0.01 as highly significant. Receiver operating characteristic curves were built with a 95% confidence interval. The correlations between the glycans, patient- and CSF-parameters were assessed using the Spearman’s rank correlation coefficient.

3. Results

Aiming at defining a set of glycan biomarkers specific to Alzheimer’s disease, we present here a comprehensive study of the free-, N- and O-glycans in the CSF and plasma. For this purpose, a total of 262 CSF and plasma samples from the same patients were analyzed by MALDI-TOF-MS.

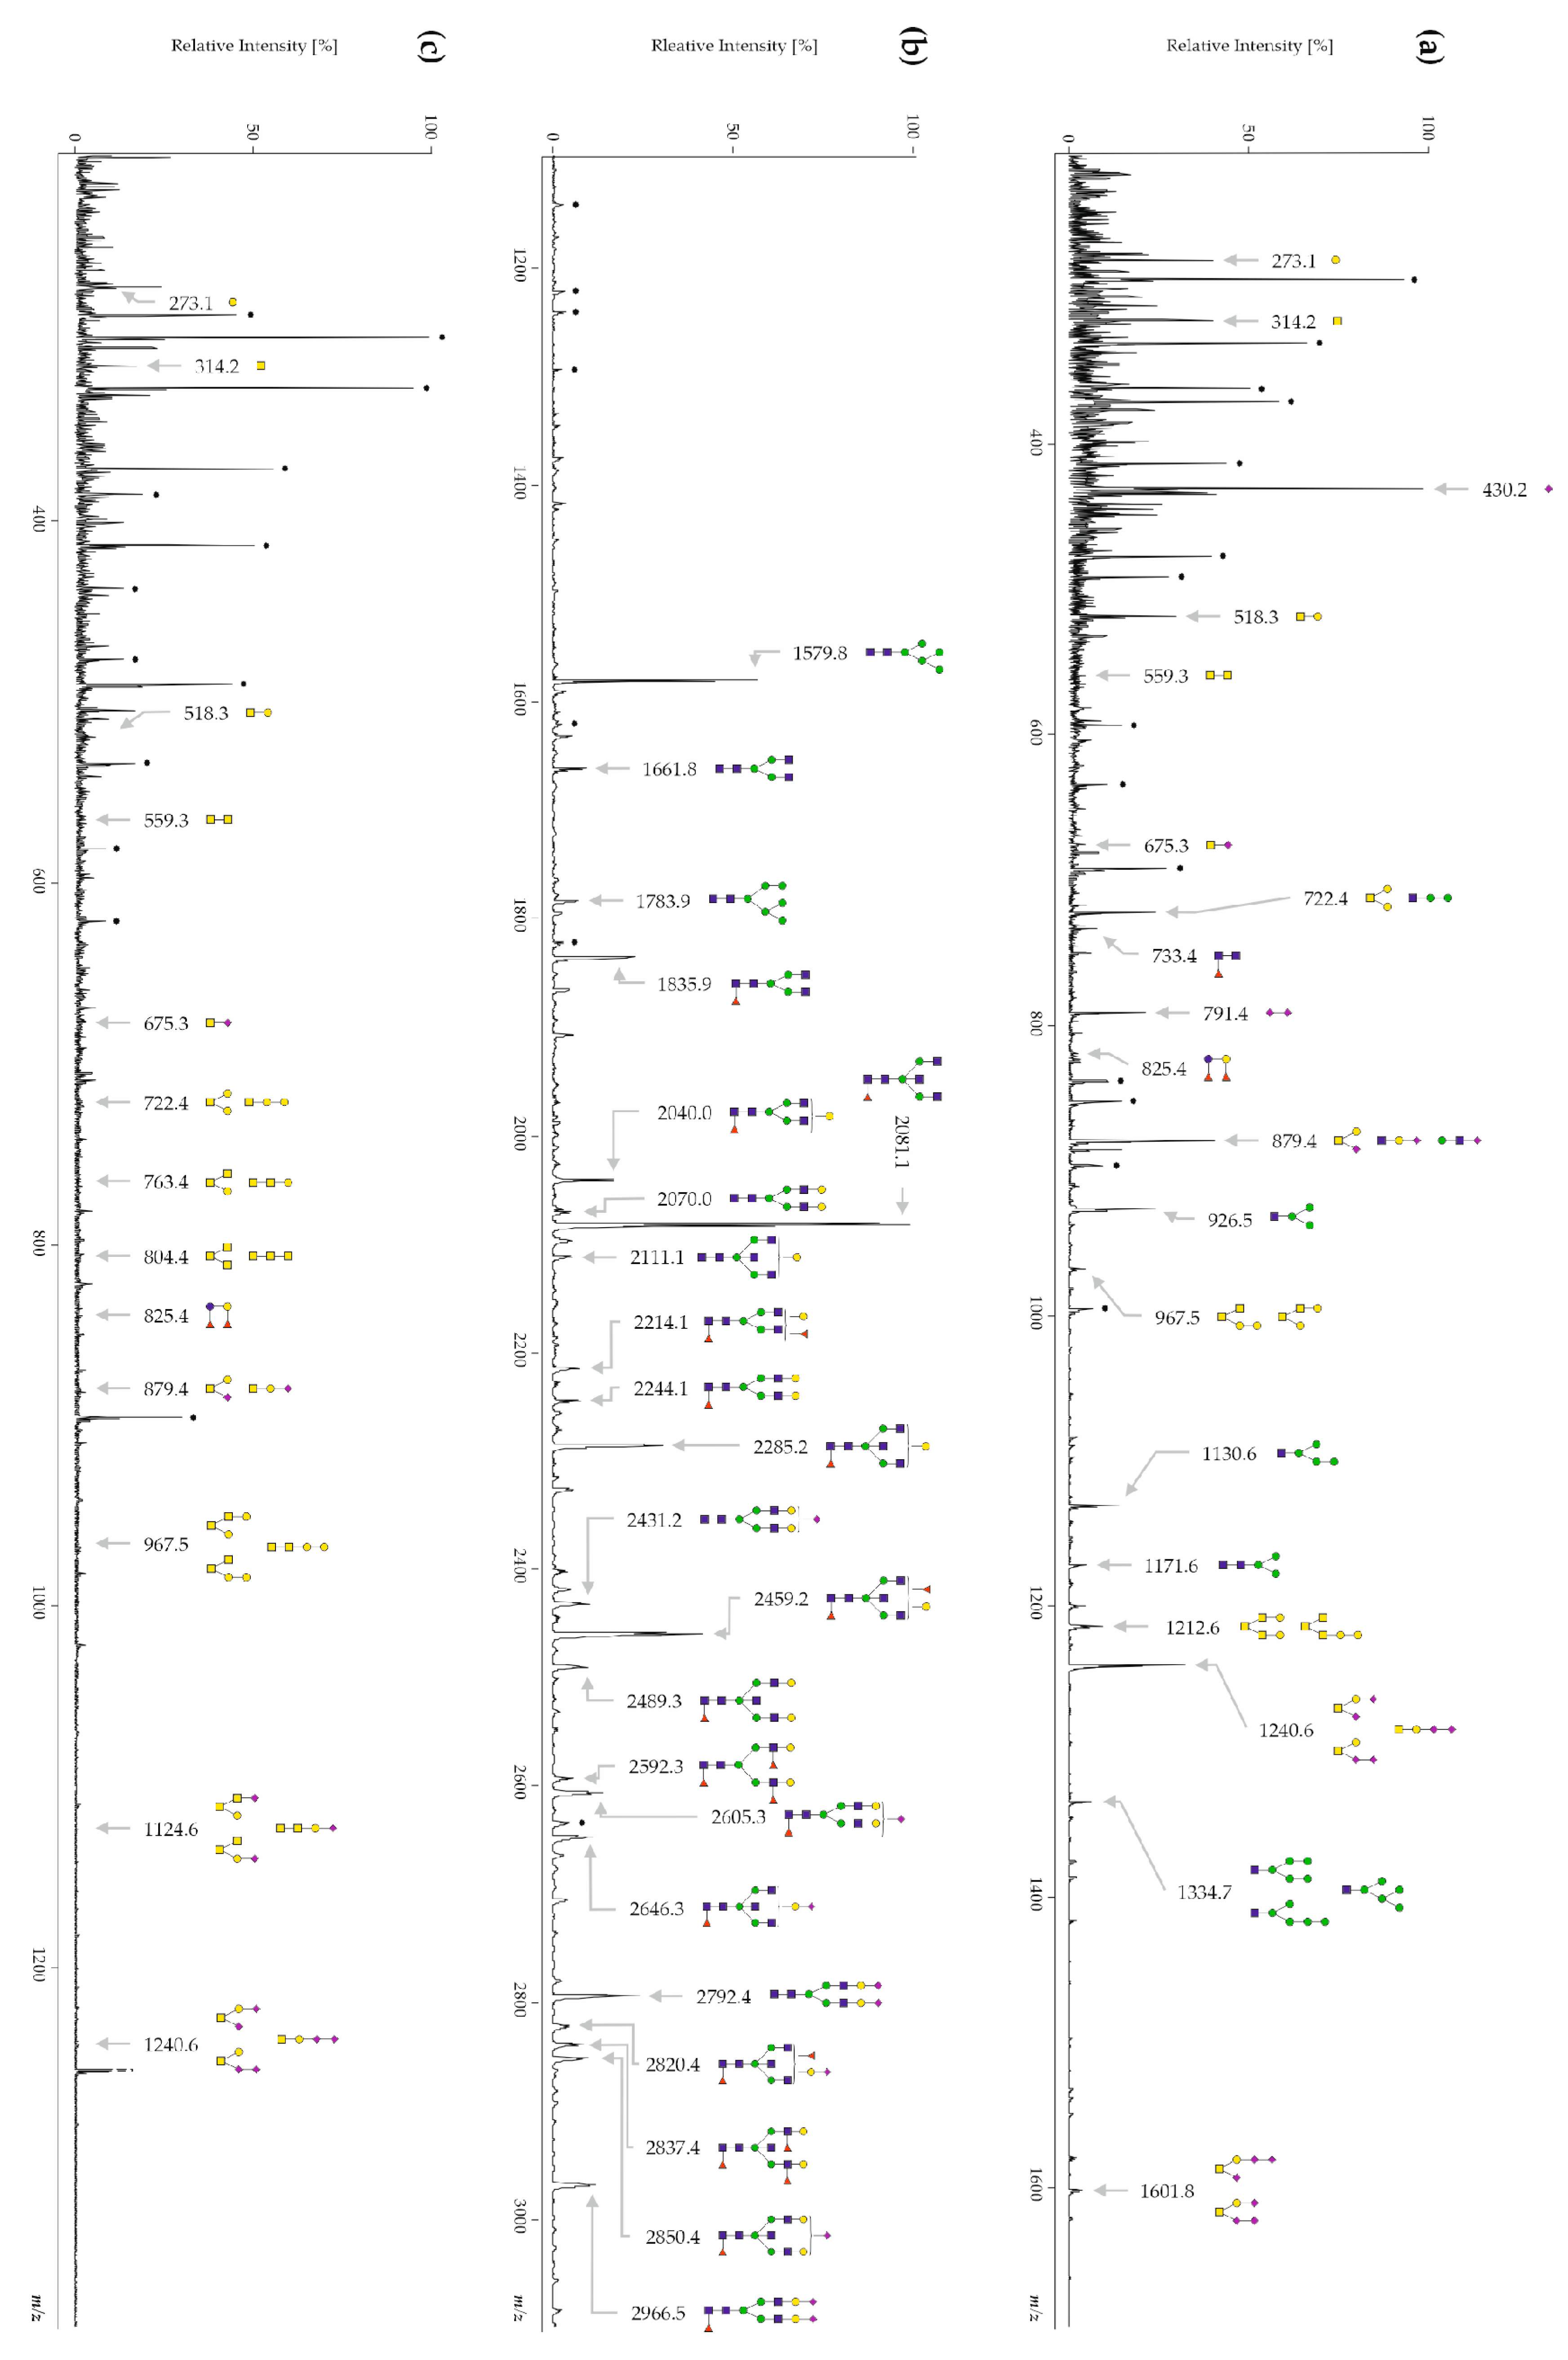
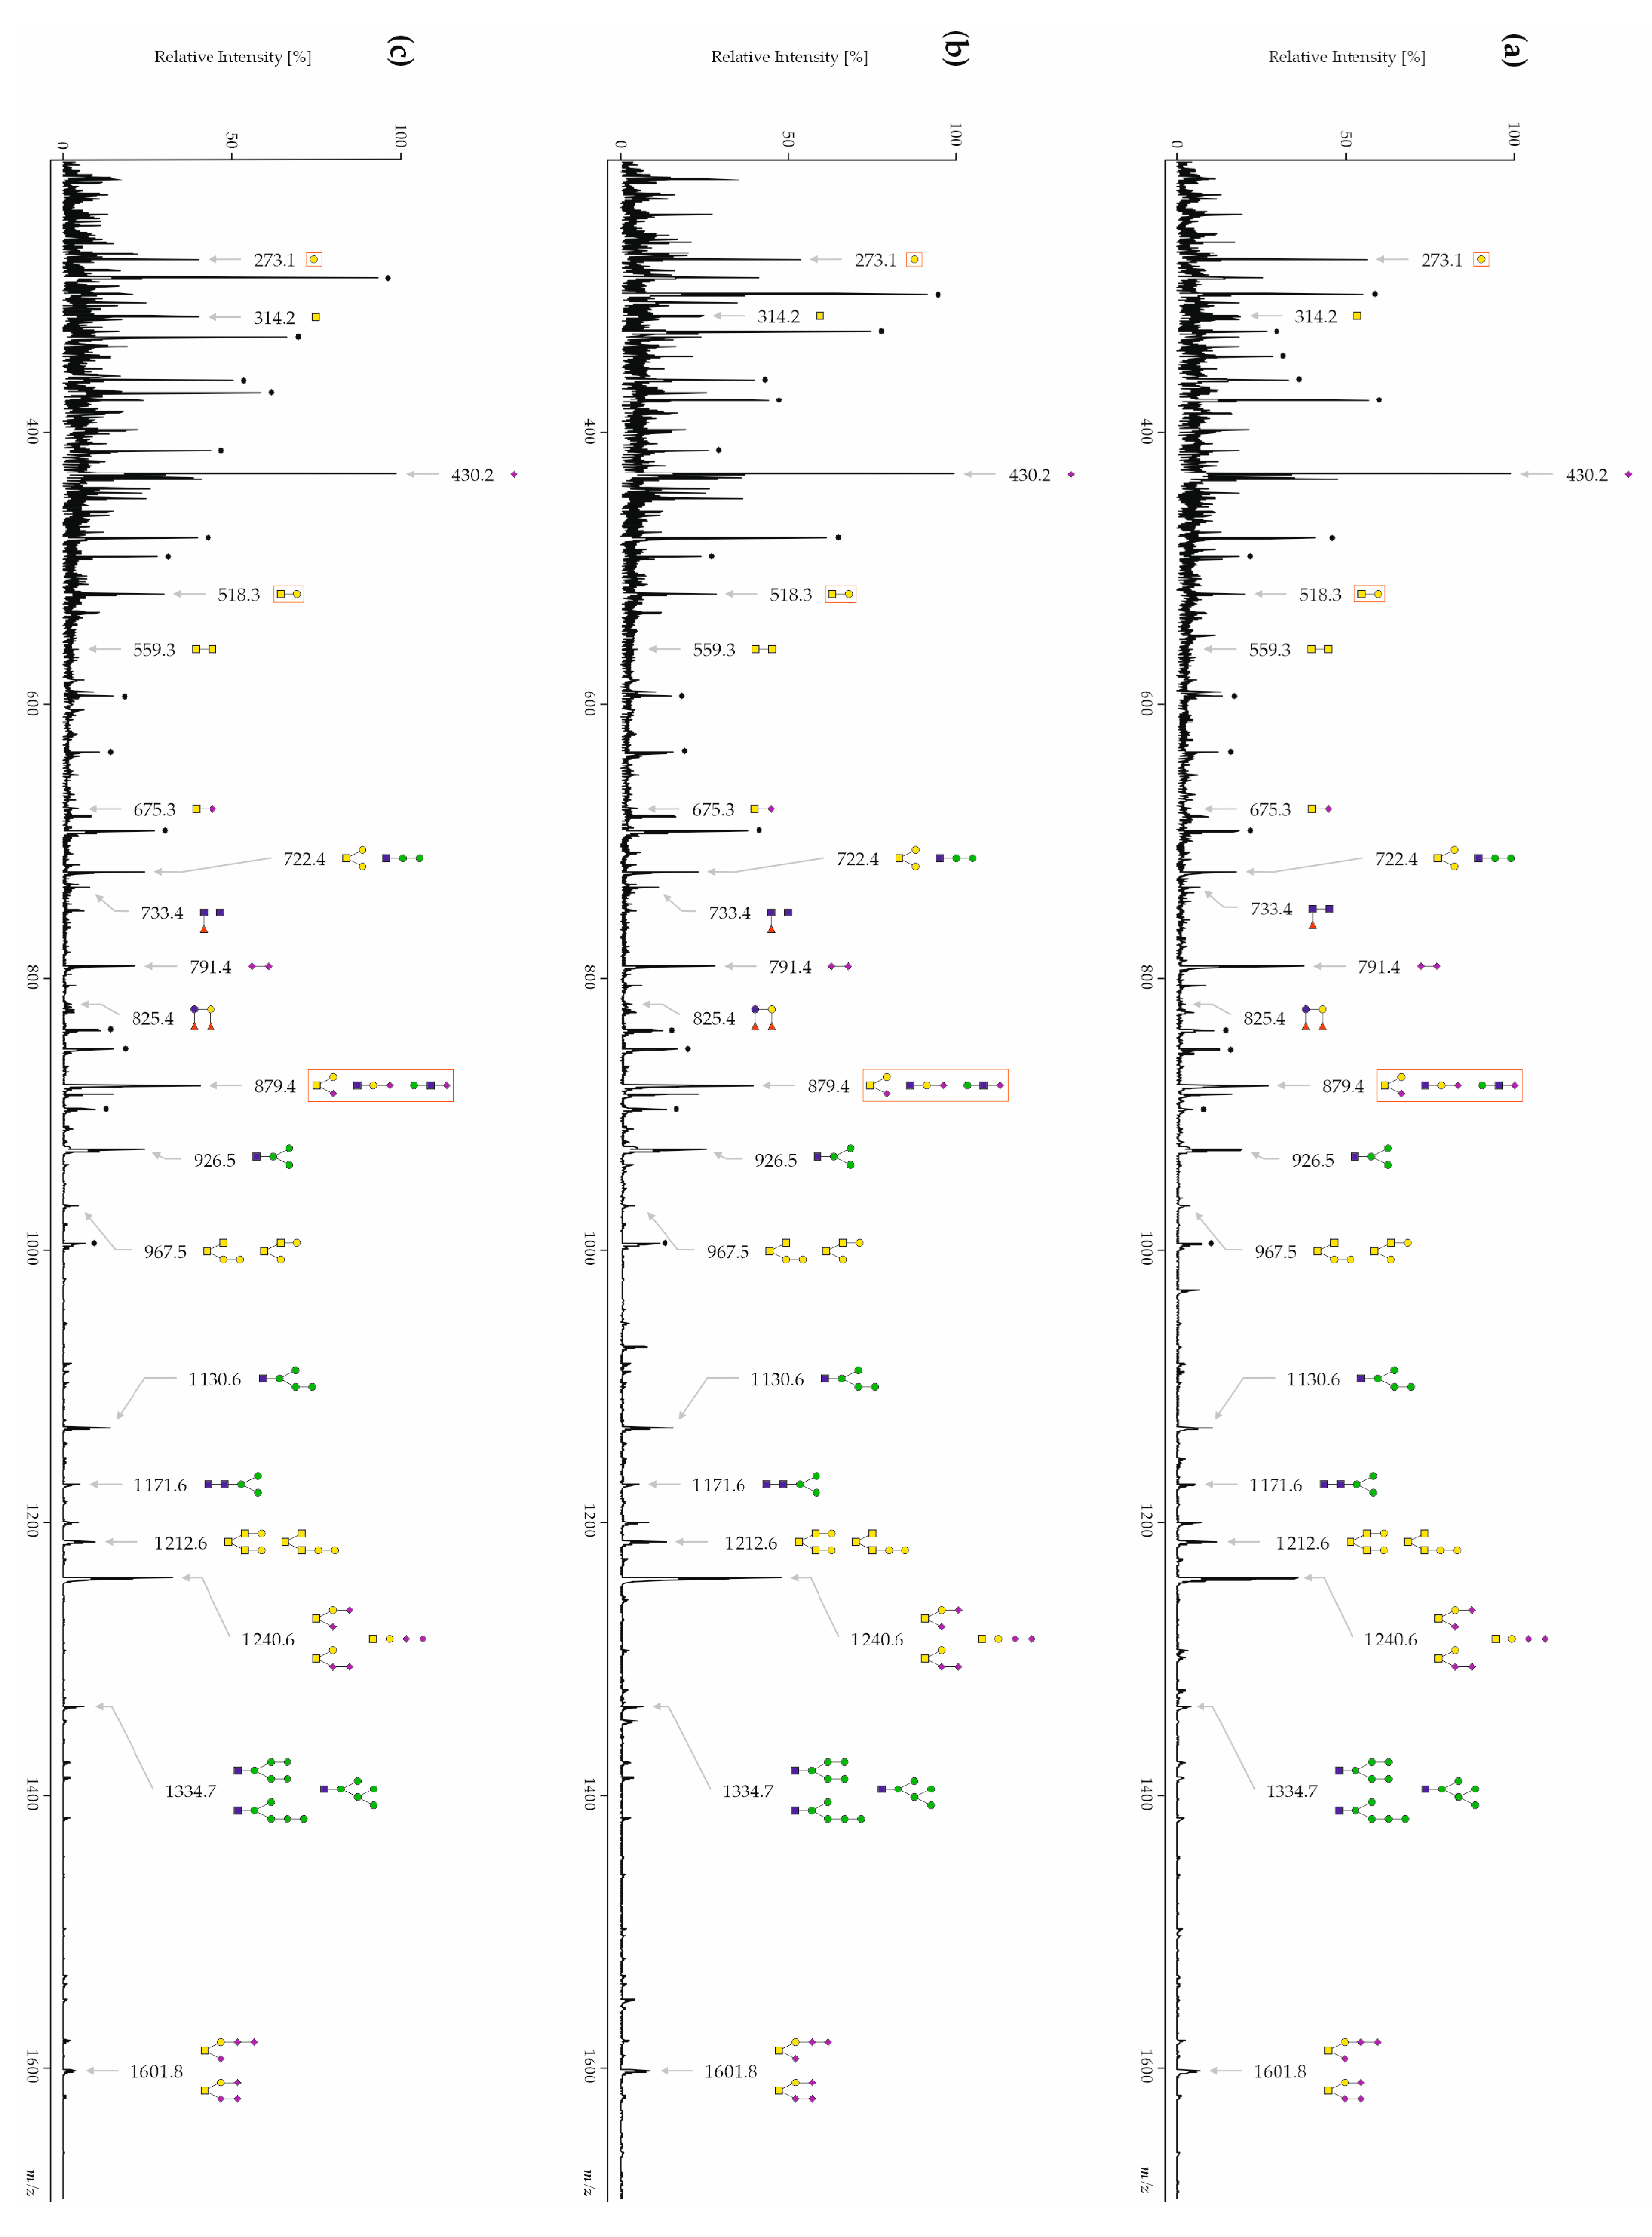
3.1. Human CSF Contains Free-, N- and O-Glycans

A tryptic digestion of CSF samples was performed prior to the separation of free-glycans from glycoproteins via C4 cartridges in order to increase protein recovery. In our hands, protein recovery was extremely low when native CSF glycoproteins were applied directly to C4 cartridges or if a protein denaturation was performed prior to the C4 purification. Free-glycans, which did not bind to C4 cartridges, were collected in the flow-through and desalted using graphite cartridges. Subsequently, they were permethylated and then measured by MALDI-TOF-MS in the positive ionization mode. Measurements in the negative reflector mode did not lead to any signals. An exemplary MALDI-TOF mass spectrum is shown in Figure 1a. The results indicate that a total 19 free-glycans were detected in the mass range of m/z 0–3000 Da: two signals correspond to the free sialic acids Neu5Ac1 (m/z 430.1) and Neu5Ac2 (m/z 791.4), five signals correspond to N-glycans with an intact reducing end or with a truncated reducing end (Fuc1HexNAc2m/z 733.4, Hex3HexNAc1m/z 926.5, Hex4HexNAc1 m/z 1130.6, Hex3HexNAc2 m/z 1171.6 and Hex5HexNAc1m/z 1334.7) and five signals coincide with O-glycans (Fuc2Hex2m/z 825.4, Hex2HexNAc2m/z 967.5, Hex2HexNAc3m/z 1212.6, Neu5Ac2Hex1HexNAc1m/z 1240.6 and Neu5Ac3Hex1HexNAc1m/z 1601.8). The other seven signals (Hex1m/z 273.1, HexNAc1m/z 314.2, Hex1HexNAc1m/z 518.3, HexNAc2m/z 559.3, Neu5Ac1HexNAc1m/z 675.3, Hex2HexNAc1m/z 722.4 and Neu5Ac1Hex1HexNAc1m/z 879.4) were assigned to glycans but could not be precisely assigned to N- or O-glycans because their fragmentation patterns suggested several underlying structures and/or the obtained fragments could correspond to both N- and O-glycan structures (Supplementary Material Figure S1).
CSF glycopeptides, eluted from the C4 cartridges, were reduced, alkylated and digested with PNGase F to release all the N-glycans. After C4 and graphite purification, N-glycan samples were subsequently permethylated and measured by MALDI-TOF-MS in positive reflector mode. An exemplary MALDI-TOF mass spectrum is shown in Figure 1b. A total of 64 N-glycan signals were detected in the mass range of m/z 1000–3000 (Supplementary Table S4). The two N-glycans detected at m/z 1579.8 and 1783.9 correspond to the high-mannose structures Hex5HexNAc2 and Hex6HexNAc2, respectively. Eleven MS signals correspond to complex-type biantennary N-glycans and are partially fucosylated and/or sialylated: m/z 1661.8 (Hex3HexNAc4), m/z 1835.9 (Fuc1Hex3HexNAc4), m/z 2040.0 (Fuc1Hex4HexNAc4), m/z 2070.0 (Hex5HexNAc4), m/z 2214.1 (Fuc2Hex4HexNAc4), m/z 2244.1 (Fuc1Hex5HexNAc4), m/z 2431.2 (Neu5Ac1Hex5HexNAc4), m/z 2592.3 (Fuc3Hex5HexNAc4), m/z 2605.3 (Neu5Ac1Fuc1Hex5HexNAc4), m/z 2792.4 (Neu5Ac2Hex5HexNAc4) and m/z 2966.5 (Neu5Ac2Fuc1Hex5HexNAc4). Based on previous studies of CSF N-glycans [76,77,78], the following MS signals were assigned to bisecting N-glycan structures: m/z 2081.1 (Fuc1Hex3HexNAc5), m/z 2111.1 (Hex4HexNAc5), m/z 2285.2 (Fuc1Hex4HexNAc5), m/z 2459.2 (Fuc2Hex4HexNAc5), m/z 2489.3 (Fuc1Hex5HexNAc5), m/z 2646.3 (Neu5Ac1Fuc1Hex4HexNAc5), m/z 2820.4 (Neu5Ac1Fuc2Hex4HexNAc5), m/z 2837.4 (Fuc3Hex5HexNAc5) und m/z 2850.4 (Neu5Ac1Fuc1Hex5HexNAc5). The above-mentioned N-glycan signals were analyzed by MALDI-TOF/TOF-MS (Supplementary Material Figure S2). After elution from the C4 cartridges, O-glycans were cleaved chemically from the de-N-glycosylated peptides using sodium borohydride. C18 cartridges filled with Dowex ion-exchange resins were used for the separation of O-glycans from de-O-glycosylated peptides. All the O-glycan samples were subsequently permethylated and measured by MALDI-TOF-MS in positive reflector mode. An exemplary MALDI-TOF mass spectrum is shown in Figure 1c. In this study, 13 O-glycan structures were detected in the mass range of m/z 0–3000, but MS signals were too low to generate MS/MS spectra. The detected O-glycans are composed of up to four monosaccharides and are partly sialylated. The monosaccharides Hex1 and HexNAc1 were detected at m/z 273.1 and 314.2, respectively. The signals at m/z 518.3, 559.3 and 675.3 correspond to the disaccharides Hex1HexNAc1, HexNAc2 and Neu5Ac1HexNAc1, respectively. The identified trisaccharides were Hex2HexNAc1 (m/z 722.4), Hex1HexNAc2 (m/z 763.4), HexNAc3 (m/z 804.4) and Neu5Ac1Hex1HexNAc1 (m/z 879.4). The tetrasaccharides consisted of Fuc2Hex2 (m/z 825.4), Hex2HexNAc2 (m/z 967.5), Neu5Ac1Hex1HexNAc2 (m/z 1124.6) and Neu5Ac2Hex1HexNAc1 (m/z 1240.6).

3.2. Inter-Day Reproducibility of Free-, N- and O-Glycans

Before applying the protocol to the cohort of patients with AD, the inter-day reproducibility was verified by analyzing the same CSF sample in triplicate on three consecutive days. The results are presented in Supplementary Material. The mean coefficients of variation for free-glycans were between 2.6 and 6.5 (Figure S3a), for N-glycans between 3.5 and 7.4 (Figure S3b) and for O-glycans between 3.3 and 7.7 (Figure S3c). All the values indicate the reproducibility of the applied method.

3.3. The Glycan Profiles of Patients with AD Differ Significantly from Healthy Controls and Other Types of Dementia

The patient cohorts consisting of 89 patients with AD, 86 patients suffering either from other types of dementia and 87 healthy controls were analyzed using the previously-mentioned reproducible workflow.

3.3.1. CSF Free-Glycans

Relative intensities were determined for each glycan signal, and mean values and standard deviations are presented in Table 2. The glycan profiles of each patient group were compared between each other using the Kruskal–Wallis one-way analysis of variance as well as the Mann–Whitney U test. An upregulation of the free-glycan Hex1 (m/z 273.1) as well as a downregulation of Hex1HexNAc1 (m/z 518.3) and Neu5Ac1Hex1HexNAc1 (m/z 879.4) was observed in AD patients (Figure 2a) when compared with disease control patients (Figure 2b) and with healthy controls (Figure 2c). Patients with AD and disease control patients had significant statistical differences in 13 structures, whereas patients with AD and healthy controls had significant statistical differences in 14 glycan structures (Table 2). Interestingly, disease control patients and healthy controls also had statistical differences in six glycan structures (Table 2) and four of them could discriminate patients from each group: HexNAc2 (m/z 559.3), Neu5Ac1HexNAc1 (m/z 675.3), Hex2HexNAc1 (m/z 722.4) and Neu5Ac1Hex1HexNAc1 (m/z 879.4).
ROC curves were built for the free-glycans that were of statistical significance, and the results are summarized in Supplementary Material Table S5. Interestingly, for both Hex1 and HexNAc1Hex1Neu5Ac1, it was possible to discriminate AD patients from healthy controls (area under the curve (AUC) 0.85 and 0.21) and AD patients from disease control patients (AUC 0.76 and 0.30). In addition, Hex1 and HexNAc1Hex1Neu5Ac1 correlated with the following CSF parameters: Aβ40, Aβ42, p-tau and t-tau (Supplementary Material Table S6). As AD patients and healthy controls had a mean age difference of about 10 years, we investigated any possible age correlation of the glycan biomarkers and verified the absence of such correlation (Supplementary Material Table S6).

3.3.2. CSF N-Glycans

One-way ANOVA test showed gender-related statistical changes in the CSF N-glycome of the present cohorts (Supplementary Material Table S2). Therefore, the data was split according to gender prior to statistical analysis (Supplementary Material Table S7). A total of 18 N-glycans showed statistical differences between the three study cohorts (Table 3). The high-mannose N-glycans Hex5HexNAc2 (m/z 1579.8) and Hex6HexNAc2 (m/z 1783.9) were able to discriminate patients with AD and patients suffering from other types of dementia from healthy controls in male patients. In addition, complex-type biantennary N-glycans were also of statistical relevance. Interestingly, although many differences were gender-specific, the bifucosylated bisected biantennary N-glycan at m/z 2459.2 could statistically differentiate the three study cohorts from each other for both genders. In addition, the two sialylated N-glycans Neu5Ac1Fuc1Hex5HexNAc4 (at m/z 2605.3) and Neu5Ac1Fuc1Hex4HexNAc5 (at m/z 2646.3) could discriminate patients with AD from controls and patients with other forms of dementia for both genders.

3.3.3. CSF O-Glycans

O-Glycans were detected as traces (Figure 1c), while non-carbohydrate contaminants were abundantly ionized. Relative areas of O-glycans from the three cohorts are shown in Supplementary Material Table S8. AD patients had significant statistical differences in eight O-glycan structures from disease control patients and in 11 O-glycan structures from healthy controls. Interestingly, disease control patients and healthy controls had significant statistical differences in all the structures at a significance level of p ≤ 0.01, and at a lower significance (p ≤ 0.05), at m/z 273.1 (female) and at m/z 1124.6 (male, p ≤ 0.05).

3.4. The Sialic Acid Content Is Significantly Decreased in Free-Glycan Fragments and O-Glycans from Patients with AD

Free- and N-glycans were combined according to their features (glycan types, sialylation, bisection, etc.) and their corresponding relative areas were summed up in order to identify the glycome features that were specific to only patients with AD (Figure 3a). The free-glycans were subgrouped into N-glycans (m/z 733.4, 926.5, 1130.6, 1171.6, 1334.7), O-glycans (m/z 825.4, 967.5, 1212.6, 1240.6, 1601.8), N- or O-glycan fragments (m/z 273.1, 314.2, 518.3, 559.3, 675.3, 722.4, 879.4) and free sialic acids (m/z 430.2, 791.4). Patients with AD, as well as patients with other types of dementia, had significantly less intact N- and O-glycans and more asialylated fragments than healthy controls. Similarly, N-glycan structures were combined into five main groups: high mannose structures (1579.8, 1783.9), biantennary asialylated (1661.8, 1835.9, 2040.0, 2070.0, 2214.1, 2244.1, 2592.3), biantennary sialylated (2431.2, 2605.3, 2792.4, 2966.5), asialylated bisecting structures (2081.1, 2111.1, 2285.2, 2459.2, 2489.3, 2837.4) and sialylated bisecting structures (2646.3, 2820.4, 2850.4). Sialylated biantennary and bisecting biantennary N-glycans were higher in patients with AD than in healthy controls both for the male and female cohorts (Figure 3b,d). As for free-glycan fragments, O-glycan sialylation was decreased in patients with AD compared to disease control patients and healthy controls (Figure 3c).

4. Discussion

This study reports for the first time a comprehensive analysis of free-, N- and O-glycans from CSF using a large cohort of patients with AD. This cohort was not only compared with healthy controls but also with patients with other forms of dementia. In this study, the serum N- and O-glycome from the same patients was also analyzed, but the analysis did not show statistically significant differences amongst the different patient groups and healthy controls. The study results demonstrated the presence of 19 free-glycans in CSF, in addition to 64 N- and 13 O-glycans. This number of N-glycans is in accordance with previous reports [59,78,79,80], in which up to 72 N-glycans were identified by LC-MS and MALDI-TOF-MS. In this work, the many intermediate steps necessary to separately analyze free-, N- and O-glycans are most likely the reason why less N-glycans were detected compared to the number obtained by Cho et al. [59].
CSF free-glycans derived from glycoproteins consisted of complete, truncated N- or O-glycans as well as free monosaccharides. Interestingly, free N-glycans comprised solely high-mannoses bearing one or two GlcNAc at the reducing end. Free-glycans have been reported to be present in various body fluids, including urine [65,66,67], serum [63,64] and seminal plasma [68]. Over 130 free-glycans were reported in the urine of patients with cancer and controls: they were proposed by Hanzawa and coworkers as cancer biomarkers [65]. They consisted of free intact and truncated N-glycans, mucin-type N-glycans as well as small glycans having either lactose or N-acetyl lactosamine cores [65]. In human serum and urine, free N-glycans were comprised solely of neutral and sialylated complex-type N-glycans [63,64,65,66,67]. In rat serum, traces of high-mannose free N-glycans bearing either one or two GlcNAc at the reducing end were detected too [63]. The differences in composition between the different body fluids suggest that the glycobiological degradation processes occurring in the brain are different from the ones occurring in the rest of the body. The exact mechanisms have only been partially studied. Free-glycans are present in the cytosol in mammalian cells before they are transported to the lysosome, where they are degraded [81]. They result from the cleavage of glycoproteins in two ways. They can either be released from the dolichol-linked precursor via the action of an oligosaccharyltransferase in the endoplasmic reticulum [81,82]. Alternatively, N-Glycanase releases glycans from misfolded glycoproteins that are retrotranslocated from the endoplasmic reticulum to the cytosol [83,84]. As the free-glycan biomarkers (Hex1 and HexNAc1Hex1Neu5Ac1) that we proposed correlated with the CSF parameters, AD could be modifying the process of free-glycan formation.
The N-glycan spectra obtained in this work for CSF are comparable with previous studies [59,77]. Similar to the brain N-glycome, they mostly consist of high-mannose, biantennary bisecting core-fucosylated N-glycans [85]. A low degree of sialylation was observed too: about 20% in CSF N-glycans and less than 10% in brain N-glycans [85]. The Alzheimer’s disease profile 1 shown by Palmigiano et al. shows the greatest similarities with our work in terms of intensities and distributions. The most abundant N-glycan in our profile at m/z 2081.1 corresponds to a core-fucosylated bisecting agalactosylated asialylated biantennary N-glycan that was previously identified in human transferrin as “brain-type transferrin” N-glycan, accounting for about 5% of transferrin isoforms [86]. Contrary to “serum-type transferrin”, the major isoform of transferrin in the CSF, “brain-type transferrin”, is synthesized within the brain and does not stem from human blood. The truncation of its galactoses and N-acetyl neuraminic acids was previously observed in rat brain as well [87]. As a result, it was postulated to result from a low expression of β 1,4 galactosyltransferase in the brain [87]. The core-fucosylated agalactosylated asialylated biantennary N-glycan at m/z 2081.1 was also found in other CSF glycoproteins such as β-site APP-cleaving enzyme-1 (BACE1) [88] and prostaglandin D synthetase [76].
The major N-glycans found in the CSF profiles in this work, namely at m/z 2018.1, 2285.2, and 2459.2, contain bisecting GlcNAc, which is a hallmark of neural glycosylation [54,59,77,89,90]. Glycoprotein bisection regulates the function of many key neural proteins via GnT-III [89]. For instance, GnT-III-deficient AD model mice showed that the lack of bisection directs BACE1 to late endosomes/lysosomes, where it is less colocalized with APP. This leads to accelerated lysosomal degradation and reduced amyloid-β (Aβ) accumulation in the brain by suppressing the function of the BACE1, a key Aβ-generating enzyme [88,89]. In parallel, a decrease in Aβ1–40 and Aβ1–42 (Aβ) was measured in vitro in GnT-III-transfected cells [53]. Cell culture experiments indicated that recombinant APP also exhibits core-fucosylated bisecting N-glycans [54]. These N-glycans were shown to have a protective function by preventing the formation of Aβ-peptides [53]. Interestingly, an overexpression of MGAT3, the gene responsible for the expression of GnT-III in the brain of AD patients, was previously reported [54]. This suggests an adaptive response to protect the brain from further β-amyloid production. N-Glycan bisection in CSF has previously been correlated with the tau protein [91]. The tau protein is originally a non-N-glycosylated cytosolic protein in healthy controls that is N-glycosylated in AD, resulting in hyperphosphorylation and aggregation [92,93]. Our data (Supplementary Material Table S10) showed a correlation between tau and bisected N-glycans, which is in line with the findings of Schedin-Weiss et al. [91].
Besides bisection, sialylation is also an important neuronal glycosylation feature. A reduced sialic acid content in free-glycan fragments and O-glycans was found in patients with AD patients compared to healthy patients. This is in line with the decrease in sialyltransferase concentrations measured in the serum of patients with AD compared to control groups as well as in post-mortem AD brains compared with controls [56,57]. BACE-1 is decisively involved in this reduced ST concentration: BACE-1 is not only an APP-processing enzyme but also cleaves β-galactoside α2,6-sialyltransferase (ST6Gal-I), thereby downregulating its transferase activity [55,58,94].

5. Conclusions

For the first time, the complete CSF glycome of patients with AD was examined and compared with controls as well as patients suffering from other types of dementia. In addition, N- and O-glycans were profiled for large cohorts and the study of free-glycans in CSF was a novel aspect of this work. We could show that two of the free-glycans had satisfactory ROC curves, demonstrating the biomarker potential for AD. In connection with this, further experiments need to be carried out to investigate the biomarker potential of free-glycans in more detail. Large-scale studies should be carried out in the form of multi-center studies. Not only should the different genders be taken into account but also other possible influencing factors, such as pre-existing or concomitant diseases, lifestyles, and genetic dispositions, should be considered.

Supplementary Materials

The following supporting information can be downloaded at: https://www.mdpi.com/article/10.3390/biom14050512/s1, Figure S1: MALDI-TOF/TOF mass spectra of the [M + Na]+ molecular ions at m/z (a) 722.4, (b) 825.4, (c) 879.4, (d) 926.5, (e) 967.5, (f) 1130.6, (g) 1171.6, (h) 1212.6, (i) 1240.6, (j) 1334.7 derived from free glycans isolated from CSF. Registered fragments may be formed by different fragmentation pathways, only one of which is depicted in the figure. Green circle, Man; yellow circle, Gal; yellow square, GalNAc; blue square, GlcNAc; red triangle, Fuc; Neu5Ac: pink diamond. Figure S2: MALDI-TOF/TOF mass spectra of the [M + Na]+ molecular ions at m/z. Figure S3: Inter-day reproducibility of the analytical workflow used to prepare. Table S1: Two-way analysis of variance (ANOVA) to assess any statistical significance of gender in the dataset of freeglycans. Table S2: Two-way analysis of variance (ANOVA) to evaluate the statistical significance of gender in the dataset of Nglycans. Table S3: Two-way analysis of variance (ANOVA) to evaluate the statistical significance of gender in the dataset of Oglycans. Table S4: N-Glycans detected in this study by MALDI-TOF-MS. Table S5: ROC curves were generated for free glycans using 89 patients with AD. 86 disease control patients and 87 healthy control patients. Table S6: Correlations were calculated between the free glycans Hex1 (m/z 273.1), HexNAc1Hex1Neu5Ac1 (m/z 879.4) and CSF parameters using the using the Spearman’s rank correlation coefficient. Table S7: Mean relative areas and standard deviations of N-glycans isolated from the three patient cohorts as judged by MALDI-TOF-MS. Table S8: Mean relative areas and standard deviations of O-glycans isolated from the three patient cohorts as judged by MALDI-TOF-MS. Table S9: Glycan types and Glycosylation features used to generate the mean relative intensities presented in Figure 3. Table S10: Correlations were calculated between N-glycans groups by features and t-Tau using the Spearman´s rank.

Author Contributions

Conceptualization, V.B., C.G.S. and O.P.; methodology, L.K. and K.B.; investigation, L.K., B.K., L.-S.S. and K.B.; data curation, L.K.; writing—original draft preparation, L.K. and V.B.; writing—review and editing, L.K., K.B., C.G.S., B.K., L.-S.S. and O.P.; funding acquisition, C.G.S., O.P. and V.B. All authors have read and agreed to the published version of the manuscript.

Funding

This research was financially supported by the German Research Foundation (grant numbers BL-1436/2-1 and PE-1878/3-1) and the Sonnenfeld Foundation (grant for equipment). We acknowledge the financial support from the Open Access Publication Fund of Charité—Universitätsmedizin Berlin and the German Research Foundation (DFG).

Institutional Review Board Statement

The Ethics Committee of the Charité—Universitätsmedizin Berlin, Germany (EA4/175/16 and EA4/066/17) approved the use of the samples.

Informed Consent Statement

Informed consent was obtained from all subjects involved in the study. The signature of a legally authorized representative is obtained for the persons in advanced stages of AD that were unable to give informed consent.

Data Availability Statement

The datasets generated for this study are available on request to the corresponding author.

Conflicts of Interest

C.G.S. is an employee of Predemtec AG.

References

  1. Gilbert, B.J. The role of amyloid beta in the pathogenesis of Alzheimer’s disease. J. Clin. Pathol. 2013, 66, 362–366. [Google Scholar] [CrossRef] [PubMed]
  2. Available online: https://www.alzint.org/resource/world-alzheimer-report-2023/ (accessed on 10 May 2023).
  3. Winblad, B.; Amouyel, P.; Andrieu, S.; Ballard, C.; Brayne, C.; Brodaty, H.; Cedazo-Minguez, A.; Dubois, B.; Edvardsson, D.; Feldman, H.; et al. Defeating Alzheimer’s disease and other dementias: A priority for European science and society. Lancet Neurol. 2016, 15, 455–532. [Google Scholar] [CrossRef] [PubMed]
  4. Jeremic, D.; Jimenez-Diaz, L.; Navarro-Lopez, J.D. Past, present and future of therapeutic strategies against amyloid-beta peptides in Alzheimer’s disease: A systematic review. Ageing Res. Rev. 2021, 72, 101496. [Google Scholar] [CrossRef] [PubMed]
  5. McLaurin, J.; Yang, D.; Yip, C.M.; Fraser, P.E. Review: Modulating factors in amyloid-beta fibril formation. J. Struct. Biol. 2000, 130, 259–270. [Google Scholar] [CrossRef] [PubMed]
  6. Yuzwa, S.A.; Vocadlo, D.J. O-GlcNAc modification and the tauopathies: Insights from chemical biology. Curr. Alzheimer Res. 2009, 6, 451–454. [Google Scholar] [CrossRef] [PubMed]
  7. Balana, A.T.; Pratt, M.R. Mechanistic roles for altered O-GlcNAcylation in neurodegenerative disorders. Biochem. J. 2021, 478, 2733–2758. [Google Scholar] [CrossRef] [PubMed]
  8. Lefebvre, T.; Ferreira, S.; Dupont-Wallois, L.; Bussiere, T.; Dupire, M.J.; Delacourte, A.; Michalski, J.C.; Caillet-Boudin, M.L. Evidence of a balance between phosphorylation and O-GlcNAc glycosylation of Tau proteins—A role in nuclear localization. Biochim. Et Biophys. Acta 2003, 1619, 167–176. [Google Scholar] [CrossRef] [PubMed]
  9. Liu, F.; Iqbal, K.; Grundke-Iqbal, I.; Hart, G.W.; Gong, C.X. O-GlcNAcylation regulates phosphorylation of tau: A mechanism involved in Alzheimer’s disease. Proc. Natl. Acad. Sci. USA 2004, 101, 10804–10809. [Google Scholar] [CrossRef]
  10. Alonso, A.D.; Grundke-Iqbal, I.; Barra, H.S.; Iqbal, K. Abnormal phosphorylation of tau and the mechanism of Alzheimer neurofibrillary degeneration: Sequestration of microtubule-associated proteins 1 and 2 and the disassembly of microtubules by the abnormal tau. Proc. Natl. Acad. Sci. USA 1997, 94, 298–303. [Google Scholar] [CrossRef]
  11. Iqbal, K.; Alonso Adel, C.; Chen, S.; Chohan, M.O.; El-Akkad, E.; Gong, C.X.; Khatoon, S.; Li, B.; Liu, F.; Rahman, A.; et al. Tau pathology in Alzheimer disease and other tauopathies. Biochim. Biophys. Acta 2005, 1739, 198–210. [Google Scholar] [CrossRef]
  12. Rogaev, E.I.; Sherrington, R.; Rogaeva, E.A.; Levesque, G.; Ikeda, M.; Liang, Y.; Chi, H.; Lin, C.; Holman, K.; Tsuda, T.; et al. Familial Alzheimer’s disease in kindreds with missense mutations in a gene on chromosome 1 related to the Alzheimer’s disease type 3 gene. Nature 1995, 376, 775–778. [Google Scholar] [CrossRef] [PubMed]
  13. Sherrington, R.; Rogaev, E.I.; Liang, Y.; Rogaeva, E.A.; Levesque, G.; Ikeda, M.; Chi, H.; Lin, C.; Li, G.; Holman, K.; et al. Cloning of a gene bearing missense mutations in early-onset familial Alzheimer’s disease. Nature 1995, 375, 754–760. [Google Scholar] [CrossRef] [PubMed]
  14. Guerreiro, R.; Brás, J.; Hardy, J. SnapShot: Genetics of Alzheimer’s Disease. Cell 2013, 155, 968–968.e961. [Google Scholar] [CrossRef]
  15. 2023 Alzheimer’s disease facts and figures. Alzheimer’s Dement. 2023, 17, 327–406. [CrossRef]
  16. Ryman, D.C.; Acosta-Baena, N.; Aisen, P.S.; Bird, T.; Danek, A.; Fox, N.C.; Goate, A.; Frommelt, P.; Ghetti, B.; Langbaum, J.B.S.; et al. Symptom onset in autosomal dominant Alzheimer disease: A systematic review and meta-analysis. Neurology 2014, 83, 253–260. [Google Scholar] [CrossRef]
  17. Corder, E.H.; Saunders, A.M.; Strittmatter, W.J.; Schmechel, D.E.; Gaskell, P.C.; Small, G.W.; Roses, A.D.; Haines, J.L.; Pericak-Vance, M.A. Gene dose of apolipoprotein E type 4 allele and the risk of Alzheimer’s disease in late onset families. Science 1993, 261, 921–923. [Google Scholar] [CrossRef]
  18. Jack, C.R., Jr.; Knopman, D.S.; Jagust, W.J.; Petersen, R.C.; Weiner, M.W.; Aisen, P.S.; Shaw, L.M.; Vemuri, P.; Wiste, H.J.; Weigand, S.D.; et al. Tracking pathophysiological processes in Alzheimer’s disease: An updated hypothetical model of dynamic biomarkers. Lancet Neurol. 2013, 12, 207–216. [Google Scholar] [CrossRef]
  19. Hansson, O. Biomarkers for neurodegenerative diseases. Nat. Med. 2021, 27, 954–963. [Google Scholar] [CrossRef]
  20. Dunne, R.A.; Aarsland, D.; O’Brien, J.T.; Ballard, C.; Banerjee, S.; Fox, N.C.; Isaacs, J.D.; Underwood, B.R.; Perry, R.J.; Chan, D.; et al. Mild cognitive impairment: The Manchester consensus. Age Ageing 2021, 50, 72–80. [Google Scholar] [CrossRef]
  21. Caselli, R.J.; Beach, T.G.; Yaari, R.; Reiman, E.M. Alzheimer’s disease a century later. J. Clin. Psychiatry 2006, 67, 1784–1800. [Google Scholar] [CrossRef]
  22. Boeve, B.F.; Maraganore, D.M.; Parisi, J.E.; Ahlskog, J.E.; Graff-Radford, N.; Caselli, R.J.; Dickson, D.W.; Kokmen, E.; Petersen, R.C. Pathologic heterogeneity in clinically diagnosed corticobasal degeneration. Neurology 1999, 53, 795–800. [Google Scholar] [CrossRef] [PubMed]
  23. Boeve, B.F.; Silber, M.H.; Ferman, T.J.; Lucas, J.A.; Parisi, J.E. Association of REM sleep behavior disorder and neurodegenerative disease may reflect an underlying synucleinopathy. Mov. Disord. 2001, 16, 622–630. [Google Scholar] [CrossRef] [PubMed]
  24. Caselli, R.J.; Jack, C.R.; Petersen, R.C.; Wahner, H.W.; Yanagihara, T. Asymmetric cortical degenerative syndromes: Clinical and radiologic correlations. Neurology 1992, 42, 1462–1468. [Google Scholar] [CrossRef] [PubMed]
  25. Caselli, R.J.; Stelmach, G.E.; Caviness, J.N.; Timmann, D.; Royer, T.; Boeve, B.F.; Parisi, J.E. A kinematic study of progressive apraxia with and without dementia. Mov. Disord. 1999, 14, 276–287. [Google Scholar] [CrossRef] [PubMed]
  26. McKeith, I. Dementia with Lewy bodies. Dialogues Clin. Neurosci. 2004, 6, 333–341. [Google Scholar] [CrossRef] [PubMed]
  27. McKeith, I.G.; Dickson, D.W.; Lowe, J.; Emre, M.; O’Brien, J.T.; Feldman, H.; Cummings, J.; Duda, J.E.; Lippa, C.; Perry, E.K.; et al. Diagnosis and management of dementia with Lewy bodies: Third report of the DLB Consortium. Neurology 2005, 65, 1863–1872. [Google Scholar] [CrossRef]
  28. Tang-Wai, D.F.; Graff-Radford, N.R.; Boeve, B.F.; Dickson, D.W.; Parisi, J.E.; Crook, R.; Caselli, R.J.; Knopman, D.S.; Petersen, R.C. Clinical, genetic, and neuropathologic characteristics of posterior cortical atrophy. Neurology 2004, 63, 1168–1174. [Google Scholar] [CrossRef]
  29. Johnson, J.K.; Head, E.; Kim, R.; Starr, A.; Cotman, C.W. Clinical and pathological evidence for a frontal variant of Alzheimer disease. Arch. Neurol. 1999, 56, 1233–1239. [Google Scholar] [CrossRef]
  30. Heurling, K.; Leuzy, A.; Zimmer, E.R.; Lubberink, M.; Nordberg, A. Imaging beta-amyloid using [(18)F]flutemetamol positron emission tomography: From dosimetry to clinical diagnosis. Eur. J. Nucl. Med. Mol. Imaging 2016, 43, 362–373. [Google Scholar] [CrossRef]
  31. Leclerc, B.; Abulrob, A. Perspectives in molecular imaging using staging biomarkers and immunotherapies in Alzheimer’s disease. Sci. World J. 2013, 2013, 589308. [Google Scholar] [CrossRef]
  32. Sabri, O.; Seibyl, J.; Rowe, C.; Barthel, H. Beta-amyloid imaging with florbetaben. Clin. Transl. Imaging 2015, 3, 13–26. [Google Scholar] [CrossRef]
  33. Barthel, H.; Gertz, H.J.; Dresel, S.; Peters, O.; Bartenstein, P.; Buerger, K.; Hiemeyer, F.; Wittemer-Rump, S.M.; Seibyl, J.; Reininger, C.; et al. Cerebral amyloid-beta PET with florbetaben (18F) in patients with Alzheimer’s disease and healthy controls: A multicentre phase 2 diagnostic study. Lancet Neurol. 2011, 10, 424–435. [Google Scholar] [CrossRef]
  34. Herholz, K.; Ebmeier, K. Clinical amyloid imaging in Alzheimer’s disease. Lancet Neurol. 2011, 10, 667–670. [Google Scholar] [CrossRef]
  35. Jack, C.R., Jr.; Bennett, D.A.; Blennow, K.; Carrillo, M.C.; Dunn, B.; Haeberlein, S.B.; Holtzman, D.M.; Jagust, W.; Jessen, F.; Karlawish, J.; et al. NIA-AA Research Framework: Toward a biological definition of Alzheimer’s disease. Alzheimers Dement. 2018, 14, 535–562. [Google Scholar] [CrossRef]
  36. Blom, E.S.; Giedraitis, V.; Zetterberg, H.; Fukumoto, H.; Blennow, K.; Hyman, B.T.; Irizarry, M.C.; Wahlund, L.O.; Lannfelt, L.; Ingelsson, M. Rapid progression from mild cognitive impairment to Alzheimer’s disease in subjects with elevated levels of tau in cerebrospinal fluid and the APOE epsilon4/epsilon4 genotype. Dement. Geriatr. Cogn. Disord. 2009, 27, 458–464. [Google Scholar] [CrossRef]
  37. Samgard, K.; Zetterberg, H.; Blennow, K.; Hansson, O.; Minthon, L.; Londos, E. Cerebrospinal fluid total tau as a marker of Alzheimer’s disease intensity. Int. J. Geriatr. Psychiatry 2010, 25, 403–410. [Google Scholar] [CrossRef]
  38. Seubert, P.; Vigo-Pelfrey, C.; Esch, F.; Lee, M.; Dovey, H.; Davis, D.; Sinha, S.; Schlossmacher, M.; Whaley, J.; Swindlehurst, C.; et al. Isolation and quantification of soluble Alzheimer’s beta-peptide from biological fluids. Nature 1992, 359, 325–327. [Google Scholar] [CrossRef]
  39. Sadigh-Eteghad, S.; Sabermarouf, B.; Majdi, A.; Talebi, M.; Farhoudi, M.; Mahmoudi, J. Amyloid-beta: A crucial factor in Alzheimer’s disease. Med. Princ. Pract. 2015, 24, 1–10. [Google Scholar] [CrossRef]
  40. Jarrett, J.T.; Berger, E.P.; Lansbury, P.T., Jr. The carboxy terminus of the beta amyloid protein is critical for the seeding of amyloid formation: Implications for the pathogenesis of Alzheimer’s disease. Biochemistry 1993, 32, 4693–4697. [Google Scholar] [CrossRef] [PubMed]
  41. Shaw, L.M.; Vanderstichele, H.; Knapik-Czajka, M.; Clark, C.M.; Aisen, P.S.; Petersen, R.C.; Blennow, K.; Soares, H.; Simon, A.; Lewczuk, P.; et al. Cerebrospinal fluid biomarker signature in Alzheimer’s disease neuroimaging initiative subjects. Ann. Neurol. 2009, 65, 403–413. [Google Scholar] [CrossRef] [PubMed]
  42. Welge, V.; Fiege, O.; Lewczuk, P.; Mollenhauer, B.; Esselmann, H.; Klafki, H.W.; Wolf, S.; Trenkwalder, C.; Otto, M.; Kornhuber, J.; et al. Combined CSF tau, p-tau181 and amyloid-beta 38/40/42 for diagnosing Alzheimer’s disease. J. Neural Transm. 2009, 116, 203–212. [Google Scholar] [CrossRef] [PubMed]
  43. Schneider, J.A.; Arvanitakis, Z.; Leurgans, S.E.; Bennett, D.A. The neuropathology of probable Alzheimer disease and mild cognitive impairment. Ann. Neurol. 2009, 66, 200–208. [Google Scholar] [CrossRef] [PubMed]
  44. Blennow, K.; Zetterberg, H.; Fagan, A.M. Fluid biomarkers in Alzheimer disease. Cold Spring Harb. Perspect. Med. 2012, 2, a006221. [Google Scholar] [CrossRef] [PubMed]
  45. Peracaula, R.; Royle, L.; Tabarés, G.; Mallorquí-Fernández, G.; Barrabés, S.; Harvey, D.J.; Dwek, R.A.; Rudd, P.M.; de Llorens, R. Glycosylation of human pancreatic ribonuclease: Differences between normal and tumor states. Glycobiology 2003, 13, 227–244. [Google Scholar] [CrossRef] [PubMed]
  46. Peracaula, R.; Tabarés, G.; Royle, L.; Harvey, D.J.; Dwek, R.A.; Rudd, P.M.; de Llorens, R. Altered glycosylation pattern allows the distinction between prostate-specific antigen (PSA) from normal and tumor origins. Glycobiology 2003, 13, 457–470. [Google Scholar] [CrossRef] [PubMed]
  47. Opdenakker, G.; Rudd, P.M.; Ponting, C.P.; Dwek, R.A. Concepts and principles of glycobiology. FASEB J. 1993, 7, 1330–1337. [Google Scholar] [CrossRef]
  48. Fukuda, M.N.; Sasaki, H.; Lopez, L.; Fukuda, M. Survival of recombinant erythropoietin in the circulation: The role of carbohydrates. Blood 1989, 73, 84–89. [Google Scholar] [CrossRef]
  49. Gu, J.; Isaji, T.; Xu, Q.; Kariya, Y.; Gu, W.; Fukuda, T.; Du, Y. Potential roles of N-glycosylation in cell adhesion. Glycoconj. J. 2012, 29, 599–607. [Google Scholar] [CrossRef] [PubMed]
  50. Biskup, K.; Braicu, E.I.; Sehouli, J.; Fotopoulou, C.; Tauber, R.; Berger, M.; Blanchard, V. Serum glycome profiling: A biomarker for diagnosis of ovarian cancer. J. Proteome Res. 2013, 12, 4056–4063. [Google Scholar] [CrossRef]
  51. Gornik, O.; Royle, L.; Harvey, D.J.; Radcliffe, C.M.; Saldova, R.; Dwek, R.A.; Rudd, P.; Lauc, G. Changes of serum glycans during sepsis and acute pancreatitis. Glycobiology 2007, 17, 1321–1332. [Google Scholar] [CrossRef]
  52. Abd Hamid, U.M.; Royle, L.; Saldova, R.; Radcliffe, C.M.; Harvey, D.J.; Storr, S.J.; Pardo, M.; Antrobus, R.; Chapman, C.J.; Zitzmann, N.; et al. A strategy to reveal potential glycan markers from serum glycoproteins associated with breast cancer progression. Glycobiology 2008, 18, 1105–1118. [Google Scholar] [CrossRef]
  53. Akasaka-Manya, K.; Manya, H.; Sakurai, Y.; Wojczyk, B.S.; Kozutsumi, Y.; Saito, Y.; Taniguchi, N.; Murayama, S.; Spitalnik, S.L.; Endo, T. Protective effect of N -glycan bisecting GlcNAc residues on β-amyloid production in Alzheimer’s disease. Glycobiology 2010, 20, 99–106. [Google Scholar] [CrossRef] [PubMed]
  54. Akasaka-Manya, K.; Manya, H.; Sakurai, Y.; Wojczyk, B.S.; Spitalnik, S.L.; Endo, T. Increased bisecting and core-fucosylated N-glycans on mutant human amyloid precursor proteins. Glycoconj. J. 2008, 25, 775–786. [Google Scholar] [CrossRef] [PubMed]
  55. Kitazume, S.; Nakagawa, K.; Oka, R.; Tachida, Y.; Ogawa, K.; Luo, Y.; Citron, M.; Shitara, H.; Taya, C.; Yonekawa, H.; et al. In vivo cleavage of alpha2,6-sialyltransferase by Alzheimer beta-secretase. J. Biol. Chem. 2005, 280, 8589–8595. [Google Scholar] [CrossRef] [PubMed]
  56. Maguire, T.M.; Breen, K.C. A decrease in neural sialyltransferase activity in Alzheimer’s disease. Dementia 1995, 6, 185–190. [Google Scholar] [CrossRef] [PubMed]
  57. Maguire, T.M.; Gillian, A.M.; O’Mahony, D.; Coughlan, C.M.; Dennihan, A.; Breen, K.C. A decrease in serum sialyltransferase levels in Alzheimer’s disease. Neurobiol. Aging 1994, 15, 99–102. [Google Scholar] [CrossRef] [PubMed]
  58. Kitazume, S.; Tachida, Y.; Oka, R.; Shirotani, K.; Saido, T.C.; Hashimoto, Y. Alzheimer’s β-secretase, β-site amyloid precursor protein-cleaving enzyme, is responsible for cleavage secretion of a Golgi-resident sialyltransferase. Proc. Natl. Acad. Sci. USA 2001, 98, 13554–13559. [Google Scholar] [CrossRef] [PubMed]
  59. Cho, B.G.; Veillon, L.; Mechref, Y. N-Glycan Profile of Cerebrospinal Fluids from Alzheimer’s Disease Patients Using Liquid Chromatography with Mass Spectrometry. J. Proteome Res. 2019, 18, 3770–3779. [Google Scholar] [CrossRef] [PubMed]
  60. Goyallon, A.; Cholet, S.; Chapelle, M.; Junot, C.; Fenaille, F. Evaluation of a combined glycomics and glycoproteomics approach for studying the major glycoproteins present in biofluids: Application to cerebrospinal fluid. Rapid Commun. Mass. Spectrom. 2015, 29, 461–473. [Google Scholar] [CrossRef]
  61. Fogli, A.; Merle, C.; Roussel, V.; Schiffmann, R.; Ughetto, S.; Theisen, M.; Boespflug-Tanguy, O. CSF N-glycan profiles to investigate biomarkers in brain developmental disorders: Application to leukodystrophies related to eIF2B mutations. PLoS ONE 2012, 7, e42688. [Google Scholar] [CrossRef]
  62. Furukawa, J.-I.; Hanamatsu, H.; Yokota, I.; Hirayama, M.; Ando, T.; Kobayashi, H.; Ohnishi, S.; Miura, N.; Okada, K.; Sakai, S.; et al. Comprehensive Glycomic Approach Reveals Novel Low-Molecular-Weight Blood Group-Specific Glycans in Serum and Cerebrospinal Fluid. J. Proteome Res. 2021, 20, 2812–2822. [Google Scholar] [CrossRef] [PubMed]
  63. Huang, C.; Seino, J.; Fujihira, H.; Sato, K.; Fujinawa, R.; Sumer-Bayraktar, Z.; Ishii, N.; Matsuo, I.; Nakaya, S.; Suzuki, T. Occurrence of free N-glycans with a single GlcNAc at the reducing termini in animal sera. Glycobiology 2022, 32, 314–332. [Google Scholar] [CrossRef] [PubMed]
  64. Iwatsuka, K.; Watanabe, S.; Kinoshita, M.; Kamisue, K.; Yamada, K.; Hayakawa, T.; Suzuki, T.; Kakehi, K. Free glycans derived from glycoproteins present in human sera. J. Chromatogr. B Anal. Technol. Biomed. Life Sci. 2013, 928, 16–21. [Google Scholar] [CrossRef] [PubMed]
  65. Hanzawa, K.; Tanaka-Okamoto, M.; Murakami, H.; Mukai, M.; Takahashi, H.; Omori, T.; Ikezawa, K.; Ohkawa, K.; Ohue, M.; Miyamoto, Y. Investigation of acidic free-glycans in urine and their alteration in cancer. Glycobiology 2021, 31, 391–409. [Google Scholar] [CrossRef] [PubMed]
  66. Hanzawa, K.; Tanaka-Okamoto, M.; Murakami, H.; Suzuki, N.; Mukai, M.; Takahashi, H.; Omori, T.; Ikezawa, K.; Ohkawa, K.; Ohue, M.; et al. Increased levels of acidic free-N-glycans, including multi-antennary and fucosylated structures, in the urine of cancer patients. PLoS ONE 2022, 17, e0266927. [Google Scholar] [CrossRef] [PubMed]
  67. Alonzi, D.S.; Su, Y.H.; Butters, T.D. Urinary glycan markers for disease. Biochem. Soc. Trans. 2011, 39, 393–398. [Google Scholar] [CrossRef] [PubMed]
  68. Chalabi, S.; Easton, R.L.; Patankar, M.S.; Lattanzio, F.A.; Morrison, J.C.; Panico, M.; Morris, H.R.; Dell, A.; Clark, G.F. The expression of free oligosaccharides in human seminal plasma. J. Biol. Chem. 2002, 277, 32562–32570. [Google Scholar] [CrossRef] [PubMed]
  69. Boeddrich, A.; Haenig, C.; Neuendorf, N.; Blanc, E.; Ivanov, A.; Kirchner, M.; Schleumann, P.; Bayraktaroglu, I.; Richter, M.; Molenda, C.M.; et al. A proteomics analysis of 5xFAD mouse brain regions reveals the lysosome-associated protein Arl8b as a candidate biomarker for Alzheimer’s disease. Genome Med. 2023, 15, 50. [Google Scholar] [CrossRef] [PubMed]
  70. Reinke, S.O.; Bayer, M.; Berger, M.; Hinderlich, S.; Blanchard, V. The analysis of N-glycans of cell membrane proteins from human hematopoietic cell lines reveals distinctions in their pattern. Biol. Chem. 2012, 393, 731–747. [Google Scholar] [CrossRef]
  71. Ciucanu, I.; Kerek, F. Rapid and simultaneous methylation of fatty and hydroxy fatty acids for gas—Liquid chromatographic analysis. J. Chromatogr. A 1984, 284, 179–185. [Google Scholar] [CrossRef]
  72. Wedepohl, S.; Kaup, M.; Riese, S.B.; Berger, M.; Dernedde, J.; Tauber, R.; Blanchard, V. N-glycan analysis of recombinant L-Selectin reveals sulfated GalNAc and GalNAc-GalNAc motifs. J. Proteome Res. 2010, 9, 3403–3411. [Google Scholar] [CrossRef] [PubMed]
  73. Maass, K.; Ranzinger, R.; Geyer, H.; von der Lieth, C.W.; Geyer, R. “Glyco-peakfinder”—De novo composition analysis of glycoconjugates. Proteomics 2007, 7, 4435–4444. [Google Scholar] [CrossRef] [PubMed]
  74. Ceroni, A.; Maass, K.; Geyer, H.; Geyer, R.; Dell, A.; Haslam, S.M. GlycoWorkbench: A Tool for the Computer-Assisted Annotation of Mass Spectra of Glycans. J. Proteome Res. 2008, 7, 1650–1659. [Google Scholar] [CrossRef] [PubMed]
  75. Damerell, D.; Ceroni, A.; Maass, K.; Ranzinger, R.; Dell, A.; Haslam, S.M. The GlycanBuilder and GlycoWorkbench glycoinformatics tools: Updates and new developments. Biol. Chem. 2012, 393, 1357–1362. [Google Scholar] [CrossRef] [PubMed]
  76. Hoffmann, A.; Nimtz, M.; Getzlaff, R.; Conradt, H.S. ‘Brain-type’ N-glycosylation of asialo-transferrin from human cerebrospinal fluid. FEBS Lett. 1995, 359, 164–168. [Google Scholar] [CrossRef] [PubMed]
  77. Palmigiano, A.; Barone, R.; Sturiale, L.; Sanfilippo, C.; Bua, R.O.; Romeo, D.A.; Messina, A.; Capuana, M.L.; Maci, T.; Le Pira, F.; et al. CSF N-glycoproteomics for early diagnosis in Alzheimer’s disease. J. Proteom. 2016, 131, 29–37. [Google Scholar] [CrossRef] [PubMed]
  78. Stanta, J.L.; Saldova, R.; Struwe, W.B.; Byrne, J.C.; Leweke, F.M.; Rothermund, M.; Rahmoune, H.; Levin, Y.; Guest, P.C.; Bahn, S.; et al. Identification of N-glycosylation changes in the CSF and serum in patients with schizophrenia. J. Proteome Res. 2010, 9, 4476–4489. [Google Scholar] [CrossRef]
  79. Barone, R.; Sturiale, L.; Fiumara, A.; Palmigiano, A.; Bua, R.O.; Rizzo, R.; Zappia, M.; Garozzo, D. CSF N-glycan profile reveals sialylation deficiency in a patient with GM2 gangliosidosis presenting as childhood disintegrative disorder. Autism Res. 2016, 9, 423–428. [Google Scholar] [CrossRef] [PubMed]
  80. Goncalves, M.; Tillack, L.; de Carvalho, M.; Pinto, S.; Conradt, H.S.; Costa, J. Phosphoneurofilament heavy chain and N-glycomics from the cerebrospinal fluid in amyotrophic lateral sclerosis. Clin. Chim. Acta 2015, 438, 342–349. [Google Scholar] [CrossRef]
  81. Harada, Y.; Hirayama, H.; Suzuki, T. Generation and degradation of free asparagine-linked glycans. Cell Mol. Life Sci. 2015, 72, 2509–2533. [Google Scholar] [CrossRef]
  82. Moore, S.E. Transport of free polymannose-type oligosaccharides from the endoplasmic reticulum into the cytosol is inhibited by mannosides and requires a thapsigargin-sensitive calcium store. Glycobiology 1998, 8, 373–381. [Google Scholar] [CrossRef] [PubMed]
  83. Suzuki, T. The cytoplasmic peptide:N-glycanase (Ngly1)-basic science encounters a human genetic disorder. J. Biochem. 2015, 157, 23–34. [Google Scholar] [CrossRef] [PubMed]
  84. Suzuki, T. Catabolism of N-glycoproteins in mammalian cells: Molecular mechanisms and genetic disorders related to the processes. Mol. Asp. Med. 2016, 51, 89–103. [Google Scholar] [CrossRef] [PubMed]
  85. Suttapitugsakul, S.; Stavenhagen, K.; Donskaya, S.; Bennett, D.A.; Mealer, R.G.; Seyfried, N.T.; Cummings, R.D. Glycoproteomics Landscape of Asymptomatic and Symptomatic Human Alzheimer’s Disease Brain. Mol. Cell Proteom. 2022, 21, 100433. [Google Scholar] [CrossRef] [PubMed]
  86. Murakami, Y.; Saito, K.; Ito, H.; Hashimoto, Y. Transferrin isoforms in cerebrospinal fluid and their relation to neurological diseases. Proc. Jpn. Acad. Ser. B Phys. Biol. Sci. 2019, 95, 198–210. [Google Scholar] [CrossRef] [PubMed]
  87. Nakakita, S.; Natsuka, S.; Ikenaka, K.; Hase, S. Development-dependent expression of complex-type sugar chains specific to mouse brain. J. Biochem. 1998, 123, 1164–1168. [Google Scholar] [CrossRef]
  88. Kizuka, Y.; Kitazume, S.; Fujinawa, R.; Saito, T.; Iwata, N.; Saido, T.C.; Nakano, M.; Yamaguchi, Y.; Hashimoto, Y.; Staufenbiel, M.; et al. An aberrant sugar modification of BACE1 blocks its lysosomal targeting in Alzheimer’s disease. EMBO Mol. Med. 2015, 7, 175–189. [Google Scholar] [CrossRef] [PubMed]
  89. Kizuka, Y.; Taniguchi, N. Neural functions of bisecting GlcNAc. Glycoconj. J. 2018, 35, 345–351. [Google Scholar] [CrossRef]
  90. Wang, W.; Gopal, S.; Pocock, R.; Xiao, Z. Glycan Mimetics from Natural Products: New Therapeutic Opportunities for Neurodegenerative Disease. Molecules 2019, 24, 4604. [Google Scholar] [CrossRef]
  91. Schedin-Weiss, S.; Gaunitz, S.; Sui, P.; Chen, Q.; Haslam, S.M.; Blennow, K.; Winblad, B.; Dell, A.; Tjernberg, L.O. Glycan biomarkers for Alzheimer disease correlate with T-tau and P-tau in cerebrospinal fluid in subjective cognitive impairment. FEBS J. 2020, 287, 3221–3234. [Google Scholar] [CrossRef]
  92. Liu, F.; Zaidi, T.; Iqbal, K.; Grundke-Iqbal, I.; Gong, C.X. Aberrant glycosylation modulates phosphorylation of tau by protein kinase A and dephosphorylation of tau by protein phosphatase 2A and 5. Neuroscience 2002, 115, 829–837. [Google Scholar] [CrossRef] [PubMed]
  93. Wang, J.Z.; Grundke-Iqbal, I.; Iqbal, K. Glycosylation of microtubule-associated protein tau: An abnormal posttranslational modification in Alzheimer’s disease. Nat. Med. 1996, 2, 871–875. [Google Scholar] [CrossRef] [PubMed]
  94. Kitazume, S.; Tachida, Y.; Oka, R.; Kotani, N.; Ogawa, K.; Suzuki, M.; Dohmae, N.; Takio, K.; Saido, T.C.; Hashimoto, Y. Characterization of α2,6-Sialyltransferase Cleavage by Alzheimer’s β-Secretase (BACE1)*. J. Biol. Chem. 2003, 278, 14865–14871. [Google Scholar] [CrossRef] [PubMed]
Figure 1. Representative MALDI-TOF-MS spectra of permethylated (a) free-glycans, (b) N-glycans, and (c) O-glycans isolated from healthy controls. Measurements were performed in the positive-ion mode. All the ions are present in their sodiated form [M + Na]+. The monosaccharides are depicted as follows: Man, green circle; Gal, yellow circle; GlcNAc, blue square; GalNAc, yellow square; Fuc, pink triangle; Neu5Ac, pink diamond; star polygon, non-identified.
Biomolecules 14 00512 g001
Figure 2. Exemplary MALDI-TOF-MS spectra of permethylated free-glycans from (a) a patient with AD (b) a disease control patient, and (c) a healthy control. Measurements were performed in the positive-ion mode. All the ions are present in their sodiated form [M + Na]+. The monosaccharides are depicted as follows: Man, green circle; Gal, yellow circle; GlcNAc, blue square; GalNAc, yellow square; Fuc, pink triangle; Neu5Ac, pink diamond; star polygon, non-identified. Free-glycans that are differentially expressed between the patient groups are encircled in red.
Biomolecules 14 00512 g002
Figure 3. Bar charts showing the mean relative areas in (a) free-glycans, (b) N-glycans (male), (c) O-glycans and (d) N-glycans (female) for patients with AD, disease control patients and healthy controls. Glycans were grouped into glycosylation features, as detailed in Supplementary Material Table S9. * p < 0.5, ** p < 0.01.
Biomolecules 14 00512 g003
Table 1. Baseline characteristics of patients with AD, disease control patients and healthy controls. MMSE: Mini-Mental State Examination; Aβ-ratio: ratio Aβ1–42/Aβ1–40; p-tau: phosphorylated tau; t-tau: total tau protein, SD: standard deviation.
Patients with ADDisease Control PatientsHealthy Controls
Number of patients (m/f)89 (43/46)86 (55/31)87 (48/39)
Age of the patient cohorts (years)
Mean (m/f)76 (75/76)73 (72/75)66 (67/65)
Median (m/f)77 (77/77)75 (72/77)66 (66/65)
SD6.78.38.5
Range44–8852–8945–84
MMSE
Mean (m/f)23.5 (23.6/23.5)23.6 (24.2/22.5)28.7 (28.8/28.7)
Median (m/f)24.0 (25.0/24.0)25.0 (25.0/23.5)29.0 (29.0/29.0)
SD3.84.61.1
Range12.0–30.03.0–30.026.0–30.0
Aβ ratio
Mean (m/f)0.051 (0.049/0.053)0.085 (0.085/0.085)0.088 (0.090/0.086)
Median (m/f)0.049 (0.048/0.051)0.095 (0.091/0.097)0.096 (0.097/0.094)
SD0.0120.0240.020
Range0.025–0.1030.027–0.1200.034–0.115
p-tau (pg/mL)
Mean (m/f)104.0 (112.0/96.4)53.1 (53.3/52.6)40.9 (41.2/40.6)
Median (m/f)98.1 (105.3/94.9)41.9 (42.0/40.6)37.2 (38.5/32.1)
SD42.937.414.4
Range34.0–279.024.0–253.017.0–91.0
t-tau (pg/mL)
Mean (m/f)674.6 (724.8/627.7)385.3 (381.5/391.9)282.8 (290.7/273.0)
Median (m/f)615.0 (625.0/612.5)308.0 (297.0/320.0)241.0 (267.5/237.0)
SD260.6235.6116.7
Range231.0–1505.0114.0–1349.096.0–583.0
Table 2. Mean relative areas and standard deviations of free-glycans isolated from the three patient cohorts as judged by MALDI-TOF-MS. AD: Alzheimer’s disease, DC: disease control, HC: healthy control. p values were determined using the Mann–Whitney U test. p-values ≤ 0.05 were considered as statistically significant and p-values ≤ 0.01 as highly significant.
m/zCompositionPatients with AD [%]DC Patients [%]HC Patients [%]p Value
AD/DC
p Value
AD/HC
p Value
DC/HC
273.1Hex116.65 ± 5.2711.46 ± 5.6810.09 ± 3.95≤0.01≤0.01
314.2HexNAc110.73 ± 2.4011.61 ± 2.6610.40 ± 2.68≤0.05 ≤0.01
430.2Neu5Ac119.08 ± 3.3218.60 ± 3.2218.77 ± 4.24
518.3Hex1HexNAc15.62 ± 0.786.93 ± 1.046.68 ± 1.27≤0.01≤0.01
559.3HexNAc21.19 ± 0.281.54 ± 0.491.31 ± 0.37≤0.01≤0.05≤0.01
675.3Neu5Ac1HexNAc10.83 ± 0.141.12 ± 0.250.96 ± 0.18≤0.01≤0.01≤0.01
722.4Hex2HexNAc13.98 ± 0.614.94 ± 0.834.39 ± 0.96≤0.01≤0.01≤0.01
733.4Fuc1HexNAc21.73 ± 0.272.06 ± 0.492.07 ± 0.47≤0.01≤0.01
791.4Neu5Ac23.71 ± 2.263.45 ± 2.074.46 ± 3.02
825.4Fuc2Hex20.95 ± 0.351.11 ± 0.491.05 ± 0.34≤0.05≤0.05
879.4Neu5Ac1Hex1HexNAc16.49 ± 1.137.38 ± 1.287.69 ± 0.97≤0.01≤0.01≤0.05
926.5Hex3HexNAc14.34 ± 0.765.17 ± 0.985.06 ± 1.15≤0.01≤0.01
967.5Hex2HexNAc20.91 ± 0.151.04 ± 0.201.05 ± 0.26≤0.01≤0.01
1130.6Hex4HexNAc12.46 ± 0.462.81 ± 0.602.89 ± 0.74≤0.01≤0.01
1171.6Hex3HexNAc21.03 ± 0.201.08 ± 0.221.17 ± 0.31 ≤0.01
1212.6Hex2HexNAc32.06 ± 0.532.24 ± 0.702.07 ± 0.52
1240.6Neu5Ac2Hex1HexNAc18.05 ± 2.168.17 ± 2.008.77 ± 1.87
1334.7Hex5HexNAc11.08 ± 0.261.17 ± 0.291.28 ± 0.39 ≤0.01
1601.8Neu5Ac3Hex1HexNAc11.29 ± 0.520.95 ± 0.491.35 ± 0.55≤0.01 ≤0.01
Other 7.817.188.51
Table 3. Statistical differences obtained between the three cohorts (AD: Alzheimer´s disease, DC: disease control, HC: healthy controls) for N-glycan relative intensities. p-values ≤ 0.05 were considered as statistically significant and p-values ≤ 0.01 as highly significant as judged from the Mann–Whitney U test.
Male PatientsFemale Patients
m/zCompositionAD/DCAD/HCDC/HCAD/DCAD/HCDC/HC
1579.8Hex5HexNAc2 ≤0.05≤0.01
1661.8Hex3HexNAc4 ≤0.01
1783.9Hex6HexNAc2 ≤0.05
1835.9Fuc1Hex3HexNAc4 ≤0.01 ≤0.05
2040.0Fuc1Hex4HexNAc4 ≤0.05
2081.1Fuc1Hex3HexNAc5 ≤0.01
2111.1Hex4HexNAc5 ≤0.01 ≤0.05
2214.1Fuc2Hex4HexNAc4≤0.01 ≤0.05
2244.1Fuc1Hex5HexNAc4 ≤0.05 ≤0.01
2431.2Neu5Ac1Hex5HexNAc4 ≤0.05
2459.2Fuc2Hex4HexNAc5≤0.05≤0.01≤0.01≤0.05≤0.05≤0.01
2489.3Fuc1Hex5HexNAc5 ≤0.05
2592.3Fuc3Hex5HexNAc4≤0.05
2605.3Neu5Ac1Fuc1Hex5HexNAc4≤0.01≤0.05 ≤0.01≤0.01
2646.3Neu5Ac1Fuc1Hex4HexNAc5≤0.05≤0.01 ≤0.01≤0.01
2837.4Fuc3Hex5HexNAc5 ≤0.05 ≤0.05
2850.4Neu5Ac1Fuc1Hex5HexNAc5 ≤0.05 ≤0.05≤0.01
2966.5Neu5Ac2Fuc1Hex5HexNAc4 ≤0.01 ≤0.01
Disclaimer/Publisher’s Note: The statements, opinions and data contained in all publications are solely those of the individual author(s) and contributor(s) and not of MDPI and/or the editor(s). MDPI and/or the editor(s) disclaim responsibility for any injury to people or property resulting from any ideas, methods, instructions or products referred to in the content.

