M-Polynomials and Degree-Based Topological Indices of the Crystallographic Structure of Molecules


1
School of Information Science and Technology, Yunnan Normal University, Kunming 650500, China
2
Department of Mathematics, COMSATS University Islamabad, Lahore Campus, Lahore 54000, Pakistan
3
Department of Mathematics, University of Education, Vehari Campus, Lahore 54000, Pakistan
4
Division of Science and Technology, University of Education, Lahore 54000, Pakistan
*
Author to whom correspondence should be addressed.
Biomolecules 2018, 8(4), 107; https://doi.org/10.3390/biom8040107
Submission received: 4 September 2018
/
Revised: 27 September 2018
/
Accepted: 28 September 2018
/
Published: 3 October 2018
Abstract
:Topological indices are numerical parameters used to study the physical and chemical properties of compounds. In quantitative structure–activity relationship QSARs, topological indices correlate the biological activity of compounds with their physical properties like boiling point, stability, melting point, distortion, and strain energy etc. In this paper, we determined the M-polynomials of the crystallographic structure of the molecules Cu2O and TiF2 [p,q,r]. Then we derived closed formulas for some well-known topological indices using calculus. In the end, we used Maple 15 to plot surfaces associated with the topological indices of Cu2O and TiF2 [p,q,r].
1. Introduction
In the medication mathematical model, the structure of medication is taken as an undirected graph, where vertices and edges are taken as atoms and chemical bonds. With the rapid advancement of medicine manufacture, a huge number of new medications are created every year. Henceforth, it requires a colossal amount of work to decide on the pharmacological, compound and biological characteristics of these new medications, and such workloads turn out to be increasingly particular and bunched together. It requires sufficient reagents equipment and partners to test the performances and the reactions of new medications. Be that as it may, in run down poor nations and regions, (for example, certain urban communities and nations in South America, Southeast Asia, Africa and India), there is no adequate cash to acquire reagents and equipment which can be utilized to measure the biochemical properties.
Luckily, numerous past studies [1,2] have pointed out that chemical and pharma codynamic attributes of medications and their atomic structures are firmly connected. In the event that we compute indicators of these graphs of drug molecules [3,4,5,6] with the perspective of characterizing the topological index, pharmaceutical researchers could well think that it is helpful to understand the medicinal properties, which can make up for the deformities of drug and chemical experiments. From this outlook, the strategies on topological index calculation are exceptionally appropriate and functional for developing nations where they can yield the available biological and medical information of new medications without compound investigation equipment and experiment.
In spite of the fact that there have been a few contributions on distance-based indices and degree-based indices, [6,7,8,9] the investigations of the topological index for certain uncommon structures are still to a great extent restricted. As a result of this, enormous scholarly and modern thinking has been pulled in to examine the topological indices of drug structures from a mathematical perspective.
Mathematical chemistry gives tools, for example, polynomials and numbers to obtain properties of chemical compounds without utilizing quantum mechanics. A topological index is a numerical parameter of a graph and describes its topology. It depicts the molecular structure numerically and is utilized in the advancement of qualitative structure activity relationships (QSARs). There are three kinds of topological indices:
- degree-based.
- distance-based.
- spectral-based.
Degree-based topological indices have been studied extensively and can be correlated with many properties of the understudy molecular compounds. There is a strong relationship between distance-based and degree-based topological indices [10]. Topological indices are really the numerical values that relate the structure to different physical properties, synthetic reactivity, and organic biological activities [11,12,13,14,15]. Many properties, for example, heat of formation, boiling point, strain energy, rigidity, and fracture toughness of a molecule are strongly connected to its molecular graph.
Hosoya polynomial, (Wiener polynomial), [16] assumes an essential part in distance based topological indices. A considerable rundown of distance based indices can be effectively assessed from the Hosoya polynomial. A comparable leap forward was acquired as of late by Deutsch and Klavžar [17], with regards to degree-based indices. They presented M-polynomial in 2015 to assume a part, parallel to Hosoya polynomial, to decide on the closed form of numerous degree-based topological indices [18,19,20,21,22]. The genuine intensity of the M-polynomial is its extensive nature containing solid data about degree-based graph invariants. These invariants are graph based on symmetries displayed in the 2d-atomic grids and altogether explain a few properties of the material under perception.
A lot of research has been done in the direction of M-polynomial, for example Munir et al. computed M-polynomial and related indices of triangular boron nanotubes in [21], polyhex-nanotubes in [22], nanostar dendrimers in [18], titania nanotubes in [19], as well as M-Polynomials and topological indices of V-Phenylenic Nanotubes and Nanotori in [20]. In this paper we aim to compute the M-polynomial of the crystallographic structure of the molecule Cu2O and the crystal structure of titanium difluoride TiF2 [n,m,t]. We also recover the first and second Zagreb indices, the modified Zagreb index, the Symmetric division index, the Harmonic index, the Randić and the Inverse Randić index, the Augmented Zagreb index and the Inverse sum index for these molecules. We also plot our results to determine the dependence on the involved parameters. For more details about the topological indices and their applications, we refer to references [23,24,25,26,27].
2. Basic Definitions and Literature Review
Throughout this article, we assume G to be a simple connected graph, V (G) and E (G) are the vertex set and the edge set respectively and dv denotes the degree of a vertex v.
Definition 1.
Wiener index [28] is the first topological index and its various applications are discussed in [29,30]. Randić index, , is introduced by Milan Randić in 1975 defined as: For general details about and its generalized Randić index, please see [31,32,33,34,35].
The inverse Randić index is defined as Clearly is a special case of when . This index has many applications in diverse areas. Many papers and books such as [36,37,38] are written on this topological index as well. Gutman and Trinajstić introduced two indices namely the first Zagreb index and the second Zagreb index and are defined as: and . The second modified Zagreb index is defined as: We refer [39,40,41,42,43,44,45,46,47,48] to the readers for comprehensive details of these indices. Other famous indices are the Symmetric division index: SDD(G) = , the Harmonic index: Inverse sum index: and augmented Zagreb index: [49,50].
3. Methodology
First of all we associated the graphs with Cu2O and TiF2 [p,q,r] where atoms are represented by vertices and chemical bonds are represented by edges. Then by using the symmetry of the molecular structures of Cu2O and TiF2 [p,q,r] we counted the edges and vertices by a simple counting method. By applying the formula of the polynomial we derived the M-polynomials of Cu2O and TiF2 [p,q,r]. From these M-polynomials we recovered nine degree-based topological indices by using calculus. We used Maple 2015 to plot our results.
4. Main Results
4.1. M-Polynomial and Degree-Based Topological Indices of Cu2O
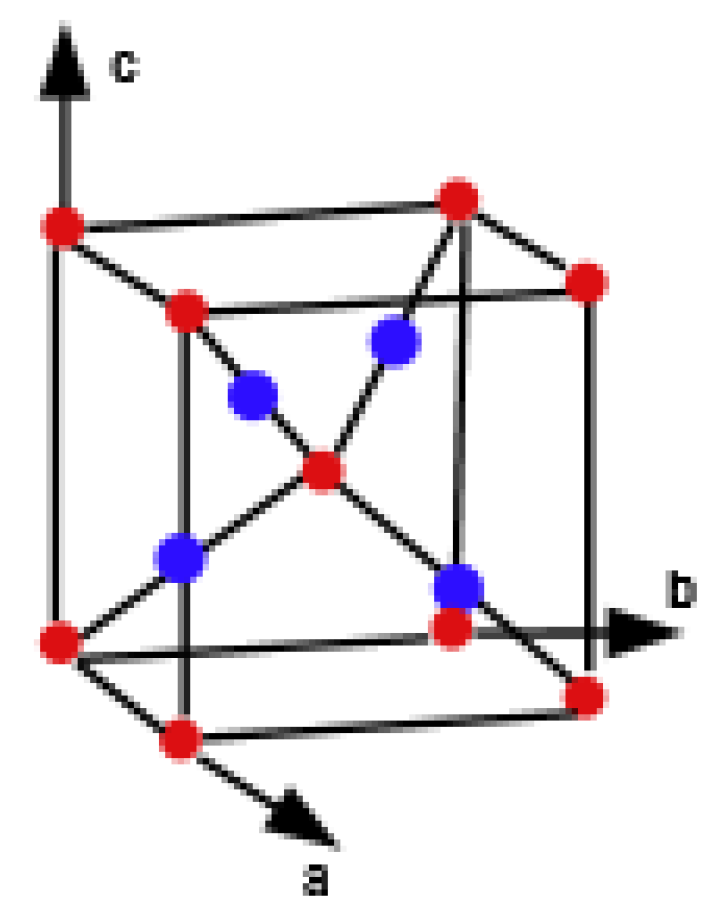
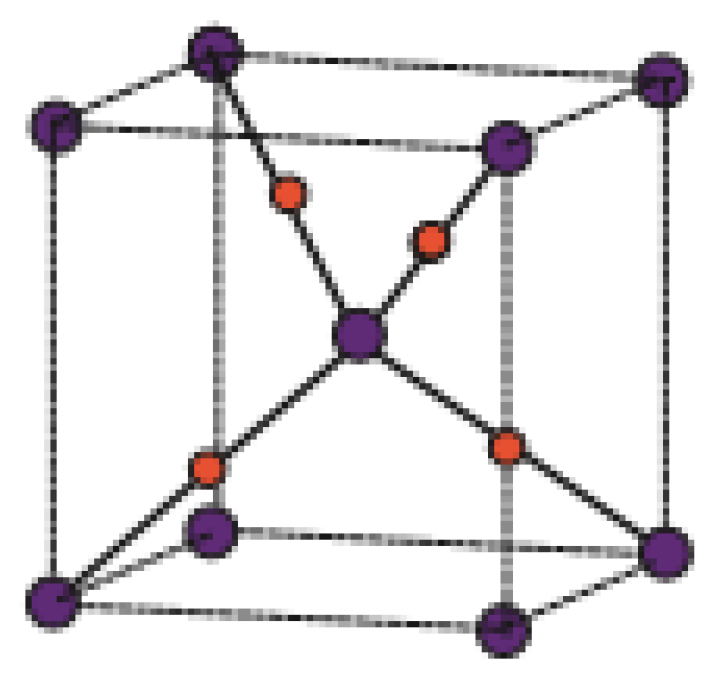
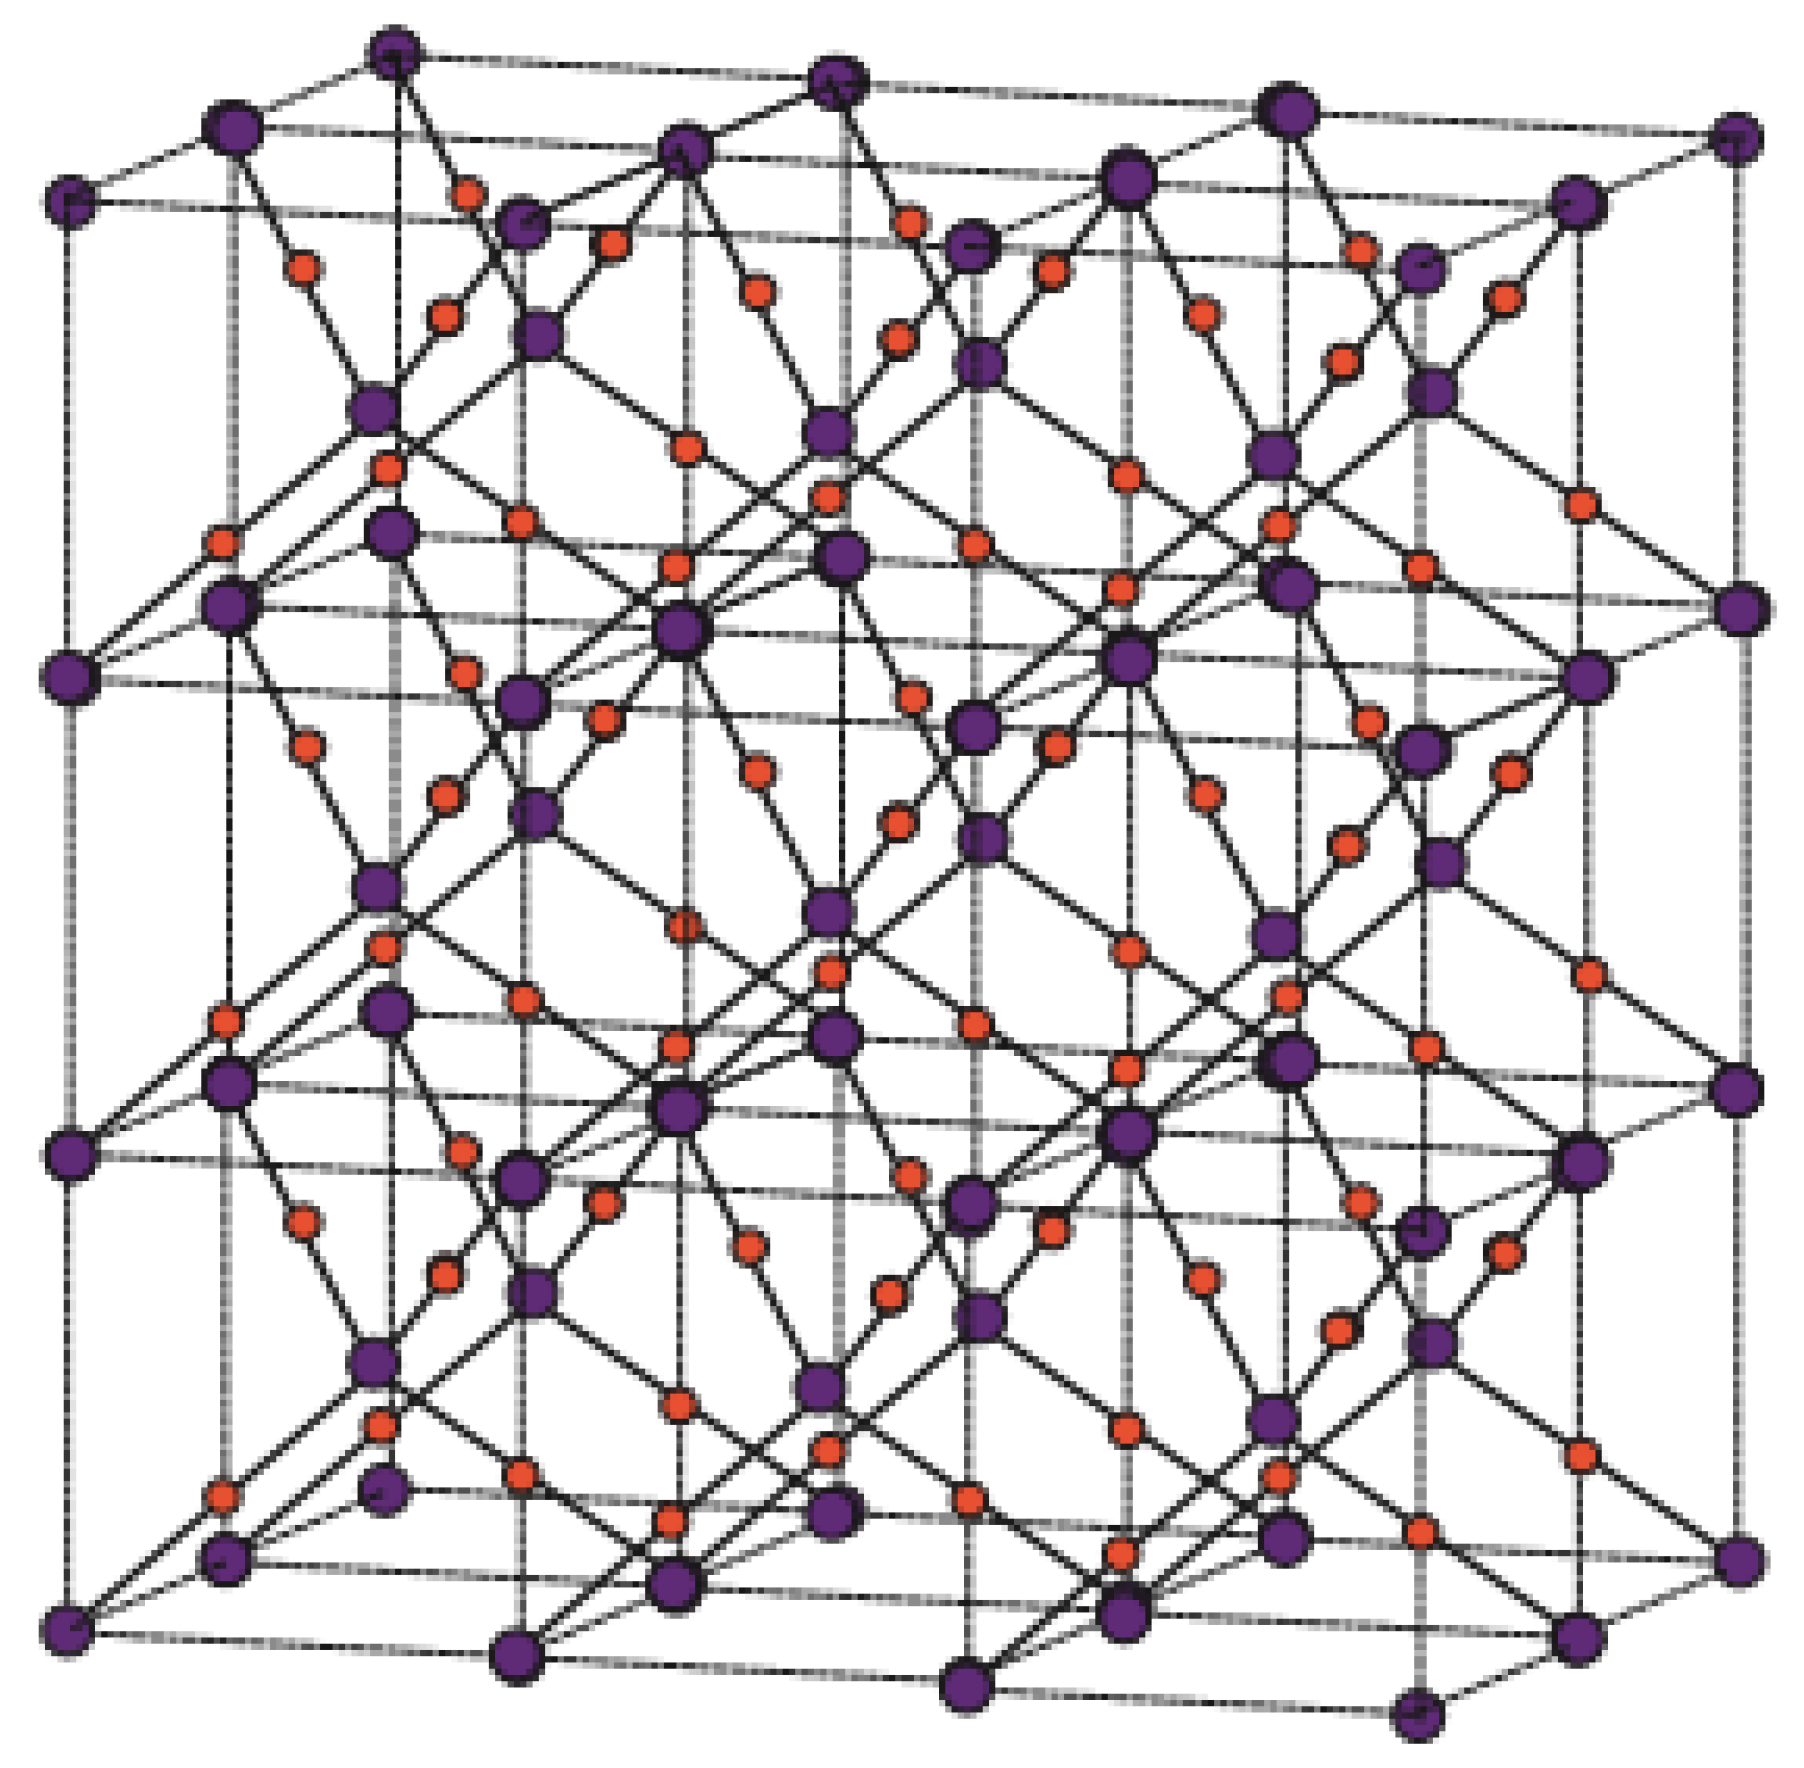
Copper(I) oxide or cuprous oxide is the inorganic compound with the formula Cu2O. It is one of the principal oxides of copper, the other being CuO or cupric oxide. The solid is diamagnetic. In terms of their coordination spheres, copper centers are 2-coordinated and the oxides are tetrahedral. The structure thus resembles in some sense the main polymorphs of SiO2, and both structures feature interpenetrated lattices. Copper(I) oxide dissolves in concentrated ammonia solution to form the colorless complex [Cu(NH3)2]+, which is easily oxidized in air to the blue [Cu(NH3)4(H2O)2]2+. It dissolves in hydrochloric acid to give solutions of CuCl2−. Dilute sulfuric acid and nitric acid produce copper(II) sulfate and copper(II) nitrate, respectively. Cuprous oxide is commonly used as a pigment, a fungicide, and an antifouling agent for marine paints. Rectifier diodes based on this material have been used industrially as early as 1924, long before silicon became the standard. Copper(I) oxide is also responsible for the pink color in a positive Benedict’s test. This is the main reason to choose Cu2O. Nowadays the Crystallographic Structure of the Molecule Cu2O has attracted attention due to its interesting properties, low-cost, abundance, non-toxic nature, and simple fabrication process [51]. The promising applications of Cu2O mainly focus on chemical sensors, solar cells, photocatalysis, lithium-ion batteries, and catalysis [52]. Figure 1, Figure 2, Figure 3, Figure 4 and Figure 5 describe the graph of the molecule Cu2O [53]. The crystallographic structure of Cu2O is shown in Figure 1. In the lattice of Cu2O the structural characteristics of the atoms of O and Cu are shown in Figure 2. By interpenetrating the O lattices with Cu lattices, Cu2O lattices are formed. The unit cell of Cu2O is shown in Figure 3. In Figure 3 copper atoms are shown by red dots and oxygen atoms are shown by blue dots. In the Cu2O lattice graph, each copper atom is attached to two oxygen atoms, and every oxygen atom is attached to four copper atoms. Cu2O [1,1,1] and Cu2O [3,2,3] are shown in Figure 4 and Figure 5 respectively.
Let G ≅ Cu2O[p,q,r] be the chemical graph of Cu2O with p × q unit cells in the plane and r layers [14]. It can be observed that
Theorem 1.
For the graph of crystallographic structure G ≅ Cu2O[p,q,r], we have
Proof.
Let G be the crystallographic structure of Cu2O[p,q,r]. The edge set of Cu2O[p,q,r] has the following three partitions,
such that
Thus the M-polynomial of Cu2O[n,m,t] is
☐
Theorem 2.
For the graph of the crystallographic structure G = Cu2O[p,q,r], we have
Proof.
Theorem 3.
For the graph of the crystallographic structure G = Cu2O[p,q,r], we have
Proof.
Theorem 4.
For the graph of the crystallographic structure G = Cu2O[p,q,r], we have
Proof.
Theorem 5.
For the graph of the crystallographic structure G = Cu2O[p,q,r], we have
Proof.
Theorem 6.
For the graph of the crystallographic structure G = Cu2O[p,q,r], we have
Proof.
Theorem 7.
For the graph of the crystallographic structure G = Cu2O[p,q,r], we have
Proof.
Theorem 8.
For the graph of the crystallographic structure G = Cu2O[p,q,r], we have
Proof.
Theorem 9.
For the graph of crystallographic structure G = Cu2O[p,q,r], we have
Proof.
Theorem 10.
For the graph of the crystallographic structure G = Cu2O[p,q,r], we have
4.2. M Polynomial and Degree-Based Topological Indices for TiF2[p,q,r]
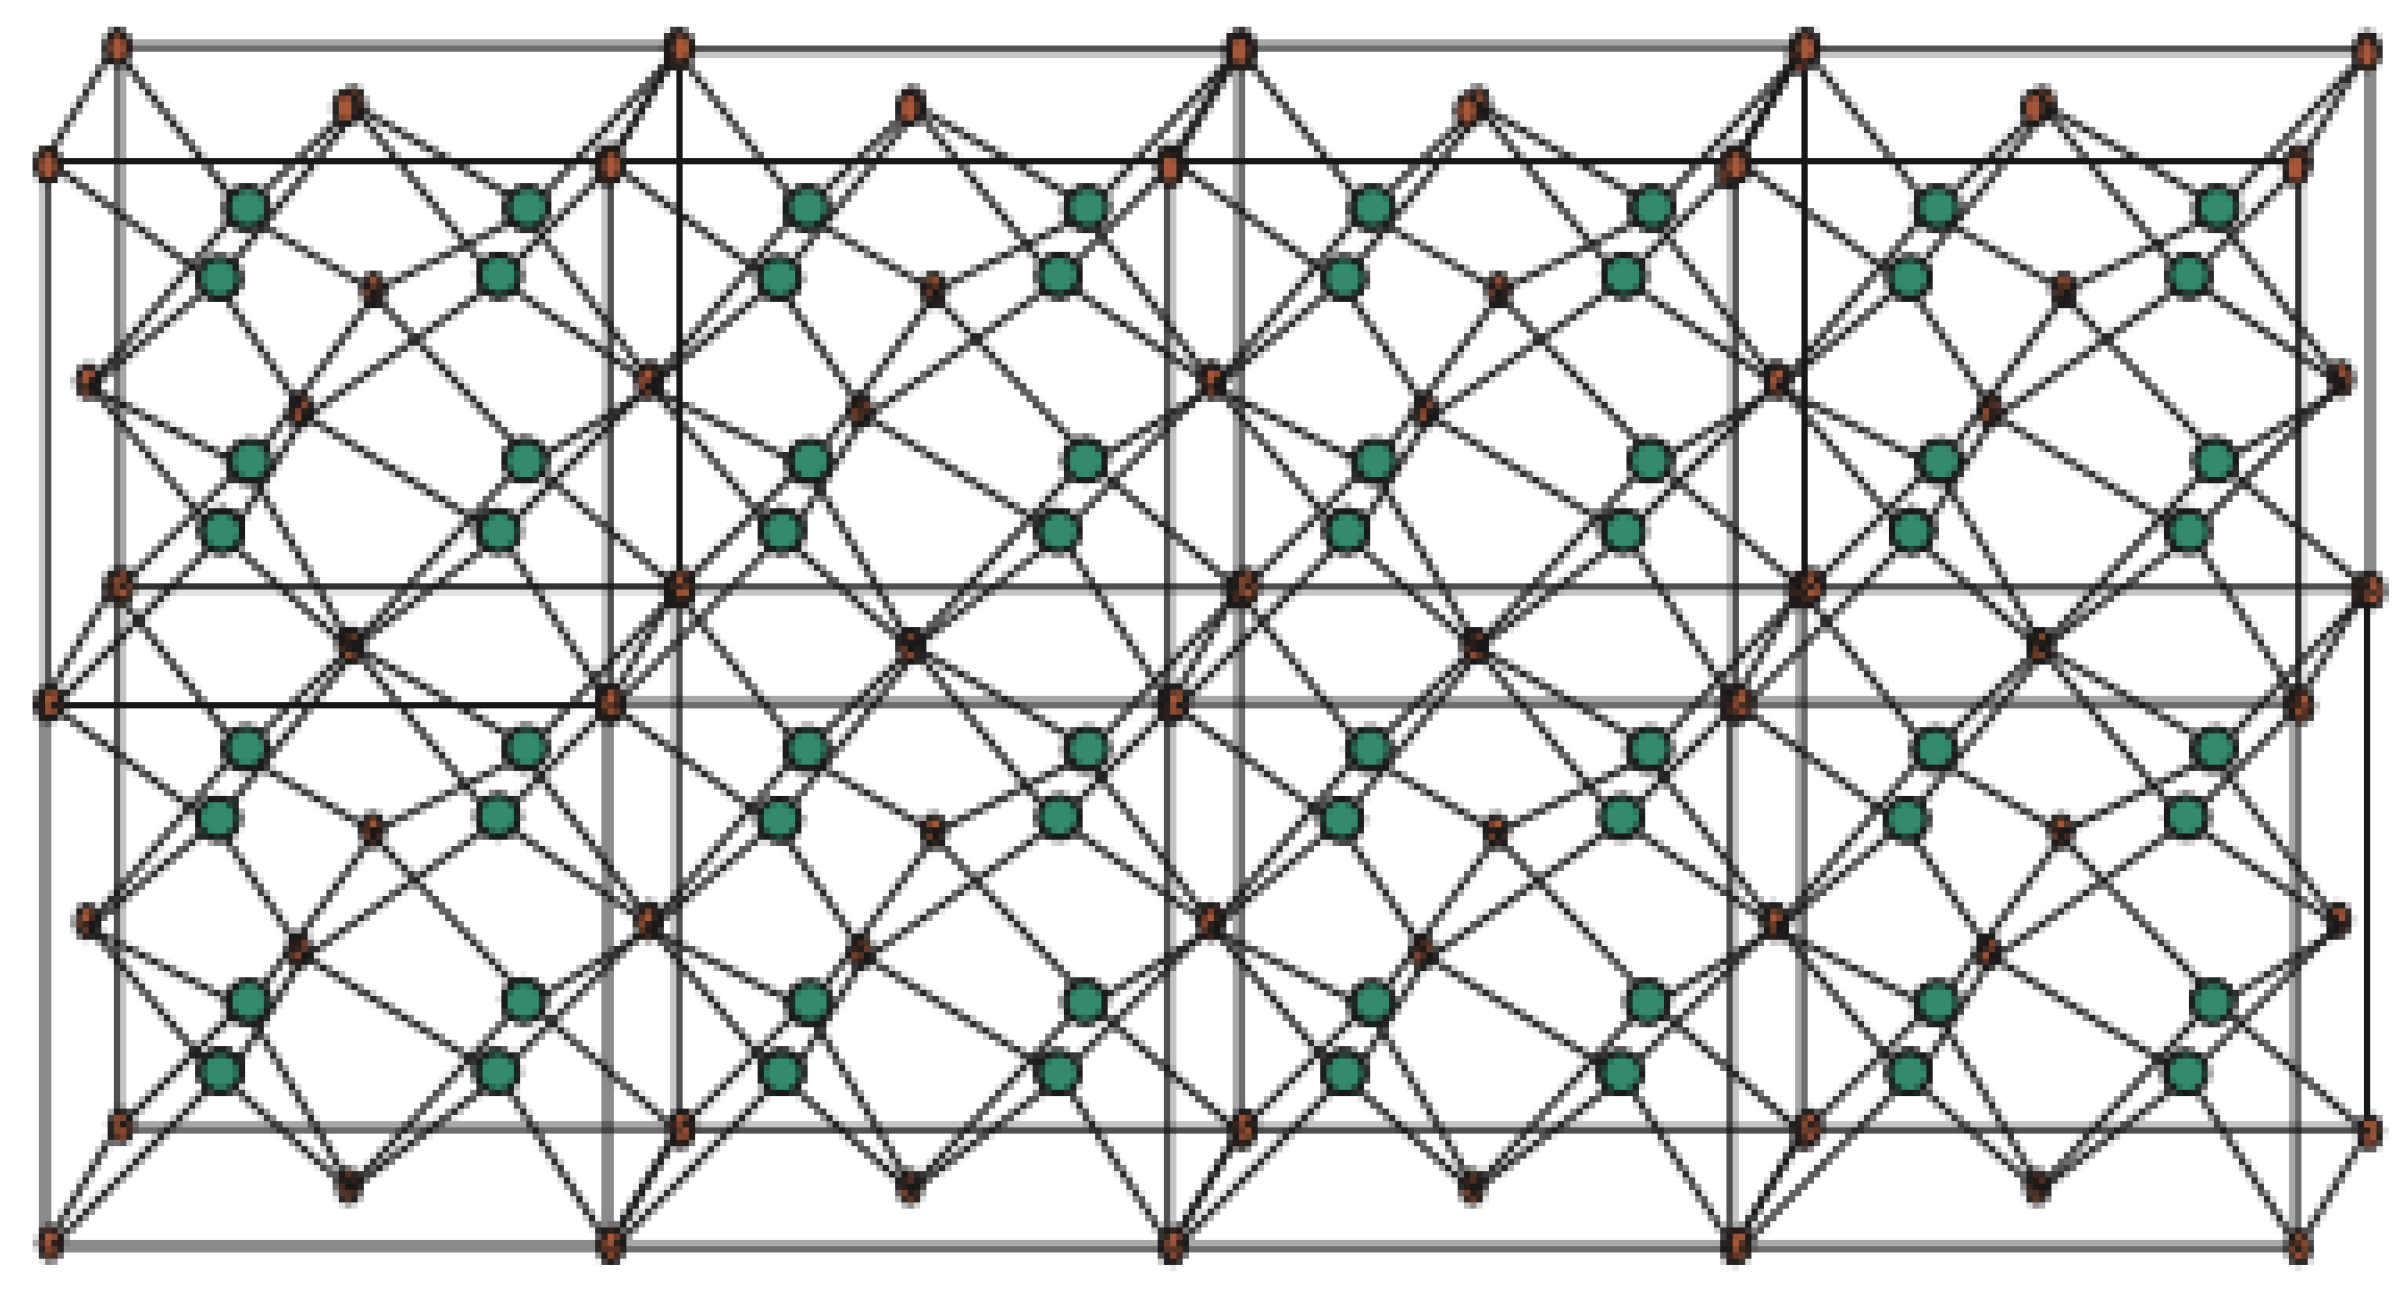
Titanium difluoride is a water-insoluble titanium hotspot for use in oxygen-delicate applications, for example, metal generation. Fluoride mixes have assorted applications in current advancements and science, from oil refining and carving to engineered natural science and the production of pharmaceuticals. The graph associated with TiF2[p,q,r] is given in Figure 3, see [54]. Let G be the chemical graph of TiF2[p,q,r] with p × q unit cells in the plane and t layers [23]. In Figure 15 and Figure 16, red dots are for F atoms and green dots are for Ti atoms. Now it can be observed easily from Figure 15 and Figure 16 that
Theorem 11.
For the crystal structure of titanium difluoride G = TiF2[p,q,r], we have
Proof.
The edge set of G=TiF2[p,q,r] has the following four partitions,
such that
Thus the M-polynomial of TiF2[p,q,r] is:
Now we compute some indices by applying fundamental calculus results on the M-polynomial. The proofs of Theorems 12 to 20 are the same as Theorems 2 to 10. ☐
Theorem 12.
For the crystal structure of titanium difluoride G = TiF2[p,q,r], we have
Theorem 13.
For the crystal structure of titanium difluoride G = TiF2[p,q,r], we have
Theorem 14.
For the crystal structure of titanium difluoride G = TiF2[p,q,r], we have
Theorem 15.
For the crystal structure of titanium difluoride G = TiF2[p,q,r], we have
Theorem 16.
For the crystal structure of titanium difluoride G = TiF2[p,q,r], we have
Theorem 17.
For the crystal structure of titanium difluoride G = TiF2[p,q,r], we have
Theorem 18.
For the crystal structure of titanium difluoride G = TiF2[p,q,r], we have
Theorem 19.
For the crystal structure of titanium difluoride G = TiF2[p,q,r], we have
Theorem 20.
For the crystal structure of titanium difluoride G = TiF2[p,q,r], we have
5. Concluding Remarks and Discussion
The M-polynomial is interesting, because it helps to compute the first and second Zagreb indices, the modified second Zagreb index, the Randić and Inverse Randić index, the Symmetric division index, the Inverse sum index, the Harmonic index, and the Augmented Zagreb index. Topological indices help us to predict many properties of the understudy molecular compound, for instance the Randić index is a topological descriptor that has been associated with various chemical properties of molecules and has been found to run parallel to preparing the boiling point and Kovats constants of the molecule. The first and second Zagreb indices were found to be useful for finding the total π-electron energy of the molecule. These are among the graph invariants, which were proposed for the estimation of the skeleton of the spreading of the carbon-molecule. Calculation of the distance based topological index of the understudy molecular graphs continues to be a fascinating open problem.
Author Contributions
W.G. designed the problem. A.F. and M.Y. proved the results. A.M. plot the results. W.N. wrote the paper and verify the results.
Funding
This work was supported in part by the National Natural Science Foundation of China (11761083).
Acknowledgments
Authors are thankful to the reviewers for positive suggestions that improve the quality of the research. We also thankful to Angela Toribio for his/her assistance.
Conflicts of Interest
The authors declare no conflict of interest.
References
- Loghman, A.; Badakhshiana, L. PI polynomial of zig—zag polyhex nanotubes. Dig. J. Nanomater. Biostruct. 2008, 3, 299–302. [Google Scholar]
- Baca, M.; Horvathova, J.; Mokrisova, M.; Semanicova-Fenovckova, A.; Suhanyiova, A. On topological indices of carbon nanotube network. Can. J. Chem. 2015, 93, 1157–1160. [Google Scholar] [CrossRef]
- Gao, W.; Wang, W.; Dimitrov, D.; Wang, Y. Nano properties analysis via fourth multiplicative ABC indicator calculating. Arab. J. Chem. 2018, 11, 793–801. [Google Scholar] [CrossRef]
- Gao, W.; Guirao, J.L.G.; Basavanagoud, B.; Wu, J. Partial multi-dividing ontology learning algorithm. Inform. Sci. 2018, 467, 35–58. [Google Scholar] [CrossRef]
- Gao, W.; Iqbal, Z.; Ishaq, M.; Sarfraz, R.; Aamir, M.; Aslam, A. On eccentricity-based topological indices study of a class of porphyrin-cored dendrimers. Biomolecules 2018, 8, 71. [Google Scholar] [CrossRef] [PubMed]
- Gao, W.; Wang, W.F. The fifth geometric–arithmetic index of bridge graph and carbon nanocones. J. Differ. Appl. 2016, 23, 100–109. [Google Scholar] [CrossRef]
- Ahmad, M.S.; Nazeer, W.; Kang, S.M.; Imran, M.; Gao, W. Calculating degree-based topological indices of dominating david derived networks. Open Phys. 2017, 15, 1015–1021. [Google Scholar] [CrossRef]
- Kang, S.M.; Zahid, M.A.; Virk, A.R.; Nazeer, W.; Gao, W. Calculating the degree-based topological indices of dendrimers. Open Chem. 2018, 16, 681–688. [Google Scholar] [CrossRef]
- Gayathri, P.; Priyanka, U. Degree based topological indices of zig-zag chain. J. Math. Inform. 2017, 11, 83–93. [Google Scholar] [CrossRef]
- Zhou, B.; Gutman, I. Relations between Wiener, hyper-Wiener and Zagreb indices. Chem. Phys. Lett. 2004, 394, 93–95. [Google Scholar] [CrossRef]
- Rucker, G.; Rucker, C. On topological indices, boiling points, and cycloalkanes. J. Chem. Inf. Comput. Sci. 1999, 39, 788–802. [Google Scholar] [CrossRef]
- Klavžar, S.; Gutman, I. A comparison of the Schultz molecular topological index with the Wiener index. J. Chem. Inf. Comput. Sci. 1996, 36, 1001–1003. [Google Scholar] [CrossRef]
- Brückler, F.M.; Došlić, T.; Graovac, A.; Gutman, I. On a class of distance-based molecular structure descriptors. Chem. Phys. Lett. 2011, 503, 336–338. [Google Scholar] [CrossRef]
- Deng, H.; Yang, J.; Xia, F. A general modeling of some vertex-degree based topological indices in benzenoid systems and phenylenes. Comp. Math. Appl. 2011, 61, 3017–3023. [Google Scholar] [CrossRef]
- Zhang, H.; Zhang, F. The Clar covering polynomial of hexagonal systems I. Discret. Appl. Math. 1996, 69, 147–167. [Google Scholar] [CrossRef]
- Gutman, I. Some properties of the Wiener polynomials. Graph Theory Notes N. Y. 1993, 125, 13–18. [Google Scholar]
- Deutsch, E.; Klavžar, S. M-Polynomial and degree-based topological indices. Iran. J. Math. Chem. 2015, 6, 93–102. [Google Scholar]
- Munir, M.; Nazeer, W.; Rafique, S.; Kang, S.M. M-polynomial and related topological indices of nanostar dendrimers. Symmetry 2016, 8, 97. [Google Scholar] [CrossRef]
- Munir, M.; Nazeer, W.; Rafique, S.; Nizami, A.R.; Kang, S.M. M-polynomial and degree-based topological indices of Titania nanotubes. Symmetry 2016, 8, 117. [Google Scholar] [CrossRef]
- Kwun, Y.; Munir, M.; Nazeer, W.; Rafique, S.; Kang, S.M. M-polynomial and degree-based topological indices of V-phenalinic nanotubes and nanotori. Sci. Rep. 2017, 7, 8756. [Google Scholar] [CrossRef] [PubMed]
- Munir, M.; Nazeer, W.; Rafique, S.; Nizami, A.R.; Kang, S.M. Some computational aspects of triangular boron nanotubes. Symmetry 2016, 9, 6. [Google Scholar] [CrossRef]
- Munir, M.; Nazeer, W.; Rafique, S.; Kang, S.M. M-Polynomial and degree-based topological indices of polyhex nanotubes. Symmetry 2016, 8, 149. [Google Scholar] [CrossRef]
- Gao, W.; Wu, H.; Siddiqui, M.K.; Baig, A.Q. Study of biological networks using graph theory. Saudi Bio. J. 2018, 25, 1212–1219. [Google Scholar] [CrossRef] [PubMed]
- Gao, W.; Siddiqui, M.K.; Imran, M.; Jamil, M.K.; Farahani, M.R. Forgotten topological index of chemical structure in drugs. Saudi Pharm. J. 2016, 24, 258–264. [Google Scholar] [CrossRef] [PubMed]
- Gao, W.; Wang, W. Second atom-bond connectivity index of special chemical molecular structures. J. Chem. 2014. [Google Scholar] [CrossRef]
- Gao, W.; Wang, W.; Farahani, M.R. Topological indices study of molecular structure in anticancer drugs. J. Chem. 2016. [Google Scholar] [CrossRef]
- Gao, W.; Wang, Y.; Basavanagoud, B.; Jamil, M.K. Characteristics studies of molecular structures in drugs. Saudi Pharm. J. 2017, 25, 580–586. [Google Scholar] [CrossRef] [PubMed]
- Wiener, H. Structural determination of paraffin boiling points. J. Am. Chem. Soc. 1947, 69, 17–20. [Google Scholar] [CrossRef] [PubMed]
- Dobrynin, A.A.; Gutman, I. Wiener index of trees: Theory and applications. Acta Appl. Math. 2001, 66, 211–249. [Google Scholar] [CrossRef]
- Gutman, I.; Polansky, O.E. Mathematical Concepts in Organic Chemistry; Springer: New York, NY, USA, 1986. [Google Scholar]
- Randić, M. On characterization of molecular branching. J. Am. Chem. Soc. 1975, 97, 6609–6615. [Google Scholar] [CrossRef]
- Bollobás, B.; Erdös, P. Graphs of extremal weights. Ars Comb. 1998, 50, 225–233. [Google Scholar] [CrossRef]
- Amić, D.; Bešlo, D.; Lučić, B.; Nikolić, S.; Trinajstić, N. The vertex-connectivity index revisited. J. Chem. Inf. Comput. Sci. 1998, 38, 819–822. [Google Scholar] [CrossRef]
- Hu, Y.; Li, X.; Shi, Y.; Xu, T.; Gutman, I. On molecular graphs with smallest and greatest zeroth-Corder general Randić index. MATCH Commun. Math. Comput. Chem. 2005, 54, 425–434. [Google Scholar]
- Caporossi, G.; Gutman, I.; Hansen, P.; Pavlovic, L. Graphs with maximum connectivity index. Comput. Biol. Chem. 2003, 27, 85–90. [Google Scholar] [CrossRef]
- Li, X.; Gutman, I. Mathematical Aspects of Randić-Type Molecular Structure Descriptors; Mathematical Chemistry Monographs, No. 1; University of Kragujevac: Kragujevac, Serbia, 2006. [Google Scholar]
- Kier, L.B.; Hall, L.H. Molecular Connectivity in Chemistry and Drug Research; Academic Press: New York, NY, USA, 1976. [Google Scholar]
- Kier, L.B.; Hall, L.H. Molecular Connectivity in Structure-Activity Analysis; Wiley: New York, NY, USA, 1986. [Google Scholar]
- Dimitrov, D. On structural properties of trees with minimal atom-bond connectivity index IV: Solving a conjecture about the pendent paths of length three. Appl. Math. Comput. 2017, 313, 418–430. [Google Scholar] [CrossRef] [Green Version]
- Gutman, I.; Furtula, B. (Eds.) Recent Results in the Theory of Randić Index; University of Kragujevac: Kragujevac, Serbia, 2008. [Google Scholar]
- Randić, M. On History of the Randić Index and Emerging Hostility toward Chemical Graph Theory. MATCH Commun. Math. Comput. Chem. 2008, 59, 5–124. [Google Scholar]
- Randić, M. The connectivity index 25 years After. Mol. Graph. Model. 2001, 20, 19–35. [Google Scholar] [CrossRef]
- Li, X.; Shi, Y. A survey on the Randić index. MATCH Commun. Math. Comput. Chem. 2008, 59, 127–156. [Google Scholar]
- Dimitrov, D.; Milosavljević, D. Efficient computation of trees with minimal atom-bond connectivity index revisited. MATCH Commun. Math. Comput. Chem. 2018, 79, 431–450. [Google Scholar]
- Nikolić, S.; Kovačević, G.; Miličević, A.; Trinajstić, N. The Zagreb indices 30 years after. Croat. Chem. Acta 2003, 76, 113–124. [Google Scholar]
- Gutman, I.; Das, K.C. The first Zagreb indices 30 years after. MATCH Commun. Math. Comput. Chem. 2004, 50, 83–92. [Google Scholar]
- Das, K.C.; Gutman, I. Some properties of the second Zagreb index. MATCH Commun. Math. Comput. Chem. 2004, 52, 103–112. [Google Scholar]
- Trinajstić, N.; Nikolić, S.; Miličević, A. Gutman On Zagreb indices. Kem. Ind. 2010, 59, 577–589. (In Croatian) [Google Scholar]
- Vukičević, D.; Graovac, A. Valence connectivities versus Randić, Zagreb and modified Zagreb index: A linear algorithm to check discriminative properties of indices in acyclic molecular graphs. Croat. Chem. Acta 2004, 77, 501–508. [Google Scholar]
- Huang, Y.; Liu, B.; Gan, L. Augmented Zagreb index of connected graphs. MATCH Commun. Math. Comput. Chem. 2012, 67, 483–494. [Google Scholar]
- Chen, K.; Sun, C.; Song, S.; Xue, D. Polymorphic crystallization of Cu2O compound. Cryst Eng Comm 2014, 16, 52–57. [Google Scholar] [CrossRef]
- Yuhas, B.D.; Yang, P. Nanowire-Based All-Oxide Solar Cells. J. Am. Chem. Soc. 2009, 131, 3756–3761. [Google Scholar] [CrossRef] [PubMed] [Green Version]
- Zhang, J.; Liu, J.; Peng, Q.; Wang, X.; Li, Y. Nearly monodisperse Cu2O and CuO nanospheres: preparation and applications for sensitive gas sensors. Chem. Mater. 2006, 18, 867–871. [Google Scholar] [CrossRef]
- Cotton, F.A.; Wilkinson, G.; Murillo, C.A.; Bochmann, M. Advanced Inorganic Chemistry; John Wiley and Sons: Hoboken, NJ, USA, 1999. [Google Scholar]
Figure 1.
Crystallographic structure of Cu2O.

Figure 2.
Formation of Cu2O lattices.

Figure 3.
Unit cell of Cu2O.

Figure 4.
Cu2O[1,1,1].

Figure 5.
Cu2O[3,2,3].

Figure 6.
3D plot of first Zagreb index.

Figure 7.
3D plot of second Zagreb index.

Figure 8.
3D plot of modified second Zagreb index.

Figure 9.
3D plot of Randić index.

Figure 10.
3D plot of Inverse Randić index.

Figure 11.
3D plot of Symmetric division index.

Figure 12.
3D plot of Harmonic index.

Figure 13.
3D plot of Inverse sum index.

Figure 14.
3D plot of Augmented Zagreb index.

Figure 15.
TiF2[1,1,1].

Figure 16.
TiF2[4,1,2].


Table 1.
Derivation of some topological indices from the M-polynomial.
| Topological Index | Derivation from |
|---|---|
| First Zagreb | |
| Second Zagreb | |
| Second Modified Zagreb | |
| General Inverse Randi | |
| Symmetric Division Index | |
| Harmonic Index | |
| Inverse sum Index |
© 2018 by the authors. Licensee MDPI, Basel, Switzerland. This article is an open access article distributed under the terms and conditions of the Creative Commons Attribution (CC BY) license (http://creativecommons.org/licenses/by/4.0/).
Share and Cite
MDPI and ACS Style
Gao, W.; Younas, M.; Farooq, A.; Mahboob, A.; Nazeer, W. M-Polynomials and Degree-Based Topological Indices of the Crystallographic Structure of Molecules. Biomolecules 2018, 8, 107. https://doi.org/10.3390/biom8040107
AMA Style
Gao W, Younas M, Farooq A, Mahboob A, Nazeer W. M-Polynomials and Degree-Based Topological Indices of the Crystallographic Structure of Molecules. Biomolecules. 2018; 8(4):107. https://doi.org/10.3390/biom8040107
Chicago/Turabian StyleGao, Wei, Muhammad Younas, Adeel Farooq, Abid Mahboob, and Waqas Nazeer. 2018. "M-Polynomials and Degree-Based Topological Indices of the Crystallographic Structure of Molecules" Biomolecules 8, no. 4: 107. https://doi.org/10.3390/biom8040107
Note that from the first issue of 2016, this journal uses article numbers instead of page numbers. See further details here.