Analytical Considerations of Stable Isotope Labelling in Lipidomics


Department of Biochemistry, Yong Loo Lin School of Medicine, National University of Singapore; Singapore 117596, Singapore
*
Author to whom correspondence should be addressed.
Biomolecules 2018, 8(4), 151; https://doi.org/10.3390/biom8040151
Submission received: 30 October 2018
/
Revised: 12 November 2018
/
Accepted: 13 November 2018
/
Published: 16 November 2018
(This article belongs to the Special Issue Lipidomics)
Abstract
:Over the last two decades, lipids have come to be understood as far more than merely components of cellular membranes and forms of energy storage, and are now also being implicated to play important roles in a variety of diseases, with lipid biomarker research one of the most widespread applications of lipidomic techniques both in research and in clinical settings. Stable isotope labelling has become a staple technique in the analysis of small molecule metabolism and dynamics, as it is the only experimental setup by which biosynthesis, remodelling and degradation of biomolecules can be directly measured. Using state-of-the-art analytical technologies such as chromatography-coupled high resolution tandem mass spectrometry, the stable isotope label can be precisely localized and quantified within the biomolecules. The application of stable isotope labelling to lipidomics is however complicated by the diversity of lipids and the complexity of the necessary data analysis. This article discusses key experimental aspects of stable isotope labelling in the field of mass spectrometry-based lipidomics, summarizes current applications and provides an outlook on future developments and potential.

1. Introduction
Lipidomics is the study of cellular lipids and their roles in health and disease [1]. The field came to prominence in the early 2000s [2,3] and has now become indispensable in basic and clinical research, as lipids emerge more and more from being viewed as merely energy-storage molecules, and instead are being implicated in a plethora of pathological conditions, such as metabolic syndrome, cardiovascular and neurodegenerative diseases, as well as cancer [4].
Most lipidomic studies are based on the determination of the levels of lipids and on their comparison either between disease and control groups, at different time points, or before and after treatments. This is by design merely a static measurement of what is really a very dynamic metabolism, and whenever, e.g., differences in the concentrations of circulating lipids in plasma are found, this might either be due to different rates of synthesis or degradation, or due to the release from another storage pool. For example, an increase of plasma triacylglycerols may be due to uptake from food or to release from adipose tissue. While this difference is impossible to assess using pure concentration-based approaches, it may have important different biochemical implications. While the absolute concentration of phosphatidic acid is constantly low, it still has a high rate of metabolic flux, and due to its central position in phospholipid metabolic pathways, is constantly biosynthesized and processed into other phospholipids [5].
Therefore, when it comes to investigating lipid metabolism and dynamics-biosynthesis directly, transport, interconversion and degradation-stable isotope labelling is the technique of choice and provides an additional dimension of information to absolute quantitative values. In all stable isotope labelling studies, a stable isotope label in a substrate, usually 13C or deuterium (2H), is metabolized into all resulting metabolites [6]. Stable isotope tracing therefore enables the determination of the metabolic fate of stable isotope-labelled precursors. This approach has been used since as early as the 1930s, when deuterium labelling was first used to investigate murine fatty acid metabolism and determine that even under a hypocaloric diet, dietary fatty acids were not immediately oxidized, but stored and released from fat tissue [7]. Far before the age of bioanalytical mass spectrometry, the deuterium content was measured using refractometry and densitometry in water after combustion of the labelled biomolecules.
Nowadays, modern instrumentation offers a far greater level of detail. Coupling of chromatography and mass spectrometry enables more than just the determination of total labelling; instead, labelling of individual lipid species can be investigated, and even the localization and the enrichment of the label within lipids can be determined using appropriate analysis strategies. Stable isotope labelling has already been applied to numerous studies of lipid metabolism (recently reviewed by Ecker and Liebisch [8]), and the techniques used have evolved with time and with the analytical instrumentation available.
This article discusses the fundamentals and important experimental aspects of stable isotope labelling for application to mass spectrometry-based lipidomics and offers an outlook on the future and the potentials of this technique.
2. Fundamentals
2.1. Stable Isotope-Labelled Compounds in Lipidomics
Stable isotope labelled lipids are routinely used in lipidomic laboratories, yet not as tracers for labelling studies. They are considered ideal internal standards, and the gold standard for absolute quantitation [9,10,11], but the commercial availability of suitable isotope-labelled standards is limited compared to the complexity of the lipidome, which comprises hundreds and thousands of different lipids. Techniques such as lipidome isotope labelling of yeast (LILY) [12] attempt to solve this problem by growing Pichia pastoris on uniformly 13C-labelled glucose as the carbon source, thereby successively labelling yeast metabolites with 13C to a labelling degree of over 99.5%. Obtaining a near-complete labelling efficiency is important, as otherwise, the concentration of lipids would be overestimated. The labelled yeast lipid extract can then be used to correct for matrix effects, both in yeast and other matrices such as human plasma [13], and for more accurate quantitation. Although the yeast lipidome comprises fewer lipid classes and lipid species than more complex mammalian lipidomes, this is a helpful approach to account for ionization differences and matrix effects during lipidomic analysis.
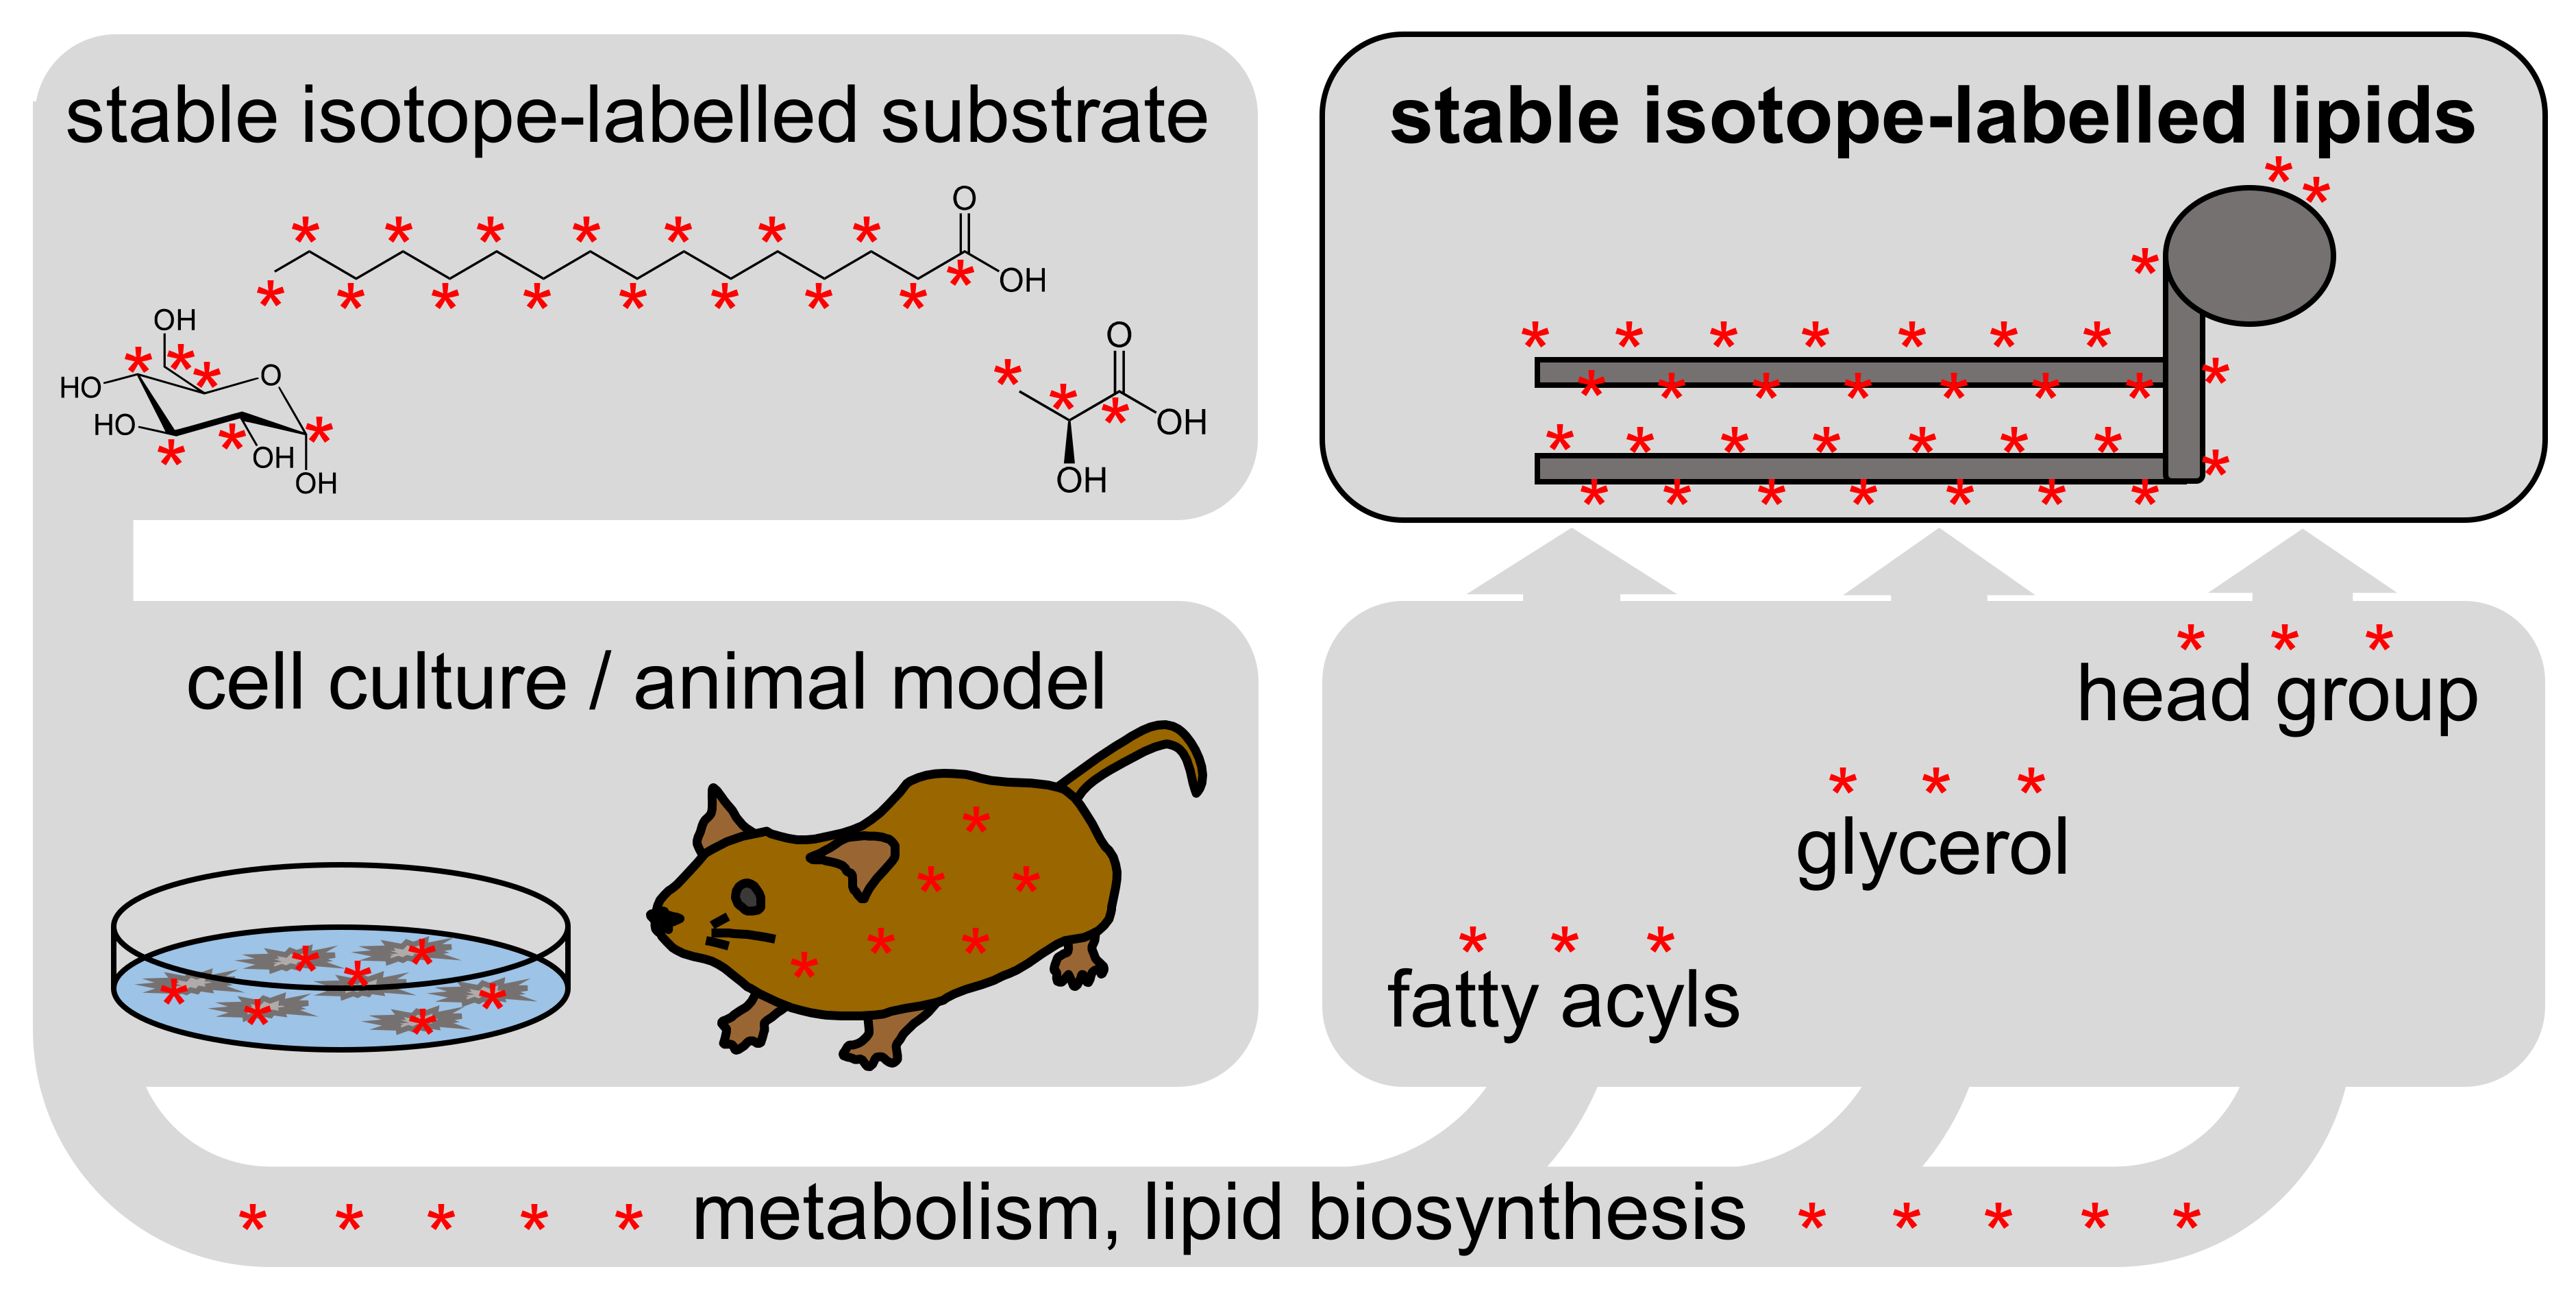
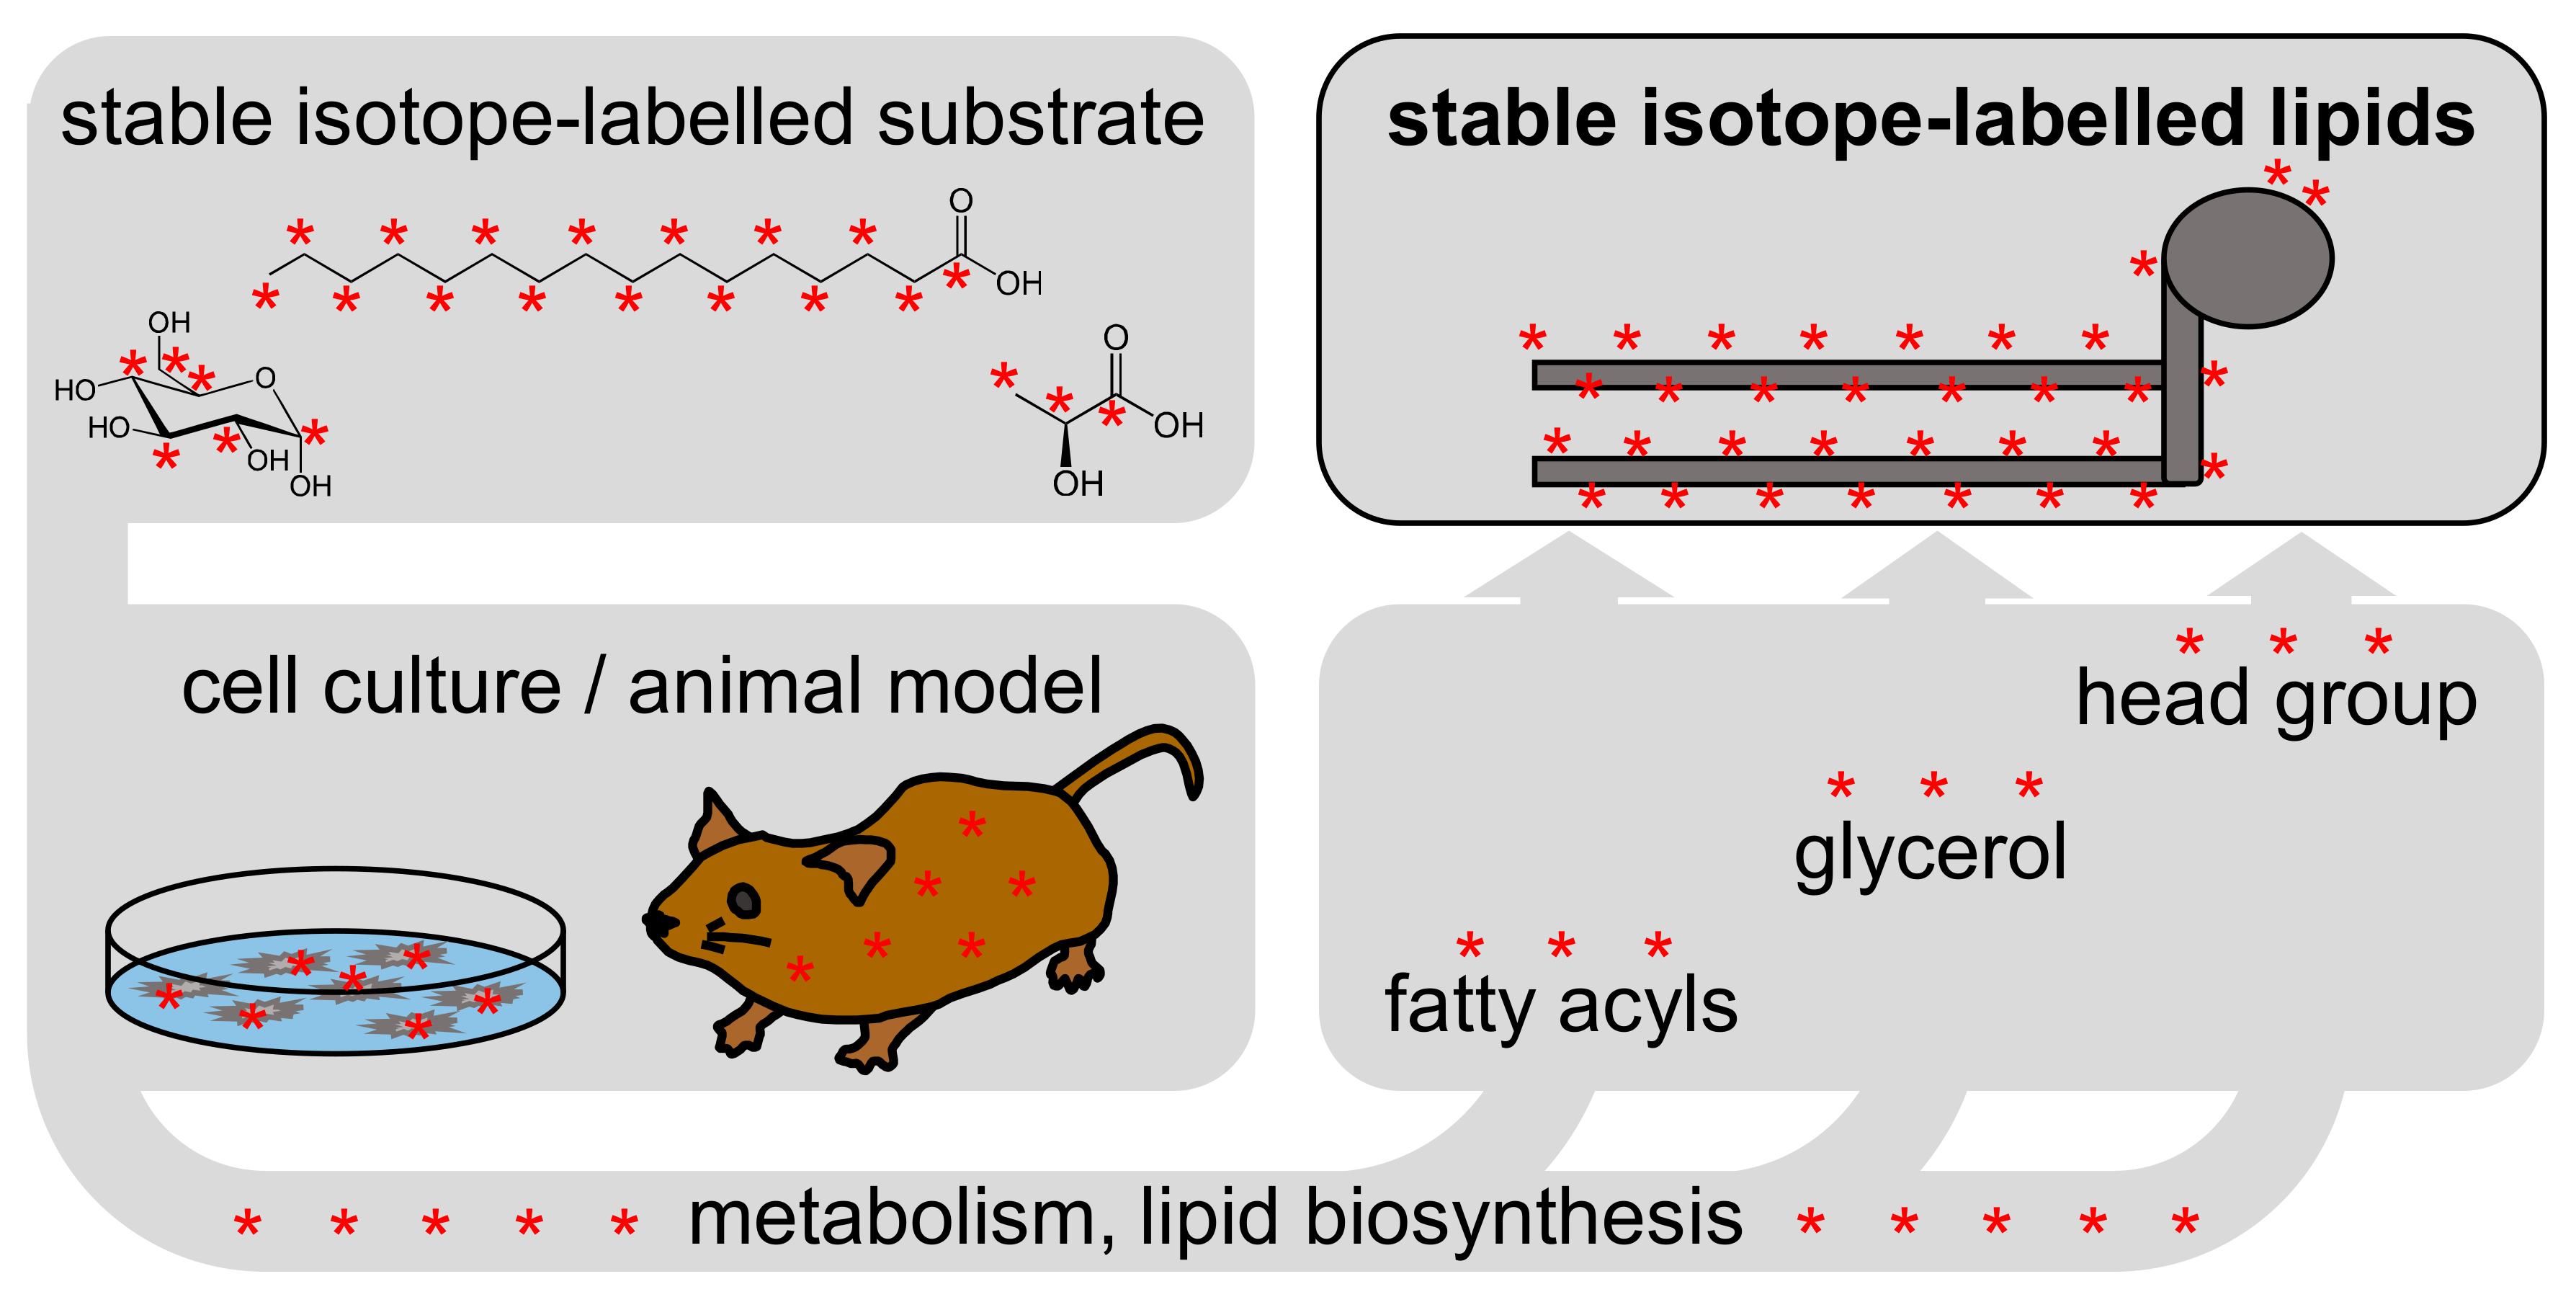
The LILY approach includes the fundamental principle of stable isotope labelling, depicted in Figure 1: A stable isotope-labelled substrate is metabolized by a biological system, and the stable isotope substrate is incorporated into the resulting metabolites. As shown schematically in Figure 1, phospholipids consist of fatty acyls, a glycerol backbone, and a head group. Depending on the metabolic pathway of the substrate and the duration of labelling, lipids may be partially or fully labelled, labelled across all, or only on certain building blocks.
2.2. Tracers and Tracees
Stable isotope labelling makes use of the simple fact that while isotopes (nuclides with different number of neutrons) have different mass, they behave chemically identical. Therefore, stable isotope-labelled molecules (“tracers”) have the same biochemical properties as their monoisotopic equivalents, and a stable isotope-labelled tracer is metabolized identically to the unlabelled form (the “tracee”) [14]. Tracers and tracees can however be detected separately using analytical techniques such as mass spectrometry or nuclear magnetic resonance (NMR).
Historically, radiolabelled tracers have frequently been used in metabolism research, but they have now largely been replaced by stable isotope-labelled tracers. While radioactive tracers may have the advantage of higher analytical sensitivity, this is somewhat offset by strict legal restrictions on handling and waste disposal, limitations of use of radiolabelled tracers in humans and potential interference with physiological metabolism [8,15,16].
In the context of stable isotope labelling, the term “mass isotopomer” is often used in in literature [8,17,18,19,20,21,22] to refer to what should correctly be called “isotopologue”. International Union of Pure and Applied Chemistry (IUPAC) defines isotopologue as a “molecular entity that differs only in isotopic composition (number of isotopic substitutions), e.g., CH4, CH3D, CH2D2” [23], whereas an “isotopomer” is defined as “isomers having the same number of each isotopic atom but differing in their positions” [24], a misleading term when it is used in the context of mass spectrometry, which is not capable of determining the location of an individual atom within an ion. Therefore, compounds with different numbers of heavy isotope labels (13C/2H/15N), together with the corresponding monoisotopic molecule, should correctly be called isotopologues.
3. Analytical Considerations
3.1. Choice of Tracer
The choice of tracer molecule depends largely on the metabolic pathway in question. Labelling with glucose or heavy water will lead to generalized incorporation of the label into a large number of different metabolites, while more pathway-specific tracers can be chosen, e.g., serine or palmitoyl-CoA for the sphingolipid pathway [25], or lipid head groups such choline can be used to investigate biosynthesis of choline-containing lipid classes. Commonly-used labelled substrates for tracing lipid flux are glucose or glycerol [26,27,28], fatty acids [19,29], amino acids [17,27,30], or heavy water (D2O) as an unspecific tracer [31,32]. In animal or human studies, the tracer can be a substantial cost factor, as rather large amounts may be required to achieve a sufficient degree of labelling, and because injectable tracers for human studies must be sterile.
The two most commonly-used heavy isotopes used in labelling of biomolecules are 13C and deuterium, as carbon and hydrogen are found in all biomolecules. 15N can also be used as a tracer, but its use is limited to nitrogen-containing lipids. If feasible, a 13C-labelled tracer is often preferred over deuterium for two reasons: firstly, when a deuterium-labelled tracer is used, deuterium exchange can occur in protic solutions (e.g., during storage), which can decrease the grade of labelling, and secondly, deuterium labels on fatty acids may be lost during fatty acid desaturation.
The potential of tracer recycling is another consideration in the choice of tracer. When tracer recycling occurs, the labelled tracer is biosynthesized again in a second round of metabolism, which would lead to overestimation of the actual degree of labelling and to erroneous calculation of synthesis or flux rates [33,34,35].
3.2. Sample Preparation
In lipidomics experiments, cells or tissues are typically flash frozen or immersed in cold organic solvents to stop enzymatic reactions, chemical degradation, oxidation, and to preserve a snapshot of the metabolic state [36]. Labelled lipids behave identically to non-labelled lipids, and existing sample preparation methods do not need to be amended for stable isotope labelling experiments. Lipids are typically extracted using either single-phase protein precipitation methods [37] or two-phase partitioning methods using either chloroform [38,39] methyl-tert-butyl ether (MTBE) [40] or a heptane/ethyl acetate mixture [41]. For enrichment of particular lipid classes, or for separation of a lipid extract into its constituent lipid classes, solid-phase extraction (SPE) [42] or thin-layer chromatography [43] can be employed. Furthermore, chemical derivatization can be used for enhanced ionization and improved detection of low abundant lipid classes [44,45]. Derivatization and SPE are time-consuming procedures, which are typically only necessary if the analysis is targeted toward extremely low abundant lipid classes, while for most applications, a single-phase precipitation or a two-phase extraction method is sufficient.
3.3. Sample Introduction
A paradigm decision in all lipidomic analysis is the choice of sample introduction, which can be performed either with chromatographic separation or without (“direct infusion” or “shotgun” “lipidomics”) [46,47]. While chromatographic separation is often the preferred choice for stable isotope experiments, Schuhmann et al. have employed shotgun lipidomics in metabolic labelling experiments [48], labelling cellular lipids with 15N-choline and 15N-serine, and Sun et al. have used shotgun techniques to analyze a 13C6 glucose-labelled murine lipidome. The use of the shotgun technique is in these cases possible because high resolution accurate mass spectrometry minimizes the chance of m/z overlaps. Direct infusion has also been used to probe phospholipid remodelling, using labelled choline as a substrate [49]. Here, the lack of chromatographic separation does not pose a problem, as class-specific precursor ion scans are used, and no complex labelling patterns (as shown in Figure 2) are observed.
With chromatographic separation, an additional selectivity criterion is added, as the labelled molecule must have identical retention time as the unlabelled molecule. While this is usually the case with 13C-labelled compounds, deuterium labelling can lead to a considerable retention time shift compared to the monoisotopic compounds, both in normal and reversed phase chromatography [50,51,52] due to different hydrogen bond strengths between protium- and deuterium-containing molecules. In gas chromatography (GC-MS), this effect is less noticeable or not present at all [53].
The metabolism of fatty acids is frequently studied using stable isotope labelling, and analyzed using GC-MS [54,55]. Depending on sample preparation, analysis can be targeted to either free fatty acids (FFA, or non-esterified fatty acids (NEFA)) [53] or to total fatty acids (TFA) comprising both free fatty acids and fatty acids bound to lipids [56]. The advantage of GC is its very high chromatographic resolution, for example for isomeric fatty acids (such as the double bond positional isomers 20:3 ω-3/ω-6/ω-9). However, any metabolic flux analysis of total fatty acids does not give information from which lipid classes or lipid species the fatty acids have originated.
Reversed phase (RP) chromatography is often used for analysis of stable isotope-labelled lipidomes [27,28,57,58,59], and hydrophilic interaction liquid chromatography (HILIC) has also been employed [60]. RP separates lipids according to their overall hydrophobicity (governed largely by hydrocarbon chain length), whereas the separation in HILIC is driven by the lipid head groups, with only minimal separation within individual classes [46]. Therefore, all lipids of one class elute together in HILIC and would produce a very complex spectrum containing all isotopologues of all lipids of one particular class. In reversed phase, however, lipids belonging to the same class, but differing in carbon number and degree of unsaturation, are chromatographically separated, which greatly reduces spectral complexity and simplifies analysis [61].
3.4. Instrumental Considerations
Fatty acids can be readily analyzed after derivatization and GC separation by either electron ionization (EI) or chemical ionization (CI) coupled to a single quadrupole mass analyzer. EI produces a spectrum that is dominated by fragment ions [55], whereas CI (after derivatization with pentafluorobenzyl bromide) produces highly abundant molecular ions without further in-source fragmentation and is therefore better suited for isotopologue analysis.
The second paradigm decision in LC-MS analysis is the choice of mass spectrometer. For isotope labelling studies, triple quadrupole instruments or high resolution instruments such as Orbitraps and QTOFs (quadrupole-time-of-flight) are most widely used. Triple quadrupole instruments are best suited for determining the incorporation of labelled building blocks (e.g., of head groups such as labelled choline [49,60] or ethanolamine [62], or of fatty acids [19,57,63]), as these can be readily detected using precursor or neutral loss scans. In contrast, high resolution mass spectrometers rely on the acquisition of full scan spectra with high resolution and high mass accuracy to identify compounds [29,48]. Modern high resolution instruments are routinely capable of resolutions above 100,000 and mass accuracies below 1 ppm, allowing for near-unambiguous determination of isotopologues [26,64]. Another benefit of ultra-high resolution (R > 100,000 [64]) analysis is that it can enable multi-tracer studies, as multiple tracers with different isotopic labels (13C or deuterium) and/or different degrees of labelling (13C2 or 2H2) can be differentiated from each other by high resolution mass spectrometry [48,65] and therefore be used simultaneously in a biological system.
Depending on the type of analysis, different acquisition modes are preferred. For building block analysis, e.g., incorporation of labelled fatty acids, or of head groups, precursor or neutral loss scans for the labelled building blocks on triple quadrupole instruments are well suited. For analysis of unspecific labelling, e.g., labelling of fatty acids through de novo synthesis or elongation, which leads to a much more complex labelling pattern, high resolution accurate mass full scans (such as shown in Figure 2b) provide more information, and allow calculation of the enrichment of the various isotopic states of all lipids detected.
While mass spectrometry is the most widespread technique for analyzing lipid flux, NMR spectrometry is an emerging technique in lipidomics and is already being applied for NMR-based metabolomics [66]. The advantages of NMR are high reproducibility and reliable quantitation, but its applicability for lipid analysis is currently limited by the inability to differentiate between molecular species of one lipid class and its higher detection limit compared to mass spectrometry [67].
4. Data Analysis
4.1. Information Content
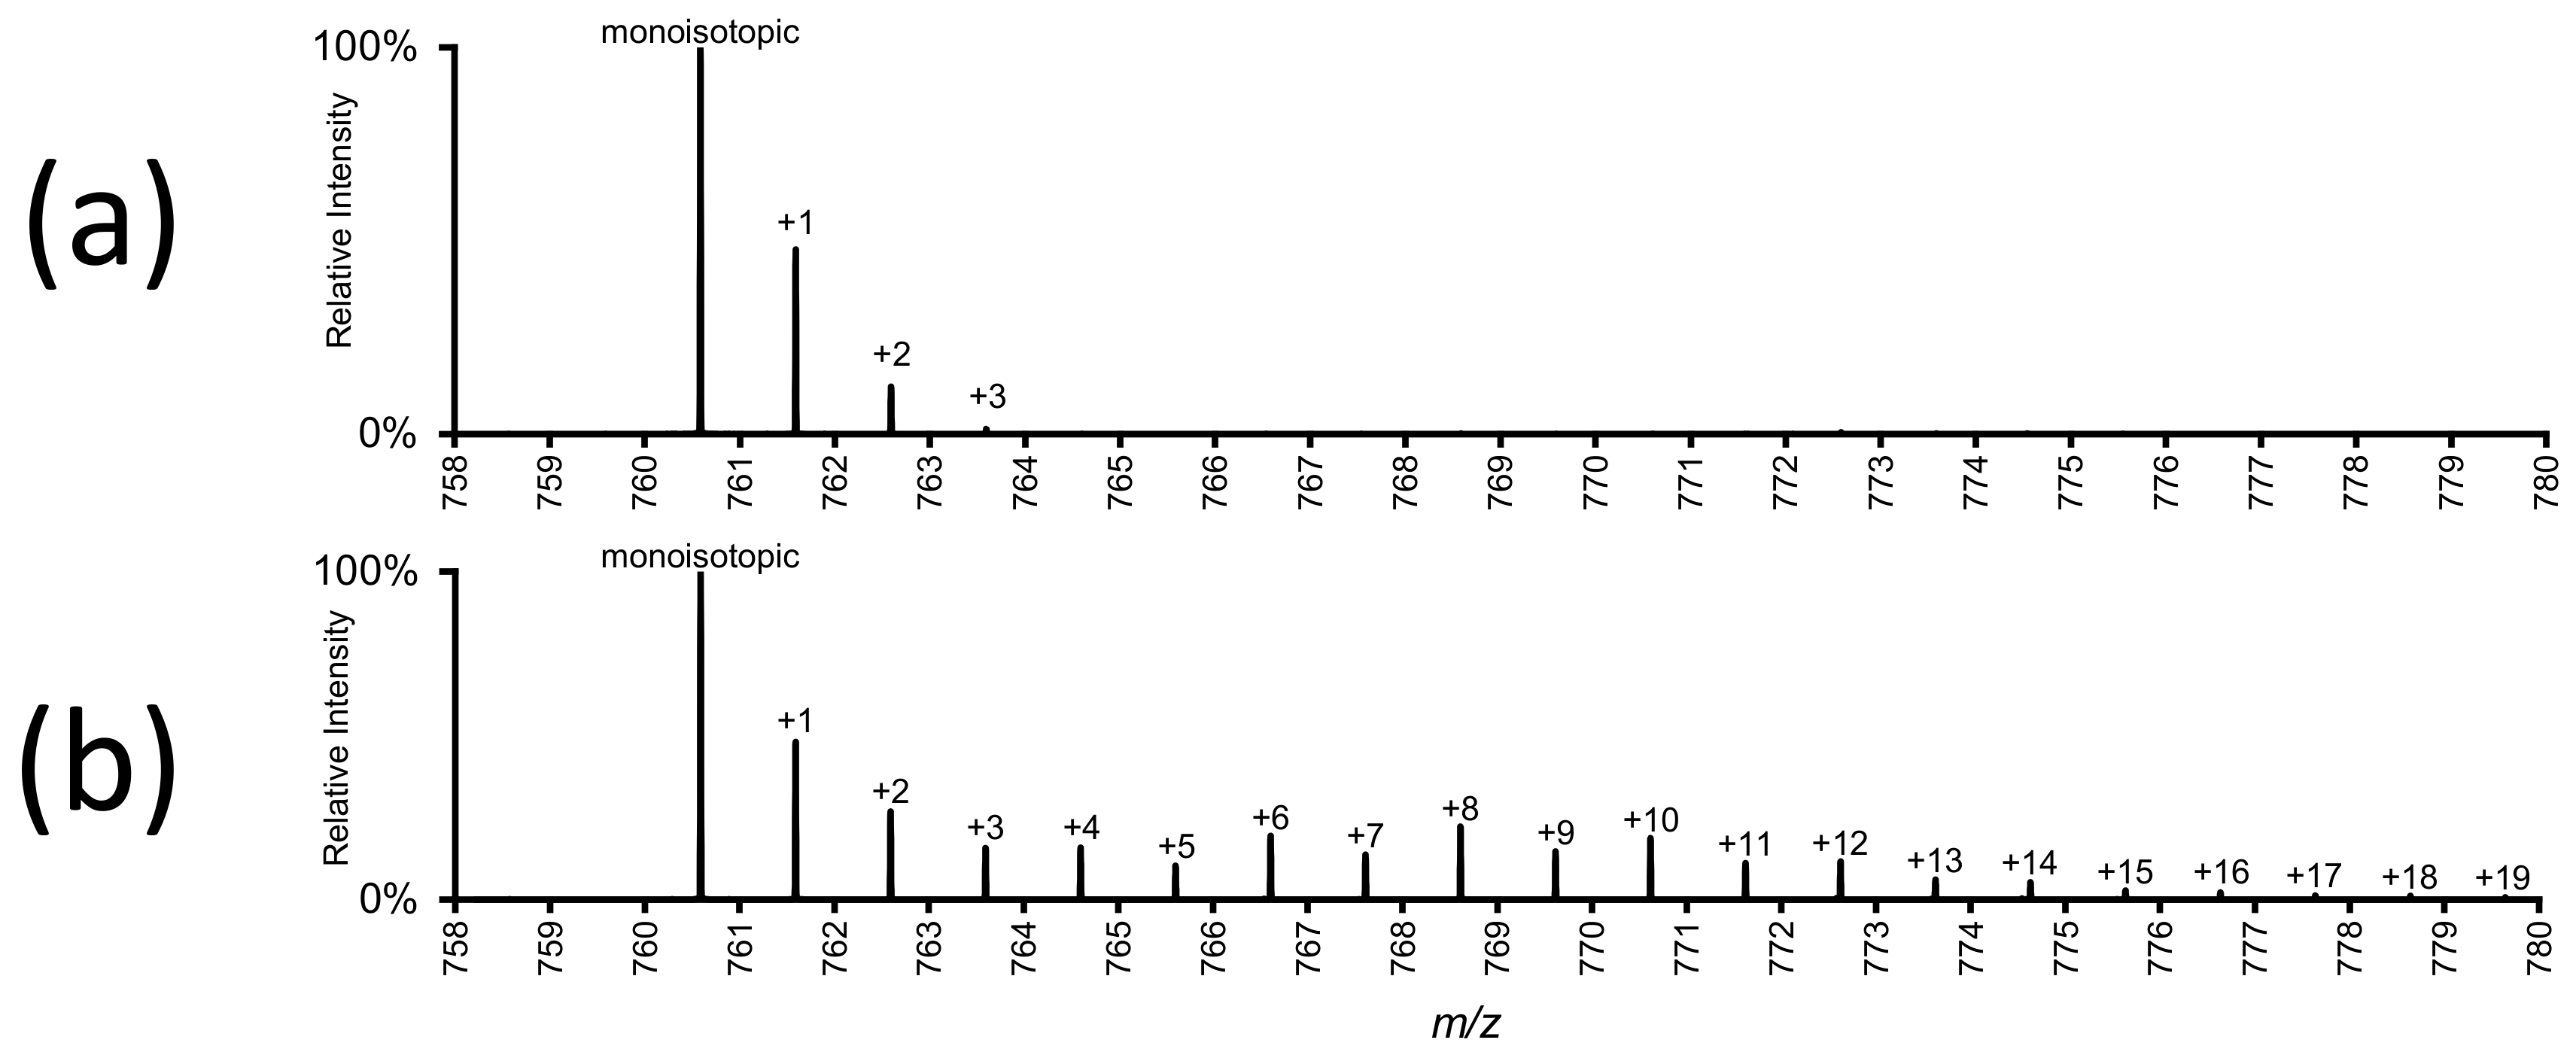
When single-stage mass spectrometry (MS1) is used for stable isotope labelling, the isotopic enrichment of the label in individual lipids can be determined. Figure 2b shows the mass spectrum of a labelled phospholipid after reversed phase separation. Using untargeted high-resolution full scanning, other lipids species and all their isotopologues can also be detected, and the isotopic enrichment can be determined for each individual lipid.
Tandem mass spectrometry is typically used in the form of precursor or neutral loss scans for building-block level analysis, such as the incorporation of labelled head groups or of labelled fatty acyls. However, tandem mass spectrometry can also be utilized to determine the location of the isotopic label within a lipid and the isotopic enrichment within lipid building blocks. For example, collisional dissociation of cholesterol esters produces a cholesterol-derived fragment ion. Therefore, if the same mass shift (due to an isotopic label) is observed for both the parent ion and the fragment ion, then the stable isotope label is located not on the fatty acyl, but on the cholesterol moiety [68].
The tandem mass spectrometric behavior of lipids has been extensively studied [69,70,71], and many fragment ions can be obtained which are indicative of the different lipid building blocks. For example, collisional dissociation of phosphatidylcholine in negative ion mode gives rise to multiple ions indicative of the fatty acyls and the head group, and even positional assignment of the fatty acyls is possible by comparing the relative intensities of fatty acyl-derived fragment ions.
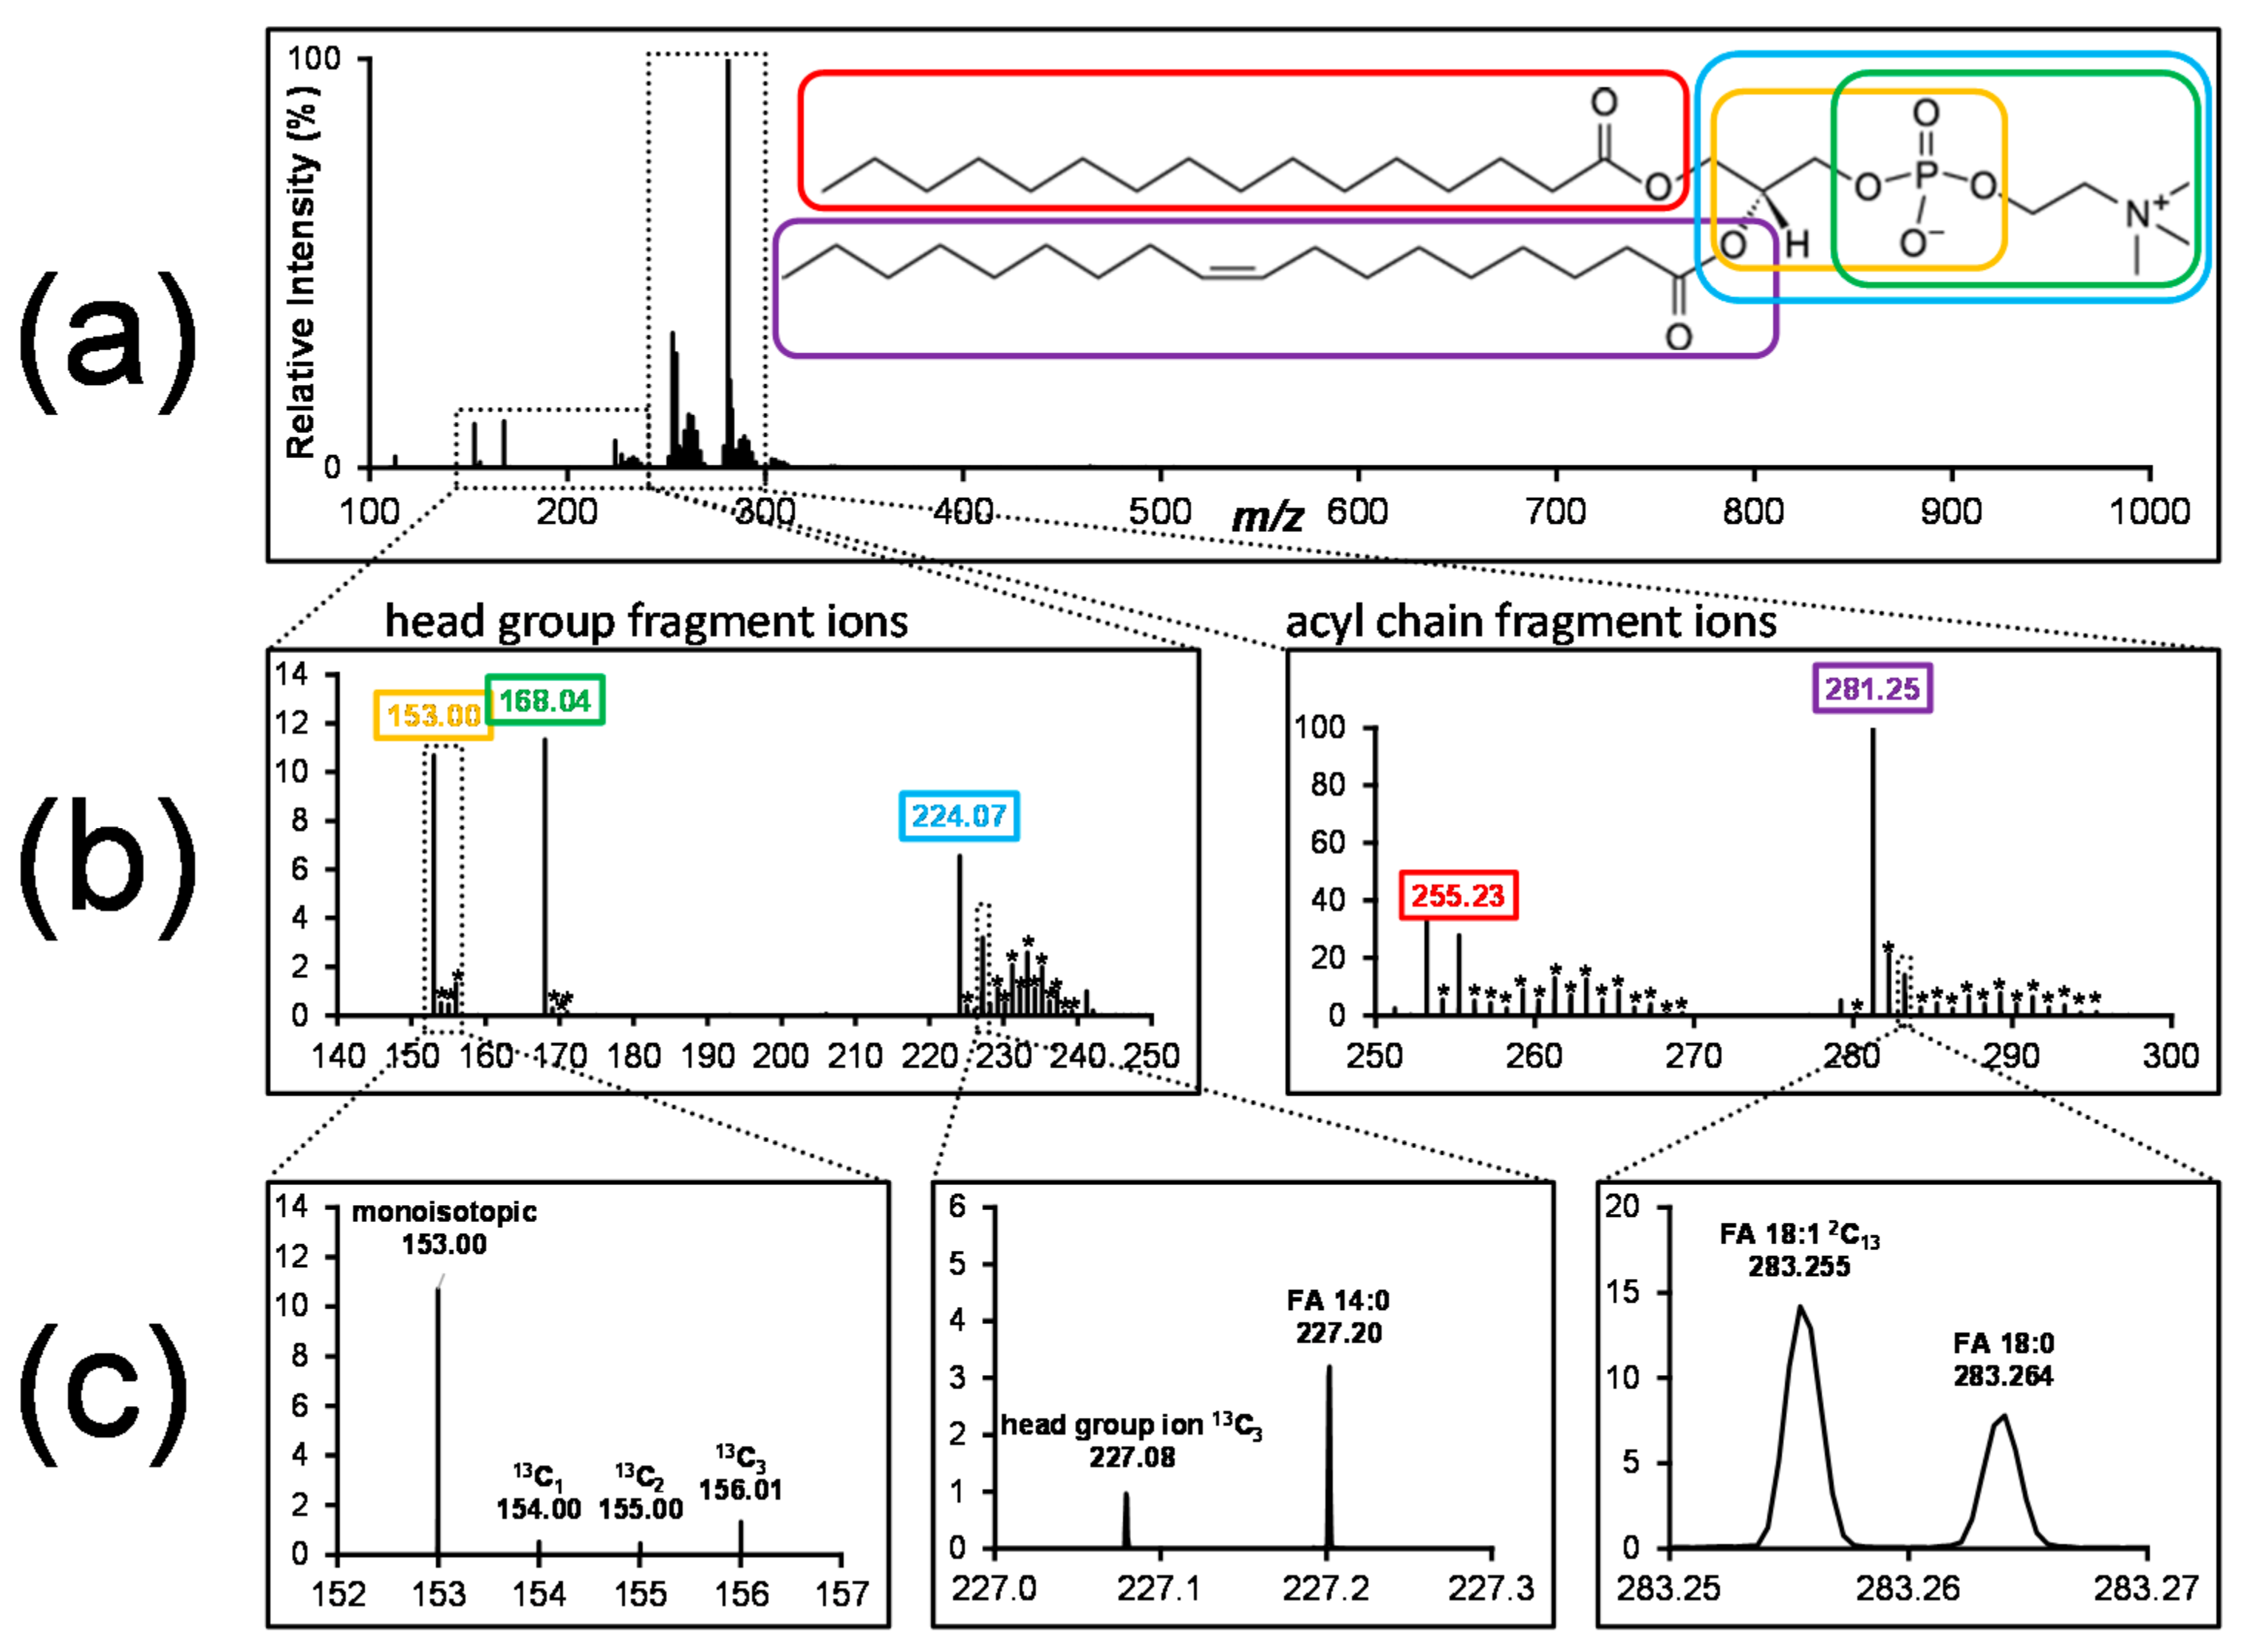
Figure 3 shows a product ion spectrum of stable isotope-labelled PC (phosphatidylcholine) and illustrates how high-resolution tandem mass spectrometry can be utilized for detailed labelling analysis. Using appropriate data acquisition methods (i.e., a wide isolation window for fragmentation and sufficient resolution to separate close m/z values), all isotopologues of one lipid species are selected, fragmented and detected. The resulting fragment spectrum contains fragment ions indicative of the head group and of the fatty acyls, as well as all isotopologues. Similar to the calculation of isotopic enrichment of one lipid species from MS1 data, this enables the calculation of isotopic enrichment in the individual lipid building blocks, such as fatty acyls, the glycerol backbone and head group. High mass resolution separates close m/z pairs belonging to different lipid constituents (Figure 3c, middle panel, 13C3 glycerophosphocholine, m/z 227.08, and monoisotopic FA 14:0, m/z 227.20), or belonging to fatty acyls with different degrees of labelling (Figure 3c, right panel, monoisotopic FA 18:0, m/z 283.264, and 13C2 FA 18:1, m/z 283.255). This illustrates how the information from high resolution tandem mass spectrometry can be utilized to detect the isotopic label in a specific lipid building block.
4.2. Isotope Correction
Elements used as tracers have naturally-occurring isotopes, which differ in the number of neutrons in the atomic nuclei, and therefore have different atomic mass. Of the two stable isotopes of carbon, 12C makes up 98.9% of all carbon atoms, while 13C constitutes the remaining 1.1% [73]. Lipids typically contain about 20–60 carbon atoms, which means that the natural abundance of 13C already leads to considerable isotopic peaks, even without deliberate labelling (Figure 2a). Any experimentally-induced 13C stable isotope labelling is therefore additional to the natural abundance of 13C. The same effect is also present for deuterium, even though the natural abundance of deuterium is much lower than that of 13C (only 0.01% of hydrogen is deuterium [73]).
Raw mass spectra of stable isotope-labelled compounds, such as shown in Figure 2, need to be corrected for natural isotope distribution. It is important to always include an unlabelled control in the experiment (rather than just adjusting for expected isotope distribution) as the isotopologues of metabolites might not always be measured accurately. Orbitrap mass spectrometers have been shown to underreport the intensities of heavier isotopologues under certain conditions [74], and appropriate experimental control is necessary to recognize this detrimental effect.
Figure 4 shows the data from the spectra in Figure 2 after correction for natural 13C abundance with IsoCor [75]: After isotope correction, the cells grown on monoisotopic substrate show no 13C labelling, while 53% of PC 34:1 from cells grown on 13C6-glucose is labelled with one or more 13C. The same principles of isotope correction could also be applied to the data from Figure 3 to determine the 13C enrichment in the choline head group and the constituent fatty acyls.
There are many freely-available and/or open source software packages for isotope correction, such as IsoCor [75], X13MS [76], AccuCor [74], Isotope Correction Toolbox (ICT) [77] or LS-MIDA [78] (this is a non-exhaustive list and not intended as recommendations). Isotope correction of full-scan data is relatively straightforward, and essentially consists of subtracting the calculated natural abundances of the isotopologues from the measured data based on the elemental composition. Isotope correction of SRM (selected reaction monitoring) data introduces an additional level of complexity, because an isotope effect may or may not be measured, depending on the distribution of the heavy isotopes between the precursor-product ion pairs measured [79].
4.3. Flux Analysis
As with most bioanalytical workflows, data analysis of stable isotope labelling experiments is the major bottleneck, in particular since it currently is automated to only a very small degree. Flux analysis is the complex mathematical and statistical treatment of data derived from isotope labelling to quantify metabolic flux. Detailed information about biosynthesized, i.e., labelled, compounds within a biosynthetic pathway is fed into algorithms and modelled on existing knowledge of the metabolic pathways. Flux analysis takes place outside the analytical laboratory and has been described in detail [80,81,82,83,84,85,86,87,88,89,90]. Software packages for flux analysis of small molecules are available (e.g., FiatFlux [91], OpenFLUX [92], 13C-FLUX [93], OpenMoebius [94], INCA [95] or Agilent VistaFlux [96]), but their applicability to integrated lipid flux analysis may be limited.
5. Conclusions
Stable isotope labelling is a powerful technique with promising applications. It enables direct analysis of nutrient distribution, metabolism, conversion into metabolites and the fate of the resulting metabolites. In contrast to radioactive labelling, there are no dangers or safety concerns, making this technique particularly well suited for metabolism studies in humans.
Future research using stable isotope labelling in lipidomics will likely make use of ultra-high mass resolution, use multiple tracer methods and utilize the information content of tandem mass spectra to localize and quantify label enrichment within lipid building blocks.
All this combined will allow the metabolism of lipids to be investigated in unprecedented detail, greatly advancing our knowledge of the roles of lipids in health and disease.
Author Contributions
A.T. and M.R.W. wrote the manuscript.
Funding
This research was funded by National Research Foundation Singapore, Grant Number R183-000-419-592.
Acknowledgments
We would like to thank Katharina Leithner (Medical University of Graz, Austria) for providing biological material for the data of Figures 2 and 3. We apologize to all colleagues whose work has not been cited due to space limitations.
Conflicts of Interest
The authors declare no conflict of interest.
References
- Wenk, M.R. The emerging field of lipidomics. Nat. Rev. Drug Discov. 2005, 4, 594–610. [Google Scholar] [CrossRef] [PubMed]
- Lagarde, M.; Géloën, A.; Record, M.; Vance, D.; Spener, F. Lipidomics is emerging. Biochim. Biophys. Acta Mol. Cell Biol. Lipids 2003, 1634, 61. [Google Scholar] [CrossRef]
- Han, X.; Gross, R.W. Global analyses of cellular lipidomes directly from crude extracts of biological samples by ESI mass spectrometry: A bridge to lipidomics. J. Lipid Res. 2003, 44, 1071–1079. [Google Scholar] [CrossRef] [PubMed]
- Harayama, T.; Riezman, H. Understanding the diversity of membrane lipid composition. Nat. Rev. Mol. Cell Biol. 2018, 19, 281–296. [Google Scholar] [CrossRef] [PubMed]
- Athenstaedt, K.; Daum, G. Phosphatidic acid, a key intermediate in lipid metabolism. Eur. J. Biochem. 1999, 266, 1–16. [Google Scholar] [CrossRef] [PubMed]
- Jang, C.; Chen, L.; Rabinowitz, J.D. Metabolomics and Isotope Tracing. Cell 2018, 173, 822–837. [Google Scholar] [CrossRef] [PubMed]
- Schoenheimer, R. The investigation of intermediary metabolism with the aid of heavy hydrogen. Bull. N. Y. Acad. Med. 1937, 13, 272–295. [Google Scholar] [PubMed]
- Ecker, J.; Liebisch, G. Application of stable isotopes to investigate the metabolism of fatty acids, glycerophospholipid and sphingolipid species. Prog. Lipid Res. 2014, 54, 14–31. [Google Scholar] [CrossRef] [PubMed]
- Wang, M.; Wang, C.; Han, X. Selection of internal standards for accurate quantification of complex lipid species in biological extracts by electrospray ionization mass spectrometry-What, how and why? Mass Spectrom. Rev. 2017, 36, 693–714. [Google Scholar] [CrossRef] [PubMed]
- Hermann, G.; Schwaiger, M.; Volejnik, P.; Koellensperger, G. 13C-labelled yeast as internal standard for LC–MS/MS and LC high resolution MS based amino acid quantification in human plasma. J. Pharm. Biomed. Anal. 2018, 155, 329–334. [Google Scholar] [CrossRef] [PubMed]
- Griffiths, W.J.; Ogundare, M.; Williams, C.M.; Wang, Y. On the future of “omics”: Lipidomics. J. Inherit. Metab. Dis. 2011, 34, 583–592. [Google Scholar] [CrossRef] [PubMed]
- Rampler, E.; Coman, C.; Hermann, G.; Sickmann, A.; Ahrends, R.; Koellensperger, G. LILY-lipidome isotope labeling of yeast: In vivo synthesis of 13C labeled reference lipids for quantification by mass spectrometry. Analyst 2017, 142, 1891–1899. [Google Scholar] [CrossRef] [PubMed]
- Rampler, E.; Criscuolo, A.; Zeller, M.; El Abiead, Y.; Schoeny, H.; Hermann, G.; Sokol, E.; Cook, K.; Peake, D.A.; Delanghe, B.; et al. A Novel Lipidomics Workflow for Improved Human Plasma Identification and Quantification Using RPLC-MSn Methods and Isotope Dilution Strategies. Anal. Chem. 2018, 90, 6494–6501. [Google Scholar] [CrossRef] [PubMed]
- Kim, I.-Y.; Suh, S.-H.; Lee, I.-K.; Wolfe, R.R. Applications of stable, nonradioactive isotope tracers in in vivo human metabolic research. Exp. Mol. Med. 2016, 48, e203. [Google Scholar] [CrossRef] [PubMed]
- Batista Silva, W.; Daloso, D.M.; Fernie, A.R.; Nunes-Nesi, A.; Araújo, W.L. Can stable isotope mass spectrometry replace radiolabelled approaches in metabolic studies? Plant Sci. 2016, 249, 59–69. [Google Scholar] [CrossRef] [PubMed]
- Hiller, K.; Metallo, C.M.; Kelleher, J.K.; Stephanopoulos, G. Nontargeted Elucidation of Metabolic Pathways Using Stable-Isotope Tracers and Mass Spectrometry. Anal. Chem. 2010, 82, 6621–6628. [Google Scholar] [CrossRef] [PubMed]
- Buescher, J.M.; Antoniewicz, M.R.; Boros, L.G.; Burgess, S.C.; Brunengraber, H.; Clish, C.B.; DeBerardinis, R.J.; Feron, O.; Frezza, C.; Ghesquiere, B.; et al. A roadmap for interpreting 13C metabolite labeling patterns from cells. Curr. Opin. Biotechnol. 2015, 34, 189–201. [Google Scholar] [CrossRef] [PubMed]
- Freund, D.M.; Hegeman, A.D. Recent advances in stable isotope-enabled mass spectrometry-based plant metabolomics. Curr. Opin. Biotechnol. 2017, 43, 41–48. [Google Scholar] [CrossRef] [PubMed] [Green Version]
- McLaren, D.G.; Cardasis, H.L.; Stout, S.J.; Wang, S.-P.; Mendoza, V.; Castro-Perez, J.M.; Miller, P.L.; Murphy, B.A.; Cumiskey, A.-M.; Cleary, M.A.; et al. Use of [13C18] Oleic Acid and Mass Isotopomer Distribution Analysis to Study Synthesis of Plasma Triglycerides In Vivo: Analytical and Experimental Considerations. Anal. Chem. 2013, 85, 6287–6294. [Google Scholar] [CrossRef] [PubMed]
- Antoniewicz, M.R.; Kelleher, J.K.; Stephanopoulos, G. Accurate assessment of amino acid mass isotopomer distributions for metabolic flux analysis. Anal. Chem. 2007, 79, 7554–7559. [Google Scholar] [CrossRef] [PubMed]
- Mairinger, T.; Steiger, M.; Nocon, J.; Mattanovich, D.; Koellensperger, G.; Hann, S. Gas Chromatography-Quadrupole Time-of-Flight Mass Spectrometry-Based Determination of Isotopologue and Tandem Mass Isotopomer Fractions of Primary Metabolites for 13C-Metabolic Flux Analysis. Anal. Chem. 2015, 87, 11792–11802. [Google Scholar] [CrossRef] [PubMed]
- Hellerstein, M.K.; Neese, R.A. Mass isotopomer distribution analysis at eight years: Theoretical, analytic, and experimental considerations. Am. J. Physiol. 1999, 276, E1146–E1170. [Google Scholar] [CrossRef] [PubMed]
- IUPAC. Compendium of Chemical Terminology, 2nd ed. (the “Gold Book”). Compiled by A. D. McNaught and A. Wilkinson. Blackwell Scientific Publications, Oxford (1997). XML on-line corrected version: http://goldbook.iupac.org (2006-) created by M. Nic, J. Jirat, B. Kosata; updates compiled by A. Jenkins. ISBN 0-9678550-9-8. Available online: https://goldbook.iupac.org/html/I/I03351.html.
- IUPAC. Compendium of Chemical Terminology, 2nd ed. (the “Gold Book”). Compiled by A. D. McNaught and A. Wilkinson. Blackwell Scientific Publications, Oxford (1997). XML on-line corrected version: http://goldbook.iupac.org (2006-) created by M. Nic, J. Jirat, B. Kosata; updates compiled by A. Jenkins. ISBN 0-9678550-9-8. Available online: https://goldbook.iupac.org/html/I/I03352.html.
- Castro, B.M.; Prieto, M.; Silva, L.C. Ceramide: A simple sphingolipid with unique biophysical properties. Prog. Lipid Res. 2014, 54, 53–67. [Google Scholar] [CrossRef] [PubMed]
- Cheng, M.; Bhujwalla, Z.M.; Glunde, K.; Lane, A.N.; Fan, T.W.-M.; Xie, Z.; Moseley, H.N.B.; Higashi, R.M. Isotopomer analysis of lipid biosynthesis by high resolution mass spectrometry and NMR. Anal. Chim. Acta 2009, 651, 201–208. [Google Scholar] [CrossRef] [Green Version]
- Fan, J.; Kamphorst, J.J.; Rabinowitz, J.D.; Shlomi, T. Fatty Acid Labeling from Glutamine in Hypoxia Can be Explained by Isotope Exchange without Net Reductive Isocitrate Dehydrogenase (IDH) Flux. J. Biol. Chem. 2013, 288, 31363–31369. [Google Scholar] [CrossRef] [PubMed]
- Qi, J.; Lang, W.; Geisler, J.G.; Wang, P.; Petrounia, I.; Mai, S.; Smith, C.; Askari, H.; Struble, G.T.; Williams, R.; et al. The use of stable isotope-labeled glycerol and oleic acid to differentiate the hepatic functions of DGAT1 and -2. J. Lipid Res. 2012, 53, 1106–1116. [Google Scholar] [CrossRef] [PubMed]
- Sun, R.C.; Fan, T.W.M.; Deng, P.; Higashi, R.M.; Lane, A.N.; Le, A.-T.; Scott, T.L.; Sun, Q.; Warmoes, M.O.; Yang, Y. Noninvasive liquid diet delivery of stable isotopes into mouse models for deep metabolic network tracing. Nat. Commun. 2017, 8, 1646. [Google Scholar] [CrossRef] [PubMed] [Green Version]
- Leithner, K.; Triebl, A.; Trötzmüller, M.; Hinteregger, B.; Leko, P.; Wieser, B.I.; Grasmann, G.; Bertsch, A.L.; Züllig, T.; Stacher, E.; et al. The glycerol backbone of phospholipids derives from noncarbohydrate precursors in starved lung cancer cells. Proc. Natl. Acad. Sci. USA 2018, 115, 6225–6230. [Google Scholar] [CrossRef] [PubMed]
- Herath, K.B.; Zhong, W.; Yang, J.; Mahsut, A.; Rohm, R.J.; Shah, V.; Castro-Perez, J.; Zhou, H.; Attygalle, A.B.; Kang, L.; et al. Determination of low levels of 2H-labeling using high-resolution mass spectrometry: Application in studies of lipid flux and beyond. Rapid Commun. Mass Spectrom. 2014, 28, 239–244. [Google Scholar] [CrossRef] [PubMed]
- Parks, E.J.; Hellerstein, M.K. Thematic review series: Patient-Oriented Research. Recent advances in liver triacylglycerol and fatty acid metabolism using stable isotope labeling techniques. J. Lipid Res. 2006, 47, 1651–1660. [Google Scholar] [CrossRef] [PubMed] [Green Version]
- Patterson, B.W.; Mittendorfer, B.; Elias, N.; Satyanarayana, R.; Klein, S. Use of stable isotopically labeled tracers to measure very low density lipoprotein-triglyceride turnover. J. Lipid Res. 2002, 43, 223–233. [Google Scholar] [PubMed]
- Tigas, S.K.; Sunehag, A.L.; Haymond, M.W. Impact of Duration of Infusion and Choice of Isotope Label on Isotope Recycling in Glucose Homeostasis. Diabetes 2002, 51, 3170–3175. [Google Scholar] [CrossRef] [PubMed]
- Horning, M.A.; Colberg, S.R.; Casazza, G.A.; Brooks, G.A. Recycling of Deuterium from Dideuterated Glucose during Moderate Exercise. Ann. Clin. Biochem. Int. J. Biochem. Lab. Med. 2000, 37, 540–542. [Google Scholar] [CrossRef] [PubMed]
- Han, X. Sample Preparation. In Lipidomics: Comprehensive Mass Spectrometry of Lipids; John Wiley & Sons, Inc.: Hoboken, NJ, USA, 2016; pp. 281–304. [Google Scholar]
- Sarafian, M.H.; Gaudin, M.; Lewis, M.R.; Martin, F.; Holmes, E.; Nicholson, J.K.; Dumas, M. Objective Set of Criteria for Optimization of Sample Preparation Procedures for Ultra-High Throughput Untargeted Blood Plasma Lipid Profiling by Ultra Performance Liquid Chromatography–Mass Spectrometry. Anal. Chem. 2014, 86, 5766–5774. [Google Scholar] [CrossRef] [PubMed]
- Folch, J.; Lees, M.; Sloane Stanley, G.H. A Simple Method for the Isolation and Purification of Total Lipides from Animal Tissues. J. Biol. Chem. 1957, 226, 497–509. [Google Scholar] [PubMed]
- Bligh, E.; Dyer, W. A rapid method of total lipid extraction and purification. Can. J. Biochem. Physiol. 1978, 37, 1978. [Google Scholar]
- Matyash, V.; Liebisch, G.; Kurzchalia, T.V.; Shevchenko, A.; Schwudke, D. Lipid extraction by methyl-tert-butyl ether for high-throughput lipidomics. J. Lipid Res. 2008, 49, 1137–1146. [Google Scholar] [CrossRef] [PubMed] [Green Version]
- Lofgren, L.; Stahlman, M.; Forsberg, G.-B.; Saarinen, S.; Nilsson, R.; Hansson, G.I. The BUME method: A novel automated chloroform-free 96-well total lipid extraction method for blood plasma. J. Lipid Res. 2012, 53, 1690–1700. [Google Scholar] [CrossRef] [PubMed]
- Fauland, A.; Trötzmüller, M.; Eberl, A.; Afiuni-Zadeh, S.; Köfeler, H.; Guo, X.; Lankmayr, E. An improved SPE method for fractionation and identification of phospholipids. J. Sep. Sci. 2013, 36, 744–751. [Google Scholar] [CrossRef] [PubMed]
- Wewer, V.; Dörmann, P.; Hölzl, G. Analysis and Quantification of Plant Membrane Lipids by Thin-Layer Chromatography and Gas Chromatography; Munnik, T., Heilmann, I., Eds.; Methods in Molecular Biology; Humana Press: Totowa, NJ, USA, 2013; Volume 1009, pp. 69–78. ISBN 978-1-62703-400-5. [Google Scholar]
- Wei, F.; Wang, X.; Ma, H.; Lv, X.; Dong, X.; Chen, H. Rapid profiling and quantification of phospholipid molecular species in human plasma based on chemical derivatization coupled with electrospray ionization tandem mass spectrometry. Anal. Chim. Acta 2018, 1024, 101–111. [Google Scholar] [CrossRef] [PubMed]
- Ryan, E.; Reid, G.E. Chemical Derivatization and Ultrahigh Resolution and Accurate Mass Spectrometry Strategies for “Shotgun” Lipidome Analysis. Acc. Chem. Res. 2016, 49, 1596–1604. [Google Scholar] [CrossRef] [PubMed]
- Holčapek, M.; Liebisch, G.; Ekroos, K. Lipidomic Analysis. Anal. Chem. 2018, 90, 4249–4257. [Google Scholar] [CrossRef] [PubMed]
- Schwudke, D.; Schuhmann, K.; Herzog, R.; Bornstein, S.R.; Shevchenko, A. Shotgun lipidomics on high resolution mass spectrometers. Cold Spring Harb. Perspect. Biol. 2011, 3, a004614. [Google Scholar] [CrossRef] [PubMed]
- Schuhmann, K.; Srzentić, K.; Nagornov, K.O.; Thomas, H.; Gutmann, T.; Coskun, Ü.; Tsybin, Y.O.; Shevchenko, A. Monitoring Membrane Lipidome Turnover by Metabolic 15N Labeling and Shotgun Ultra-High-Resolution Orbitrap Fourier Transform Mass Spectrometry. Anal. Chem. 2017, 89, 12857–12865. [Google Scholar] [CrossRef] [PubMed]
- Boumann, H.A.; Damen, M.J.A.; Versluis, C.; Heck, A.J.R.; de Kruijff, B.; de Kroon, A.I.P.M. The Two Biosynthetic Routes Leading to Phosphatidylcholine in Yeast Produce Different Sets of Molecular Species. Evidence for Lipid Remodeling. Biochemistry 2003, 42, 3054–3059. [Google Scholar] [CrossRef] [PubMed]
- Turowski, M.; Yamakawa, N.; Meller, J.; Kimata, K.; Ikegami, T.; Hosoya, K.; Tanaka, N.; Thornton, E.R. Deuterium Isotope Effects on Hydrophobic Interactions: The Importance of Dispersion Interactions in the Hydrophobic Phase. J. Am. Chem. Soc. 2003, 125, 13836–13849. [Google Scholar] [CrossRef] [PubMed]
- Iyer, S.S.; Zhang, Z.-P.; Kellogg, G.E.; Karnes, H.T. Evaluation of deuterium isotope effects in normal-phase LC-MS-MS separations using a molecular modeling approach. J. Chromatogr. Sci. 2004, 42, 383–387. [Google Scholar] [CrossRef] [PubMed]
- Wang, S.; Cyronak, M.; Yang, E. Does a stable isotopically labeled internal standard always correct analyte response? J. Pharm. Biomed. Anal. 2007, 43, 701–707. [Google Scholar] [CrossRef] [PubMed]
- Quehenberger, O.; Armando, A.M.; Dennis, E.A. High sensitivity quantitative lipidomics analysis of fatty acids in biological samples by gas chromatography-mass spectrometry. Biochim. Biophys. Acta Mol. Cell Biol. Lipids 2011, 1811, 648–656. [Google Scholar] [CrossRef] [PubMed]
- Strawford, A.; Antelo, F.; Christiansen, M.; Hellerstein, M.K. Adipose tissue triglyceride turnover, de novo lipogenesis, and cell proliferation in humans measured with 2H2O. Am. J. Physiol. Metab. 2004, 286, E577–E588. [Google Scholar] [CrossRef]
- Tumanov, S.; Bulusu, V.; Kamphorst, J.J. Analysis of Fatty Acid Metabolism Using Stable Isotope Tracers and Mass Spectrometry. Methods Enzymol. 2015, 561, 197–217. [Google Scholar] [PubMed]
- Lagerstedt, S.A.; Hinrichs, D.R.; Batt, S.M.; Magera, M.J.; Rinaldo, P.; McConnell, J.P. Quantitative Determination of Plasma C8–C26 Total Fatty Acids for the Biochemical Diagnosis of Nutritional and Metabolic Disorders. Mol. Genet. Metab. 2001, 73, 38–45. [Google Scholar] [CrossRef] [PubMed]
- Gagné, S.; Crane, S.; Huang, Z.; Li, C.S.; Bateman, K.P.; Lévesque, J.-F. Rapid measurement of deuterium-labeled long-chain fatty acids in plasma by HPLC-ESI-MS. J. Lipid Res. 2007, 48, 252–259. [Google Scholar] [CrossRef] [PubMed]
- Kamphorst, J.J.; Fan, J.; Lu, W.; White, E.; Rabinowitz, J.D. Liquid Chromatography-High Resolution Mass Spectrometry Analysis of Fatty Acid Metabolism. Anal. Chem. 2011, 83, 9114–9122. [Google Scholar] [CrossRef] [PubMed]
- Persson, X.-M.T.; Błachnio-Zabielska, A.U.; Jensen, M.D. Rapid measurement of plasma free fatty acid concentration and isotopic enrichment using LC/MS. J. Lipid Res. 2010, 51, 2761–2765. [Google Scholar] [CrossRef] [PubMed] [Green Version]
- Dushianthan, A.; Cusack, R.; Grocott, M.P.W.; Postle, A.D. Abnormal liver phosphatidylcholine synthesis revealed in patients with acute respiratory distress syndrome. J. Lipid Res. 2018, 59, 1034–1045. [Google Scholar] [CrossRef] [PubMed] [Green Version]
- Elahee Doomun, S.; Loke, S.; O’Callaghan, S.; Callahan, D. A Simple Method for Measuring Carbon-13 Fatty Acid Enrichment in the Major Lipid Classes of Microalgae Using GC-MS. Metabolites 2016, 6, 42. [Google Scholar] [CrossRef] [PubMed]
- Kainu, V.; Hermansson, M.; Somerharju, P. Electrospray Ionization Mass Spectrometry and Exogenous Heavy Isotope-labeled Lipid Species Provide Detailed Information on Aminophospholipid Acyl Chain Remodeling. J. Biol. Chem. 2008, 283, 3676–3687. [Google Scholar] [CrossRef] [PubMed]
- Li, J.; Hoene, M.; Zhao, X.; Chen, S.; Wei, H.; Häring, H.-U.; Lin, X.; Zeng, Z.; Weigert, C.; Lehmann, R.; Xu, G. Stable Isotope-Assisted Lipidomics Combined with Nontargeted Isotopomer Filtering, a Tool to Unravel the Complex Dynamics of Lipid Metabolism. Anal. Chem. 2013, 85, 4651–4657. [Google Scholar] [CrossRef] [PubMed]
- Holčapek, M.; Jirásko, R.; Lísa, M. Recent developments in liquid chromatography-mass spectrometry and related techniques. J. Chromatogr. A 2012, 1259, 3–15. [Google Scholar] [CrossRef] [PubMed]
- Trötzmüller, M.; Triebl, A.; Ajsic, A.; Hartler, J.; Köfeler, H.; Regittnig, W. Determination of the Isotopic Enrichment of 13C- and 2H-Labeled Tracers of Glucose Using High-Resolution Mass Spectrometry: Application to Dual- and Triple-Tracer Studies. Anal. Chem. 2017, 89, 12252–12260. [Google Scholar] [CrossRef] [PubMed]
- Markley, J.L.; Brüschweiler, R.; Edison, A.S.; Eghbalnia, H.R.; Powers, R.; Raftery, D.; Wishart, D.S. The future of NMR-based metabolomics. Curr. Opin. Biotechnol. 2017, 43, 34–40. [Google Scholar] [CrossRef] [PubMed] [Green Version]
- Li, J.; Vosegaard, T.; Guo, Z. Applications of nuclear magnetic resonance in lipid analyses: An emerging powerful tool for lipidomics studies. Prog. Lipid Res. 2017, 68, 37–56. [Google Scholar] [CrossRef] [PubMed]
- Castro-Perez, J.; Previs, S.F.; McLaren, D.G.; Shah, V.; Herath, K.; Bhat, G.; Johns, D.G.; Wang, S.-P.; Mitnaul, L.; Jensen, K.; et al. In vivo D2O labeling to quantify static and dynamic changes in cholesterol and cholesterol esters by high resolution LC/MS. J. Lipid Res. 2011, 52, 159–169. [Google Scholar] [CrossRef] [PubMed]
- Pulfer, M.; Murphy, R.C. Electrospray Mass Spectrometry of Phospholipids. Mass Spectrom. Rev. 2003, 22, 332–364. [Google Scholar] [CrossRef] [PubMed]
- Hsu, F.-F.; Turk, J. Electrospray ionization with low-energy collisionally activated dissociation tandem mass spectrometry of glycerophospholipids: Mechanisms of fragmentation and structural characterization. J. Chromatogr. B 2009, 877, 2673–2695. [Google Scholar] [CrossRef] [PubMed] [Green Version]
- Han, X. Fragmentation Patterns of Glycerophospholipids. In Lipidomics: Comprehensive Mass Spectrometry of Lipids; John Wiley & Sons, Inc.: Hoboken, NJ, USA, 2016; pp. 173–200. [Google Scholar]
- Skotland, T.; Ekroos, K.; Kavaliauskiene, S.; Bergan, J.; Kauhanen, D.; Lintonen, T.; Sandvig, K. Determining the Turnover of Glycosphingolipid Species by Stable-Isotope Tracer Lipidomics. J. Mol. Biol. 2016, 428, 4856–4866. [Google Scholar] [CrossRef] [PubMed]
- De Laeter, J.R.; Böhlke, J.K.; de Bièvre, P.; Hidaka, H.; Peiser, H.S.; Rosman, K.J.R.; Taylor, P.D.P. Atomic Weight of the Elements: Review 2000. Pure Appl. Chem. 2003, 75, 683–800. [Google Scholar] [CrossRef]
- Su, X.; Lu, W.; Rabinowitz, J.D. Metabolite Spectral Accuracy on Orbitraps. Anal. Chem. 2017, 89, 5940–5948. [Google Scholar] [CrossRef] [PubMed]
- Millard, P.; Letisse, F.; Sokol, S.; Portais, J.-C. IsoCor: Correcting MS data in isotope labeling experiments. Bioinformatics 2012, 28, 1294–1296. [Google Scholar] [CrossRef] [PubMed]
- Huang, X.; Chen, Y.-J.; Cho, K.; Nikolskiy, I.; Crawford, P.A.; Patti, G.J. X13CMS: Global Tracking of Isotopic Labels in Untargeted Metabolomics. Anal. Chem. 2014, 86, 1632–1639. [Google Scholar] [CrossRef] [PubMed]
- Jungreuthmayer, C.; Neubauer, S.; Mairinger, T.; Zanghellini, J.; Hann, S. ICT: Isotope correction toolbox. Bioinformatics 2015, 32, btv514. [Google Scholar] [CrossRef] [PubMed]
- Ahmed, Z.; Zeeshan, S.; Huber, C.; Hensel, M.; Schomburg, D.; Münch, R.; Eisenreich, W.; Dandekar, T. Software LS-MIDA for efficient mass isotopomer distribution analysis in metabolic modelling. BMC Bioinform. 2013, 14, 218. [Google Scholar] [CrossRef] [PubMed]
- Niedenführ, S.; ten Pierick, A.; van Dam, P.T.N.; Suarez-Mendez, C.A.; Nöh, K.; Wahl, S.A. Natural isotope correction of MS/MS measurements for metabolomics and 13C fluxomics. Biotechnol. Bioeng. 2016, 113, 1137–1147. [Google Scholar] [CrossRef] [PubMed]
- Antoniewicz, M.R. 13C metabolic flux analysis: Optimal design of isotopic labeling experiments. Curr. Opin. Biotechnol. 2013, 24, 1116–1121. [Google Scholar] [CrossRef] [PubMed]
- Crown, S.B.; Antoniewicz, M.R. Publishing 13C metabolic flux analysis studies: A review and future perspectives. Metab. Eng. 2013, 20, 42–48. [Google Scholar] [CrossRef] [PubMed]
- Crown, S.B.; Ahn, W.; Antoniewicz, M.R. Rational design of 13C-labeling experiments for metabolic flux analysis in mammalian cells. BMC Syst. Biol. 2012, 6, 43. [Google Scholar] [CrossRef] [PubMed]
- Antoniewicz, M.R. Methods and advances in metabolic flux analysis: A mini-review. J. Ind. Microbiol. Biotechnol. 2015, 42, 317–325. [Google Scholar] [CrossRef] [PubMed]
- Antoniewicz, M.R. A guide to 13C metabolic flux analysis for the cancer biologist. Exp. Mol. Med. 2018, 50, 19. [Google Scholar] [CrossRef] [PubMed]
- Allen, D.K. Quantifying plant phenotypes with isotopic labeling & metabolic flux analysis. Curr. Opin. Biotechnol. 2016, 37, 45–52. [Google Scholar] [CrossRef] [PubMed]
- Zamboni, N.; Fendt, S.-M.; Rühl, M.; Sauer, U. 13C-based metabolic flux analysis. Nat. Protoc. 2009, 4, 878–892. [Google Scholar] [CrossRef] [PubMed]
- Niedenführ, S.; Wiechert, W.; Nöh, K. How to measure metabolic fluxes: A taxonomic guide for 13C fluxomics. Curr. Opin. Biotechnol. 2015, 34, 82–90. [Google Scholar] [CrossRef] [PubMed]
- Wiechert, W.; Nöh, K. Isotopically non-stationary metabolic flux analysis: Complex yet highly informative. Curr. Opin. Biotechnol. 2013, 24, 979–986. [Google Scholar] [CrossRef] [PubMed]
- Allen, D.K.; Bates, P.D.; Tjellström, H. Tracking the metabolic pulse of plant lipid production with isotopic labeling and flux analyses: Past, present and future. Prog. Lipid Res. 2015, 58, 97–120. [Google Scholar] [CrossRef] [PubMed]
- Kelleher, J.K.; Nickol, G.B. Isotopomer Spectral Analysis: Utilizing Nonlinear Models in Isotopic Flux Studies. Methods Enzymol. 2015, 561, 303–330. [Google Scholar] [PubMed]
- Zamboni, N.; Fischer, E.; Sauer, U. FiatFlux—A software for metabolic flux analysis from 13C-glucose experiments. BMC Bioinform. 2005, 6, 1–8. [Google Scholar] [CrossRef] [PubMed] [Green Version]
- Quek, L.-E.; Wittmann, C.; Nielsen, L.K.; Krömer, J.O. OpenFLUX: Efficient modelling software for 13C-based metabolic flux analysis. Microb. Cell Fact. 2009, 8, 25. [Google Scholar] [CrossRef] [PubMed]
- Wiechert, W.; Möllney, M.; Petersen, S.; de Graaf, A.A. A Universal Framework for 13C Metabolic Flux Analysis. Metab. Eng. 2001, 3, 265–283. [Google Scholar] [CrossRef] [PubMed]
- Kajihata, S.; Furusawa, C.; Matsuda, F.; Shimizu, H. OpenMebius: An Open Source Software for Isotopically Nonstationary 13C-Based Metabolic Flux Analysis. BioMed Res. Int. 2014, 2014, 627014. [Google Scholar] [CrossRef] [PubMed]
- Young, J.D. INCA: A computational platform for isotopically non-stationary metabolic flux analysis. Bioinformatics 2014, 30, 1333–1335. [Google Scholar] [CrossRef] [PubMed]
- Agilent MassHunter VistaFlux for Qualitative Flux Analysis. Agilent Technologies, Inc., 2016. Available online: https://www.agilent.com/cs/library/technicaloverviews/public/5991-6756EN.pdf.
Figure 1.
Stable isotope labelling workflow in biological systems. A stable isotope-labelled substrate is metabolized into the lipid building blocks (fatty acyls, glycerol and head group).
Figure 1.
Stable isotope labelling workflow in biological systems. A stable isotope-labelled substrate is metabolized into the lipid building blocks (fatty acyls, glycerol and head group).

Figure 2.
High resolution full-scan mass spectra of a labelled and unlabelled phospholipid. (a) PC (phosphatidylcholine) 34:1 from A549 cells grown on non-labelled substrate. The monoisotopic peak at m/z 760.6, as well as three isotopologues, which represent the natural abundance of 13C, are visible. (b) Mass spectrum showing the “isotopic envelope” of the same lipid from cells grown on 13C6-labelled glucose. Varying numbers of 13C have been incorporated into the lipid via cellular metabolism. See Figure 4 for these data after correction for natural 13C abundance (authors’ unpublished data).

Figure 3.
Tandem mass spectrum of stable isotope -labelled PC from A549 cells grown on 13C6 glucose. (a) Tandem mass spectrum of stable isotope-labelled phosphatidylcholine. (b) Zoomed to fragment ions indicative of head group (cyclic glycerophosphate, m/z 153; phosphocholine, m/z 168; glycerophosphocholine, m/z 224) and fatty acyls (16:0, m/z 255 and 18:1, m/z 281). The isotopologue distributions of individual fragment ions are marked by asterisks. (c) Isotopic clusters of individual lipid building blocks (left); high mass resolution is capable of resolving close m/z values, such as head group fragment ions and fatty acyl ions (middle), as well as resolving signals from fatty acyls with different degrees of labelling (right) (authors’ unpublished data).


© 2018 by the authors. Licensee MDPI, Basel, Switzerland. This article is an open access article distributed under the terms and conditions of the Creative Commons Attribution (CC BY) license (http://creativecommons.org/licenses/by/4.0/).
Share and Cite
MDPI and ACS Style
Triebl, A.; Wenk, M.R. Analytical Considerations of Stable Isotope Labelling in Lipidomics. Biomolecules 2018, 8, 151. https://doi.org/10.3390/biom8040151
AMA Style
Triebl A, Wenk MR. Analytical Considerations of Stable Isotope Labelling in Lipidomics. Biomolecules. 2018; 8(4):151. https://doi.org/10.3390/biom8040151
Chicago/Turabian StyleTriebl, Alexander, and Markus R. Wenk. 2018. "Analytical Considerations of Stable Isotope Labelling in Lipidomics" Biomolecules 8, no. 4: 151. https://doi.org/10.3390/biom8040151
Note that from the first issue of 2016, this journal uses article numbers instead of page numbers. See further details here.