Genome-Wide Identification and Functional Characterization of the Phosphate Transporter Gene Family in Sorghum

Key Laboratory of Three Gorges Regional Plant Genetics and Germplasm Enhancement (CTGU)/ Biotechnology Research Center, College of Biological and Pharmaceutical Sciences, China Three Gorges University, Yichang 443002, China
*
Author to whom correspondence should be addressed.
†
Both authors contributed equally as first authors.
Biomolecules 2019, 9(11), 670; https://doi.org/10.3390/biom9110670
Submission received: 10 September 2019
/
Revised: 23 October 2019
/
Accepted: 24 October 2019
/
Published: 30 October 2019
(This article belongs to the Section Molecular Biology)
Abstract
:The phosphate transporter (PHT) family mediates the uptake and translocation of the essential macronutrient phosphorus (P) in plants. In this study, 27 PHT proteins in Sorghum were identified via bioinformatics tools. Phylogenetic analysis of their protein sequences in comparison with those family proteins from Arabidopsis and rice indicated that these proteins could be clustered into five typical subfamilies. There are 12 SbPHT1 members, one SbPHT2, six SbPHT3s, six SbPHT4s, and two SbPHOs in Sorghum. Further analysis of the gene structure, conserved motifs, subcellular localization, and transmembrane domains suggested that these features are relatively conserved within each subfamily. Meanwhile, the qRT-PCR assay implied that SbPHT1;2, SbPHT1;11, and SbPHT4;6 were significantly upregulated in roots when exposed to low-phosphate conditions, suggesting that these genes might be involved in P uptake in low-phosphate conditions. Our study will increase our understanding of the roles of phosphate transporters in Sorghum.

1. Introduction
Phosphorus (P) is an essential nutrient for plant growth and development, contributing about 0.2% of the dry weight. It serves as an important component of many biological macromolecules, such as nucleic acids, membrane lipids, and ATP. Meanwhile, multiple plant biological processes, including photosynthesis, respiration, and glycolysis, require this element [1]. In plants, P is mainly taken up from the soil by the roots in the form of inorganic phosphate (Pi), including H2PO4− and HPO42−. Although P is abundant in the soil, the form of Pi, available for plant uptake, is relatively rare (0.1–10 μM). However, in the cytoplasm of plant cells, the Pi concentration is generally about 5–10 mM [2,3]. Thus, the uptake of P from the soil to the plant roots is an active process and requires special transporters.
Phosphorus uptake from soil and translocation between plant tissues and organs is facilitated by phosphate transporters (PHT), which are Pi:H+ symporters. The first PHT protein identified in higher plants was AtPT1 from Arabidopsis thaliana [4]. Since then, many genes encoding PHTs have been identified and characterized from a series of plant species, including Arabidopsis thaliana [5,6], Oryza sativa [7], Triticum aestivum [8], and Solanum tuberosum [9]. In addition, genome-wide identification of plant PHT family genes has also been reported in Populus trichocarpa [10,11], Arabidopsis thaliana [12,13], Triticum aestivum [14], Solanum lycopersicum [15], Oryza sativa [16], Solanum tuberosum [17], and Malus domestica [18].
There are two Pi uptake systems in plants: a low-Pi-inducible high-affinity system and a constitutive low-affinity system [3]. The former is inducible by and responsible for low Pi concentrations, whereas the latter is constitutively expressed. The plant genes encoding Pi transporters are classified into five families, PHT1, PHT2, PHT3, PHT4, and PHO, the first four of which are reported to localize in the plasma membrane, plastid inner membrane, mitochondrial inner membrane, and Golgi compartment, respectively [2,9]. Among the four families, the PHT1 family is relatively well characterized. Most PHT1 family members are high-affinity Pi transporters. Although the majority of PHT1 genes are expressed in roots and responsible for Pi uptake from the soil under Pi-limited environments [5], many of them are also located in the leaves, stems, and flowers, suggesting that they may be involved in Pi translocation inside the plant [19,20]. In Arabidopsis, there are nine PHT1 family genes (AtPHT1;1-9), some of which are regulated in response to changes in Pi availability [21]. In rice, 13 members of the PHT1 family (OsPT1-13) contribute to Pi uptake from the soil and internal translocation [19,22]. In maize, ZmPht1;1-5 are expressed both in roots and in shoots, and are induced by Pi starvation [23]. In soybean, the PHT1 family is composed of 14 members (GmPT1-14), encoding high-affinity transporters and contributing to Pi uptake in roots under low-Pi conditions [24]. In Medicago truncatula, five PHT1 genes are also induced by low Pi and are responsible for Pi uptake and translocation [25,26]. In contrast to the PHT1 family, the other families are less investigated and mainly contribute to Pi distribution within subcellular compartments [3]. The PHT2 family only has one member in many species, such as rice, Arabidopsis, and maize. AtPHT2;1 is a low-affinity transporter located in chloroplasts, responsible for phosphate-starvation responses in Arabidopsis [27]. In addition, there are 11 members of PHO1 gene family in Arabidopsis, required for Pi translocation [6,12,28].
Aside from the PHT2 family, the other families are composed of more than one member. The Pi-affinity and expression pattern within the family vary greatly. For instance, AtPHT1;6 is mainly expressed in floral organs, revealing the role of PHT1 transporters in flower development [5]; the other eight AtPHT1s are all at least expressed in the roots, in line with their major role in Pi uptake from the soil [29]. AtPHT1;1 and AtPHT1;4 are two high-affinity transporters and contribute to Pi uptake under both normal and low-Pi conditions [30]. In addition, AtPHT1;5 is required for Pi translocation from roots to shoots [31]. The expression of AtPHT1;8 and AtPHT1;9 is inducible by low-Pi concentrations and functions in Pi translocation within plants [32,33]. Taken together, most PHT1 members in Arabidopsis are detected in diverse tissues or organs and share overlapping expression patterns with other PHT1 transporters, suggesting the functional redundancy and complexity of roles [5,29,34].
Sorghum (Sorghum bicolor (L.) Moench) is a C4 crop with high photosynthetic efficiency and environmental adaptability. As compared with its closely-related species maize, Sorghum is more resistant to harmful environments, including drought, high temperature, high salinity, and sterile soil. Although the whole-genome sequence of Sorghum has been published [34], the PHT family genes in Sorghum have not been systematically investigated yet. In this study, we identified 27 potential SbPHT family members via sequence alignment, classified these proteins into subfamilies, and further analyzed their sequences and expression patterns.
2. Materials and Methods
2.1. Plant Materials and Growth Conditions
The Sorghum genotype BTx623 was used in this study. For low-phosphate treatment, Sorghum seeds were first surface-sterilized with 70% ethanol for 2 min, followed by 5% NaClO for 20 min. Then, the seeds were washed with sterile water three times and planted individually on one-half-strength Murashige and Skoog (1/2 MS) medium with (control) or without K2PHO4 (low phosphate). Thereafter, the plants were placed in a greenhouse at 28 ± 2 °C under 12 h light of 100 μmol quanta m−2 s−1 irradiance and 12 h dark cycles.
2.2. Identification of Potential PHT Genes in Sorghum and Analysis of Their Chromosomal Localization
The potential PHT genes were isolated via homologous alignment. First, the PHT family genes from rice and Arabidopsis were obtained from the rice genome annotation project database (http://rice.plantbiology.msu.edu/) and the Arabidopsis Information Resource (TAIR) database (https://www.arabidopsis.org/), respectively. Then, the CDS query of each gene was blasted in the Phytozome database (https://phytozome.jgi.doe.gov/pz/portal.html) to search for PHT homologs in Sorghum with the E-value cutoff set as 1.00E−10. The top three matched genes were considered as candidates. Thereafter, we collected all the candidates and further checked their annotation information in the MOROKOSHI database (http://sorghum.riken.jp/morokoshi/Home.html). Finally, all the candidate protein sequences were further checked using NCBI’s conserved domain database (http://www.ncbi.nlm.nih.gov/cdd) and the Pfam protein family database (http://pfam.xfam.org). The Sorghum PHT genes were located on the corresponding chromosomes by the MapGene2chromosome web v2 (MG2C) database (http://mg2c.iask.in/mg2c_v2.0/) according to their position information, available on the Phytozome database (Sorghum bicolor v3.1.1).
2.3. Phylogenetic Analysis
The coding sequences (CDS) and protein sequences of PHT genes from rice, Arabidopsis, maize, and Sorghum were used for phylogenetic analysis. These sequences were downloaded from the rice genome annotation project database, the TAIR database, and the Phytozome database. Thereafter, multiple alignments of the CDS and protein sequences of AtPHTs, OsPHTs, and SbPHTs were carried out using ClustalX v1.83 software. Then, the unrooted phylogenetic trees were constructed using the neighbor-joining method with 1000 bootstrap iterations in MEGA5.05 software.
2.4. Gene Structure Analysis and Identification of Conserved Motifs
The mRNA sequences of the Sorghum PHT family genes were obtained from the Phytozome database (Sorghum bicolor v3.1.1). Then, the intron/exon distribution was determined by using the online gene structure display server program (GSDS, http://gsds.cbi.pku.edu.cn/). The conserved motifs in the full-length Sorghum PHT proteins were analyzed using multiple em (expectation maximization) for motif elicitation (MEME) version 5.0.3 (http://meme-suite.org/). The following parameters were applied: 20 motifs in maximum, 6–50 residues (inclusive) in motif width, and E-values <1.00E-40.
2.5. Protein Properties and Sequence Analysis
The isoelectric points (pIs) and molecular weights (MW) of candidate SbPHTs were detected using the ExPASy proteomics server database (http://expasy.org/). The transmembrane helices (TMHs) of the SbPHT proteins were predicted by using three online databases with their default settings, including the TMHMM Server v. 2.0 (http://www.cbs.dtu.dk/services/TMHMM/), the transporter classification database (http://www.tcdb.org/), and the TMbase (https://embnet.vital-it.ch/software/TMPRED_form.html).
2.6. Subcellular Localization
In this study, four online databases were used to predict the subcellular localization of each SbPHT protein, including CELLO v2.5 (http://cello.life.nctu.edu.tw/), Plant mPLoc (http://www.csbio.sjtu.edu.cn/bioinf/plant-multi/), WoLFPSORT (http://www.genscript.com/wolf-psort.html), and MultiLoc2 (http://abi.inf.uni-tuebingen.de/Services/MultiLoc2). Also, to obtain high confidence predictions, WoLFPSORT, MultiLoc2, and CELLO v 2.5 were set with cutoffs of confidence score >9, confidence score >0.7, and reliability score >4.0, respectively. Similar results were obtained from these databases.
2.7. Expression Analysis
For the expression profiles under low-phosphate conditions, the Sorghum seeds were surface-sterilized and then germinated on a control or low-phosphate 1/2 MS medium. After being grown for 14 days, the leaves and roots were collected separately and frozen immediately in liquid nitrogen. RNA isolation, cDNA synthesis, and qRT-PCR were performed as previously described [35,36,37]. For each experiment, at least three independent biological replicates and three technical repetitions were assayed. PP2A and EIF4A were chosen as internal controls. The relative expression levels of the corresponding genes in comparison to the housekeeping genes were used to draw the figure in Genesis software. The primers used for qRT-PCR are listed in Table S1.
3. Results
3.1. Genome-Wide Identification of PHT Family Genes in Sorghum
In this study, we identified a total of 27 phosphate transporter (PHT) family members in Sorghum via BLAST researches. The accession numbers, coding sequences, and encoded protein sequences of the predicted PHT family members were downloaded from the online Phytozome database; their annotation information and orthologs were obtained from the online MOROKOSHI database; their conserved domains were validated using the online CDD database and PFAM database. Based on the functional annotations, we confirmed that these proteins are potential transporter proteins (Table S2). Moreover, most PHT genes in Sorghum only have one transcript, except for Sb06g002800 (two), Sb02g026490 (three), Sb01g014790 (three), Sb02g032440 (12), and Sb03g011370 (two) (Table S2). For those genes with multiple alternative splicing, the main transcript was marked in red and underlined in Table S2 and used for further analysis.
3.2. Phylogenetic Analysis of PHT Family Genes from Sorghum, Arabidopsis, and Rice
Previous studies have revealed that the plant phosphate transporters include four PHT subfamilies (PHT1, PHT2, PHT3, and PHT4) and PHO [3,28]. To gain insight into the evolutionary relationships between PHT proteins as well as to classify Sorghum PHT proteins into subfamilies, we constructed an unrooted neighbor-joining (NJ) phylogenetic tree by comparing the protein sequences of known PHT proteins from Arabidopsis and rice. In total, we downloaded 26 OsPHT proteins, including 13 OsPHT1s, one OsPHT2, six OsPHT3s, and six OsPHT4s. Also, we obtained 30 AtPHT proteins, including nine AtPHT1s, one AtPHT2, three AtPHT3s, six AtPHT4s, and 11 AtPHTO1s. The locus names of PHT proteins from Arabidopsis and rice are listed in Table S3. Phylogenetic analysis (Figure 1) showed that 12 SbPHTs could be clustered into the SbPHT1 subfamily, which is the largest group in Sorghum. Meanwhile, the SbPHT3 and SbPHT4 subfamilies both have six members, the same as in rice. In addition, the SbPHT2 subfamily has only one member, similar to that in Arabidopsis, rice, and maize.
In general, Sorghum PHT proteins can be clustered into known subfamilies, indicating that this protein family may confer conserved functions in plants. On the other hand, the number and protein sequence of SbPHTs are more similar to OsPHTs than AtPHTs, suggesting that PHTs from Sorghum have a closer relationship with PHTs from rice as compared with those from Arabidopsis. Considering that Sorghum and rice are both dicotyledons, this observation is in accordance with the current understanding of plant evolutionary history. Based on phylogenetic analysis and their chromosome location, we have divided SbPHT genes into five subfamilies named SbPHT1;1–SbPHT1;12, SbPHT2;1, SbPHT3;1–SbPHT3;6, SbPHT4;1–SbPHT4;6, and SbPHO1;1–SbPHO1;2, respectively (Table 1).
3.3. Genomic Organization and Protein Properties of Sorghum PHT Proteins
The physical locations of 27 Sorghum PHT proteins have been mapped on the Sorghum chromosomes according to their locus names obtained from the online Phytozome database. These 27 genes are located on eight chromosomes, excluding chromosomes 5 and 8 (Figure 2). To be exact, chromosome 1 contains the maximum seven PHT genes, followed by five on chromosome 2, four on chromosome 6, three on chromosome 10, two on chromosome 3, and a single gene each on chromosomes 7 and 9 (Figure 2). Generally, different subfamily genes are randomly distributed on the Sorghum chromosomes. Although most of the SbPHT genes are well spaced on the Sorghum chromosomes, there are also some potential tandem duplicates. For instance, Sb01g020570 (SbPHT1;1) and Sb01g020580 (SbPHT1;2), Sb01g046890 (SbPHT1;3) and Sb01g046900 (SbPHT1;4), and Sb06g002540 (SbPHT1;8) and Sb06g002560 (SbPHT1;9) are located in a series on chromosomes (Figure 2) and are highly homologous in terms of the protein sequence (Figure 1).
The length of presumed SbPHT proteins ranges from 318 (SbPHT3;3) to 852 (SbPHO1;2) amino acids (aa), with an average of 518.9 aa, and their relative molecular mass varies from 34.7 (SbPHT3;3) to 97.2 (SbPHO1;2) kDa (Table 1). Meanwhile, the theoretical isoelectric points (pIs) range from 5.85 (SbPHT4;2) to 9.92 (SbPHT4;5), with most of them around 9.0 and only four under 7.0 (Table 1). Generally, the protein size in each subfamily is quite close, with a difference less than 70 aa expected for the SbPHT4 subfamily. However, the theoretical pIs in each subfamily vary widely (Table 1).
3.4. Gene Structure and Conserved Motifs of Sorghum PHT Proteins
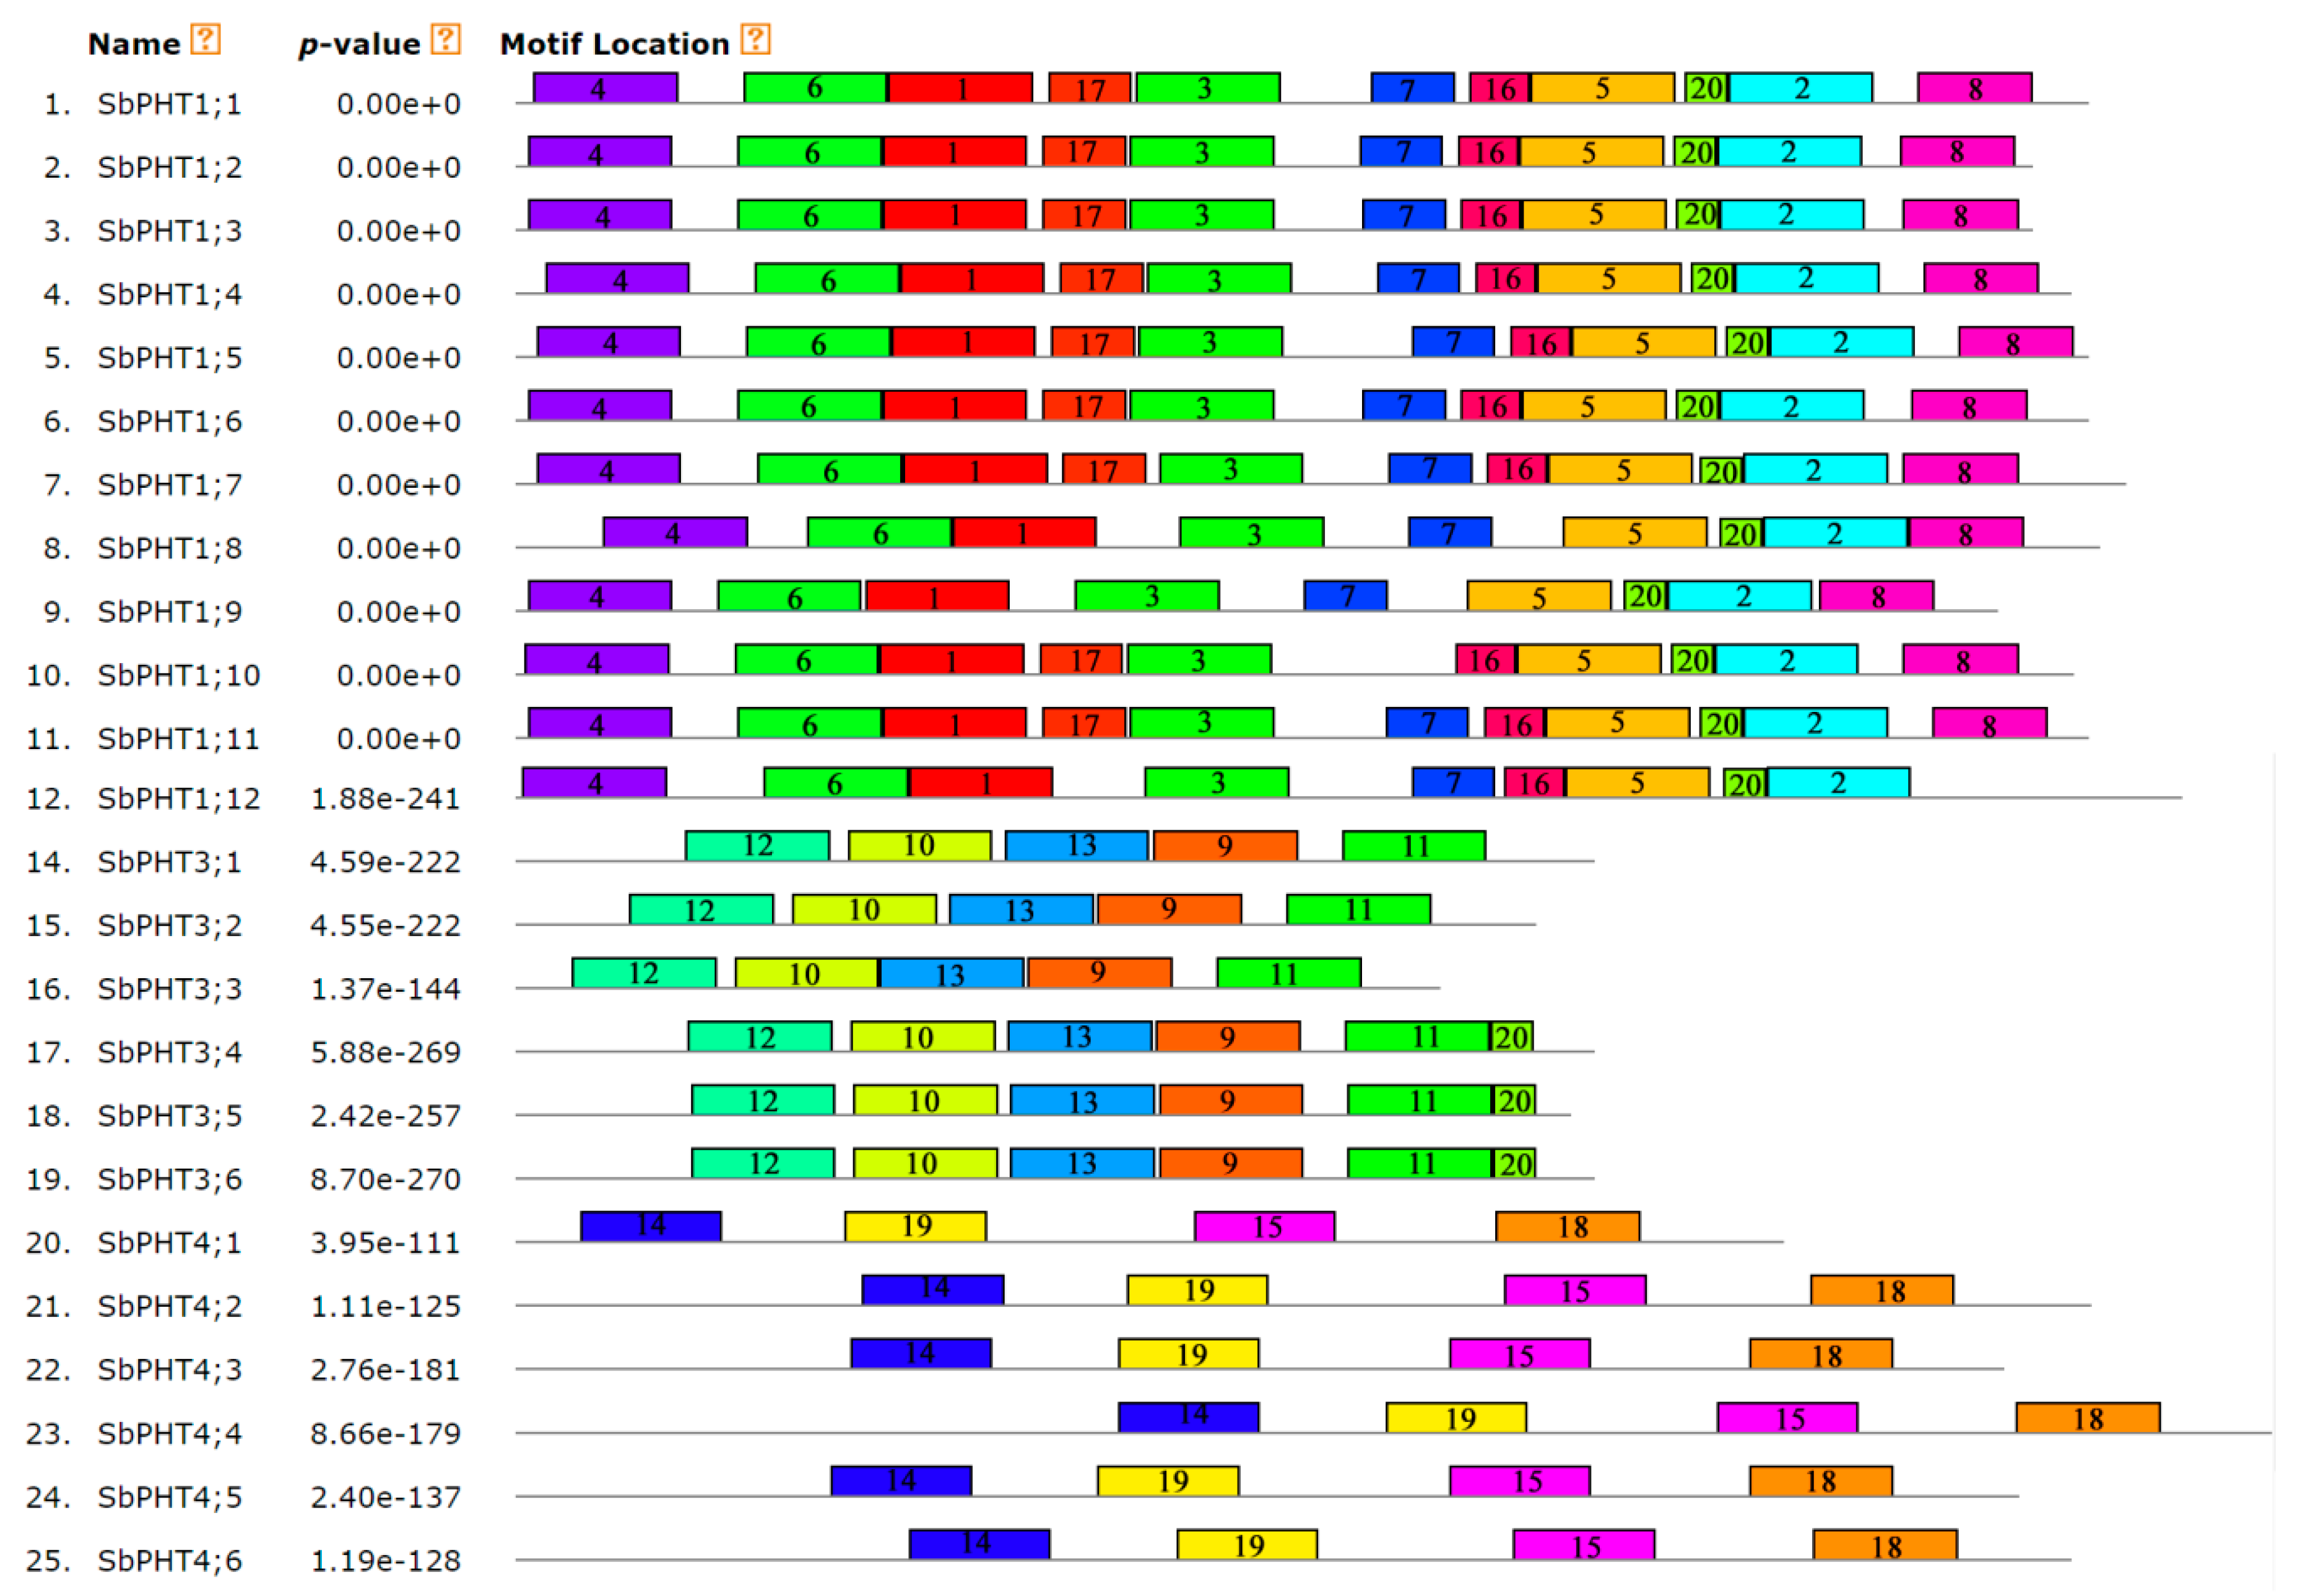
To gain insights into the structural features of predicted SbPHT genes, we determined the intron/exon distribution using an online gene structure display server program (GSDS, http://gsds.cbi.pku.edu.cn/). Our results showed that the SbPHT1 subfamily genes have no more than one intron; SbPHT2;1 has two introns, the SbPHT3 subfamily genes have five introns, and the SbPHO1 subfamily genes have more than 10 introns (Figure 3 and Table 1). However, the intron number in the SbPHT4 subfamily genes varies greatly, from 0 to 14 (Figure 3). According to the intron/exon distribution data, we could demonstrate that the gene structures in each subfamily are relatively conserved, except for the SbPHT4 subfamily. Then, we further analyzed the conserved motifs in the full-length Sorghum PHT proteins with the MEME program v5.0.3 (Figure 4). In total we identified 20 putative conserved motifs with 6–50 residues and E-values <1.00E-40. Among these 20 motifs, motifs 1–7 were present in all of the SbPHT1 subfamily proteins; motifs 9–13 only appeared in the SbPHT3 subfamily proteins; motifs 14, 15, 18, and 19 were in the SbPHT4 subfamily proteins; motifs 8, 16, and 17 were present in part of the SbPHT1 subfamily proteins; motif 20 was present in all the SbPHT1s and SbPHT3;4–SbPHT3;6. In general, the motifs are quite conserved within each subfamily.
3.5. Subcellular Localization and Transmembrane Domains of Sorghum PHT Proteins
As phosphate transporters, PHT proteins are reported to be membrane-bound [3]. Thus, we further predicted their transmembrane helices (TMHs) using the online databases. We found that SbPHT2;1 has the most TMHs, while the SbPHT3 subfamily members have no potential TMHs, as predicted by the TMHMM Server v. 2.0 (Table 1 and Table S4). Meanwhile, the subfamily members in SbPHT1 and SbPHO1 have 9–12 and 5–6 TMHs, respectively, whereas the TMH numbers in SbPHT4 vary from seven to 12 (Table 1). These results suggested that SbPHT proteins may also be membrane-bound, which is necessary for ion transport. Then, the subcellular localization of assumed SbPHT genes was predicted through four independent databases, Plant mPLoc, WoLFPSORT, MultiLoc2, and CELLO v2.5. To obtain high-confidence predictions, we set the cutoffs to confidence score >9, confidence score >0.7, and reliability score >4.0 for WoLFPSORT, MultiLoc2, and CELLO v 2.5, respectively. Our results indicated that most SbPHT1 and SbPHO1 subfamily members are likely located on the plasma membrane. However, there also have eleven proteins with confident but conflicting prediction results (Table S5), especially the SbPHT3 subfamily. Their subcellular localization needs to be investigated further.
3.6. Expression Profiles of Sorghum PHT Family Genes in Response to Low-Phosphate Conditions
The MOROKOSHI database, as well as the previously reported RNA-seq data [38,39,40,41,42], indicated the expression of SbPHTs in different tissues and under different growth conditions. However, their expression data in response to low-phosphate conditions are missing. To investigate the expression of SbPHT genes in response to phosphate starvation, we planted the Sorghum seeds on normal and low-phosphate 1/2 MS media for 14 days, and compared their relative expression levels under the above two growth conditions by qRT-PCR. Our data showed that 11 genes (SbPHT1;1, SbPHT1;2, SbPHT1;5, SbPHT1;7, SbPHT1;9, SbPHT1;10, SbPHT1;11, SbPHT3;2, SbPHT3;6, SbPHT4;1, SbPHT4;6) were upregulated more than 2-fold in the leaves after being phosphate-starved for 14 days (Figure 5). The other genes remained stable or were downregulated. In roots, only SbPHT1;2, SbPHT1;11, and SbPHT4;6 were upregulated more than 2-fold upon low-phosphate treatment, while most genes remained stable (Figure 5). These results suggested that these upregulated genes might be involved in phosphate uptake when phosphate is limited in soils.
4. Discussion
Sorghum bicolor, which originated from Africa, is the fifth-largest crop in global cereal production, feeding over 750 million people, especially in arid and semi-arid areas [43]. As a C4 crop, it exhibits high photosynthetic efficiency, has a large biological and economic yield, and can be classified into four ideotypes, namely, grain, forage, energy, and sweet sorghum [44]. Sorghum bicolor is also highly tolerant to drought, flood, salinity and alkalinity, infertility, heat, and cold, and thus has been called “the camel of crops.” Currently, the full-length genome of Sorghum bicolor (inbred line BTx623) has been sequenced [34], which provides important gene resources for further functional genomics research and genetic improvement in crops. In this study, we isolated the phosphate transporters (PHT) gene family using bioinformatics approaches and analyzed their evolutionary and phylogenetic relationships, as well as expression patterns.
As key regulators of plant phosphate uptake, the PHT family has been previously reported in various plant species. For instance, Zhang and colleagues reported 42 PHT genes from the poplar, containing 14 PtPHT1s, two PtPHT2s, six PtPHT3s, eight PtPHT4s, and 12 PtPHT5s [11]. Sun et al. identified 37 PHT family members from the apple, including 14 MdPHT1s, two MdPHT2s, seven MdPHT3s, 11 MdPHT4s, and three MdPHT5s [18]. In the potato, 20 StPHT genes could be grouped into eight StPHT1 homologs, one StPHT2 homolog, two StPHT3 homologs, five StPHT4 homologs, and four StPHO homologs [17]. In addition, there are 26 and 30 PHT family genes in rice and Arabidopsis, respectively. In this study, we identified 27 putative SbPHT members based on sequence alignments with the Arabidopsis and rice PHT families (Figure 1 and Table S3). The distribution of the members in different subfamilies is quite similar in Sorghum and rice (Figure 1). According to current publications, the PHT1 subfamily consisted of different members in different species, the number of which varied from four to 21 [14,16,17,18]. Although the total numbers of PHT family members differ between species, the PHT1 and PHT2 subfamilies are always the largest and smallest groups, respectively, implying that they may play a universal and a unique role in plants, respectively.
We noticed that Walder et al. previously reported 11 members belonging to PHT1 in Sorghum [45]. Here, we found an additional SbPHT1 member (SbPHT1;12, Sb10g012710), which exhibits high similarity to other PHT1s, not only in sequence similarity (Figure 1), but also in protein length, number of predicted transmembrane helices, and subcellular localization (Table 1). Analysis of the gene structures indicated that the numbers and distributions of exons and introns are relatively similar within each subfamily (Figure 3). These results further supported our clustering of the 27 SbPHT members into five subfamilies, mainly based on the phylogenetic tree (Figure 1).
As phosphate transporters, PHT proteins are reported to be membrane-bound [3,46]. Thus, we further analyzed the transmembrane domains of the identified 27 SbPHT proteins. To gain accurate results, we used three online databases with their default settings: the TMHMM Server v. 2.0 (http://www.cbs.dtu.dk/services/TMHMM/), the transporter classification database (http://www.tcdb.org/), and the TMbase (https://embnet.vital-it.ch/software/TMPRED_form.html). For most SbPHT members, the results from the above three databases are similar. However, the TMHMM server predicted that the SbPHT3 members had no TMHs, while the transporter classification database and TMbase predicted that they had 5–8 TMHs (Table S4). This might be due to those domains with a probability below 0.7 being excluded by the TMHMM server. The SbPHT3 members contained such low-probability TMHs. These predicted TMHs further supported the idea that these identified proteins are membrane-bound phosphate transporters in Sorghum.
The expression of PHT family members is inducible or constitutive [3]. Our qRT-PCR data indicated that multiply genes are induced in leaves under low-phosphate conditions, but most genes are stable in roots (Figure 5). To further reveal which gene(s) is responsible for phosphate uptake and translocation, we next need to examine the phosphate affinity of SbPHT proteins and construct mutants for gene functional analysis.
5. Conclusions
We have identified a total of 27 PHT family members in Sorghum; they could be clustered into five typical subfamilies. The protein features in each subfamily are very close, but their expression patterns are quite different.
Supplementary Materials
The following are available online at https://www.mdpi.com/2218-273X/9/11/670/s1, Table S1: The primers used for qRT-PCR, Table S2: IDs and annotations of SbPHT genes, Table S3: The locus names of PHT proteins from Arabidopsis and rice used for phylogenetic analysis, Table S4: Predication of the TMHs in SbPHT proteins via three online databases, Table S5: Subcellular predication of SbPHT proteins.
Author Contributions
Conceptualization, W.L.; Validation, L.L., J.X., and X.L.; Investigation, J.W., and Y.Y.; Writing—original draft preparation, J.W., and W.L.; Writing—review and editing, W.L.; project administration, W.L.; Funding acquisition, W.L.
Funding
This research was funded by (1) the National Natural Science Foundation of China, grant number 31701061, and (2) the Natural Science Foundation of Hubei Province, grant number 2018CFB509.
Conflicts of Interest
The authors declare no conflict of interest.
References
- Plaxton, W.C.; Carswell, M.C. Metabolic aspects of the phosphate starvation response in plants. In Plant Responses to Environmental Stresses: From Phytohormones to Genome Reorganization; Lerner, H.R., Ed.; M. Dekker: New York, NY, USA, 1999; pp. 350–372. [Google Scholar]
- Mimura, T. Regulation of phosphate transport and homeostasis in plant cells. Int. Rev. Cytol. 1999, 191, 149–200. [Google Scholar] [CrossRef]
- Lopez-Arredondo, D.L.; Leyva-González, M.A.; González-Morales, S.I.; López-Bucio, J.; Herrera-Estrella, L. Phosphate nutrition: Improving low-phosphate tolerance in crops. Plant Biol. 2014, 65, 95–123. [Google Scholar] [CrossRef] [PubMed]
- Muchhal, U.S.; Pardo, J.M.; Raghothama, K.G. Phosphate transporters from the higher plant Arabidopsis thaliana. Proc. Natl. Acad. Sci. USA 1996, 93, 10519–10523. [Google Scholar] [CrossRef] [PubMed]
- Mudge, S.R.; Rae, A.L.; Diatloff, E.; Smith, F.W. Expression analysis suggests novel roles for members of the Pht1 family of phosphate transporters in Arabidopsis. Plant J. 2002, 31, 341–353. [Google Scholar] [CrossRef]
- Liu, T.-Y.; Huang, T.-K.; Tseng, C.-Y.; Lai, Y.-S.; Lin, S.-I.; Lin, W.-Y.; Chen, J.-W.; Chiou, T.-J. PHO2-dependent degradation of PHO1 modulates phosphate homeostasis in Arabidopsis. Plant Cell 2012, 24, 2168–2183. [Google Scholar] [CrossRef]
- Wang, X.; Wang, Y.; Pineros, M.; Wang, Z.; Wang, W.; Li, C.; Wu, Z.; Kochian, L.; Wu, P. Phosphate transporters OsPHT1;9 and OsPHT1;10 are involved in phosphate uptake in rice. Plant Cell Environ. 2012, 37, 1159–1170. [Google Scholar] [CrossRef]
- Liu, X.; Zhao, X.; Zhang, L.; Lu, W.; Li, X.; Xiao, K. TaPht1;4, a high affinity phosphate transporter gene in wheat (Triticum aestivum), plays an important role in plant phosphate acquisition under phosphorus deprivation. Funct. Plant Biol. 2013, 40, 329–341. [Google Scholar] [CrossRef]
- Rausch, C.; Daram, P.; Brunner, S.; Jansa, J.; Laloi, M.; Leggewie, G.; Amrhein, N.; Bucher, M. A phosphate transporter expressed in arbuscule-containing cells in potato. Nature 2001, 414, 462–466. [Google Scholar] [CrossRef]
- Loth-Pereda, V.; Orsini, E.; Courty, P.-E.; Lota, F.; Kohler, A.; Diss, L.; Blaudez, D.; Chalot, M.; Nehls, U.; Bucher, M.; et al. Structure and expression profile of the phosphate Pht1 transporter gene family in mycorrhizal Populus trichocarpa. Plant Physiol. 2011, 156, 2141–2154. [Google Scholar] [CrossRef]
- Zhang, C.; Meng, S.; Li, M.; Zhao, Z. Genomic identification and expression analysis of the phosphate transporter gene family in poplar. Front. Plant Sci. 2016, 7, 1398. [Google Scholar] [CrossRef]
- Wang, Y.; Ribot, C.; Rezzonico, E.; Poirier, Y. Structure and expression profile of the Arabidopsis PHO1 gene family indicates a broad role in inorganic phosphate homeostasis. Plant Physiol. 2004, 135, 400–411. [Google Scholar] [CrossRef] [PubMed]
- Guo, B.; Jin, Y.; Wussler, C.; Blancaflor, E.B.; Motes, C.M.; Versaw, W.K. Functional analysis of the Arabidopsis PHT4 family of intracellular phosphate transporters. New Phytol. 2008, 77, 889–898. [Google Scholar] [CrossRef] [PubMed]
- Teng, W.; Zhao, Y.-Y.; Zhao, X.-Q.; He, X.; Ma, W.-Y.; Deng, Y.; Chen, X.-P.; Tong, Y.-P. Genome-wide Identification, Characterization, and Expression Analysis of PHT1 Phosphate Transporters in Wheat. Front. Plant Sci. 2017, 8, 543. [Google Scholar] [CrossRef] [PubMed] [Green Version]
- Chen, A.; Chen, X.; Wang, H.; Liao, D.; Gu, M.; Qu, H.; Sun, S.; Xu, G. Genome-wide investigation and expression analysis suggest diverse roles and genetic redundancy of Pht1 family genes in response to Pi deficiency in tomato. BMC Plant Biol. 2014, 14, 61. [Google Scholar] [CrossRef]
- Liu, F.; Chang, X.J.; Ye, Y.; Xie, W.B.; Wu, P.; Li, X.M. Comprehensive sequence and whole-life-cycle expression profile analysis of the phosphate transporter gene family in rice. Mol. Plant 2011, 4, 1105–1122. [Google Scholar] [CrossRef]
- Liu, B.; Zhao, S.; Wu, X.; Wang, X.; Nan, Y.; Wang, D.; Chen, Q. Identification and characterization of phosphate transporter genes in potato. J. Biotechnol. 2017, 264, 17–28. [Google Scholar] [CrossRef]
- Sun, T.; Li, M.; Shao, Y.; Yu, L.; Ma, F. Comprehensive Genomic Identification and Expression Analysis of the Phosphate Transporter (PHT) Gene Family in Apple. Front. Plant Sci. 2017, 8, 426. [Google Scholar] [CrossRef] [Green Version]
- Ai, P.; Sun, S.; Zhao, J.; Fan, X.; Xin, W.; Guo, Q.; Yu, L.; Shen, Q.; Wu, P.; Miller, A.J.; et al. Two rice phosphate transporters, OsPht1;2 and OsPht1;6, have different functions and kinetic properties in uptake and translocation. Plant J. 2009, 57, 798–809. [Google Scholar] [CrossRef]
- Qin, L.; Zhao, J.; Tian, J.; Chen, L.; Sun, Z.; Guo, Y.; Lu, X.; Gu, M.; Xu, G.; Liao, H. The high-affinity phosphate transporter GmPT5 regulates phosphate transport to nodules and nodulation in soybean. Plant Physiol. 2012, 159, 1634–1643. [Google Scholar] [CrossRef]
- Karthikeyan, A.S.; Varadarajan, D.K.; Mukatira, U.T.; D’Urzo, M.P.; Damsz, B.; Raghothama, K.G. Regulated Expression of Arabidopsis Phosphate Transporters. Plant Physiol. 2002, 130, 221–233. [Google Scholar] [CrossRef] [Green Version]
- Paszkowski, U.; Kroken, S.; Roux, C.; Briggs, S.P. Rice phosphate transporters include an evolutionarily divergent gene specifically activated in arbuscular mycorrhizal symbiosis. Proc. Natl. Acad. Sci. USA 2002, 99, 13324–13329. [Google Scholar] [CrossRef] [PubMed] [Green Version]
- Nagy, R.; Vasconcelos, M.J.V.; Zhao, S.; McElver, J.; Bruce, W.; Amrhein, N.; Raghothama, K.G.; Bucher, M. Differential regulation of five Pht1 phosphate transporters from maize (Zea mays L.). Plant Biol. 2006, 8, 186–197. [Google Scholar] [CrossRef] [PubMed]
- Fan, C.; Wang, X.; Hu, R.; Wang, Y.; Xiao, C.; Jiang, Y.; Zhang, X.; Zheng, C.; Fu, Y.-F. The pattern of Phosphate transporter 1 genes evolutionary divergence in Glycine max L. BMC Plant Biol. 2013, 3, 48. [Google Scholar] [CrossRef] [PubMed]
- Xiao, K.; Liu, J.; Dewbre, G.; Harrison, M.; Wang, Z.Y. Isolation and characterization of root-specific phosphate transporter promoters from Medicago truncatula. Plant Biol. 2006, 8, 439–449. [Google Scholar] [CrossRef]
- Liu, J.; Versaw, W.K.; Pumplin, N.; Gomez, S.K.; Blaylock, L.A.; Harrison, M.J. Closely related members of the Medicago truncatula PHT1 phosphate transporter gene family encode phosphate transporters with distinct biochemical activities. J. Biol. Chem. 2008, 283, 24673–24681. [Google Scholar] [CrossRef]
- Versaw, W.; Harrison, M. A chloroplast phosphate transporter, PHT2;1, influences allocation of phosphate within the plant and phosphate-starvation responses. Plant Cell 2002, 14, 1751–1766. [Google Scholar] [CrossRef]
- Liang, C.; Wang, J.; Zhao, J.; Tian, J.; Liao, H. Control of phosphate homeostasis through gene regulation in crops. Curr. Opin. Plant Biol. 2014, 21, 59–66. [Google Scholar] [CrossRef]
- Nussaume, L.; Kanno, S.; Javot, H.; Marin, E.; Pochon, N.; Ayadi, A.; Nakanishi, T.M.; Thibaud, M.-C. Phosphate import in plants: Focus on the PHT1 transporters. Front. Plant Sci. 2011, 2, 83. [Google Scholar] [CrossRef]
- Shin, H.; Shin, H.S.; Dewbre, G.R.; Harrison, M.J. Phosphate transport in Arabidopsis: Pht1;1 and Pht1;4 play a major role in phosphate acquisition from both low and high-phosphate environments. Plant J. 2004, 39, 629–642. [Google Scholar] [CrossRef]
- Nagarajan, V.K.; Jain, A.; Poling, M.D.; Lewis, A.J.; Raghothama, K.G.; Smith, A.P. Arabidopsis Pht1;5 mobilizes phosphate between source and sink organs and influences the interaction between phosphate homeostasis and ethylene signaling. Plant Physiol. 2011, 156, 1149–1163. [Google Scholar] [CrossRef]
- Remy, E.; Cabrito, T.R.; Batista, R.A.; Teixeira, M.C.; Sá-Correia, I.; Duque, P. The Pht1;9 and Pht1;8 transporters mediate inorganic phosphate acquisition by the Arabidopsis thaliana root during phosphorus starvation. New Phytol. 2012, 195, 356–371. [Google Scholar] [CrossRef] [PubMed]
- Lapis-Gaza, H.R.; Jost, R.; Finnegan, P.M. Arabidopsis phosphate transporter 1 genes PHT1;8 and PHT1;9 are involved in root-to-shoot translocation of orthophosphate. BMC Plant Biol. 2014, 14, 334. [Google Scholar] [CrossRef] [PubMed]
- Paterson, A.H.; Bowers, J.E.; Bruggmann, R.; Dubchak, I.; Grimwood, J.; Gundlach, H.; Haberer, G.; Hellsten, U.; Mitros, T.; Poliakov, A.; et al. The Sorghum bicolor genome and the diversification of grasses. Nature 2009, 457, 551–556. [Google Scholar] [CrossRef] [PubMed] [Green Version]
- Liu, W.; Li, R.J.; Han, T.T.; Cai, W.; Fu, Z.W.; Lu, Y.T. Salt stress reduces root meristem size by nitric oxide mediated modulation of auxin accumulation and signaling in Arabidopsis. Plant Physiol. 2015, 168, 343–356. [Google Scholar] [CrossRef] [PubMed]
- Liu, W.; Shen, X.; Liang, H.; Wang, Y.; He, Z.; Zhang, D.; Chen, F. Isolation and Functional Analysis of PISTILLATA Homolog from Magnolia wufengensis. Front. Plant Sci. 2018, 9, 1743. [Google Scholar] [CrossRef] [PubMed]
- Liu, W.; Wang, C.; Shen, X.; Liang, H.; Wang, Y.; He, Z.; Zhang, D.; Chen, F. Comparative transcriptome analysis highlights the hormone effects on somatic embryogenesis in Catalpa bungei. Plant Reprod. 2019, 32, 141. [Google Scholar] [CrossRef]
- Ayadi, A.; David, P.; Arrighi, J.-F.; Chiarenza, S.; Thibaud, M.-C.; Nussaume, L.; Marín, E. Reducing the genetic redundancy of Arabidopsis PHOSPHATE TRANSPORTER1 transporters to study phosphate uptake and signaling. Plant Physiol. 2015, 167, 1511–1526. [Google Scholar] [CrossRef]
- Dugas, D.V.; Monaco, M.K.; Olsen, A.; Klein, R.R.; Kumari, S.; Ware, D.; Klein, P.E. Functional annotation of the transcriptome of Sorghum bicolor in response to osmotic stress and abscisic acid. BMC Genom. 2011, 12, 514. [Google Scholar] [CrossRef]
- Yazawa, T.; Kawahigashi, H.; Matsumoto, T.; Mizuno, H. Simultaneous transcriptome analysis of Sorghum and Bipolaris sorghicola by using RNA-seq in combination with de novo transcriptome assembly. PLoS ONE 2013, 8, e62460. [Google Scholar] [CrossRef]
- Gelli, M.; Duo, Y.; Konda, A.R.; Zhang, C.; Holding, D.; Dweikat, I. Identification of differentially expressed genes between sorghum genotypes with contrasting nitrogen stress tolerance by genome-wide transcriptional profiling. BMC Genom. 2014, 15, 179. [Google Scholar] [CrossRef]
- Johnson, S.M.; Lim, F.L.; Finkler, A.; Fromm, H.; Slabas, A.R.; Knight, M.R. Transcriptomic analysis of Sorghum bicolor responding to combined heat and drought stress. BMC Genom. 2014, 15, 1. [Google Scholar] [CrossRef] [PubMed]
- Ramatoulaye, F.; Mady, C.; Fallou, S.; Amadou, K.; Cyril, D. Production and use of sorghum: A literature review. J. Nutr. Health Food Sci. 2016, 4, 1–4. [Google Scholar] [CrossRef]
- Anami, S.E.; Zhang, L.M.; Xia, Y.; Zhang, Y.M.; Liu, Z.Q.; Jing, H.C. Sweet sorghum ideotypes: Genetic improvement of the biofuel syndrome. Food Energy Secur. 2015, 4, 159–177. [Google Scholar] [CrossRef]
- Walder, F.; Brule, D.; Koegel, S.; Wiemken, A.; Boller, T.; Courty, P.E. Plant phosphorus acquisition in a common mycorrhizal network: Regulation of phosphate transporter genes of the Pht1 family in sorghum and flax. New Phytol. 2015, 205, 1632–1645. [Google Scholar] [CrossRef]
- Rausch, C.; Bucher, M. Molecular mechanisms of phosphate transport in plants. Planta 2002, 216, 23–37. [Google Scholar] [CrossRef]
Figure 1.
Phylogenetic tree of PHT proteins from Sorghum, Arabidopsis, and rice. The unrooted neighbor joining (NJ) phylogenetic tree was constructed by using the full-length sequences of PHT proteins from Sorghum, Arabidopsis, and rice. The red diamond, yellow circle, and green square represent PHT proteins from Sorghum, Arabidopsis, and rice, respectively.
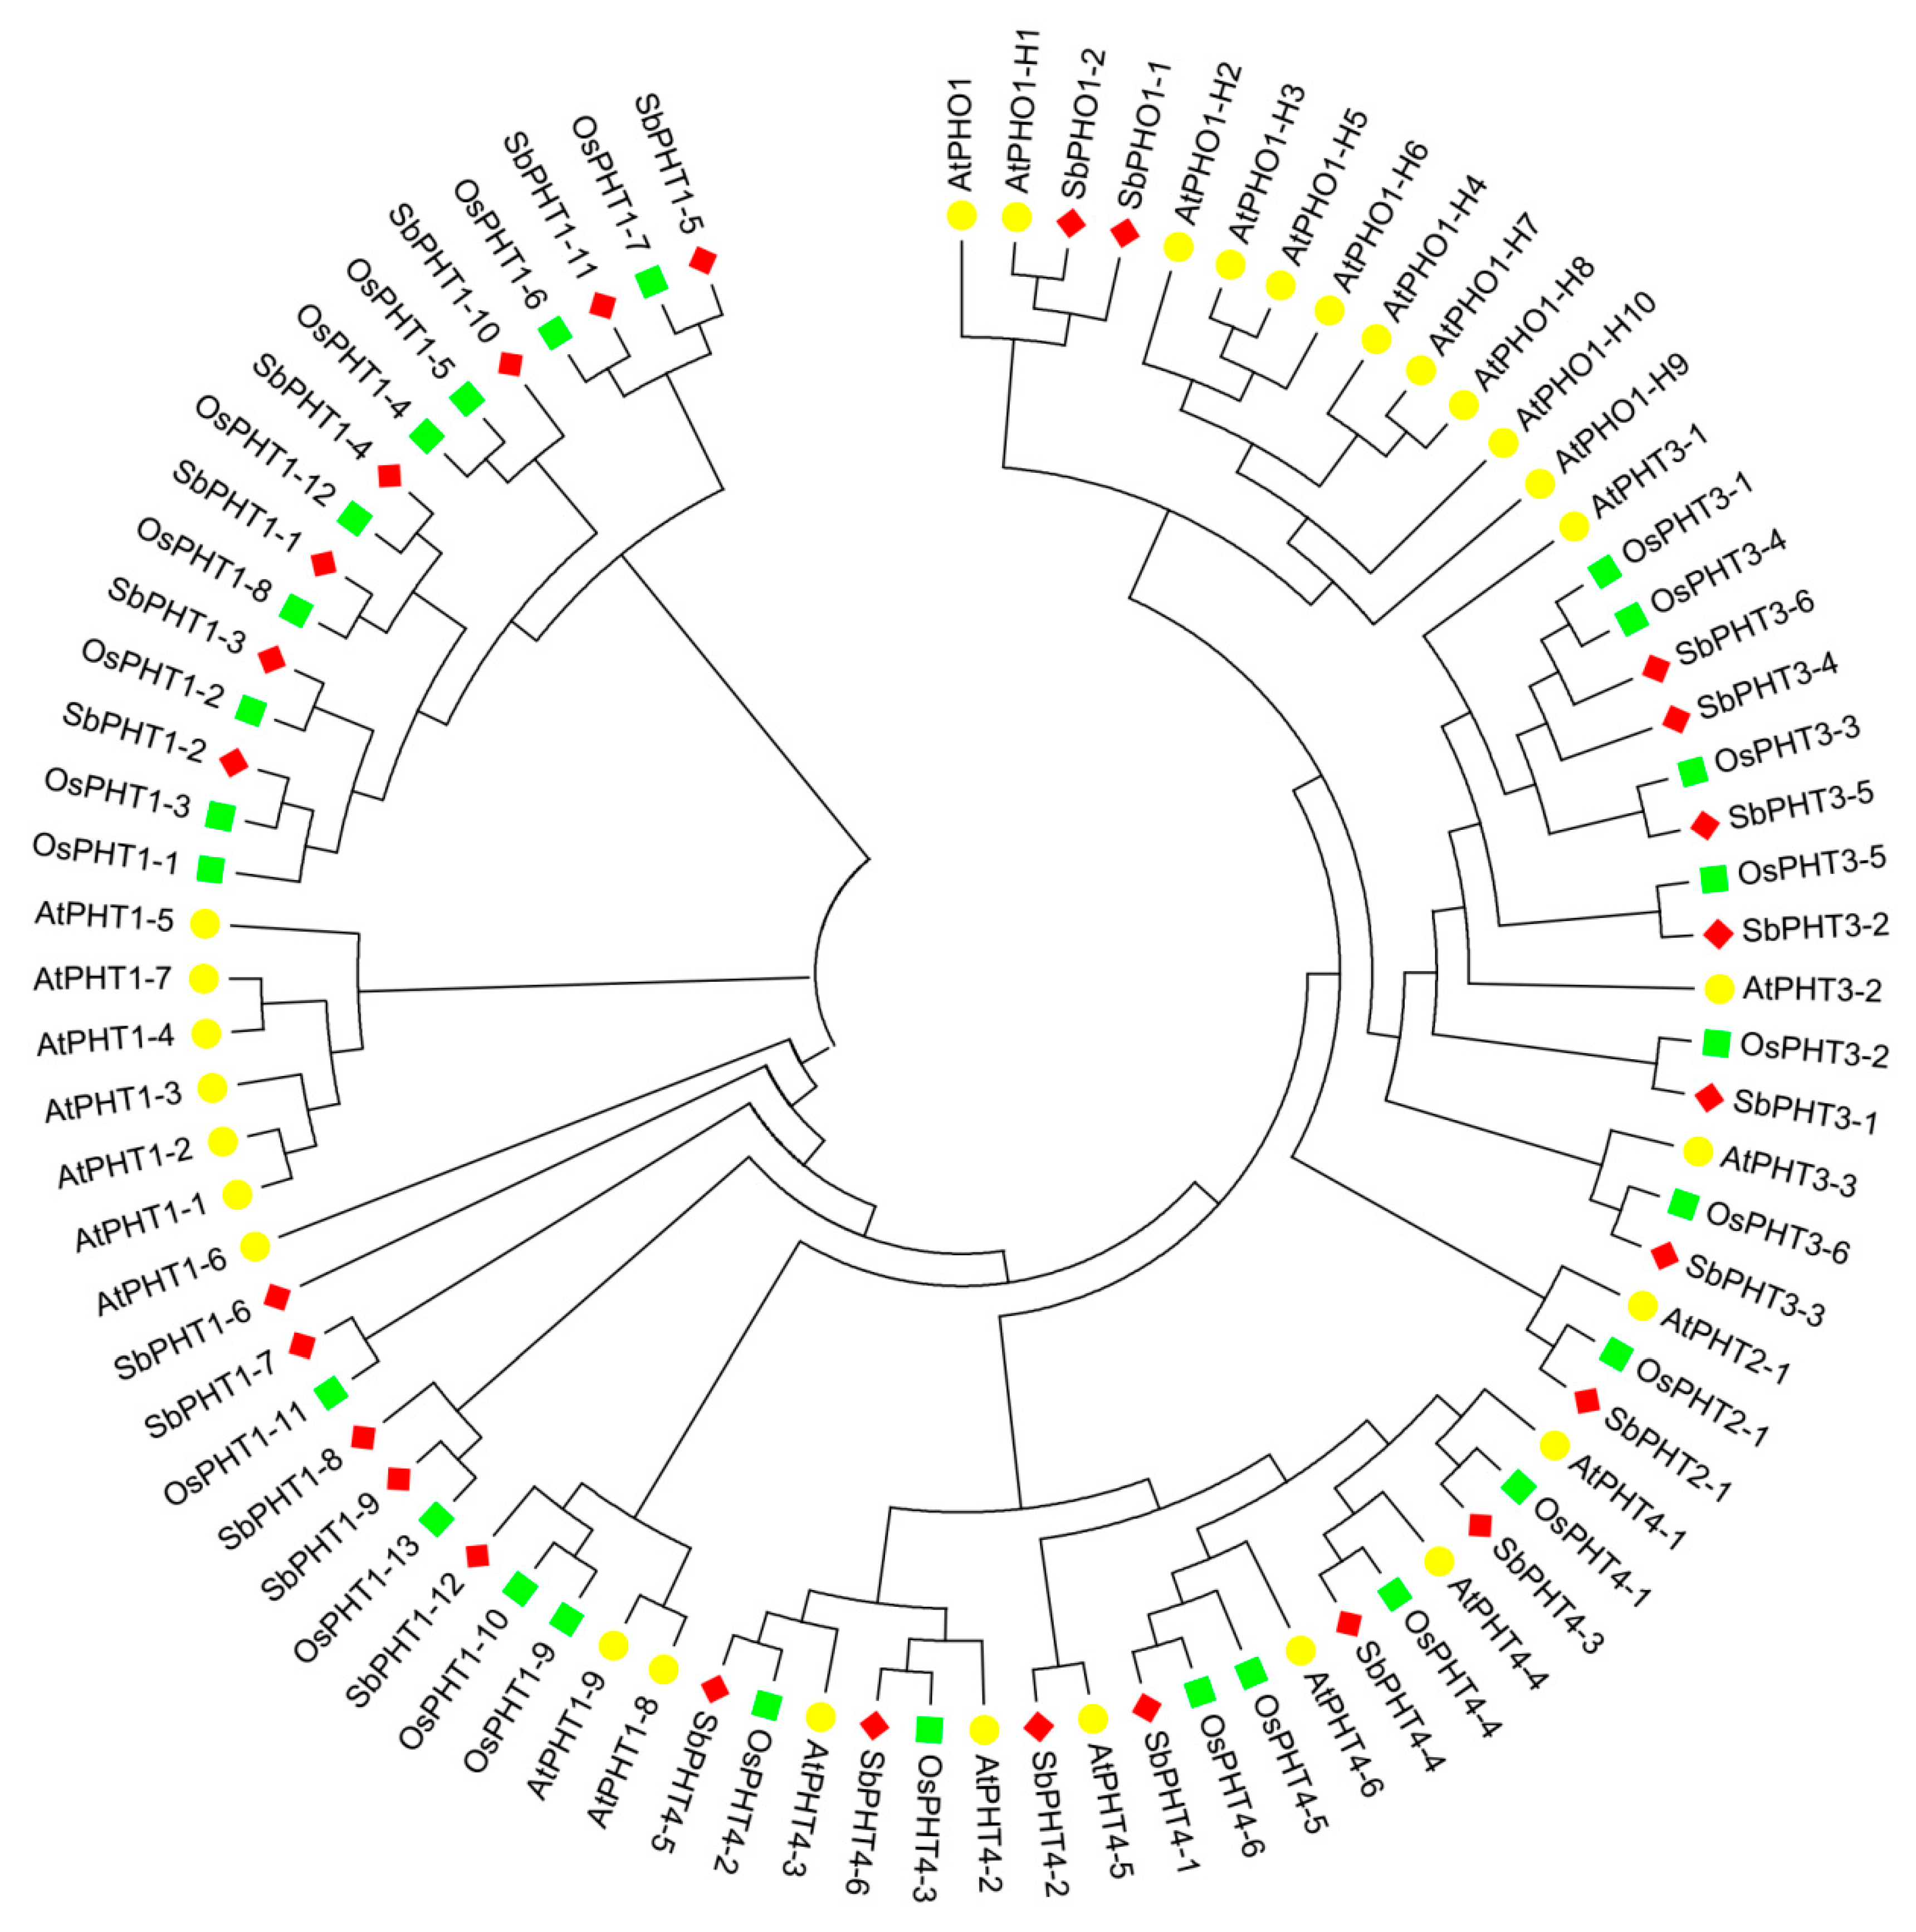
Figure 2.
Distribution of PHT genes on the Sorghum chromosomes. The physical locations of the Sorghum PHT genes were obtained from the Phytozome database (Sorghum bicolor v3.1.1). Then, the location map was drawn with the MapGene2chromosome web v2 (MG2C) database (http://mg2c.iask.in/mg2c_v2.0/). The vertical bar on the left indicates the length of the Sorghum chromosomes in Mb. Chromosome numbers are indicated at the top of each column.

Figure 3.
Gene structures of PHT genes in Sorghum. The full-length mRNA sequences of SbPHT genes are analyzed and displayed. The yellow boxes represent coding sequence (CDS), whereas the blue boxes represent upstream or downstream untranslated regions (UTRs). The introns in coding sequence are shown as black lines. The scale bar at the bottom indicates the length of the SbPHT genes in Kb.

Figure 4.
Analysis of the conserved motifs in the full-length Sorghum PHT proteins with the MEME program v5.0.3.
Figure 4.
Analysis of the conserved motifs in the full-length Sorghum PHT proteins with the MEME program v5.0.3.

Figure 5.
The relative expression levels of SbPHT genes in shoots and roots under normal and low-phosphate conditions. qRT-PCR analysis of SbPHT genes in the different tissues of 14-d-old Sorghum seedlings, including leaves under normal (CK-L) or low-phosphate (LP-L) growth conditions, and roots under normal (CK-R) or low-phosphate (LP-R) growth conditions. For each experiment, at least three independent biological replicates and three technical repetitions were assayed. PP2A and EIF4A were chosen as internal controls. The relative expression levels of the corresponding genes in comparison to the housekeeping genes were used to draw the figure in Genesis software. The red and green colors are presented by log transformation value with normalization.


Table 1.
Key features of SbPHT genes.
| S. No. | Accession IDs | Gene IDs | Protein Length (aa) | Molecular Weight (kDa) | Isoelectric Point (pI) | Number of Introns | Number of Predicted Transmembrane Helices * | Predicted Subcellular Location ** |
|---|---|---|---|---|---|---|---|---|
| SbPHT1;1 | Sobic.001G234800 | Sb01g020570 | 541 | 58.78 | 7.62 | 0 | 11 | Plasma Membrane |
| SbPHT1;2 | Sobic.001G234900 | Sb01g020580 | 522 | 56.96 | 7.63 | 0 | 12 | Plasma Membrane |
| SbPHT1;3 | Sobic.001G502000 | Sb01g046890 | 522 | 57.14 | 8.7 | 0 | 11 | Plasma Membrane |
| SbPHT1;4 | Sobic.001G502100 | Sb01g046900 | 535 | 57.88 | 8.81 | 0 | 12 | Plasma Membrane |
| SbPHT1;5 | Sobic.001G513400 | Sb01g047910 | 541 | 58.25 | 6.46 | 0 | 11 | Plasma Membrane |
| SbPHT1;6 | Sobic.002G116100 | Sb02g009880 | 541 | 58.91 | 8.01 | 0 | 12 | Plasma Membrane |
| SbPHT1;7 | Sobic.003G243400 | Sb03g029970 | 554 | 60.26 | 7.61 | 1 | 12 | Plasma Membrane |
| SbPHT1;8 | Sobic.006G026800 | Sb06g002540 | 545 | 60.43 | 6.28 | 1 | 9 | — |
| SbPHT1;9 | Sobic.006G026900 | Sb06g002560 | 510 | 56.26 | 9.31 | 1 | 12 | Plasma Membrane |
| SbPHT1;10 | Sobic.006G027300 | Sb06g002800 | 536 | 58.63 | 6.8 | 1 | 10 | Plasma Membrane |
| SbPHT1;11 | Sobic.007G164400 | Sb07g023780 | 541 | 57.80 | 8.88 | 0 | 11 | — |
| SbPHT1;12 | Sobic.010G133300 | Sb10g012710 | 573 | 62.06 | 9.19 | 1 | 10 | Plasma Membrane |
| SbPHT2;1 | Sobic.004G199900 | Sb04g024630 | 572 | 59.31 | 9.48 | 2 | 13 | — |
| SbPHT3;1 | Sobic.001G428500 | Sb01g040260 | 371 | 39.73 | 8.97 | 5 | 0 | — |
| SbPHT3;2 | Sobic.002G224100 | Sb02g026490 | 351 | 37.31 | 9.33 | 5 | 0 | Chloroplast |
| SbPHT3;3 | Sobic.002G291800 | Sb02g032310 | 318 | 34.65 | 9.26 | 5 | 0 | — |
| SbPHT3;4 | Sobic.004G310300 | Sb04g034260 | 371 | 38.970 | 9.3 | 5 | 0 | — |
| SbPHT3;5 | Sobic.006G097400 | Sb06g018210 | 363 | 38.18 | 9.44 | 5 | 0 | — |
| SbPHT3;6 | Sobic.010G080900 | Sb10g007010 | 371 | 39.13 | 9.22 | 5 | 0 | — |
| SbPHT4;1 | Sobic.001G169100 | Sb01g014790 | 436 | 47.89 | 9.91 | 0 | 12 | Plasma Membrane |
| SbPHT4;2 | Sobic.002G293500 | Sb02g032440 | 542 | 58.07 | 5.85 | 14 | 9 | Plasma Membrane |
| SbPHT4;3 | Sobic.003G133700 | Sb03g011370 | 512 | 55.28 | 8.62 | 9 | 7 | — |
| SbPHT4;4 | Sobic.003G186800 | Sb03g025190 | 604 | 66.41 | 9.73 | 10 | 11 | Plasma Membrane |
| SbPHT4;5 | Sobic.003G358900 | Sb03g040080 | 517 | 55.66 | 9.92 | 7 | 10 | — |
| SbPHT4;6 | Sobic.009G157700 | Sb09g022090 | 535 | 56.17 | 9.76 | 7 | 11 | — |
| SbPHO1;1 | Sobic.003G101000 | Sb03g008460 | 851 | 95.45 | 9.04 | 10 | 5 | Plasma Membrane |
| SbPHO1;2 | Sobic.010G138800 | Sb10g014220 | 852 | 97.17 | 8.78 | 13 | 6 | — |
*: predicted by the TMHMM Server v. 2.0 (http://www.cbs.dtu.dk/services/TMHMM/). **: — = undefined.
© 2019 by the authors. Licensee MDPI, Basel, Switzerland. This article is an open access article distributed under the terms and conditions of the Creative Commons Attribution (CC BY) license (http://creativecommons.org/licenses/by/4.0/).
Share and Cite
MDPI and ACS Style
Wang, J.; Yang, Y.; Liao, L.; Xu, J.; Liang, X.; Liu, W. Genome-Wide Identification and Functional Characterization of the Phosphate Transporter Gene Family in Sorghum. Biomolecules 2019, 9, 670. https://doi.org/10.3390/biom9110670
AMA Style
Wang J, Yang Y, Liao L, Xu J, Liang X, Liu W. Genome-Wide Identification and Functional Characterization of the Phosphate Transporter Gene Family in Sorghum. Biomolecules. 2019; 9(11):670. https://doi.org/10.3390/biom9110670
Chicago/Turabian StyleWang, Jiahui, Yang Yang, Lingzi Liao, Jiawei Xu, Xiao Liang, and Wen Liu. 2019. "Genome-Wide Identification and Functional Characterization of the Phosphate Transporter Gene Family in Sorghum" Biomolecules 9, no. 11: 670. https://doi.org/10.3390/biom9110670
Note that from the first issue of 2016, this journal uses article numbers instead of page numbers. See further details here.