1. Introduction
Flocking in micro-UAVs has been attempted in many forms with varying degrees of success. Some attempts have used global observers (e.g., GPS signals or motion capture systems) to obtain positions of flock members for formation flying [
1,
2,
3]. For example, Hauert et al. used a strategy that involved the combination of communication and GPS signals to achieve outdoor flocking of fixed wing robots [
1]. GPS signals were used to obtain the position of each robot. These positions were then communicated to the other members of the flock while Reynolds laws of flocking [
4] were used to obtain flock control. Reliance on GPS signals was also used by Vásárhelyi et al. [
3] in achieving decentralized flocking of 10 quadrotors in an outdoor environment. However, this approach fails when GPS signals are lost, such as in caves, under heavy forest canopy, or even between tall buildings in urban environments.
Looking to nature, swarms are able to cope with a dynamic environment and keep formation without the need for global position information or explicit communication between members. They are able to do this through the primary use of visual cues derived as a result of the structure of their retinal pathways. It is postulated in this paper that having an overview of the structure of these pathways will enable us to infer the “computations” taking place during their flocking behavior and will guide us to design better vision-based flocking algorithms for micro-UAVs.
Starlings are known to flock at dusk. With the low visibility challenges that come with low light conditions, they are still able to maintain a cohesive formation whilst avoiding collisions with each other. From a computer engineering perspective, they must perform computations that enable them to identify each other, detect the distance to a neighbor, as well as detect the bearing to another individual within a very short window of time. Outside this critical window, collisions are more likely to happen and flocking behavior will most likely not emerge [
5,
6].
It is quite likely that, in order to meet this critical window, the computations to achieve flocking in natural systems happen in or close to the retina [
7,
8]. For example, it has been observed that direction, light, object, texture, distance and motion detection all take place in mammal’s retinas and not the visual cortex [
6,
8,
9,
10,
11,
12]. Therefore, it is important to study these retinal “computations” for the purposes of building better, robust, and scalable vision-based flocking algorithms. Most of the research in this area has focused on the subset problem of vision-based Leader-Follower algorithms.
Research in vision-based Leader-Follower algorithms for micro-UAVs often make use of a known mathematical model for the Leader in state estimation algorithms, as well as GPS or visual markers on the Leader [
13,
14,
15,
16]. State estimation algorithms, such as Kalman filters, are often used as a default to compensate for delays or momentary loss of GPS signals. However, are these state estimation algorithms really necessary to achieve Leader-Follower behavior on micro-UAVs? For example, Cowan et al. argued that if the constraint of maintaining visibility with the Leader is satisfied and as long as the Leader keeps moving, any linear controller, which does not depend on Leader pose estimation, is sufficient to achieve and stabilize Leader-Follower formation flying [
5].
Nevertheless, Cowan et al. did not consider the effects of delays in the control loop of the Follower. Delays in the control loop could be caused by factors such as communication delays, visual sensor refresh rates, complexity of vision processing algorithms and delays in the control algorithm approach used. Looking at literature, the effects of communication delays has mostly been investigated during synchronized formation flight [
17,
18,
19] while state estimation algorithms have been mostly used to deal with noisy and intermittent sensor signals [
15,
16].
In this work, the following three contributions are made: (i) using a computational methodology [
20], the mechanisms discussed in [
6] and the references there in were used to derive a high level functional architecture of a vertebrate’s visual pathway. This architecture was used to derive: (a) an algorithm capable of extracting the pose of a Leader from the visual field of the Follower and (b) a vision-based Leader-Follower linear controller; (ii) using our developed controller, we show that as long as the delay in the control loop of the Follower is not above a certain critical threshold, we can achieve Leader-Follower formation flying. This is provided that the lighting conditions required to maintain visibility with the Leader is observed and that there are no occlusions between the Leader and the Follower [
5,
15]; (iii) unlike previous approaches, we do not use external observers, state estimation algorithms, or synchronized communication with flock members,. We only make use of visual information from an onboard camera on a micro-UAV to achieve Leader-Follower formation flying. Our approach is validated with simulations as well as actual physical experiments on micro-UAVs.
The rest of the paper is organized as follows: in
Section 2, we present the problem statement followed by
Section 3 in which we derive a controller that is robust to delays;
Section 4 presents the algorithmic development of the derived controller on a chosen micro-UAV platform while, in
Section 5, the results of simulations are presented after which physical experimental results are presented in
Section 6; a discussion of our work is presented in
Section 7 and conclusions follow in
Section 8.
2. Problem Statement
As mentioned in the introduction, delays in the control loop are generated as a result of the following factors: (1) communication delay
between a micro-UAV and a base station; (2) visual sensor refresh rates
; (3) delay caused by the computing time taken to process images
[
5]; and (4) delay caused by the computing time taken to perform state estimation and other algorithms
for achieving micro-UAV control [
5,
21]. This is given by Equation (1):
In order to reduce or eliminate the delays caused by factor (3), we used the approach discussed in
Section 4.2. To reduce the delays caused by factor (4), we try to keep computations minimal by not using state estimation algorithms. The values of the delays caused by factor (1) and (2) vary as discussed in [
5] and affect the observation of the Leader by the Follower. These two factors are platform and hardware dependent and as a result cannot be controlled.
Nevertheless, in the next section, we derive a Leader-Follower controller that is able to maintain formation flying regardless of the platform dependent delays.
3. Deriving a Delay Robust Leader-Follower Formation Controller
In this section, we derive a delay robust Leader-Follower formation controller and show that, provided the value of the delay is below a certain value , our approach to Leader-Follower formation flying will work without the need of a state estimation algorithm.
3.1. Assumptions
Assumption 1. The Leader L is a moving fixed point with forward speed . The Follower F has a speed that can be adjusted to keep up with the Leader.
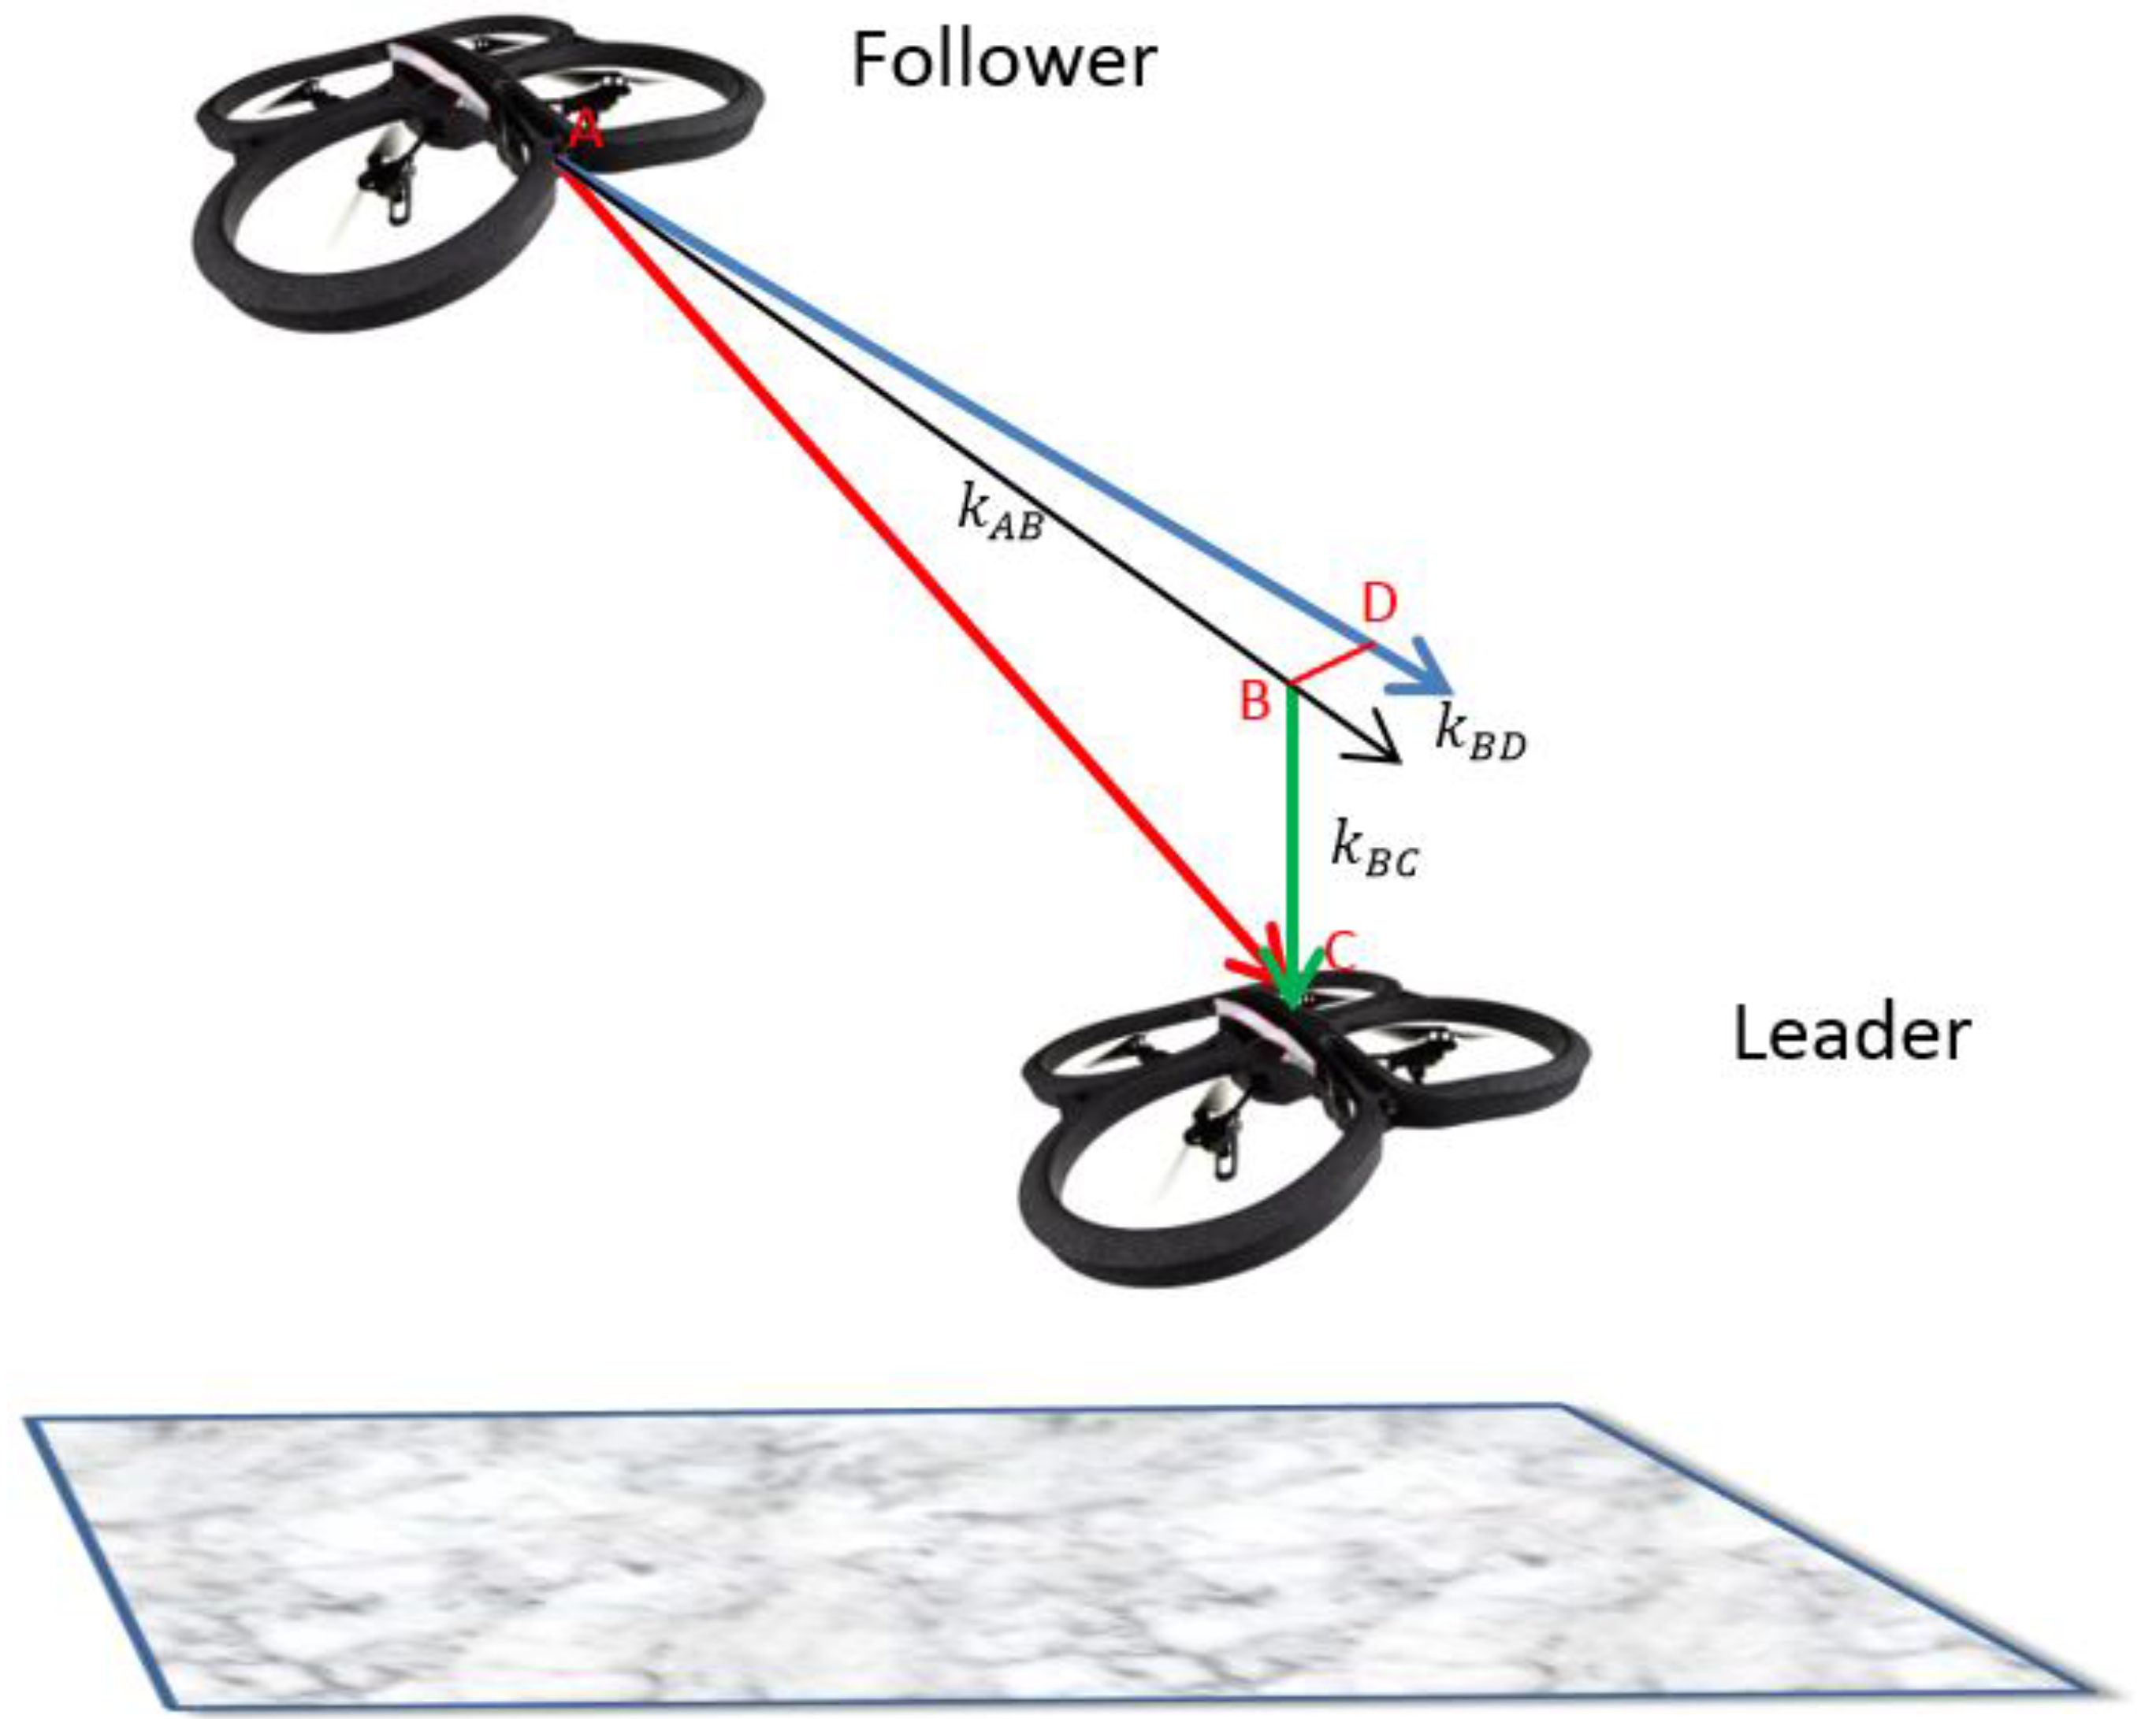
Assumption 2. There is a system of three virtual springs that connects the Leader
L to the Follower
F as shown in
Figure 1 with a spring AB connecting point A on the Follower to point B on the Leader. The force generated by the spring AB is dependent on the forward distance between the Leader and Follower. Another spring BC connects the points B and C. The force generated by the spring is dependent on the vertical distance between the Follower and Leader while a third spring BD connects points B and D and the force is dependent on the horizontal distance between the Follower and Leader. We describe the entire system using the Hooke’s law of spring as in Equation (2) where for simplicity,
embeds the stiffness constants (
,
,
) of the three springs.
H is the force generated by the corresponding springs,
is the rest length of the springs while the stretched or compressed lengths are given by
:
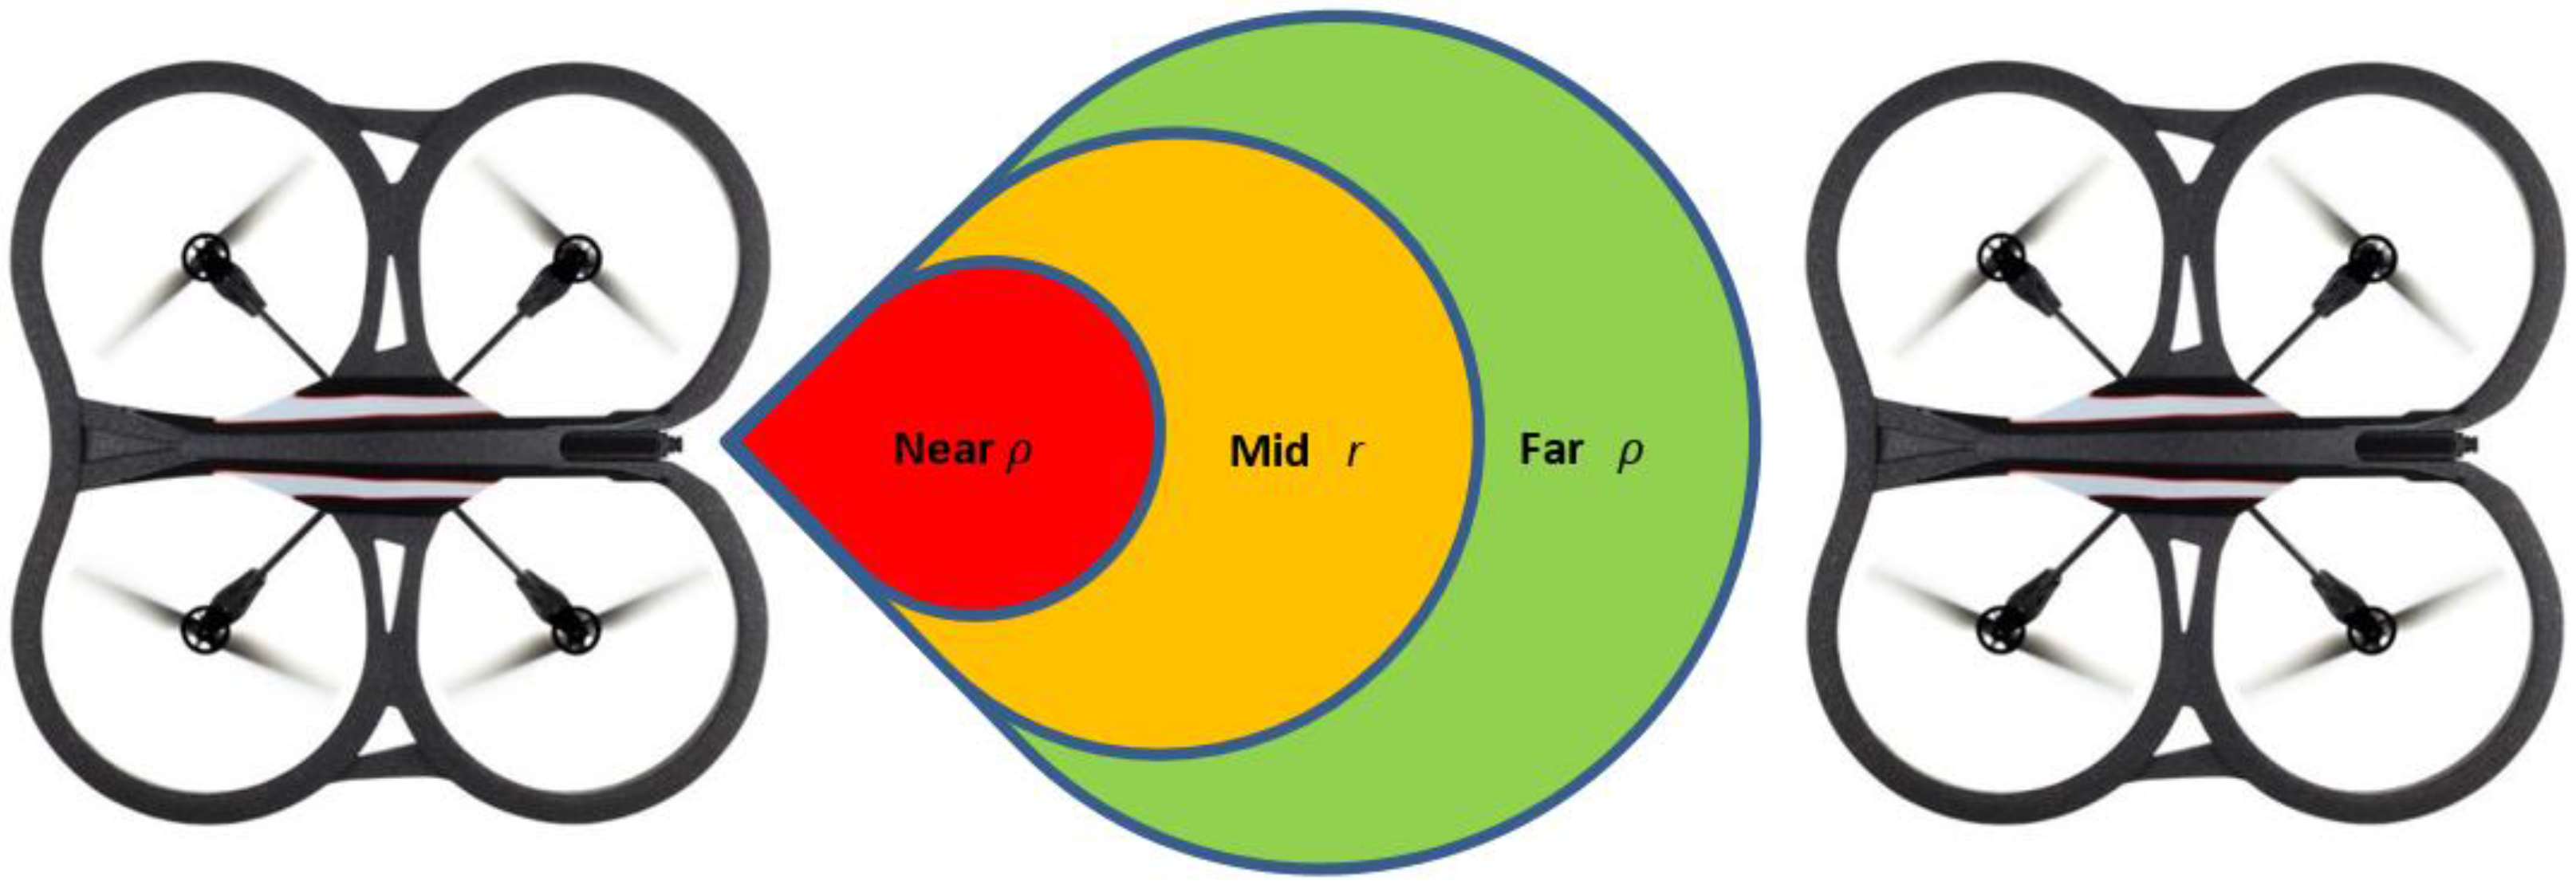
Assumption 3. Using
Figure 2, we assume three zones with distance threshold values called
near zone,
mid-zone and
far zone. It is assumed that the value of
from Equation (2) is given by the
mid-zone; while the stretched or compressed length
is given by the values of the
far zone or the
near zone, respectively. Since
and
are distance terms, we can convert them into velocity components as depicted in Equation (3):
where
is the compressed or stretched velocity as a result of the Follower in the
near or
far zone, respectively.
is the rest velocity in the
mid-zone. Equation (3) is rewritten as follows:
Assumption 4. Every spring has a breaking point or stretching limit beyond which they will not recover to the rest length and they will be permanently deformed. In the Leader-Follower link, this breaking point is assumed to be the maximum visual range beyond which the Leader L will not be observable.
3.2. Proof
Assumption 4 leads to the constraint defined in Equation (5) that shows, provided that a distance
between the Leader
L and Follower
F is less than
and greater than 0, the Leader-Follower formation flying will take place. Contradicting the constraint
will lead to a collision or if the value is negative will not lead to flocking:
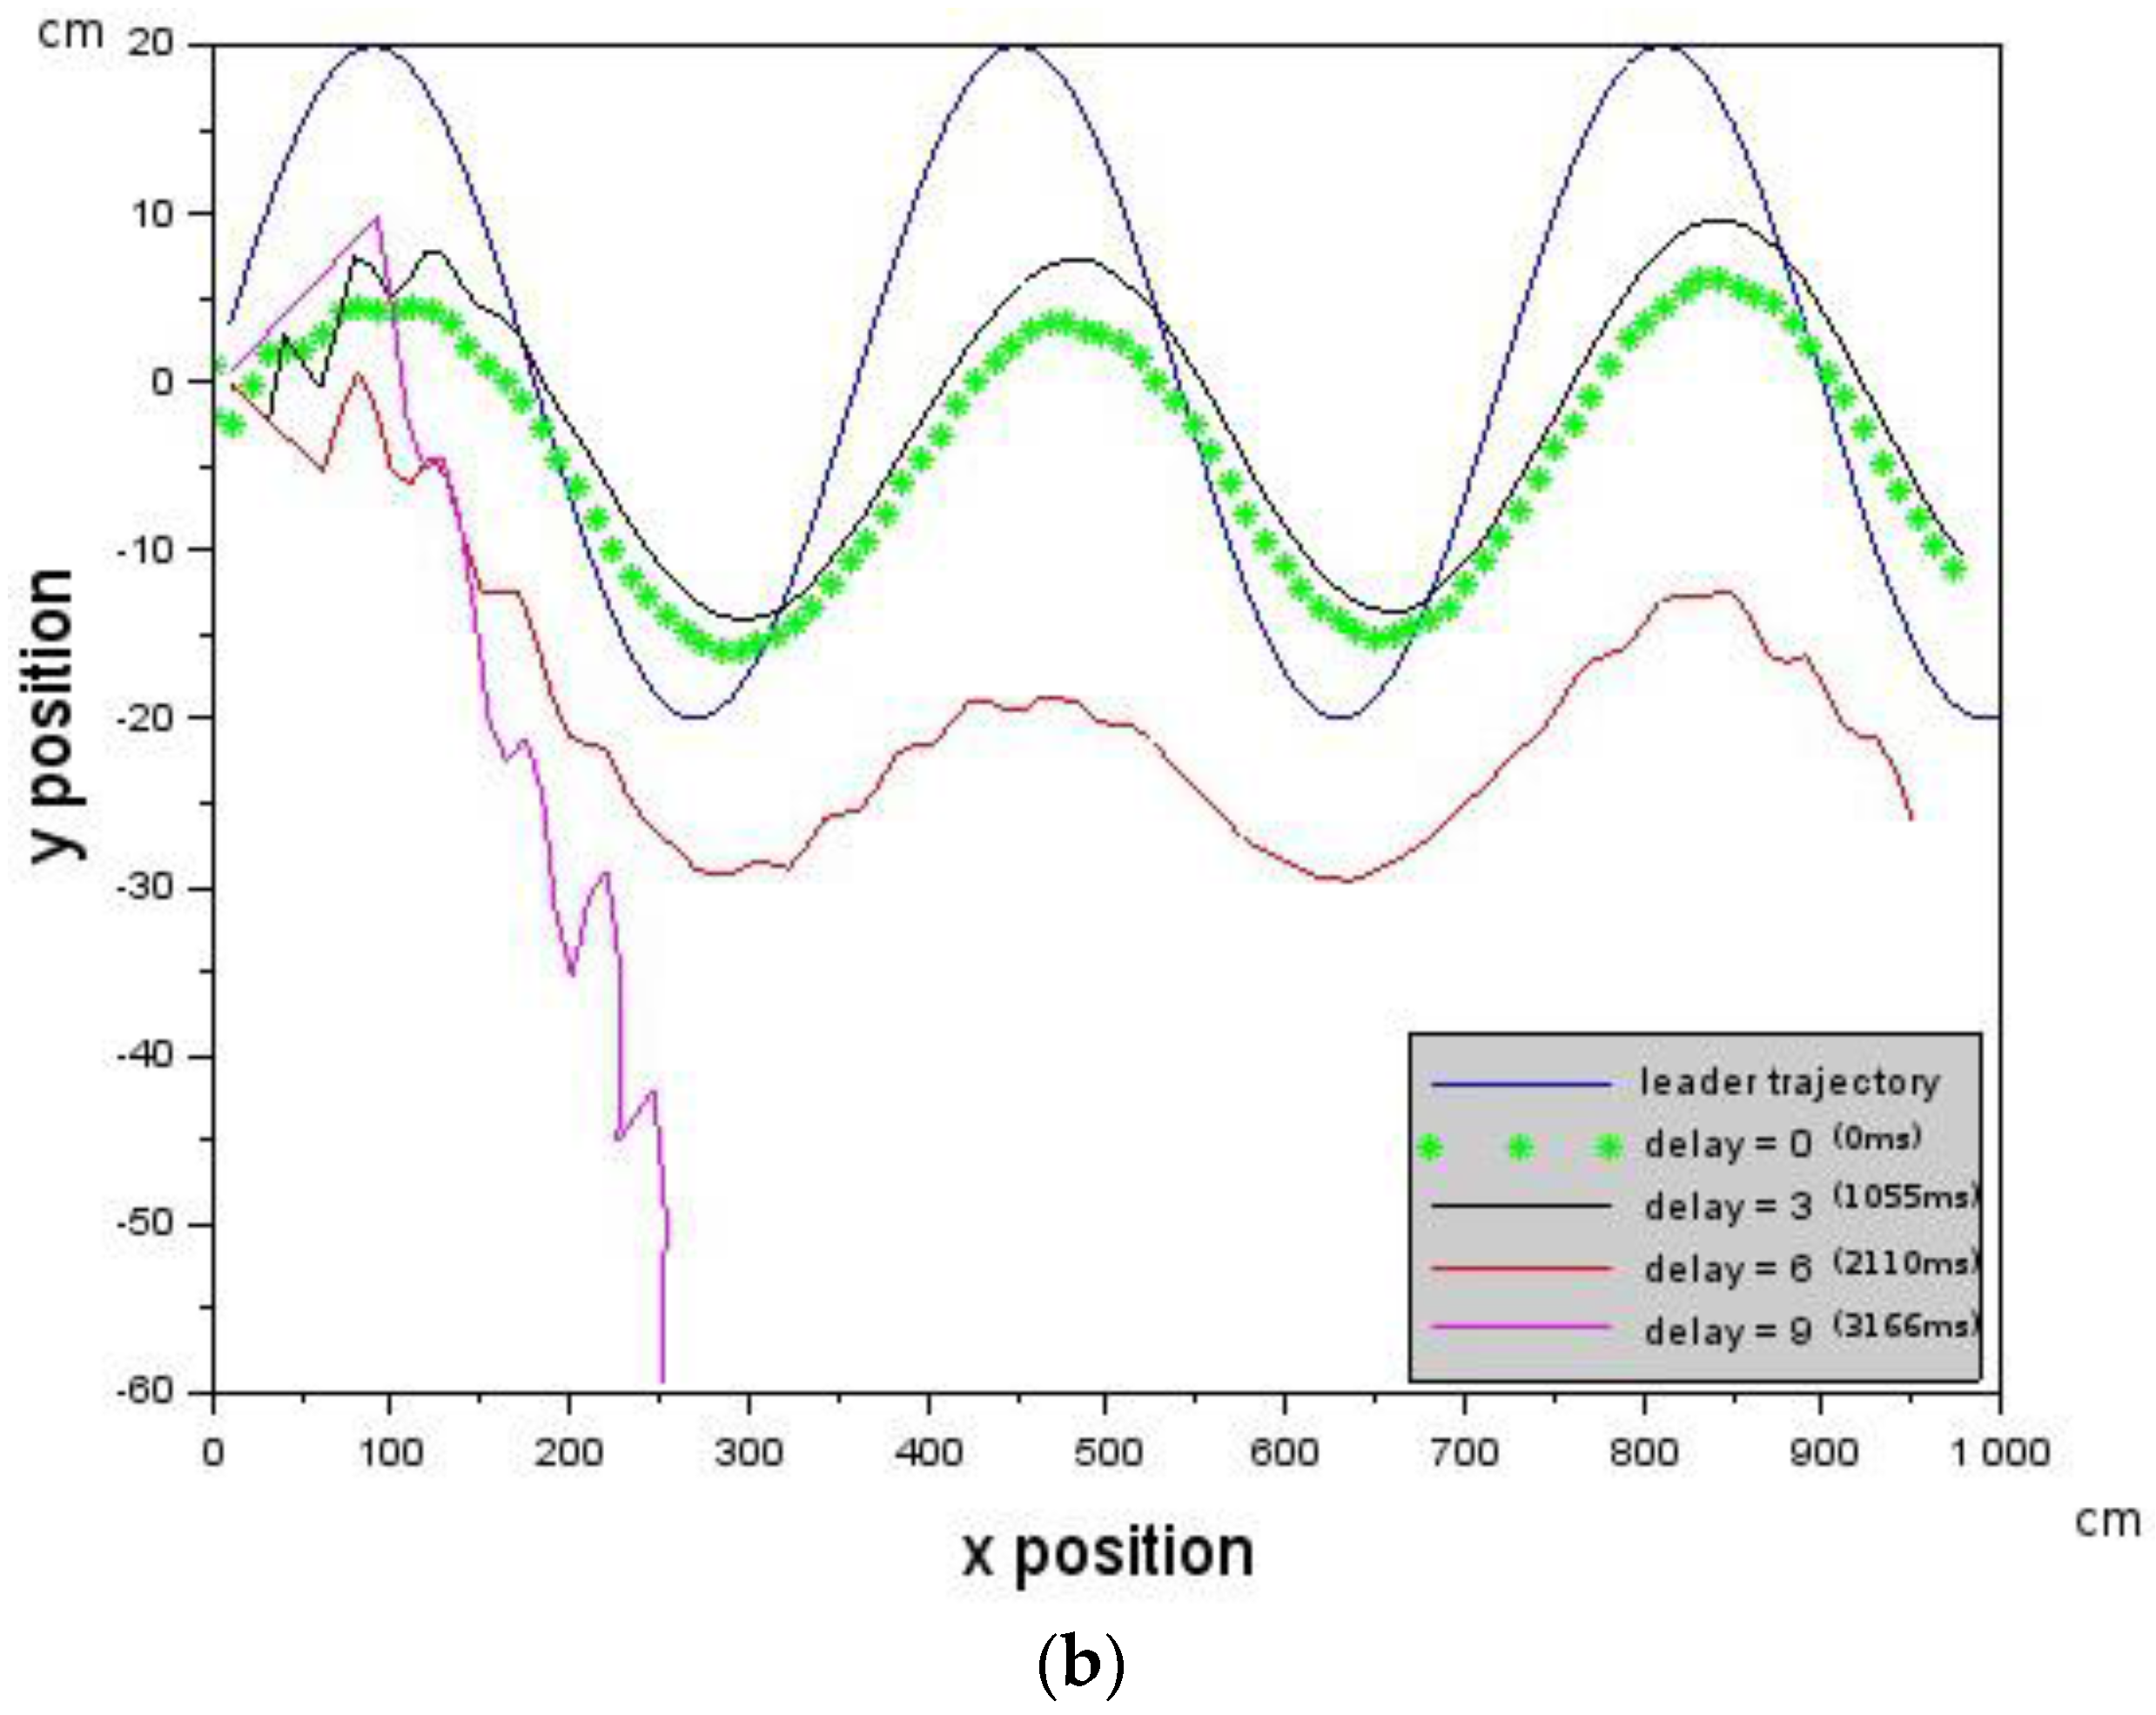
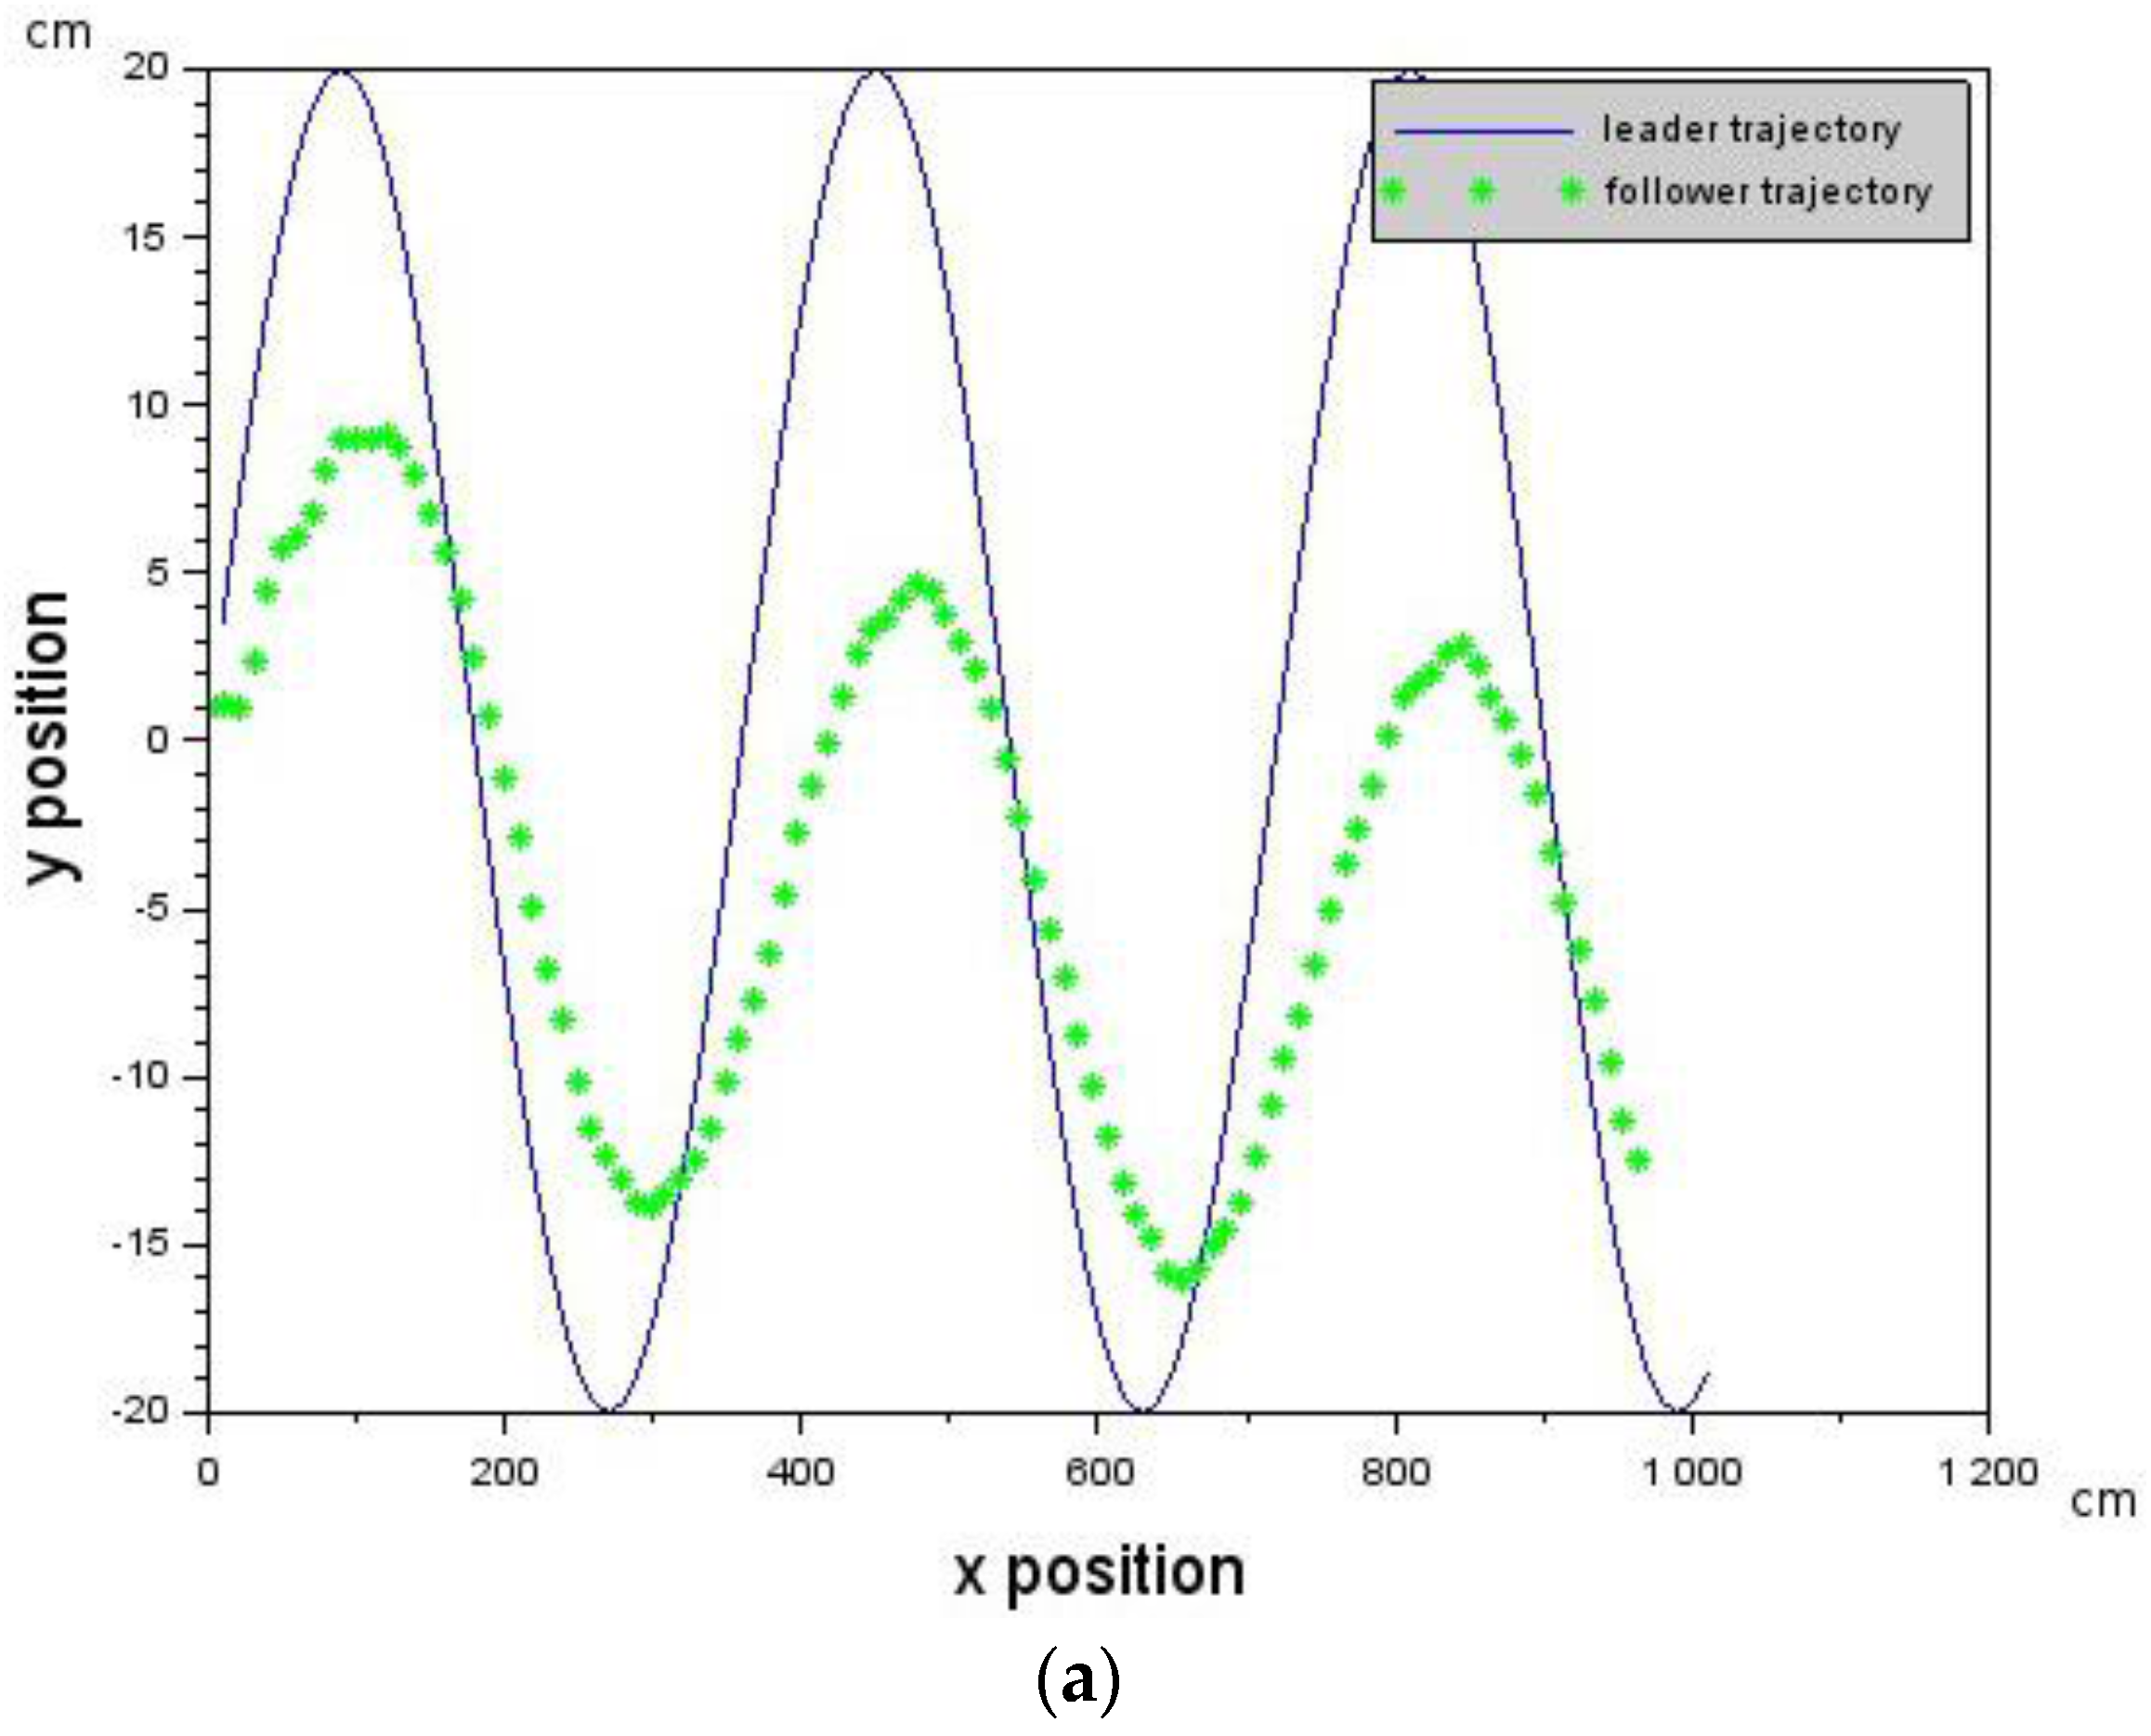
is given by Equation (6) where is the velocity value of the Leader, is the velocity of the Follower which can be controlled and is assumed to be the delay in the Follower. Provided that the delay is below a critical value that does not violate the constraint in Equation (5), then Leader-Follower formation flying will take place. is a scaling constant.
4. Developing the Delay Robust Leader-Follower Formation Flying Controller
In this section, we discuss the platform and setup used for Leader-Follower formation flying, the derived biologically-inspired architecture, as well as the linear controller developed in order to meet the constraint identified in Equation (5).
4.1. The Micro-UAV Platform
The micro-UAV platform used in this work has four rotors. By adjusting their thrust, it is possible to achieve the position vector control (
x,
y,
z) of the platform in the inertial reference frame according to Equation (7) [
5,
21,
22]:
where
is the force generated by motor
i,
is the roll,
is the pitch, and
is the yaw. The values for roll, pitch, and yaw were obtained from the gyroscope on board the platform. The unmanned aerial vehicle platform also has an ultrasonic sensor for altitude measurements.
It is equipped with two monocular cameras, one forward facing and the other downward facing. As a result of the single forward facing camera, only monocular vision could be achieved. Images obtained from the front facing camera had a resolution of 320 × 240 pixels and a field of view of 73.5 × 58.5. The images from the downward facing camera had a resolution of 176 × 144 with a field of view of 47.5 × 36.5.
Due to the platform’s frontal monocular vision, a bio-inspired lateral visual system was investigated. This was developed in software using Java and the OpenCV 2.3.1 library. The software was developed on a laptop tethered via WiFi to the platform. The laptop was running windows 7 on a dual core processor with 3 Gb of RAM. Each platform used in our experiments had its own tethered laptop. The images and data from the onboard sensors were streamed via WiFi to the laptop.
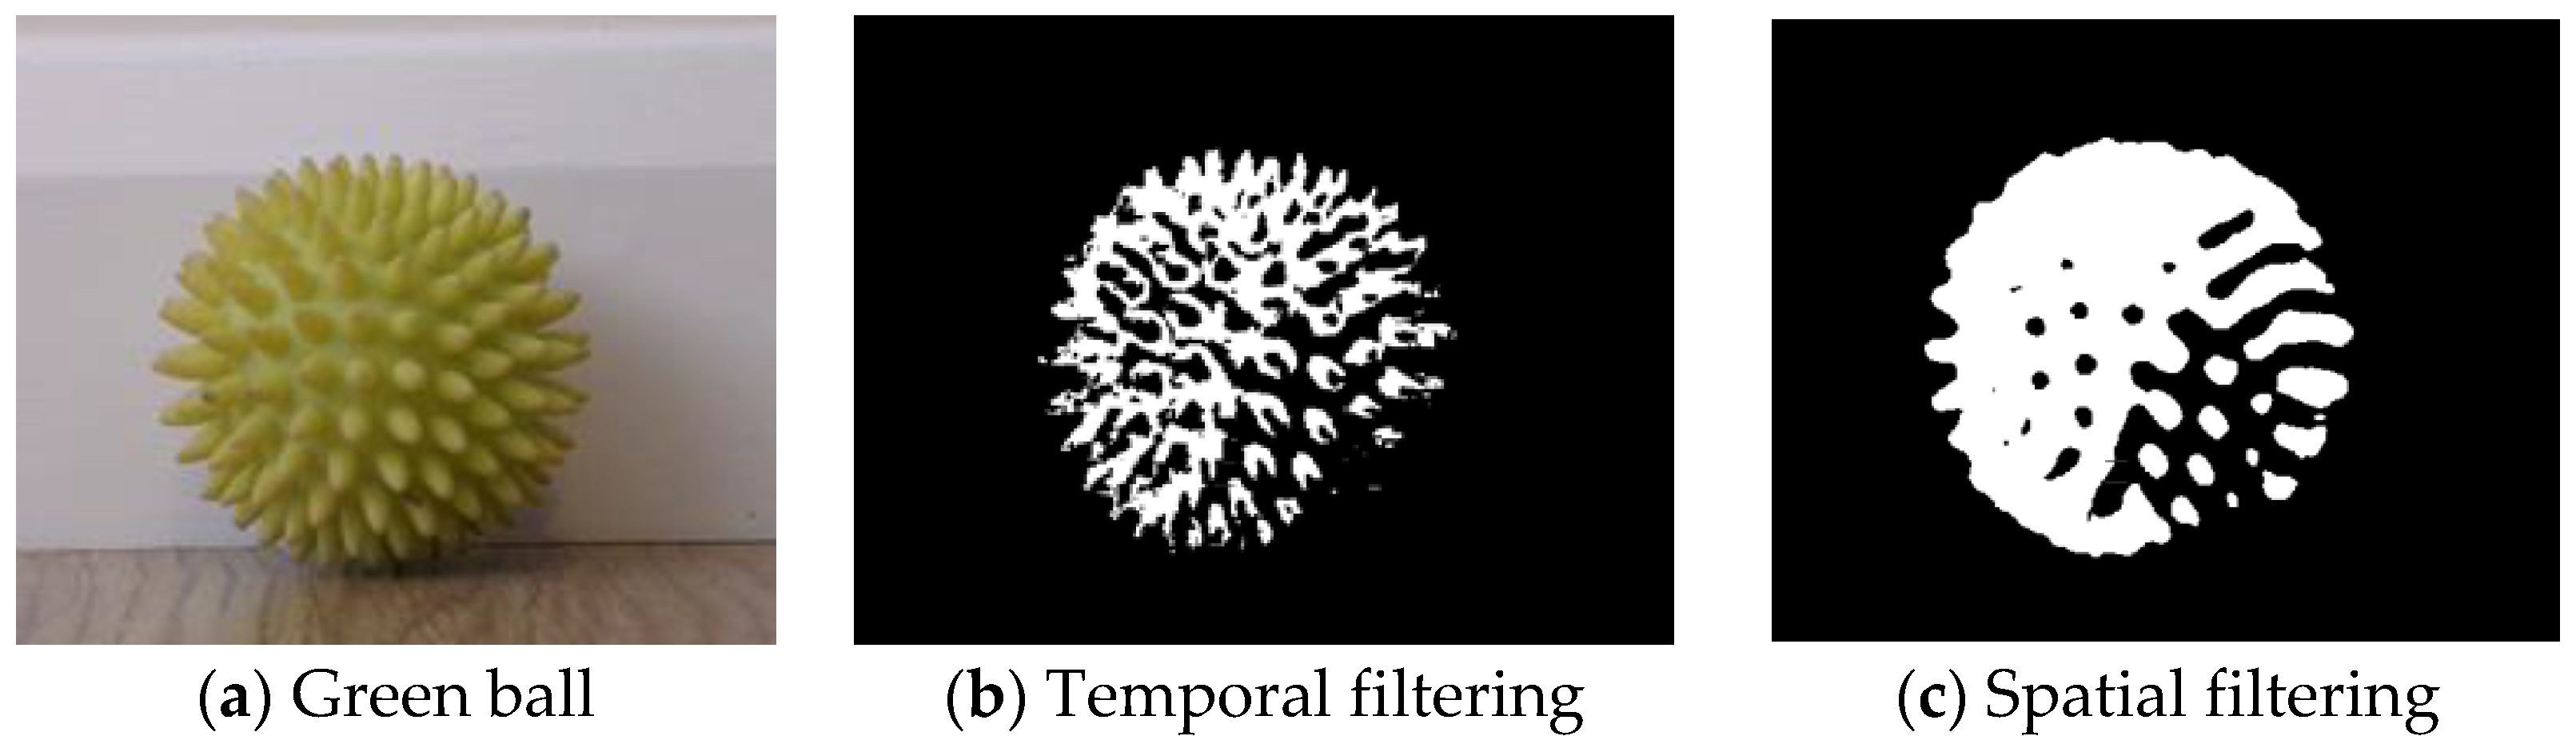
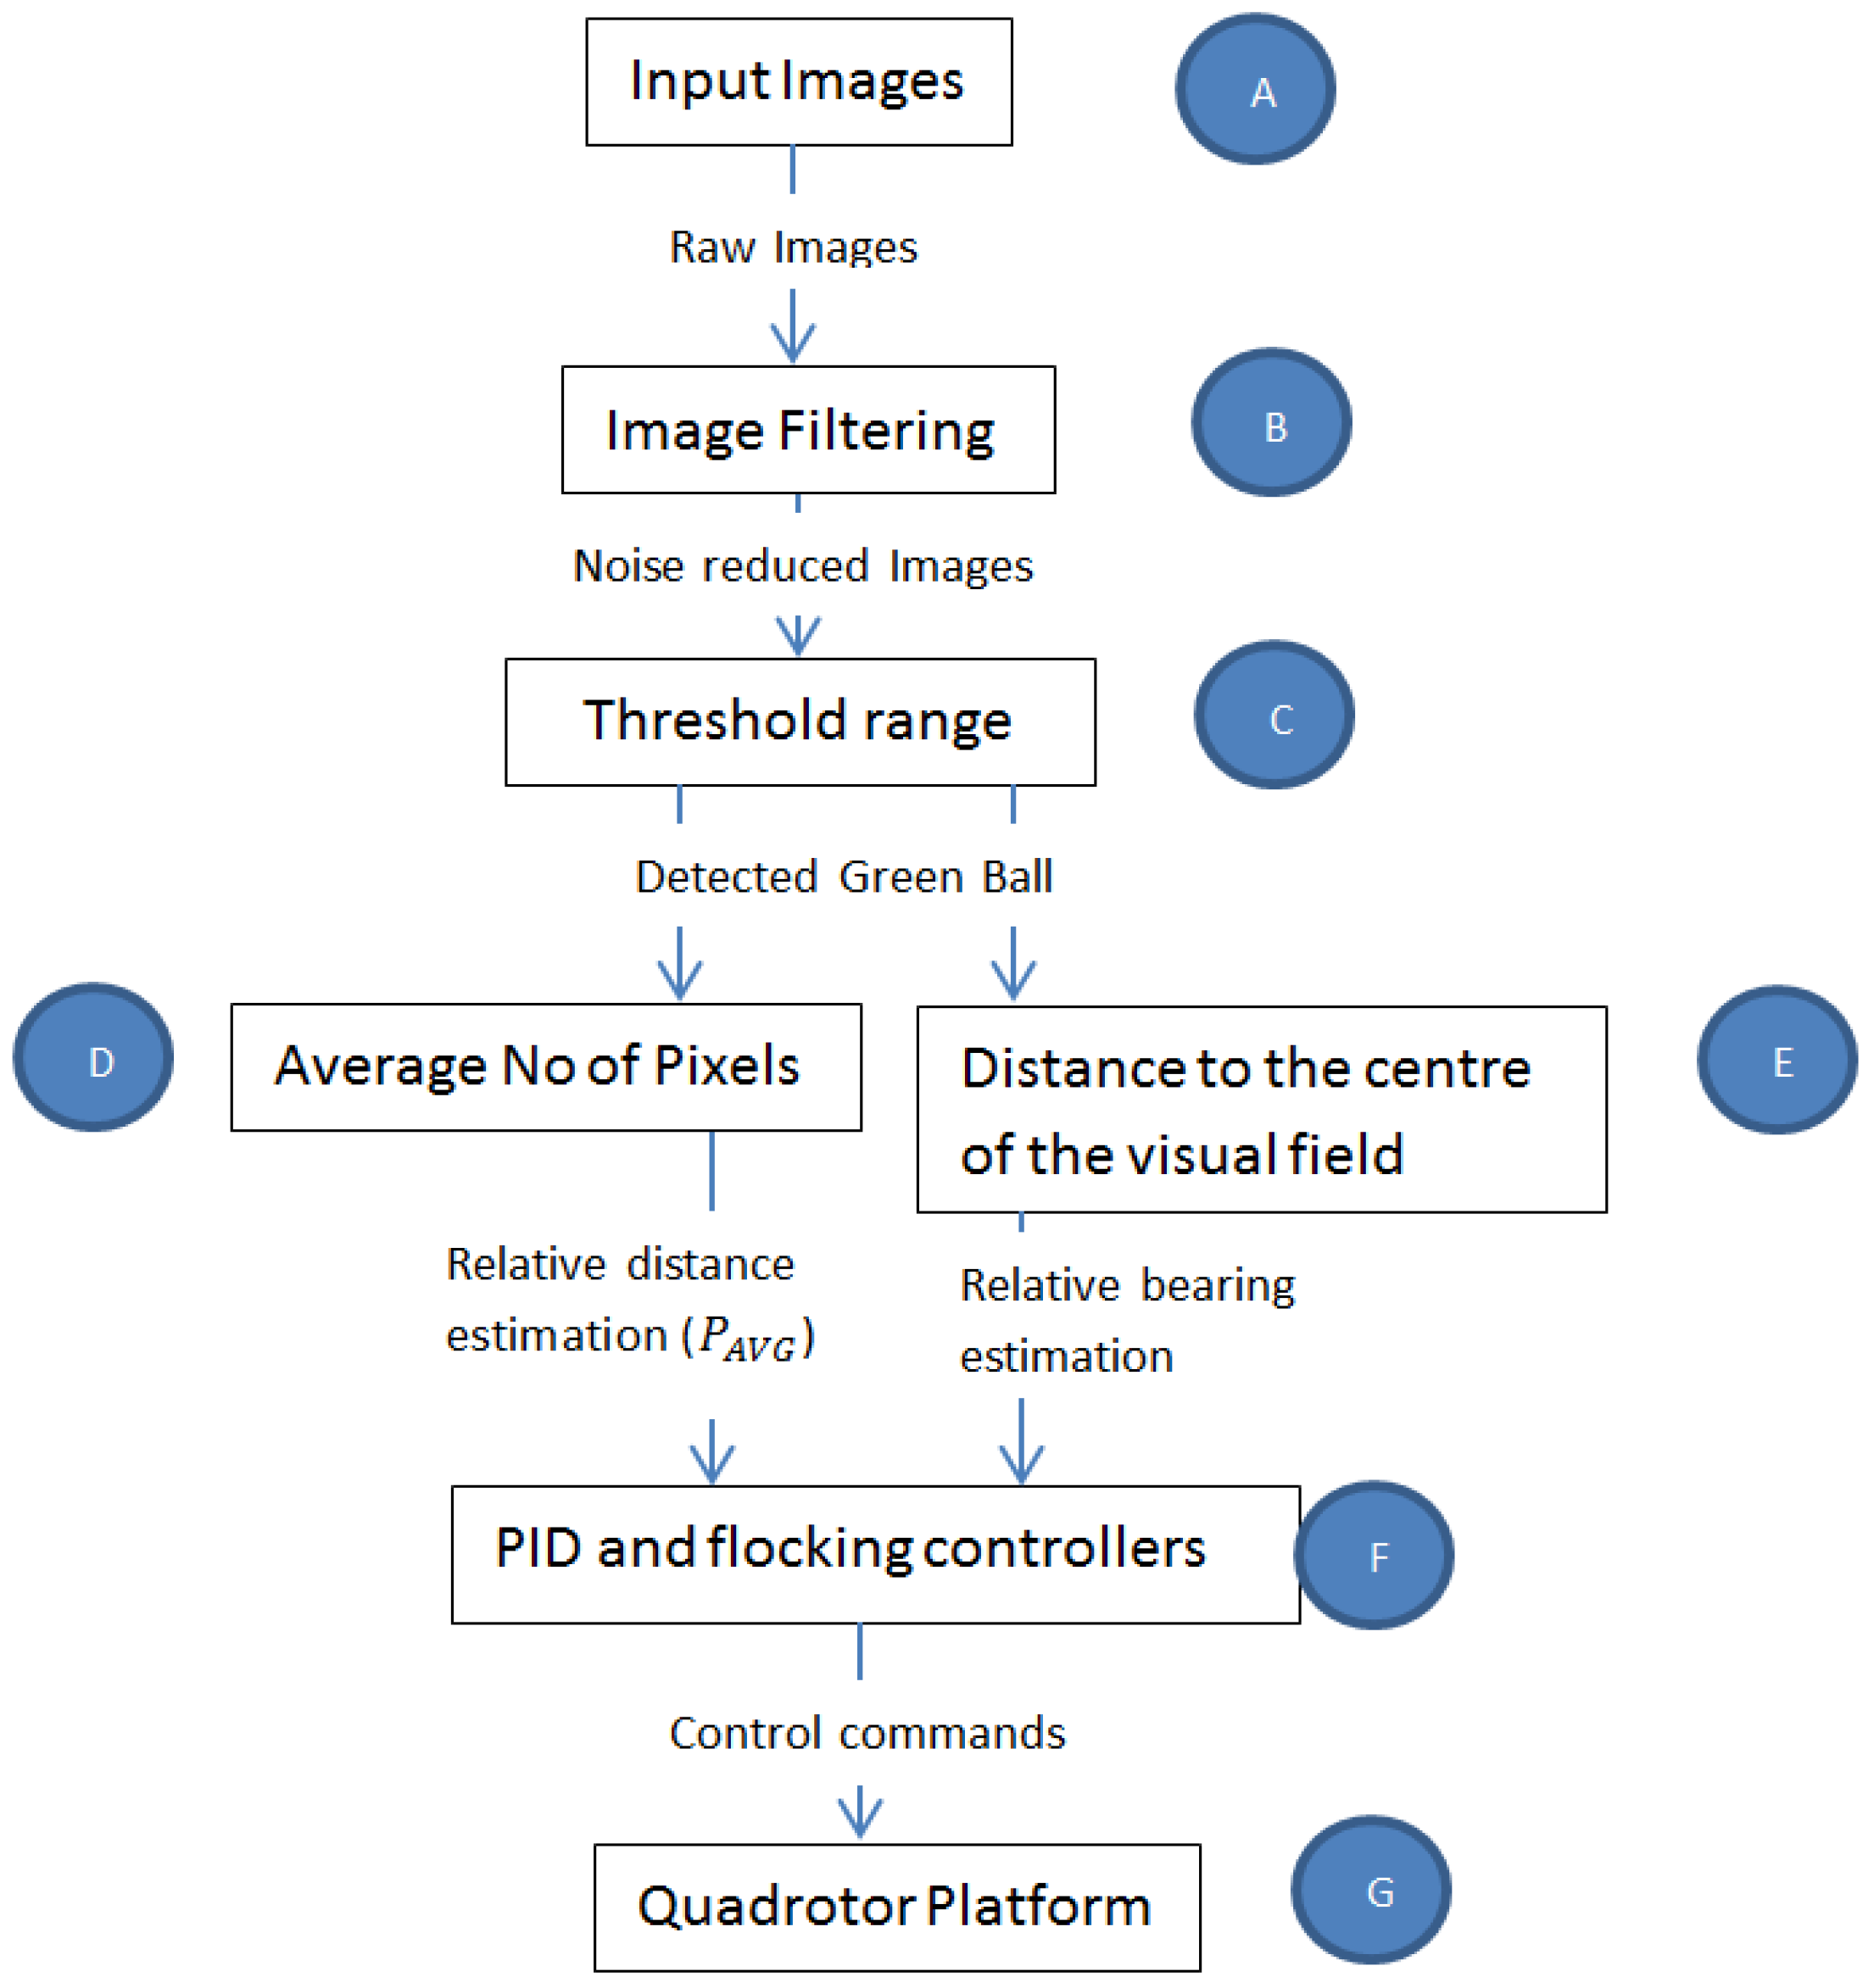
4.2. Bio-Inspired Visual Processing and Object Detection (Figure 3B,C))
Detecting flockmates is the first necessary step in flocking, as this would be used to determine the estimated time to collision, as well as other flocking parameters. The mechanism of object detection in biological systems is a non-trivial task and researchers are still in the process of decoding the neurological visual processes involved.
Nevertheless, in [
6,
7,
23], Baccus, Eizaburo, and Gollisch et al. respectively argue that computations necessary for detecting object motion, distance, texture, and light are carried out in higher vertebrates’ retinas before being passed to the brain for further processing. They argued that these functions are achieved by the photo-receptors using a combination of temporal filtering, threshold values and summing. Temporal filtering is used to filter out noise while thresholds are used to discard any signal value below a particular value. The filtered threshold values are then summed. Gollisch and Meister mentioned that it is essential that temporal filtering and the use of threshold is carried out before summing in order to avoid amplifying noise in each individual rod [
6].
Taking inspiration from [
6,
23], a visuomotor architecture as shown in
Figure 3 was developed. The term visuomotor is used here because it is often used in literature to describe how vision is transformed into motor actions. It was assumed that a pixel in the camera represented a biological rod and produced input images (
Figure 3A) to the rest of the vision-motion architecture.
Temporal filtering was achieved through Equation (8), where
and
are the processed image output at
t and
t – 1, respectively.
is the raw image input obtained at
Figure 3A at time
t with α being a gain value for choosing how much of
to include in
, where 0 < α < 1.
In order to benchmark the use of a temporal filtering technique as suggested by [
6,
23], a spatial filtering technique was also developed and compared with the temporal filtering technique. Spatial filtering of an image is often done in image processing to reduce noise. This, however, leads to a blurry image with a loss of some information [
24]. In this work, spatial filtering was achieved by convoluting an image with a Gaussian kernel where each pixel’s value
in an input image
is changed by the Gaussian function
G of the intensities of pixels in the neighborhood of
. Equation (9) shows how an input image
is convoluted with a Gaussian kernel, where
i runs from 1 to
Y −
m + 1 and
j runs from 1 to
X −
n + 1 for an image with
Y rows,
X columns and a kernel with
m rows,
n columns. Both filtering techniques were used interchangeably in
Figure 3B.
After the filtering stage, a threshold range (
Figure 3C) of
to
was used to achieve the detection of a unique object. The unique object of interest in this work was assumed to be a green ball. The ball was chosen to be a unique point on the Leader and was separated from surrounding imagery using
HSV (Hue, Saturation, Value) values to define a range between values of
to
as in Equation (10):
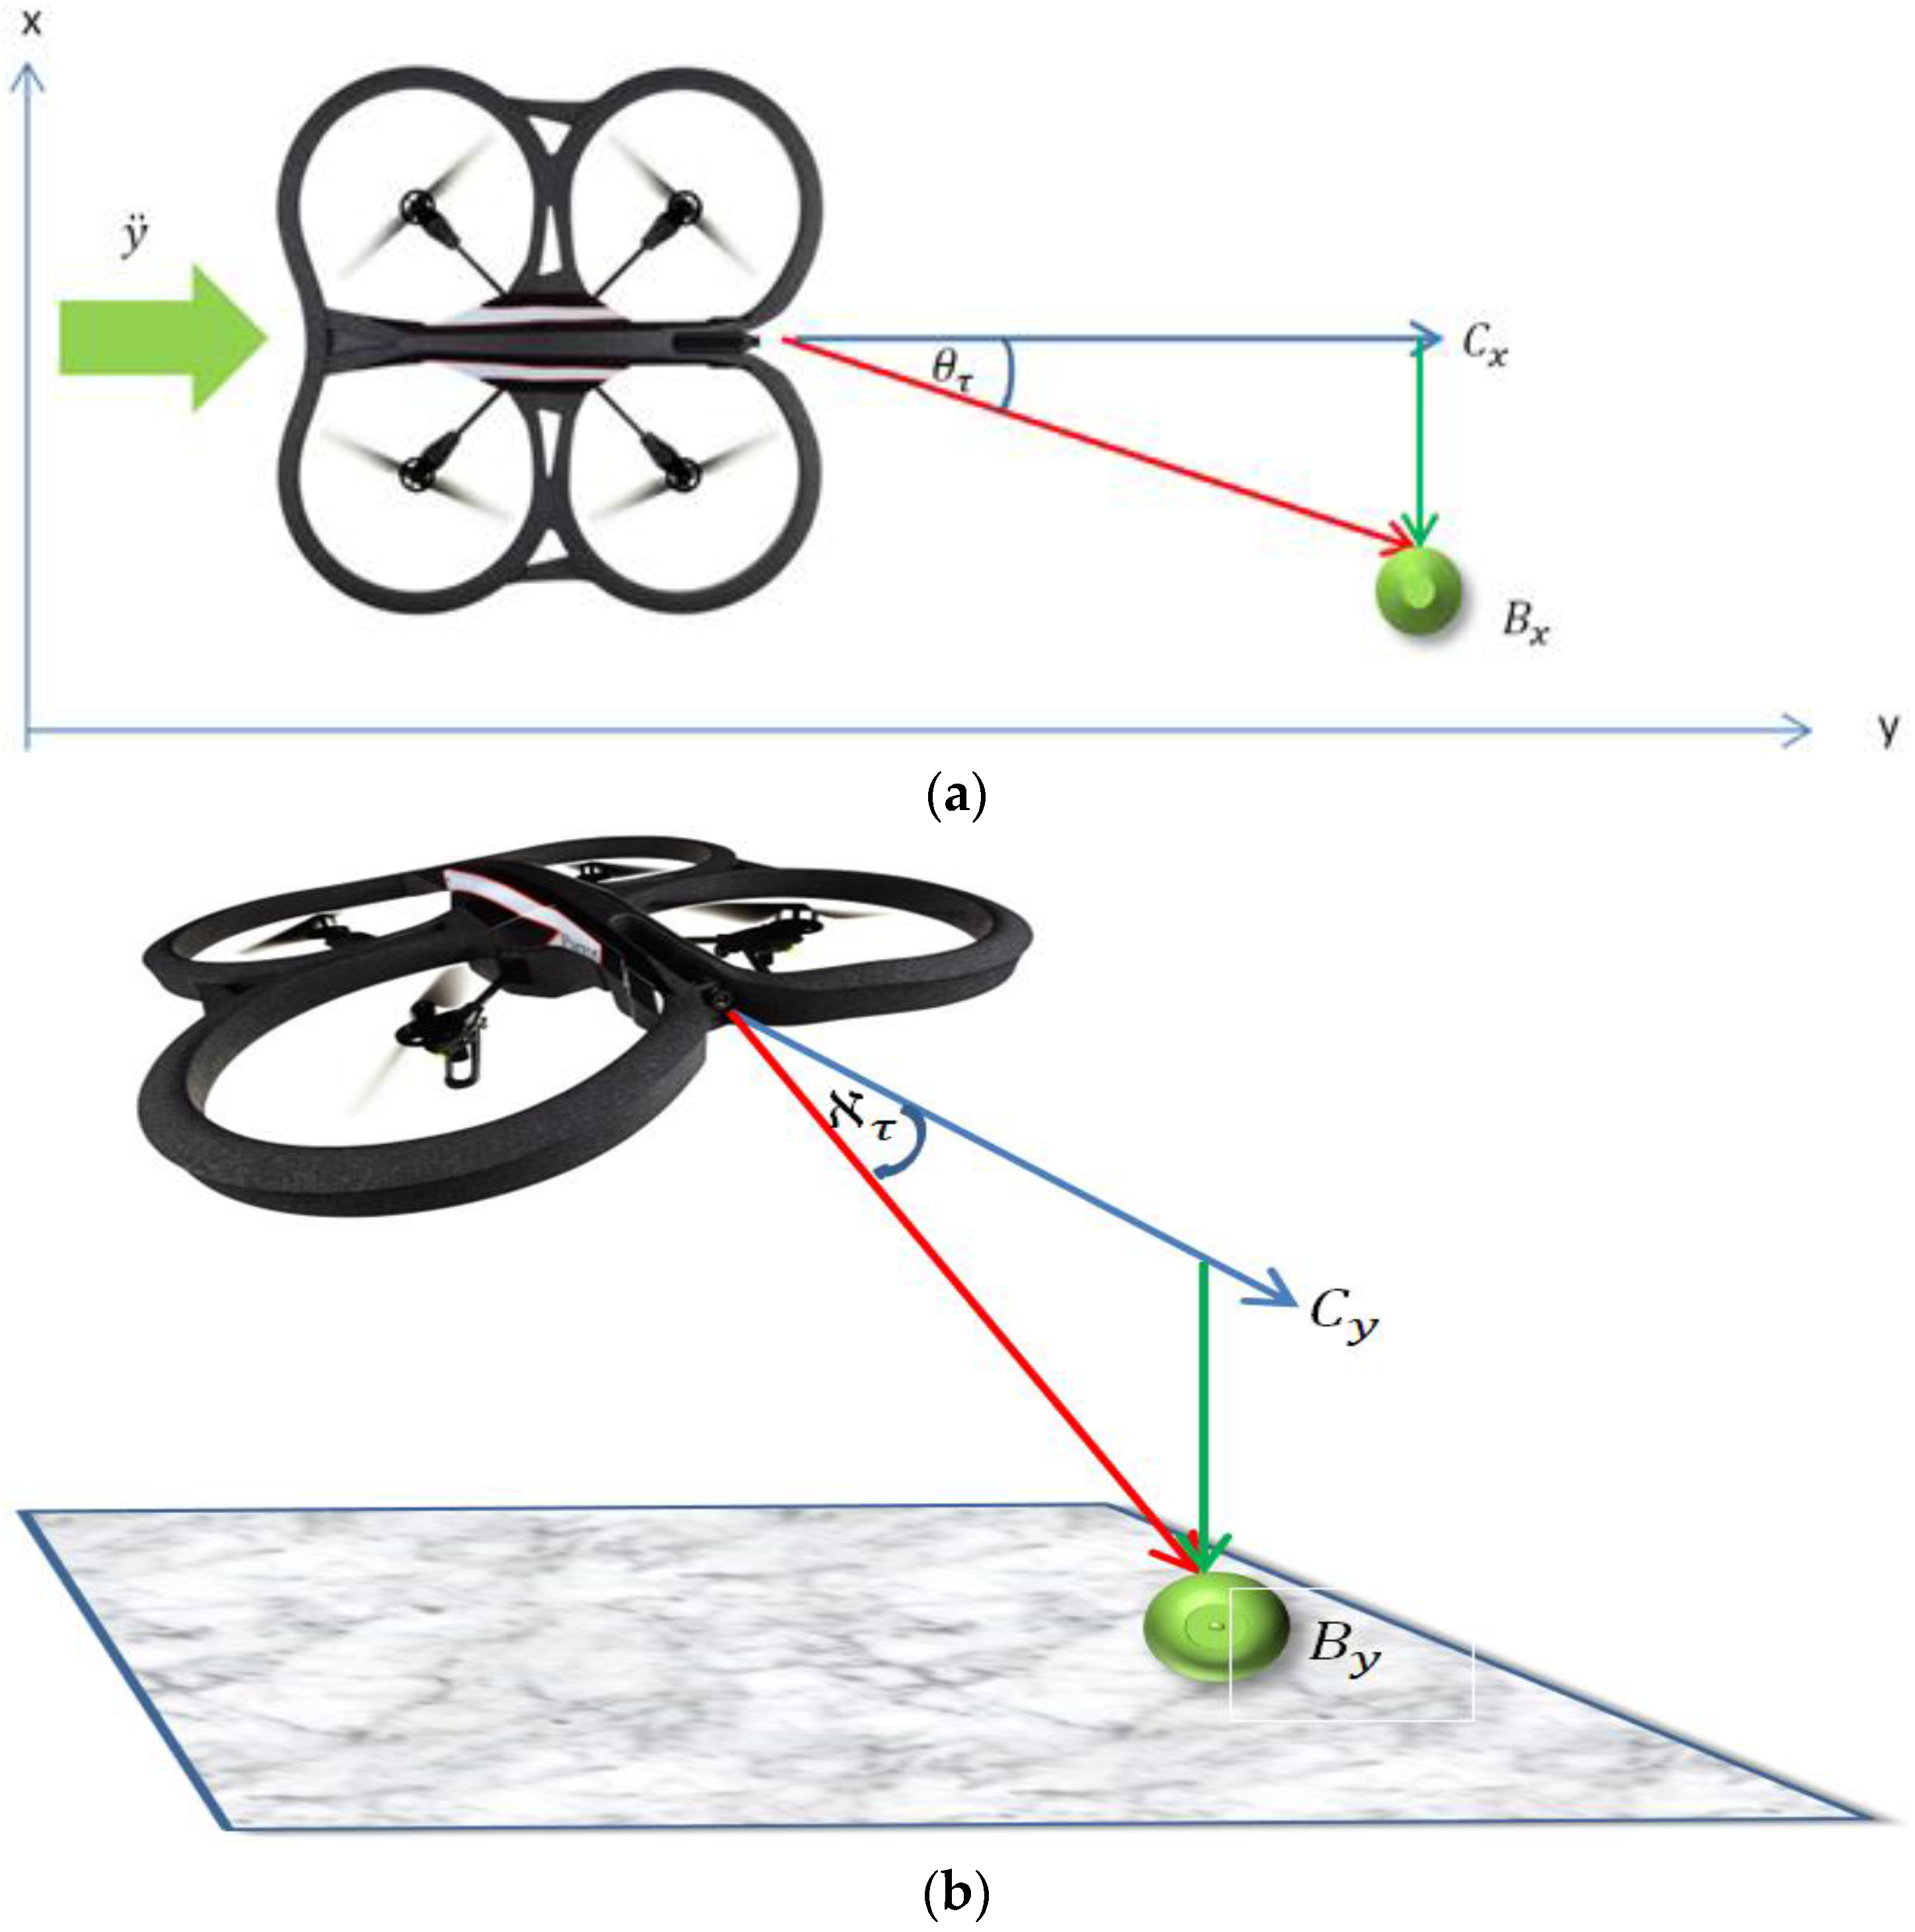
4.3. Relative Bearing Estimation and Tracking by the Follower (Figure 3E)
The relative bearing of the ball to the Follower micro-UAV’s attitude and altitude was estimated using the relative distance between the center point of the visual frame (
,
) and the position of the ball (
,
) on the visual field as shown in
Figure 4 and according to Equation (11). Where
and
are the relative yaw and pitch angles respectively. The constants
and
embed the spring constants connecting the Follower to the Leader in these axes as well as scaling the pixel values to the angle values. The values of the constants were empirically determined. Using Equation (11), the Follower can adjust its relative bearing to the Leader:
4.4. Relative Distance Estimation (Figure 3D)
Detecting the distance to another flock mate using monocular vision, can be achieved in a variety of ways including kinetic depth perception and relative size. In kinetic depth perception, the motion of the flockmate is used to estimate distance. A flock mate receding into distance gets smaller, and vice versa. In the relative size method, the perceived size of a flockmate in relation to others is used. If the flockmate gets larger in comparison to other flockmates, then it means that it is closer, and vice versa.
In this work, the relative size approach was used. The image patch taken up by the green ball in the photoreceptors of the camera was used to encode the relative distance of the Follower to the Leader. In software, this was achieved through the use of the average of pixel intensity values on the visual field as shown in Equation (12):
The average value
was used instead of the direct sum of pixel values as suggested in [
20] because the value of the sum is susceptible to noise.
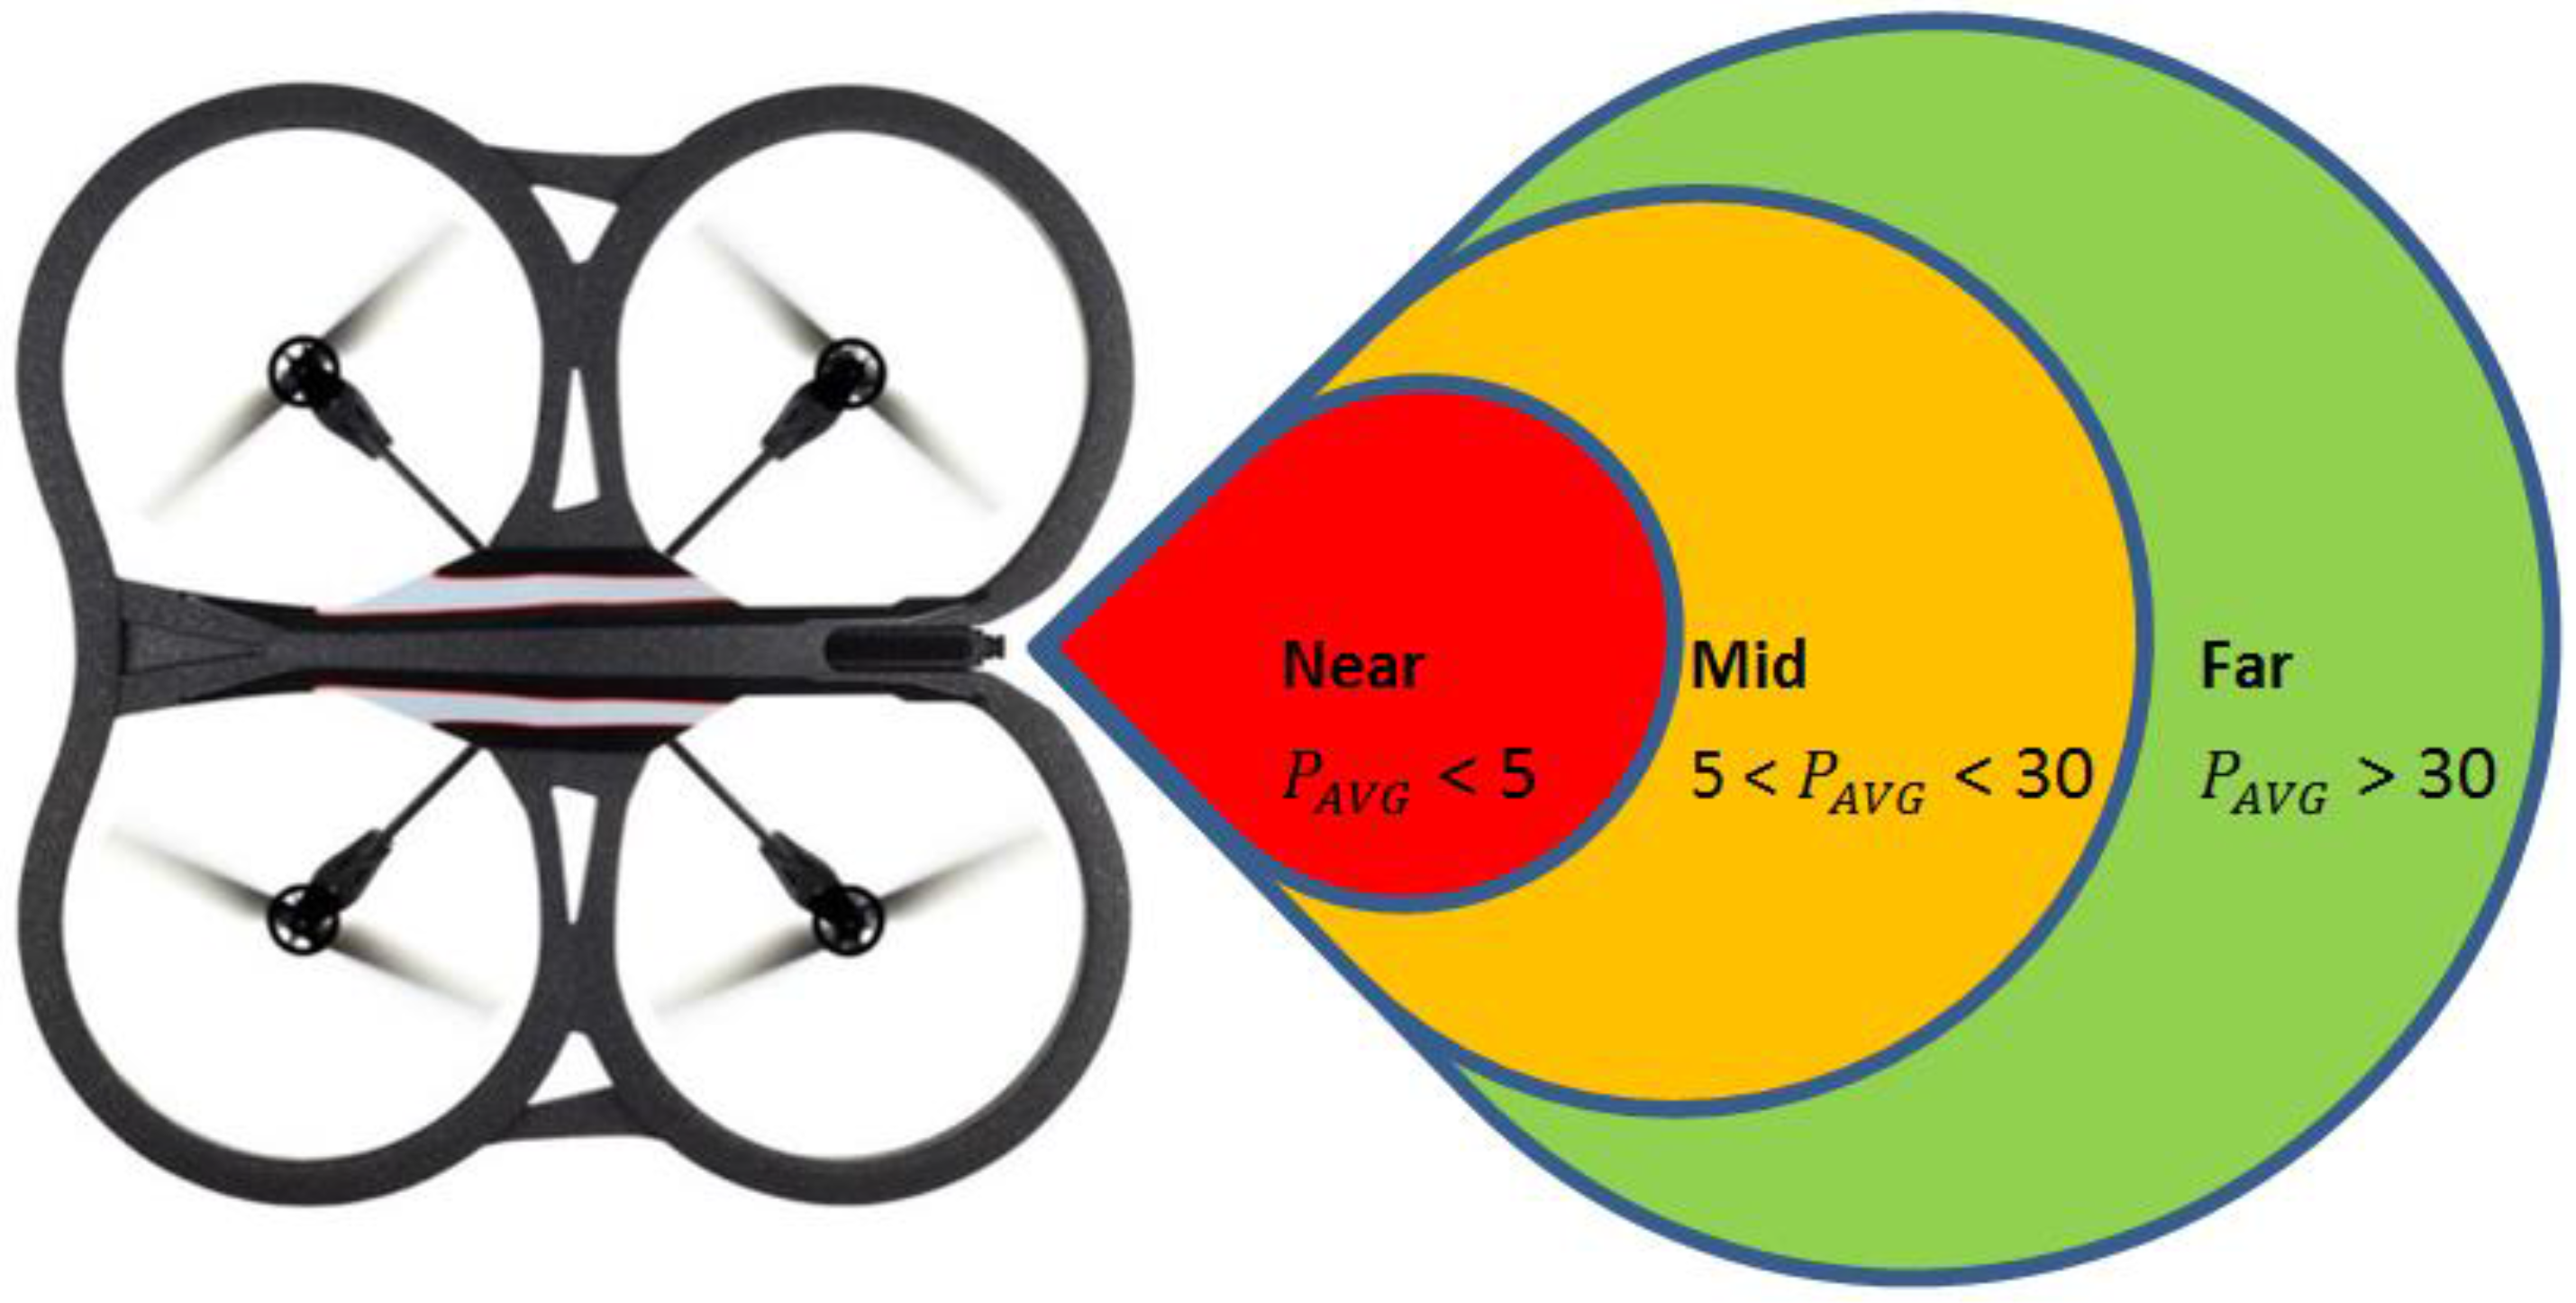
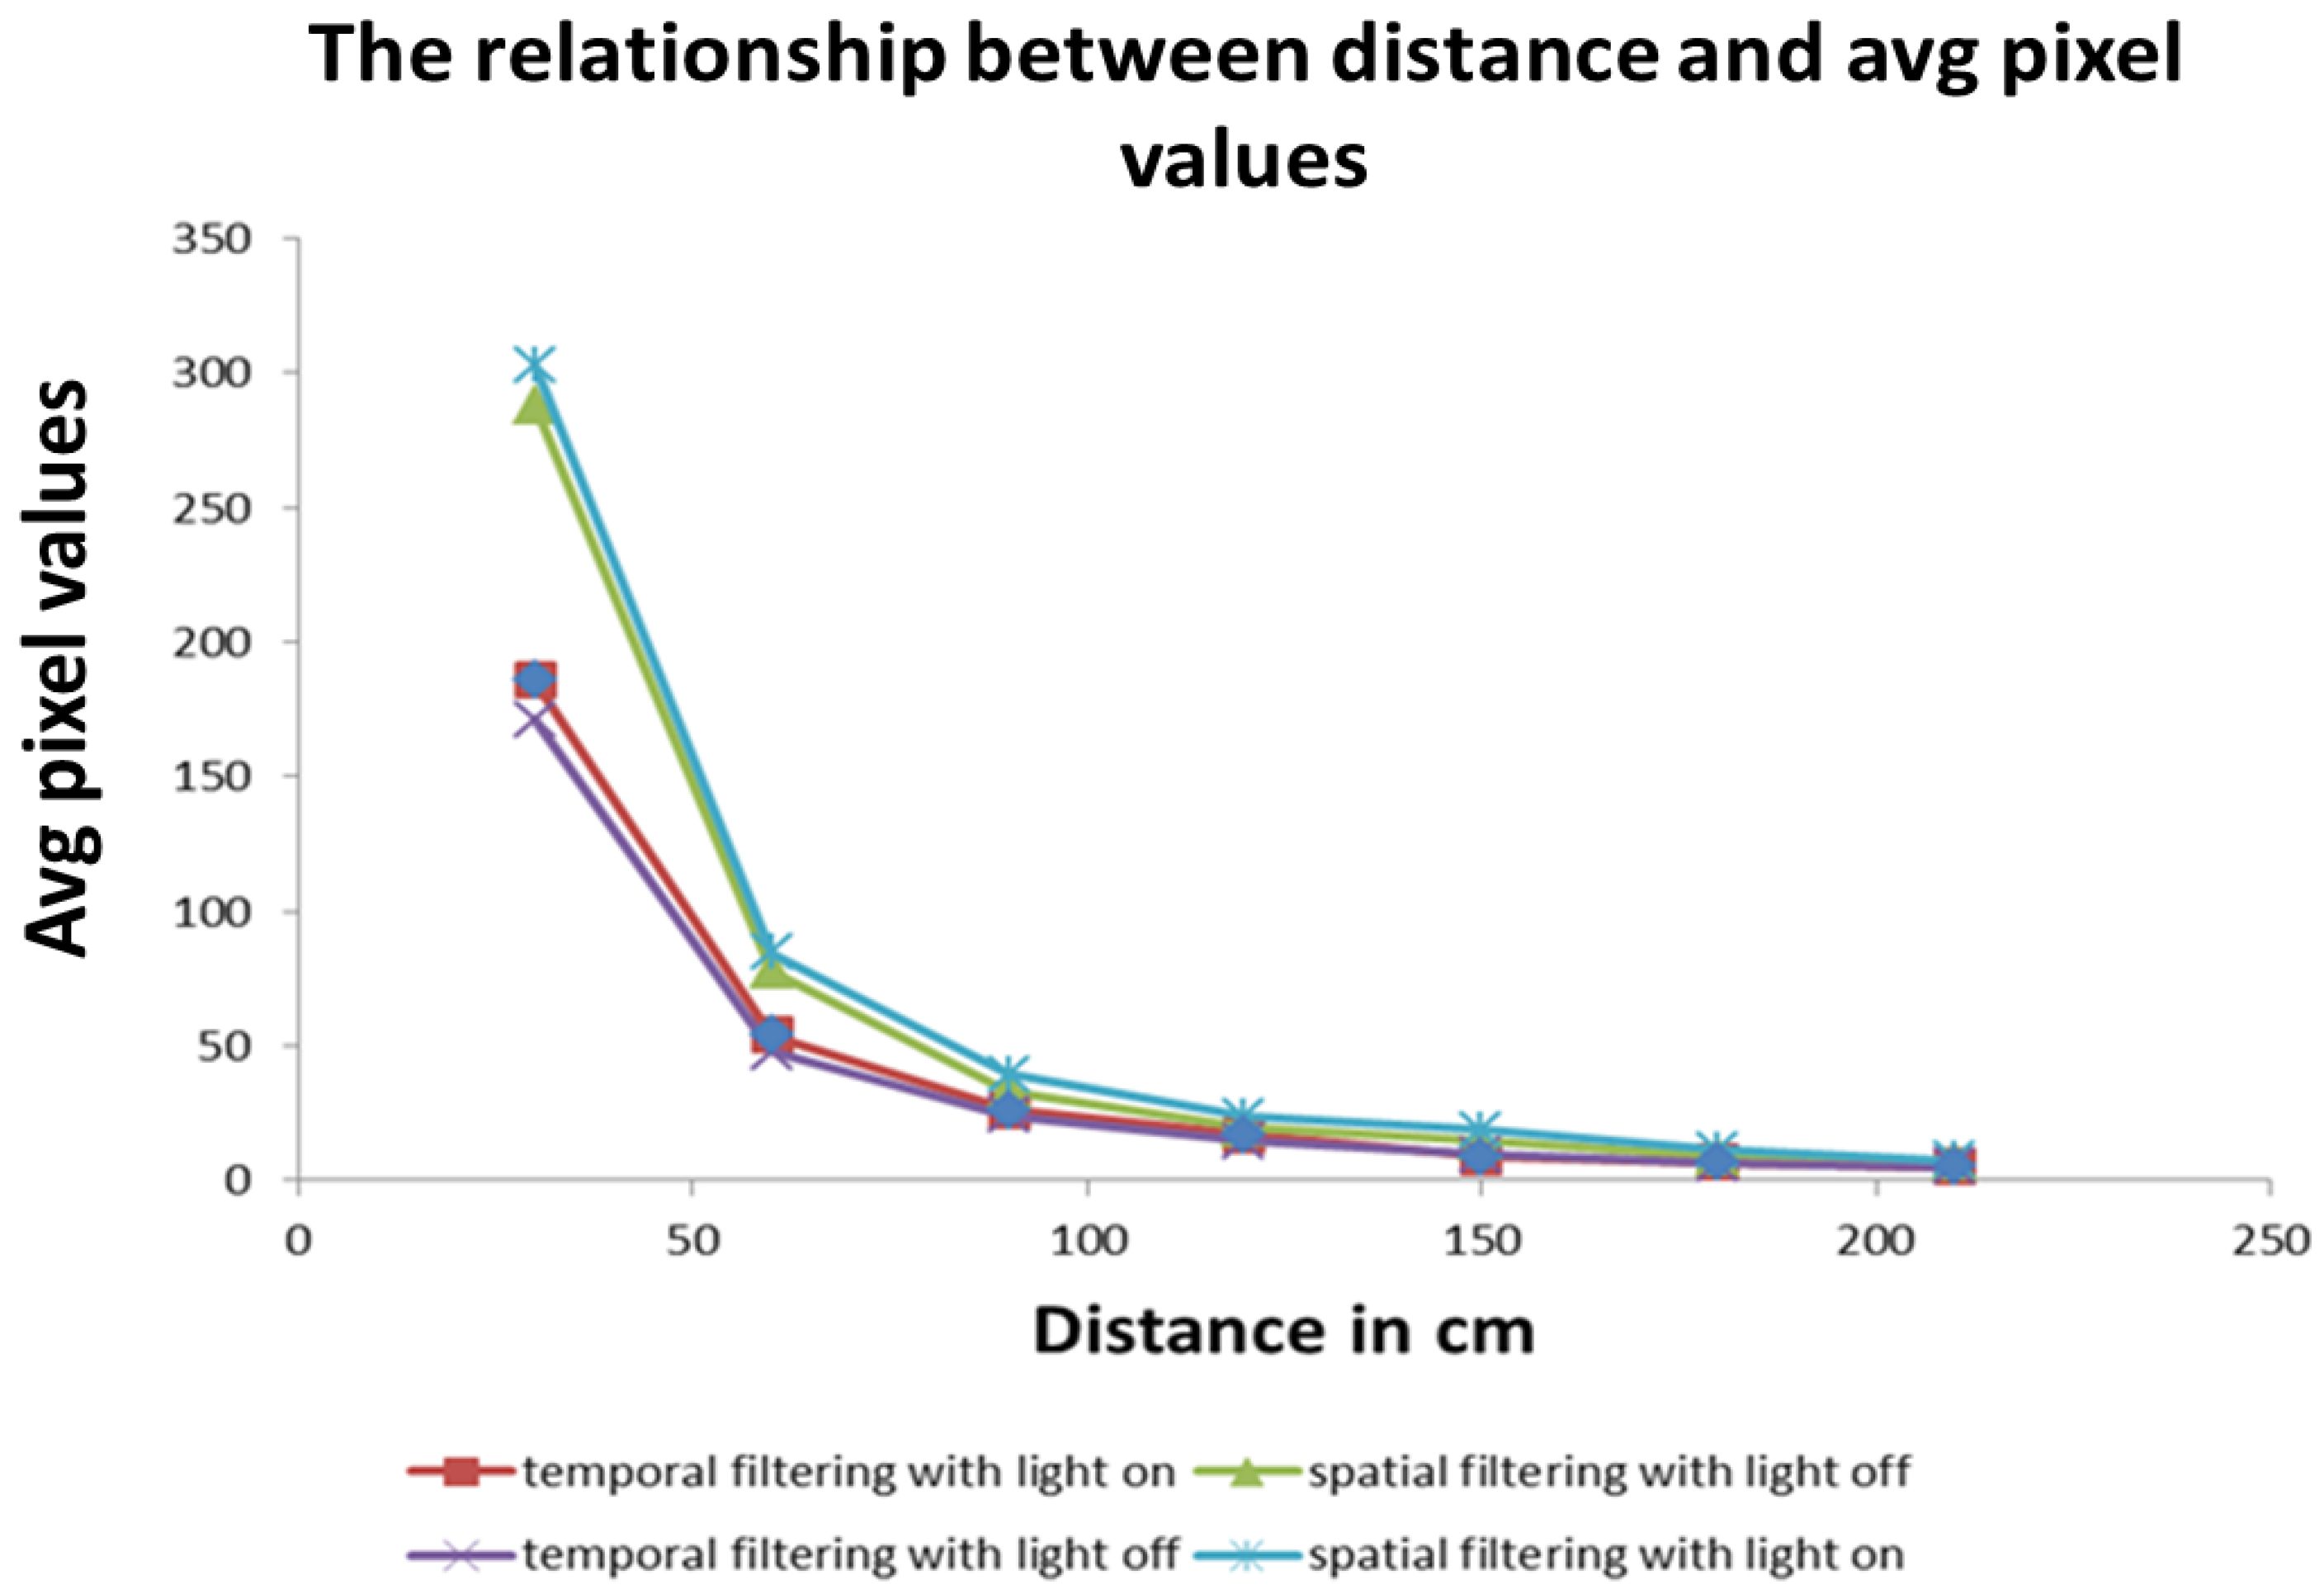
The
value obtained is used to empirically determine the relationship between the relative distance from the green ball on the Leader and the zones as described in Equation (13) and shown in
Figure 5.
In the experiments conducted, the far zone corresponded to distances above 1000 mm, the mid-zone corresponded to distances between 300 mm and 1000 mm and the near zone was less than 300 mm. The values of , , , and distance were passed to the low-level controller, which will be discussed next.
4.5. Closed-Loop Control of the Micro-UAV Platform (Figure 3F)
Fifty hertz closed-loop low-level controllers were developed on a tethered laptop for the real time control of the unmanned aerial vehicle’s attitude (That is its roll
, pitch
, yaw
) and altitude
. The controllers were written in Java programming language. Movement on the
x-axis was achieved by adjusting the roll
value, while adjusting the pitch
value would result in movement in the
y-axis (
Figure 4a). The yaw
value is used to control the direction the platform is facing.
The attitude of the unmanned aerial vehicle platform during flight was obtained via the onboard gyroscope and accelerometer sensors on it, while the altitude was obtained via readings from the onboard ultrasonic sensor. Separate classical proportional-derivative controllers, whose gains were obtained through experimental trial and error, were used for the altitude, as well as the roll and pitch axes. A proportional controller was used for the yaw controller.
During the take-off states and hover states, the values: (
,
,
) = (0
, 0
, 0
) were used for the attitude of the micro-UAV platform as well as a desired altitude of
= 500 mm. For the tracking state, the relative bearing of the Leader (
,
) in respect to the Follower was obtained as discussed in
Section 4.3 and passed to the respective controllers according to Equations (14)–(17) where
is given by Equation 18 and embeds the velocities according to Equation (4):
The constants and are all proportional and derivative gains for the respective controllers obtained via the classical PID tuning approach. Equation (17) causes the Follower to follow the Leader in the y-axis at a velocity govern by the system of equations in Equation (7) and provides repulsion when the Leader is too close, or attraction when the Leader is far away, according to Equation (18), where corresponds to the spring constant and was empirically determined. The bearing of the Follower is controlled via Equation (15) and the altitude by Equation (14). The platform was commanded to maintain a roll value of via Equation (16). The outputs of the respective controllers are directly proportional to the forces required to change the altitude, , and attitude ( of the Follower to maintain formation with the Leader.
7. Discussion
In this section, we discuss how our approach and results are relevant to biology (
Section 7.1 and
Section 7.2) and how the concepts as well as lessons learnt can be applied to robotics (
Section 7.3).
7.1. Using Fixed Action Pattern Sequence for Leader-Follower Formation Flying
In this work, we started out by taking inspiration from the visual pathways of higher level vertebrates (mammals and primates). Their visual pathway for feature detection and the beginning of an appropriate response (such as eye saccade movements) occurs in, or very close to, the retinal circuits. In contrast, this function takes place in the midbrain of lower vertebrates, such as fish, birds, and amphibians. The visual pathways of fish, birds, and amphibians bear striking similarities in the way they are structured. This could be because they all share the same evolutionary origin. In all of these organisms the optic tectum forms the midbrain and sits in between the forebrain and cerebellum. Prey, predator, flockmate, and other detectors are found in the optic tectum in fish, birds, and toads, and also initiates or triggers the required response needed for the feature detected [
30,
31,
32]. The trigger is passed to the deeper layers of the tectum responsible for motor functions in order to guide eye and body movement to salient environmental stimuli without the need for cortical processing [
30]. Eventually, these neural signals enter the cerebellum, which seems to activate the limbs necessary to carry out the responses. Elman suggested that the detection of a prey feature in toads invariably sets off a sequence of prey-catching events that are very predictable: (1) orienting towards prey; (2) stalking up to prey; (3) binocular fixation; (4) snapping; (5) swallowing; and (6) mouth-wiping with forelimb [
32]. The completion of each event in the sequence is used to trigger the next event in the sequence. This is called a Fixed Action Pattern sequence. The FAP sequence often involves very short to medium length sequence of actions triggered by a detected feature. The sequence is often hardwired into organisms as instinct and as such, they tend to carry out the sequence without variation when presented with the right trigger. In other words, they do not need to learn the stimulus-action sequence. In this work, the Fixed Action Pattern sequence needed to start the Leader-Follower formation flying is initiated at the visual detection of the ball.
In toads, the type of triggered FAP (flee or approach) depends on the configuration and size of the black shape. In measuring the size of the black shape, the toad uses angular size (i.e., the amount of degrees on the visual angle) and absolute size (i.e., the distance between the toad and the object) [
32]. We used a similar technique in this work with the detected size of the ball used to decide whether to move closer, move away, or remain (Equation (13)). As toads, fish, and birds share similar brain structures, we hypothesize that similar Leader-Follower FAP sequence is initiated in starlings when a flockmate is detected.
7.2. Application of an Artificial Neural Network as Feature Detectors
The motivation to understand in the way organisms acquire and process signals from their environment, as well as convert those signals into actions, has resulted from the artificial neural network community. Artificial neural networks enable us to understand how organisms process signals, as well as develop algorithms that mimic their capabilities. The neural networks in organisms are a combination of arrangements which exhibit plasticity for learning from the environment and rigidity for encoding instinctive knowledge, such as Fixed Action Pattern sequences. The “rigid” or instinctive neural networks could also embed feature detectors that are subsequently used as triggers for FAP sequences.
In this work, spatial and temporal filtering were used to extract and detect a relevant visual feature from the environment. The values for the Gaussian kernels and
used were hardwired and ad hoc to our application and, as such, embed feature detectors that were used for triggering the Leader-Follower FAP sequence. From the perspective of artificial neural networks, a closer study of
Figure 3 and the spatial filtering scheme used in this work reveal that the scheme has a mathematical structure close to that of a feedforward convolutional neural network. The pixels from the visual field form the inputs to this network and the detected feature as an output. The use of a Gaussian kernel in Equation (9) results in a Gaussian weighted sharing scheme among the layer of hidden neurons.
Equations (11) and (13) could resemble the function of the deeper layers of the optic tectum towards decoding of the configuration of the green ball in order to get the relative bearing estimation, tracking and relative distance estimation as outputs. These outputs are then passed to the PID controllers.
Furthermore, a simple recurrent neural network with a unit delay
could be used to explain the temporal filtering scheme used in this work [
33]. The weights (
) of the network were such that |
w| < 1 in order to make the output signal exponentially convergent and the system stable. It also means that the system has an infinite memory capability.
However, temporal filtering (recurrent networks) could be seen as more expensive than spatial filtering (feedforward convolutional neural network) because it requires more memory, at least an extra memory element for image storage compared to spatial filtering. However, it results in more detail of an object being preserved and this is necessary for other object recognition tasks further up the visual circuitry.
In the experiments conducted, spatial filtering led to blurriness and the loss of the intricate details of an object being observed. Nevertheless, the result is sufficient for detecting an object’s presence in the environment. For example, even though blurry vision results in loss of information, it is sufficient to trigger an escape behavior in frogs when a rapidly approaching object is detected in the visual field [
34,
35]. A similar technique is used in jumping spiders to detect prey and mates [
36]. It is possible that the evolutionary mechanism favored this minimal cost approach, thereby resulting in the organisms’ survival over millions of years. Furthermore, as identified in our experiments, it should be noted that the object detection range of spatial filtering is higher than that of the temporal filtering.
As a result of the above, we hypothesize that during high speed flocking in starlings, for example, the minimal cost spatial filtering might be used for the following reasons: (1) to reduce sensory and biological computation overload as well as maintain flock cohesion; (2) the spatial filtering technique has the capability to observe an object’s presence at greater distances than the temporal filtering technique; (3) in starlings, flocking takes place at dusk in low light conditions where object recognition might be reduced. In this situation, the object’s presence detection might be more appropriate than object recognition. Nevertheless, we also hypothesize that it is possible that both circuits are present in the optic tectum with each providing support to the other circuitry. The level of provided support could be dependent on the task being performed at the time and the amount of visual representation required for surviving in a particular vertebrate’s environment [
37].
7.3. Application to Robotics
In robotics, hidden Markov models could be used to represent FAPs. The developed FAP could be inspired by a biological organism or dependent on the application. The triggers of the FAP could be a feature detector that is extracted from vision, sound, touch, or other types of signals. In designing the feature detector, neural networks could be used. The weights of these neural networks could be obtained through manual tweaking (i.e., embedding prior knowledge of the environment into the network) or automated training. However, it should be noted that, if performing automated training, the quantity of free parameters needs to be controlled or it could lead to the need for a long training time.
The type of neural network to use really depends on the application, characteristics of the signal, and the environment from which the signal is being extracted. If the system could benefit from a memory of past measurements, than a recurrent neural network is perhaps a good choice. However, this should be used carefully due to the memory elements required by the network and the possibility of oscillations and instability due to feedback loops.
8. Conclusions
In this work, we have made use of visual information from an onboard camera on a micro-UAV to achieve Leader-Follower formation flying. Unlike other previous work, our approach did not make use of state estimation algorithms, GPS, or synchronized communication, and was validated with simulations, as well as actual physical experiments on micro-UAVs.
This was achieved through a minimal cost vision processing algorithm that was inspired by the structure of vertebrate retinas. We believe that understanding the retina’s structure could lead to better design of vision-based autonomous flocking algorithms. Towards this, we used a computational approach, that focuses on “tasks organisms must face and then explore the minimal mechanisms that extract signals of relevance to these tasks” [
20], to develop an architecture representative of the structure of a vertebrate’s retina using mechanisms discussed in [
6] (
Section 4.2). We then used the developed architecture to achieve Leader-Follower formation flying which is a subset of the vision-based flocking problem.
Using our approach, we were able to achieve a Leader-Follower formation flying that is potentially robust to delays caused by communication delays and visual sensor refresh rates. In past Leader-Follower formation flying experiments such as in [
15,
16], Kalman filtering or other estimation algorithms are often used to estimate the path of the Leader. However, in this work, we have shown that provided that the delays are below a critical value
, Leader-Follower formation flying is achievable using a zones scheme proposed in this work. This critical value
is constrained by the maximum visual distance observable by the Follower.
This observed constraint might shed a light on flocking formation maintenance in different lighting conditions and from a biological perspective, it could affect the structures of natural flocks. Furthermore, the results of this work could inform more robust and computationally minimal cost algorithms that can be used to develop vision-based high-speed autonomous flocking systems for GPS-denied environments.

