3D Printed End of Arm Tooling (EOAT) for Robotic Automation


1
Materials Research Institute, Athlone Institute of Technology, Dublin Road, Athlone, N37 HD68 County Westmeath, Ireland
2
Faculty of Engineering & Informatics, Athlone Institute of Technology, Dublin Road, Athlone, N37 HD68 County Westmeath, Ireland
*
Author to whom correspondence should be addressed.
Robotics 2018, 7(3), 49; https://doi.org/10.3390/robotics7030049
Submission received: 11 July 2018
/
Revised: 27 August 2018
/
Accepted: 4 September 2018
/
Published: 5 September 2018
Abstract
:This research furthers the practice of designing and manufacturing End of Arm Tooling (EOAT) by utilizing a low cost additive manufacturing Fused Filament Fabrication (FFF) technique to enable tool weight saving and provision of low cost EOATs on demand, thereby facilitating zero inventory lean manufacturing. The materials used in this research for the fabrication of the EOAT parts were Acrylonitrile butadiene styrene (ABS) and nylon with infill densities of 20% and 100%. Three-point flexural tests were performed to determine the differences in strength and stiffness between varying polymers, infill ratios, and a standard metal part. Additionally, potential weight savings were identified and challenges with utilizing low cost FFF technologies are outlined. A motion of programmed trajectories was executed utilizing a standard 6-axis robot and the power consumption was evaluated. This study demonstrates the utility of using thermoplastic material with the fabrication of 3D printed parts used in EOATs.
1. Introduction
Robotics can be defined as the design, assembly, performance, and utilisation of robot systems in manufacturing [1]. Robots in general are used to execute hazardous, harmful, distressing or highly repetitive tasks and are, capable of radically improving the efficiency of the industrial manufacturing processes [2]. Robots are utilised to carry out tasks such as transporting, palletizing, sorting, machining, and inspecting. The Robot Institute of America states that a robot can be interpreted as a reprogrammable, multifunctional manipulator designed for relocation of objects or materials through numerous programmable movements for a variety of tasks [3]. A robot may have certain anthropomorphic characteristics allowing for the mimicry of human physical structure and response to sensory signals that are analogous to human behavior [4]. A robot’s end of arm tool (EOAT) also described as an end-effector, is selected according to the operation of its task and the robot manipulation specific to the part or tool. Customisation of standard off-the-shelf EOAT and robot integrators are frequently required to engage with a distinctive shaped object, improve productivity, and optimise operations.
Fused filament fabrication (FFF) is one of the most widely used solid free form fabrication systems (SFF). FFF is a technique in additive manufacturing applied in chemistry, thermal energy, and layer manufacturing technology. The filament fed through a nozzle and deposited onto the build platform or partially fabricated part. The extruded material is in a semi-molten state so that the newly deposited material has the ability to fuse with the adjacent material which has been already deposited. The heat is dissipated through additive manufacturing process by conduction and forced convection and the reduction in temperature causes the material to rapidly solidify onto the build platform [5]. The limitations of FFF are the constraint of mechanical properties of the 3D printed parts [6] and the distortion of the part during printing caused by rapid heating and cooling cycles of the feedstock material [7]. FFF filaments and equipment are widely available at a range of price points and thus are perfectly suited to utilization for fixture/EOAT manufacture, particularly where high tolerances are not required. Additive manufacturing describes all technologies that facilitate printing of 3D objects through deposition or curing of successive layers [8]. This technology allows small-scale of customised parts to be fabricated at relatively low costs. Additive manufacturing builds a three-dimensional solid object through a layer-by-layer additive methodology that allows rapid prototyping to have freedom in fabricating objects of complex geometry through Computer Aided Design (CAD) models, without the need of applying distinctive fixtures [9]. Additive manufacturing technology will have a large impact on manufacturers enabling more lean, bespoke production processes at a lower cost in a dynamic and competitive global market [10]. There are many diverse areas of application for 3D printing in robotics; from bio-hybrid robots to soft robots to 3D printed humanoids. A major field in robotic applications is the pick and place task. Speed and accuracy are considered important related to the efficiency of the performance of the robots. For an increase in efficiency of the robotic system, energy consumption has to be considered as well. [11]. As a result, lightweight design of the end effector is required to improve the overall performance of the robotic arm, as this may improve overall energy consumption or provide for an increased payload carrying capacity. AM allows direct fabrication, giving it the capability of personalization and zero inventory lean manufacturing [12]. Zero Inventory of spare EOAT parts in robotics can increase factory efficiencies by reducing lead time for parts and increased utilization of available space (via storage room elimination).
In this contribution, the primary objective was the fabrication of 3D printed EOAT parts from two common polymers with varying infill densities, as potential replacements for off-the-shelf metallic EOAT parts.
2. Materials and Methods
2.1. Acrylonitrile Butadiene Styrene (ABS)
ABS was used for the fabrication of the samples with a 1.75 mm diameter filament. The filaments were supplied by 123ink. The ABS filaments were shipped and contained in a sealed bag with a box to prevent any moisture absorption. The ABS filaments are black in color with a weight of 1 kg. The ABS filaments were dried in an oven at 60 °C for 6 h before the parts were printed.
2.2. Nylon
Nylon was used for fabrication of the samples with a 1.75 mm diameter filament. The nylon filaments were shipped and contained in a sealed bag to prevent any moisture absorption. The nylon used to fabricate the samples were supplied by 3DSystems. The color of the nylon filament of the 3D systems was natural color.
2.3. FANUC Robot LR Mate 200iD
FANUC Robot LR Mate 200iD was used to perform tasks specified by the user. The robotic arm consists of 6 controlled axis (J1, J2, J3, J4, J5, and J6) (Figure 1b). The robotic arm maximum load capacity including the equipment and the connection cables is 4 kg. The programmed robotic arm will run at a speed of 100% throughout this test to evaluate the peak power consumption of each sample. The robotic arm programme was written directly through the Teach Pendant (Figure 1a). The voltage from the robotic arm is 240 V. The power usage of the robotic arm was determined using the power law formula stated below:
Calculation of power (Watt),
P = I × V.
The parameters used in the formula are:
- P = Power (W)
- I = Current (A)
- V = Voltage (V)
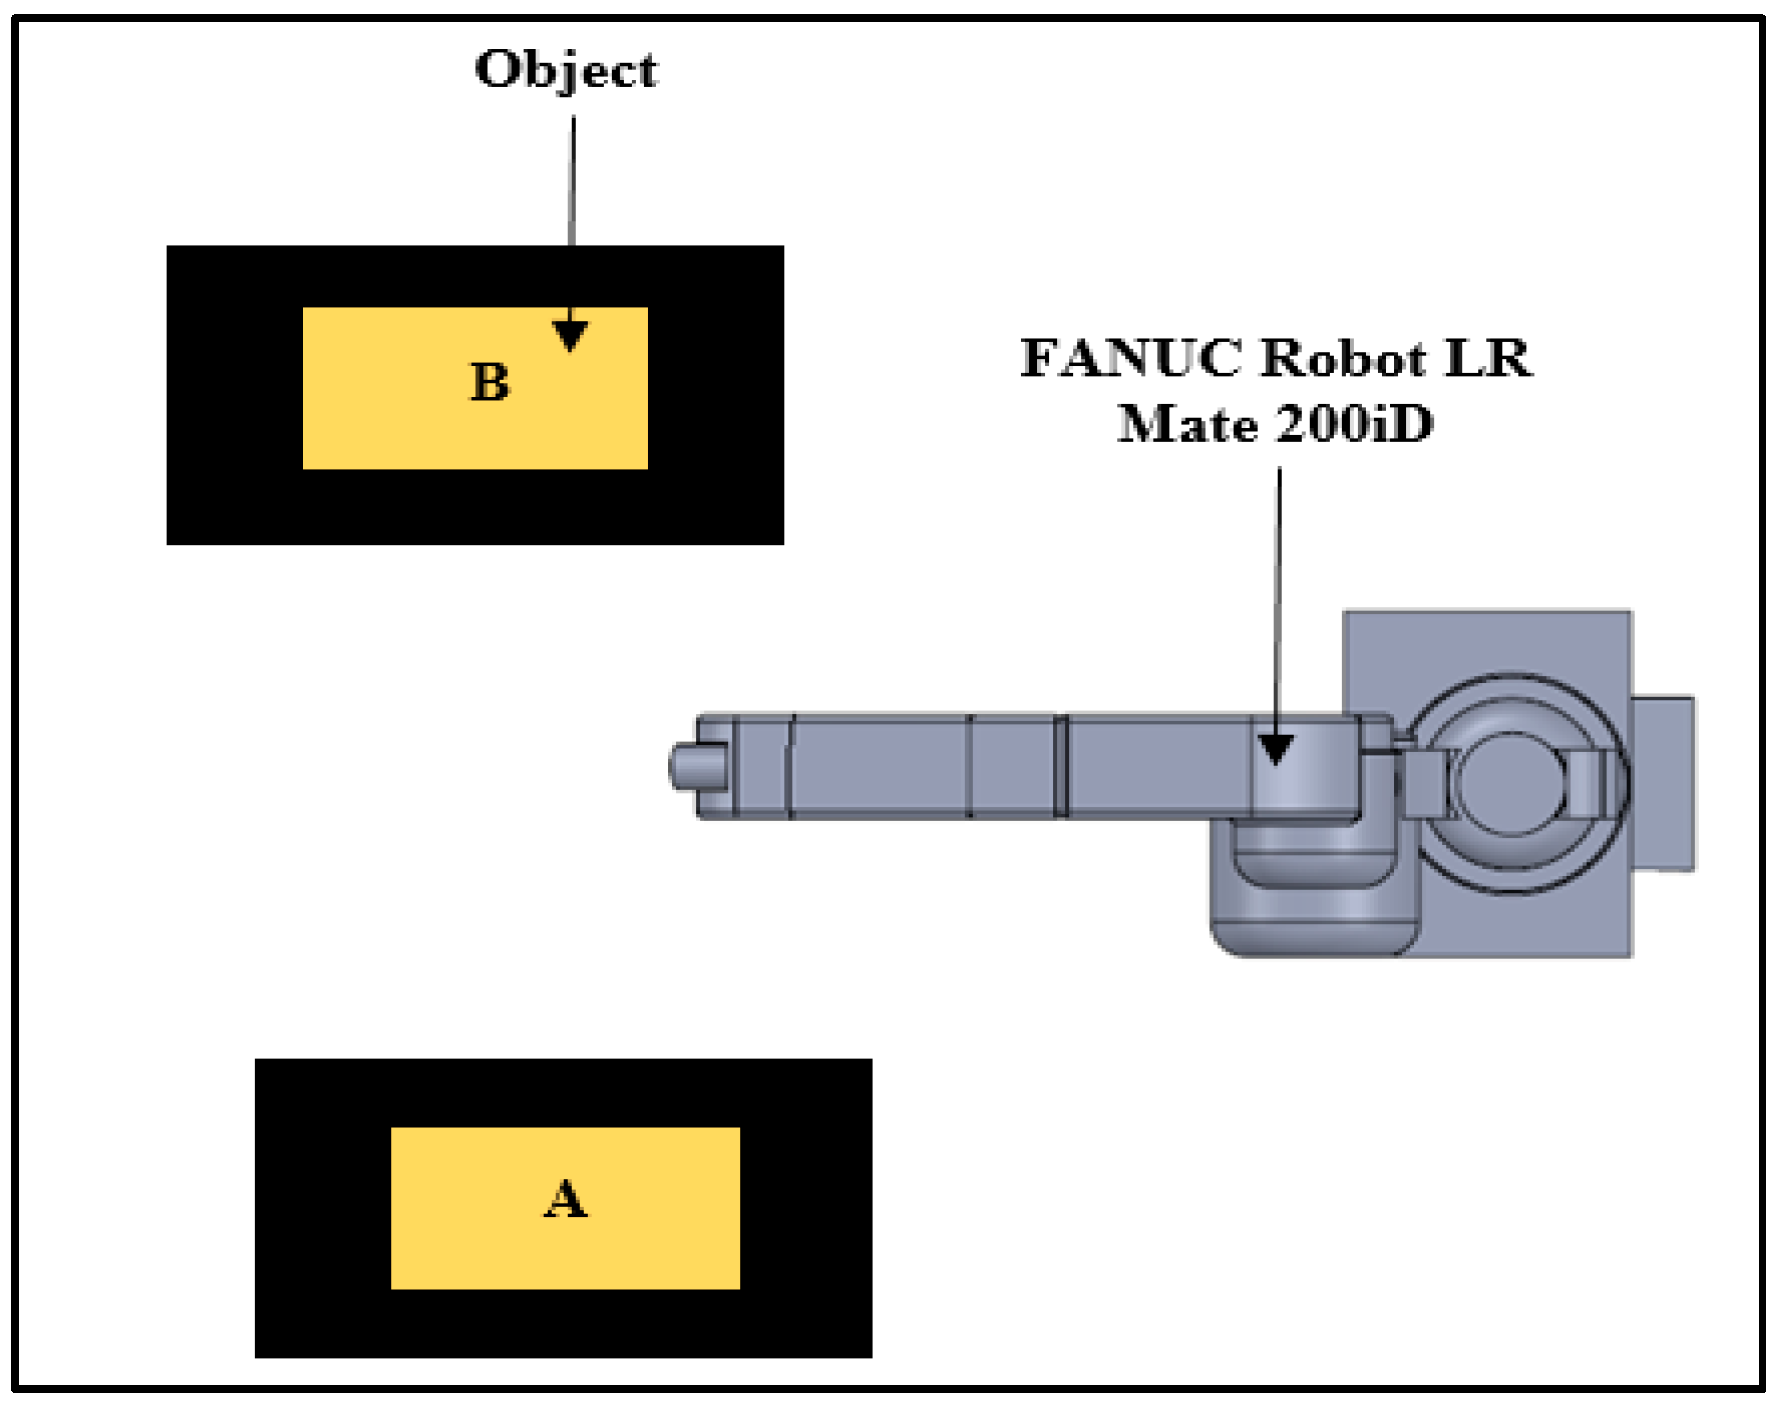
Figure 2 shows a schematic diagram of the pick and place program designed by the user. Firstly, the off-the-shelf EOAT will be assembled to the end of the robotic arm. The user will run the program, completing the 25 cycles. The programs were repeated for each sample and the peak power consumption was evaluated. The task programmed is to pick up the object with a weight of 0.216 g from point A and move it to point B, where the part will be dropped and picked up afterwards and returned to point A, where the part will be dropped and the return to its default position which is then considered as a cycle.
2.4. 3D Printer
ABS and nylon were used for the fabrication of the profile bar samples (Figure 3). The length of the samples was 100 mm with a width of 25 mm. A series of samples were produced using an open-source desktop 3D printing machine to emulate the fabrication conditions of an inexpert user of this type of technology. The structure of the 3D printer used was the model MakerGear M2, one of the lower cost 3D printing machines available. The 3D printer was used to create three-dimensional EOAT parts, attaching it to the end of the robotic arm. SolidWorks 2017 software was used to design the three-dimensional solid model of the EOAT parts. The model was then exported to the FFF Quickslicer software using the STL format. The settings of the 3D printer were set depending on the material used. The nozzle diameter configuration to print the parts is 0.35 mm with an extrusion width of 0.3 mm. The layer height was set as 0.2 mm of each filament layer of the print. The retraction feature was turned on with a retraction distance and speed of 1 mm and 2400 mm/min relatively. The print speed of the extruder traveling while it lays down filament was set to 5000 mm/min. The temperature of the extruder varies depending on the material used. For ABS, the extruder and heated bed temperature were set to 250 °C and 120 °C respectively. The fan speed was set at 35%. Support structures were excluded. The raft was used with an infill percentage of 50% with six layers. The methods of printing ABS and nylon varies due to the different mechanical characteristics. Before, printing with nylon filament, PVA based glue stick was applied to the bed of the 3D printer to give the bed and the print a better adhesion. The settings of the 3D printer using nylon to print is similar to that utilized for ABS material with the exception of the heated bed temperature and the fan speed which were set at 100 °C and zero percent respectively.
In this study, the infill of the intermediate zone was modified. The parameters evaluated in this study were the infill density and pattern. The infill density of the samples was broken down into two levels; 20% and 100% (Figure 4). An average of 15 samples was printed out with infill density of 20% and 100% of each of the materials. There are three common infill patterns; line, rectilinear, and honeycomb. Line pattern generates a random infill pattern with linear connections between the walls.
2.5. Density Test
Density tests were performed on the EOAT 3D printed and default parts using a RolBatch Densimeter. The instrument was used to measure the density of the samples by determining its exact volume. The sink was filled with water and the water level must exceed that of the sinker and the sample being measured. The machine was calibrated using the standard weight of 200 g. The temperature of the water was measured and recorded using thermometer, the temperature of the water was then inputted into the machine. Each sample was placed on the pan to weigh its weight, followed by putting it in the water to determine the density of the specimen. The density of the samples can be used to determine the specific strength of the material. The specific strength can be calculated using the given Equation (2).
2.6. Three-Point Flexural Test
Three-point flexural test was carried out on the 3D printed and off-the-shelf profile bar samples using Zwick/Roell Z010 machine (Figure 5). Two different materials of ABS and nylon were tested for each 20% and 100% infill percentage. Samples of 100 mm length, a width of 25 mm and a thickness of 25 mm were tested. Each sample was placed between two clamps with a support separation of 92 mm. The loading pin was then adjusted until it touches the sample. The stress was set to essentially zero at the neutral axis. The speed of the loading pin was set to 200 mm/min. The maximum deformation was set at 15 mm. The starting flexural modulus point was set at 0.1 mm and the ending flexural modulus point is set at 2 mm. During the tests, samples were test till it breaks. Load-displacement plots were obtained for each test samples of different group. The dimensions of the samples were not accordance with test standard ISO 178. The theoretical data for flexural modulus Ef, flexural stress σf, flexural strain εf and error percentage were calculated to be compared with the experimental data. The formulas are stated as followed:
Calculation of flexural stress σf for a rectangular cross section,
The parameters used in these formulas are:
- σf = Stress in outer fibers at midpoint, (MPa)
- εf = Strain in the outer surface, (mm/mm)
- Ef = flexural Modulus of elasticity, (MPA)
- F = load at a given point on the load deflection curve, (N)
- L = Support span, (mm)
- b = Width of test beam, (mm)
- d = Depth or thickness of tested beam, (mm)
- m = The gradient of the initial straight-line portion of the load deflection curve, (N/mm)
- y = deflection at load point (mm)
2.7. Rheology
Parallel plate rheological test was carried out on ABS and nylon filament using an Advanced Rheometer AR 1000 (TA Instruments, Dublin, Ireland) with a constant temperature of 250 °C and a 25 mm diameter steel plate was used as the top geometry. The rheology test was carried out to determine the coefficient of viscosity of ABS and nylon. In an FFF process, the filament is partially melted through a layer-by-layer addition of material. As such, the flow properties of the polymers utilised is crucial. The thermoplastic samples were subjected to stress with a frequency of 0.1 to 100 Hz and a constant normal force of 5 ± 0.5 N to ensure contact between the samples and the plate. The shear rate modulus S’ and the viscosity modulus G’ were recorded to establish the comparative of the viscosity of ABS and nylon samples.
3. Results & Discussion
3.1. 3D Printer
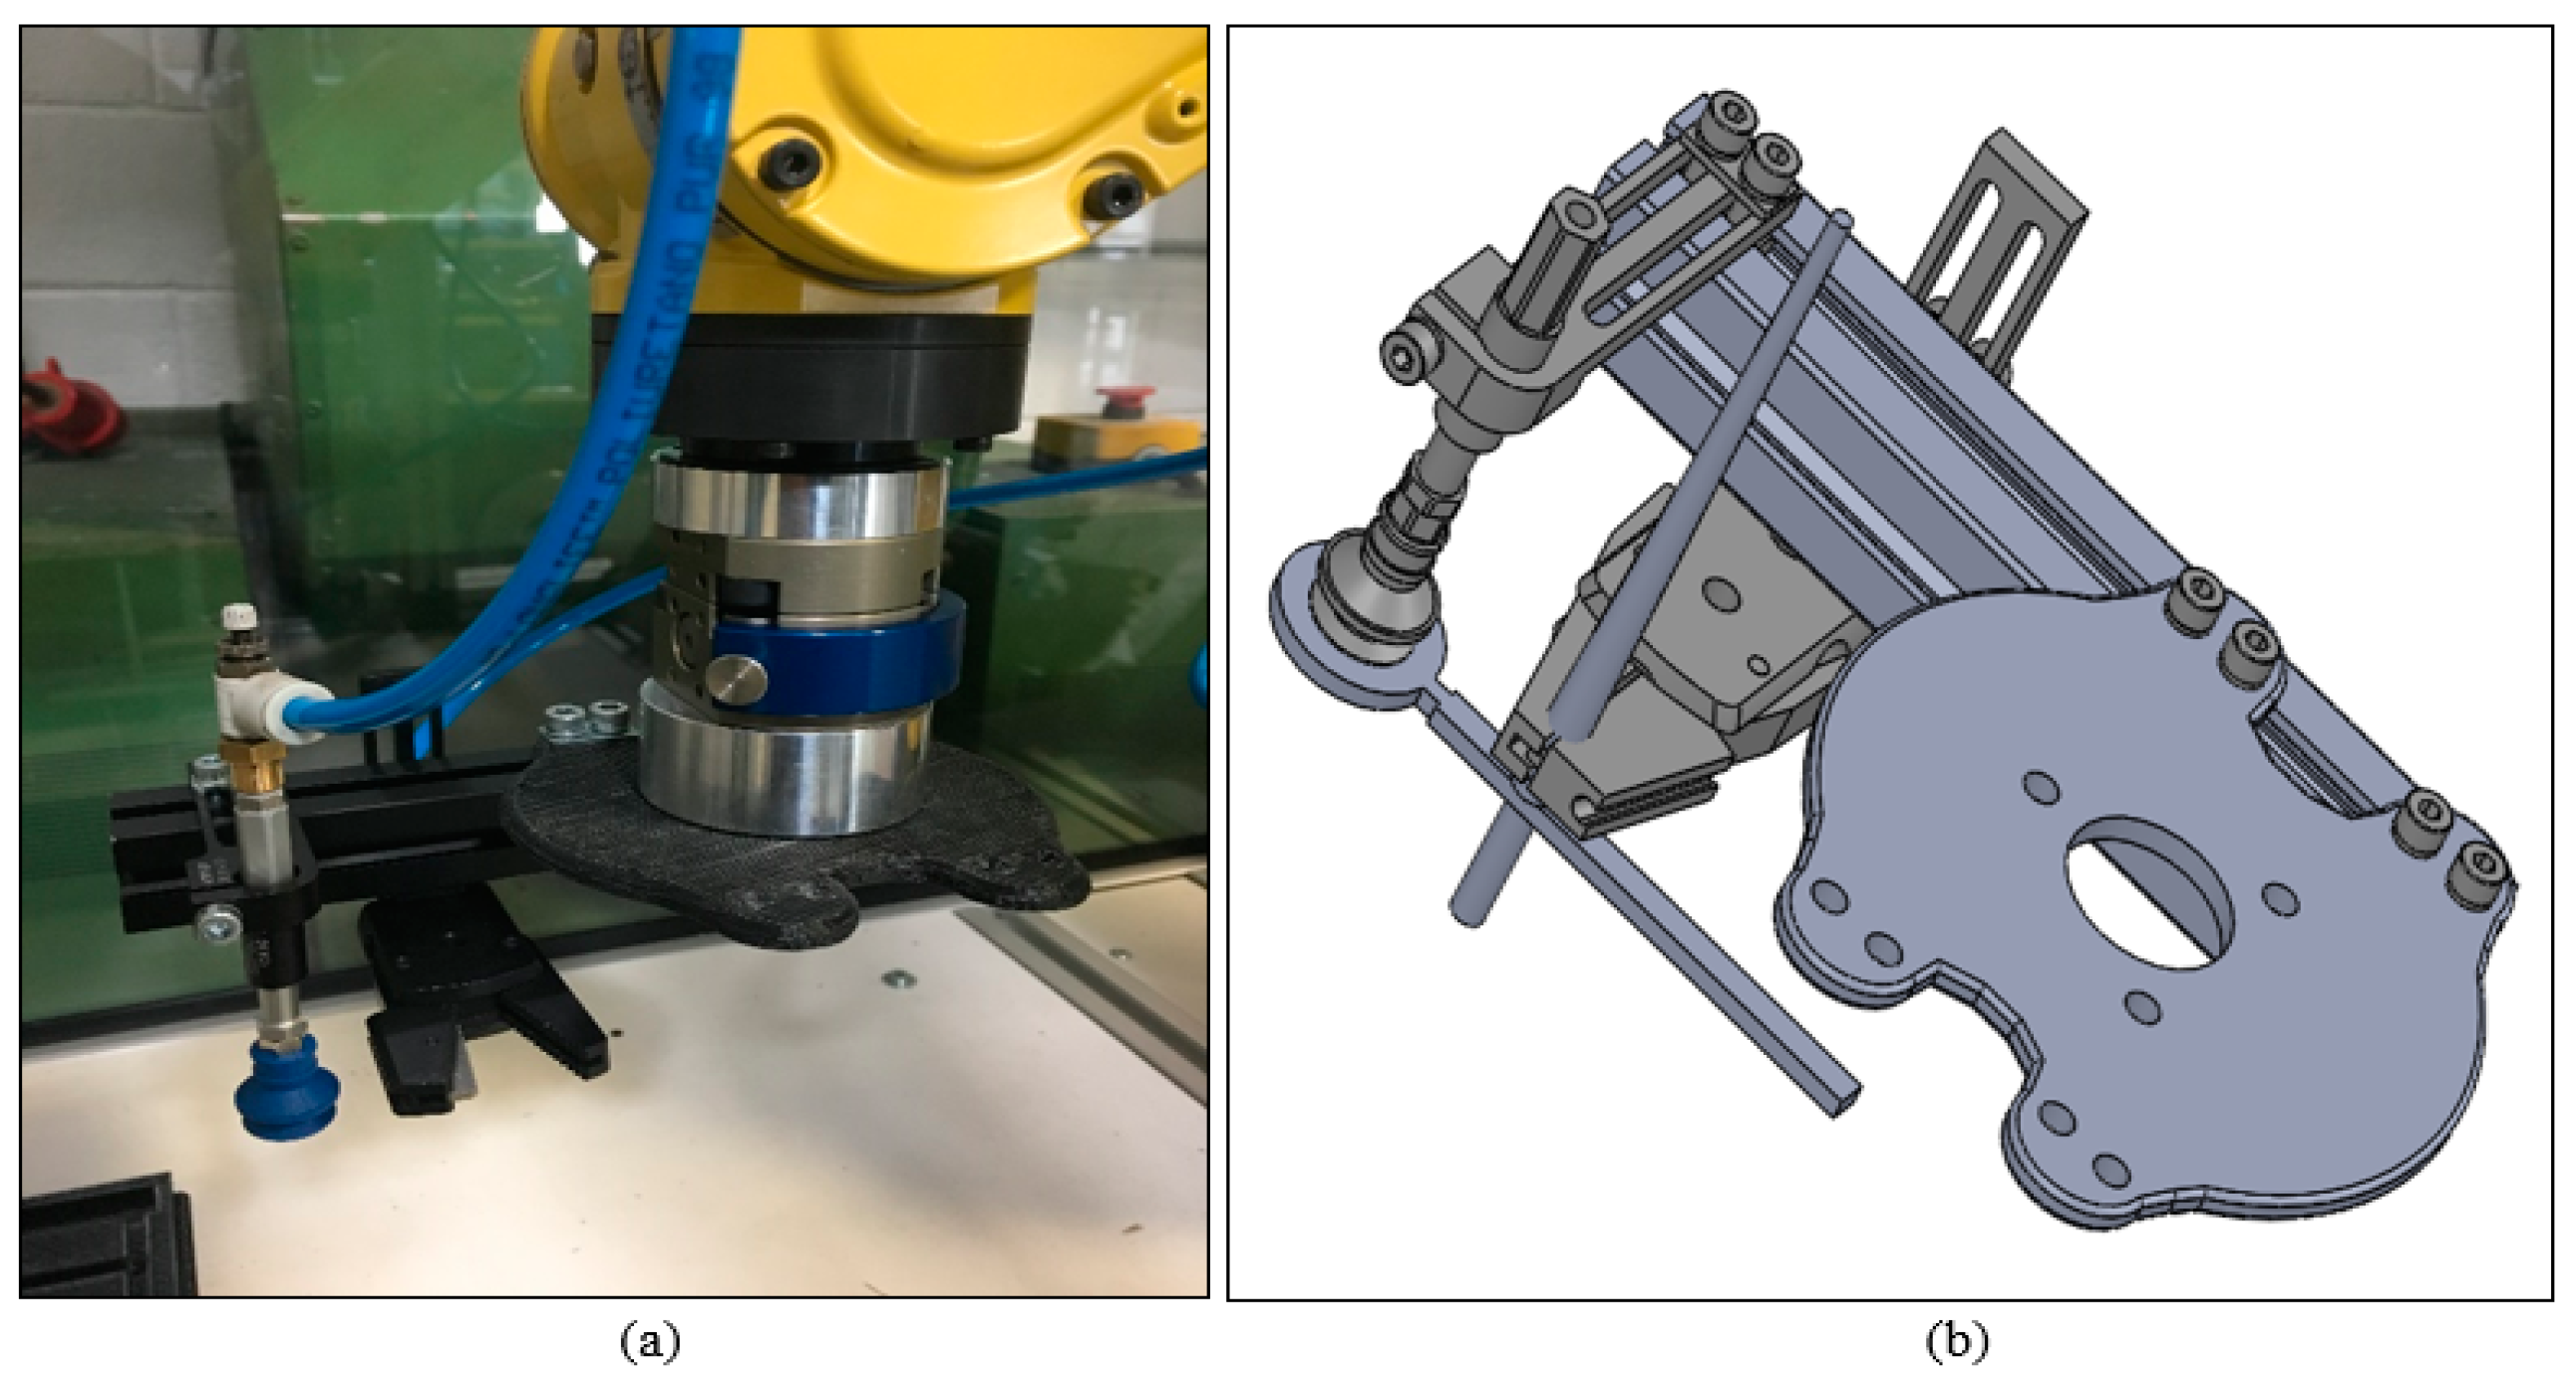
The strength of the part, quality, cost, and production time can be influenced by the process parameters such as part design, layer thickness, material, support selection, print condition, and lastly infill pattern [14]. The purpose of this test was to find the optimum process parameters to fabricate the samples. The build dimensions of the MakerGear M2 printer is 200 mm on the x-axis, 250 mm on the y-axis and 200 mm on the z-axis. A 3D rendering of the EOAT is depicted in Figure 6 alongside the finished part mounted on the robot.
An average of 15 printed samples of ABS and nylon with 20% and 100% infill density were fabricated as drawn in Figure 7. In Figure 8a,b, it can be observed that there is deformation towards the bottom layer of the samples. The deformation can be the effect of warping during the fabrication of the samples when the polymer filament is being heated and extruded through a heated nozzle near to the point of fusion. The material deposited is in the form of a semi-molten state. During the material deposition, the nozzle is cool from a glass transition temperature to an ambient temperature, this will cause an internal stress that develops to warping deformations around the corners [15,16]. Warping will have an effect on the properties of the samples, resulting in a weak interlayer bonding and a high porosity. Alsoufi and Elsayed [16] found similar results when printing using PLA with a printing speed of 15 mm/s and the nozzle temperature at 220 °C.
The samples fabricated were 100 mm in length which can cause a higher chance of deformation due to the high stacking section. A raft is used during the fabrication to help with warping and bed adhesion. The samples are printed vertically to the build platform with the help of using a raft, this helps create a strong foundation for the fabrication of the samples. Even with the use of a raft, warping still occurs due to the material shrinkage while 3D printing, causing the corners of the print to lift and separate from the heated bed of the 3D printer. Since nylon has a higher shrinkage factor compare to ABS, PVA based glue stick is applied to the build platform to create a better adhesion. Linear shrinkage rate and a lower glass transition temperature will prevent or reduce the deformation of the samples fabricated [17].
3.2. Density Test
Density tests were conducted on the fabricated profile bar samples. The density of the samples was tested according to the different infill percentage and material of the samples. The results were compared to determine which material with different infill percentage exhibited the ideal mechanical properties to be used as the EOAT.
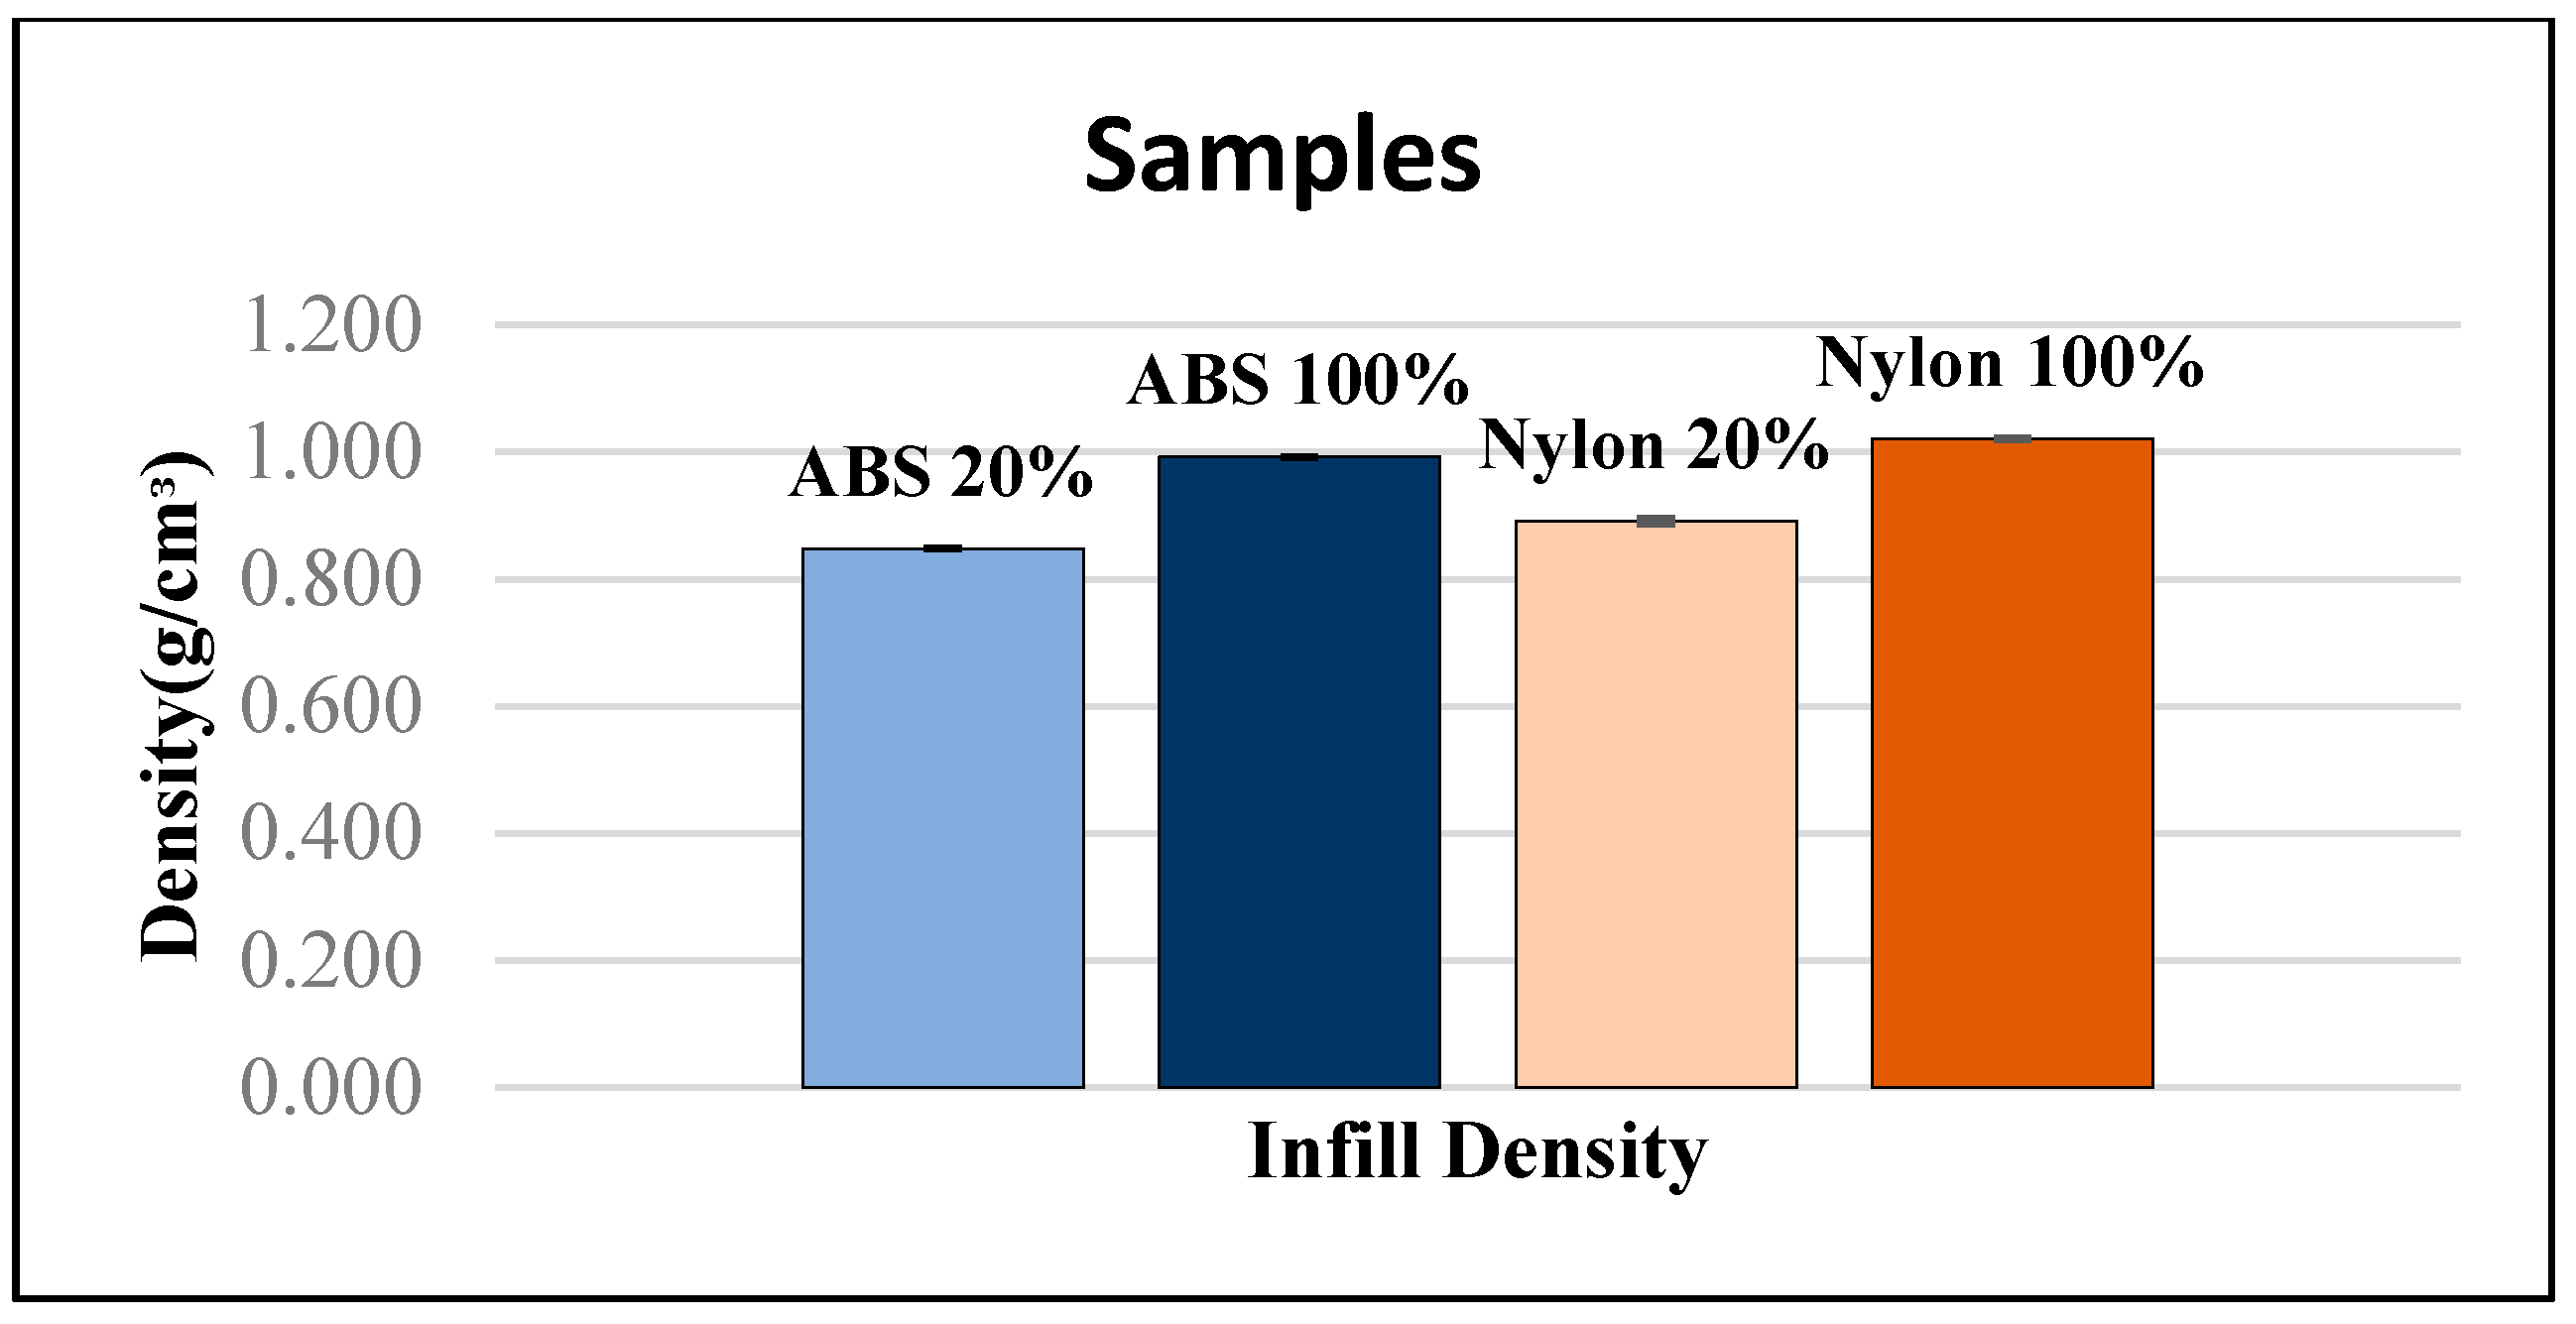
15 samples of each category were tested. The density test was carried out at room temperature and pressure at atmospheric pressure. The density of the material can be used to calculate the specific strength of the materials. The specific strength is the ratio of the material strength to relative density. This is able to determine the ideal material samples to be used in this study for the EOAT application. The off-the-shelf parts are made out of aluminum (Al). The density of Al can be referenced with a readily available published value of 2.70 g/cm3. Figure 9 shows the average density of ABS and nylon with 20% and 100% infill density. The average density of ABS samples with 20% infill density is 0.848 g/cm3. The average density of ABS samples with 100% infill density is 0.992 g/cm3. The average density of nylon samples with 20% infill density is 0.892 g/cm3. The average density of nylon samples with 100% infill density is 1.036 g/cm3. From the results, it can be seen that the ABS samples have a lower density compared to the nylon samples for both 20% and 100% infill density. The difference in density of the sample will have an effect on the mechanical properties of the samples due to the structure of the molecules [18].
3.3. Digital Microscopy
The limitations of FFF are the constraints of the mechanical properties of the fabricated parts [6] and warping of the parts during fabrication prompted by the rapid cycles of heating and cooling of the filament material [7]. Layer heights and the air gaps have the ability to affect and influence the mechanical properties of the printed parts [19]; with this in mind a digital microscopic test is conducted on the samples. The purpose of this study is to determine the effects of the material viscosity on the air gaps and layer height of the samples and how they might affect the mechanical properties of the samples. Layer height is the thickness of each layer. Air gaps are the distance between two adjacent deposited materials in the same layer. The melt flow behavior (MFB) will significantly affect the quality of the deposited material, which depends not only on the pressure gradient, temperature gradient, and its velocity but also the melt temperature and rheology [20]. Prior to commencing the images test, samples are labelled each side as a, b, c, and d followed by a numbering system to give a better representation of each sample. Three random measurements were taken on each of the following side.
From the results gathered through the measurement of the average layer height of each sample, a one-way analysis of variance (ANOVA) was used to examine the statistic of significant differences between the layer height of the samples. Histograms were depicted and examined to validate the normality of the data. 95% confidence intervals (95% CI) were collected for each layer height. The p-values were 2-sided and statistical significance with the p-values less than 0.05. Minitab 2018 software was used to perform all the statistical analyses. ANOVA (p < 0.001) shows indication of statistically significant difference with average absolute deviations between all the four sample groups (ABS 20%, ABS 100%, nylon 20%, and nylon 100%). Post hoc comparisons shows that the nylon 100% layer height group has the least average overall deviation at 0.00245 mm (95% CI, 0.18325–0.19275 mm), followed by nylon 20% layer height group of 0.0407 mm (95% CI, 0.19152–0.19643 mm), followed by ABS 100% layer height group of 0.00461 mm (95% CI, 0.191277–0.19667 m) and the ABS 20% layer height group at 0.00569 mm (95% CI, 0.20115–0.20606 mm) (Figure 10).
The strength of the samples will be limited to the fundamental bond strength between the neighboring layer. For polymer materials, a viscous flow mechanism transpires through the process of sintering during the deposition of materials [21]. The viscosity of a material will have an effect on the spreading rate and final structure of the layers. The materials deposited will spread in an oblong shape. The rounded, oblong shape of the deposited material will lead to air gaps in the samples. The viscosity in Figure 11 shows the rheology test of the viscosity of ABS and nylon material. The viscous behavior of the melt in the liquefier is important when describing the behavior of the liquefier and the extrusion nozzle. It can be seen that the viscosity of the ABS material is higher compared to the nylon material. The rheology results can be further highlighted by looking at Figure 10, where the both ABS with 20% and 100% infill density has a 95% confidence interval nearest to the layer height process parameters of 0.2 mm. In a similar study carried out by Hashemi Sanatgar et al. [22], the authors analyzed the adhesion properties of 3D printing of polymers and found that higher viscosity gives better adhesion between the neighboring beads of the material. The strength of the bond between the two adjacent layers and the overall mechanical properties of the part will be governed by the nature of the deposited material and size of the air gaps [23].
Figure 12a illustrates a representative image of ABS with 20% infill density. It can be seen that the layer height of the samples is not at 0.2 mm as set in the process parameters. Similar results were found by Ro Zitko et. al. [24] when ABS was used to fabricate a 3D object, the ABS material changes from a hard and brittle state to a rubbery and viscous state when exposed to an increase in temperature. This causes the streamline near the nozzle to form a vortex, this eddy flow may cause a non-uniform layer height. The process is bound to happen when ABS is heated to a molten state in the FFF printer extruder and again as it cools and solidifies upon the material being deposited. The temperature of the nozzle throughout the printing process fluctuates between 245 °C and 250 °C, which may cause inconsistency of the filament melted.
Absorption of moisture by the polymer filament will cause the absorbed water to vaporize when the feedstock is being melted and pushes through the nozzle that leads to morphological changes to the material [25], nozzle blockage, air gaps formation, and bulges on the surface of the printed surface of the material. Samples with 100% infill density (Figure 12b,d) tend to exhibit a higher chance of the existence of air gaps and variance of layer height compared with the samples with 20% infill density (Figure 12a,c). This is in good agreement with Figure 10, where the samples with the 100% infill density exhibit a lower layer height range compared to the samples with 20% infill density. The moisture in the filament tends to make it harder to stop or start the printing process. During the process of extruding the filament containing water, the water in the material vaporizes, creating gaps left with air or bubbles of the filament. This was due to the printing time of samples with 100% infill density, which have a higher average print time compared to a 20% infill density, which causes it to absorb more moisture from the air during the duration of the print.
3.4. Three-Point Flexural Test
The samples fabricated for the three-point flexural test does not follow the test standard of ISO 178 due to the constraint parameters of the MakerGear M2 printer. The mechanical properties of 3D printed parts are important indices for evaluating printing quality [26]. The three-point flexural test was carried out to determine the response of the sample’s yield when it undergoes stress under bending load. All of the samples have the same span length, thus making it practical to superimpose the load/displacement plots for each group of samples. To ensure the primary failure comes from tensile stress, the shear stress has to be minimized. This can be achieved by controlling the span to depth ratio. The three-point flexural test was stopped once the samples were broken. All the samples after being printed were kept in ziplock bag to prevent moisture from the air to be absorbed into the fabricated samples. Clear comparisons were noted between the samples with the digital microscope and rheology study and those same samples were three-point flexural tested.
Three-point flexural test behavior of the materials with different infill percentages have been investigated. Figure 13 shows the load vs displacement curves for selected samples that underwent three-point flexural testing. It can be seen that the thermoplastics could not compete with the strength characteristics of the metal samples. The off-the-shelf (metal) samples outperform the polymer materials in terms of strength. ABS with 100% infill percentage samples requires a higher load force for the samples to break compared to ABS with 20% infill density. Nylon with 100% infill density samples have a higher load force compared to nylon with 20% infill density. ABS samples with 100% infill density exhibits the highest value of tensile stress. The variation in strength of the samples is in part related to the polymer molecular weight and variations inherent in the printing process [27]. This explains the different characteristic of each of the samples tested using the three-point flexural test. A similar study carried out by Belter and Dollar [28] analyzed the difference in the strength of thermoplastic using FFF manufactured printed parts by changing the infill density of the material by using three-point flexural test. It can be found that the samples having a lower infill density tend to withstand a lower force when undergoing stress under a bending load, compared to the samples having a higher infill density. Lower density samples would naturally yield lower tensile and flexural modulus. This results in the formation of voids in the polymer matrix that introduces inhomogeneities that lead to the restriction in ability of the polymer to support stress and therefore a higher infill density percentage of the materials will require more force to deform the samples [29]. Additionally, the samples with the lower infill% have a reduced polymer content with which to resist deformation. ABS exhibits a more brittle behavior compared to nylon when being subjected to stress, it breaks without a significant noticeable prior change in the rate of elongation. ABS absorbs relatively little energy prior to fracture. As a result, ABS maximum flexural load is higher compared to nylon but the deformation of ABS is lower than the nylon material. Nylon is more ductile compare to ABS, giving the ability to nylon samples to have a higher rate of elongation. The relationship within the elastic range of brittle materials will exhibit a linear relation of load and deflection where yielding occurs on a thin layer of the surface of the sample the mid-span. In contrast, ductile materials provide load-deflection curves that deviate from a linear relationship before failure takes place. Currently, there are very few studies on the fatigue of FFF components; most have largely focused on printing direction and the effect of the material mesostructure on mechanical performance. Infill density is likely to alter fatigue properties of the material depending on the shape of infill pattern utilized and the percentage infill implemented.
One of the biggest roadblocks to replacing metal parts with thermoplastics is that thermoplastics cannot generally compete with the strength characteristics of metals. The metal samples appear to have a highest specific strength, followed by ABS 100%, nylon 100%, ABS 20% and lastly nylon 20%. A similar study carried out by Peirson [30], analyzed the specific properties of engineering materials and also found that metals had a higher specific modulus than polymers. Table 1 shows the specific flexural yield strength of the samples.
On analysis of samples ABS 20%, ABS 100%, nylon 20% and nylon 100%, it was clear that all four samples demonstrated a difference in mechanical properties as well as in weight and density. ABS with 100% infill density samples is the most promising sample for the replacement of off-the-shelf EOAT parts. It was evident that ABS with 100% infill density shows the highest strength-to-weight ratio among the other samples analyzed. The increase in infill density of ABS imparted greater mechanical strength.
3.5. FANUC Robot LR Mate 200iD
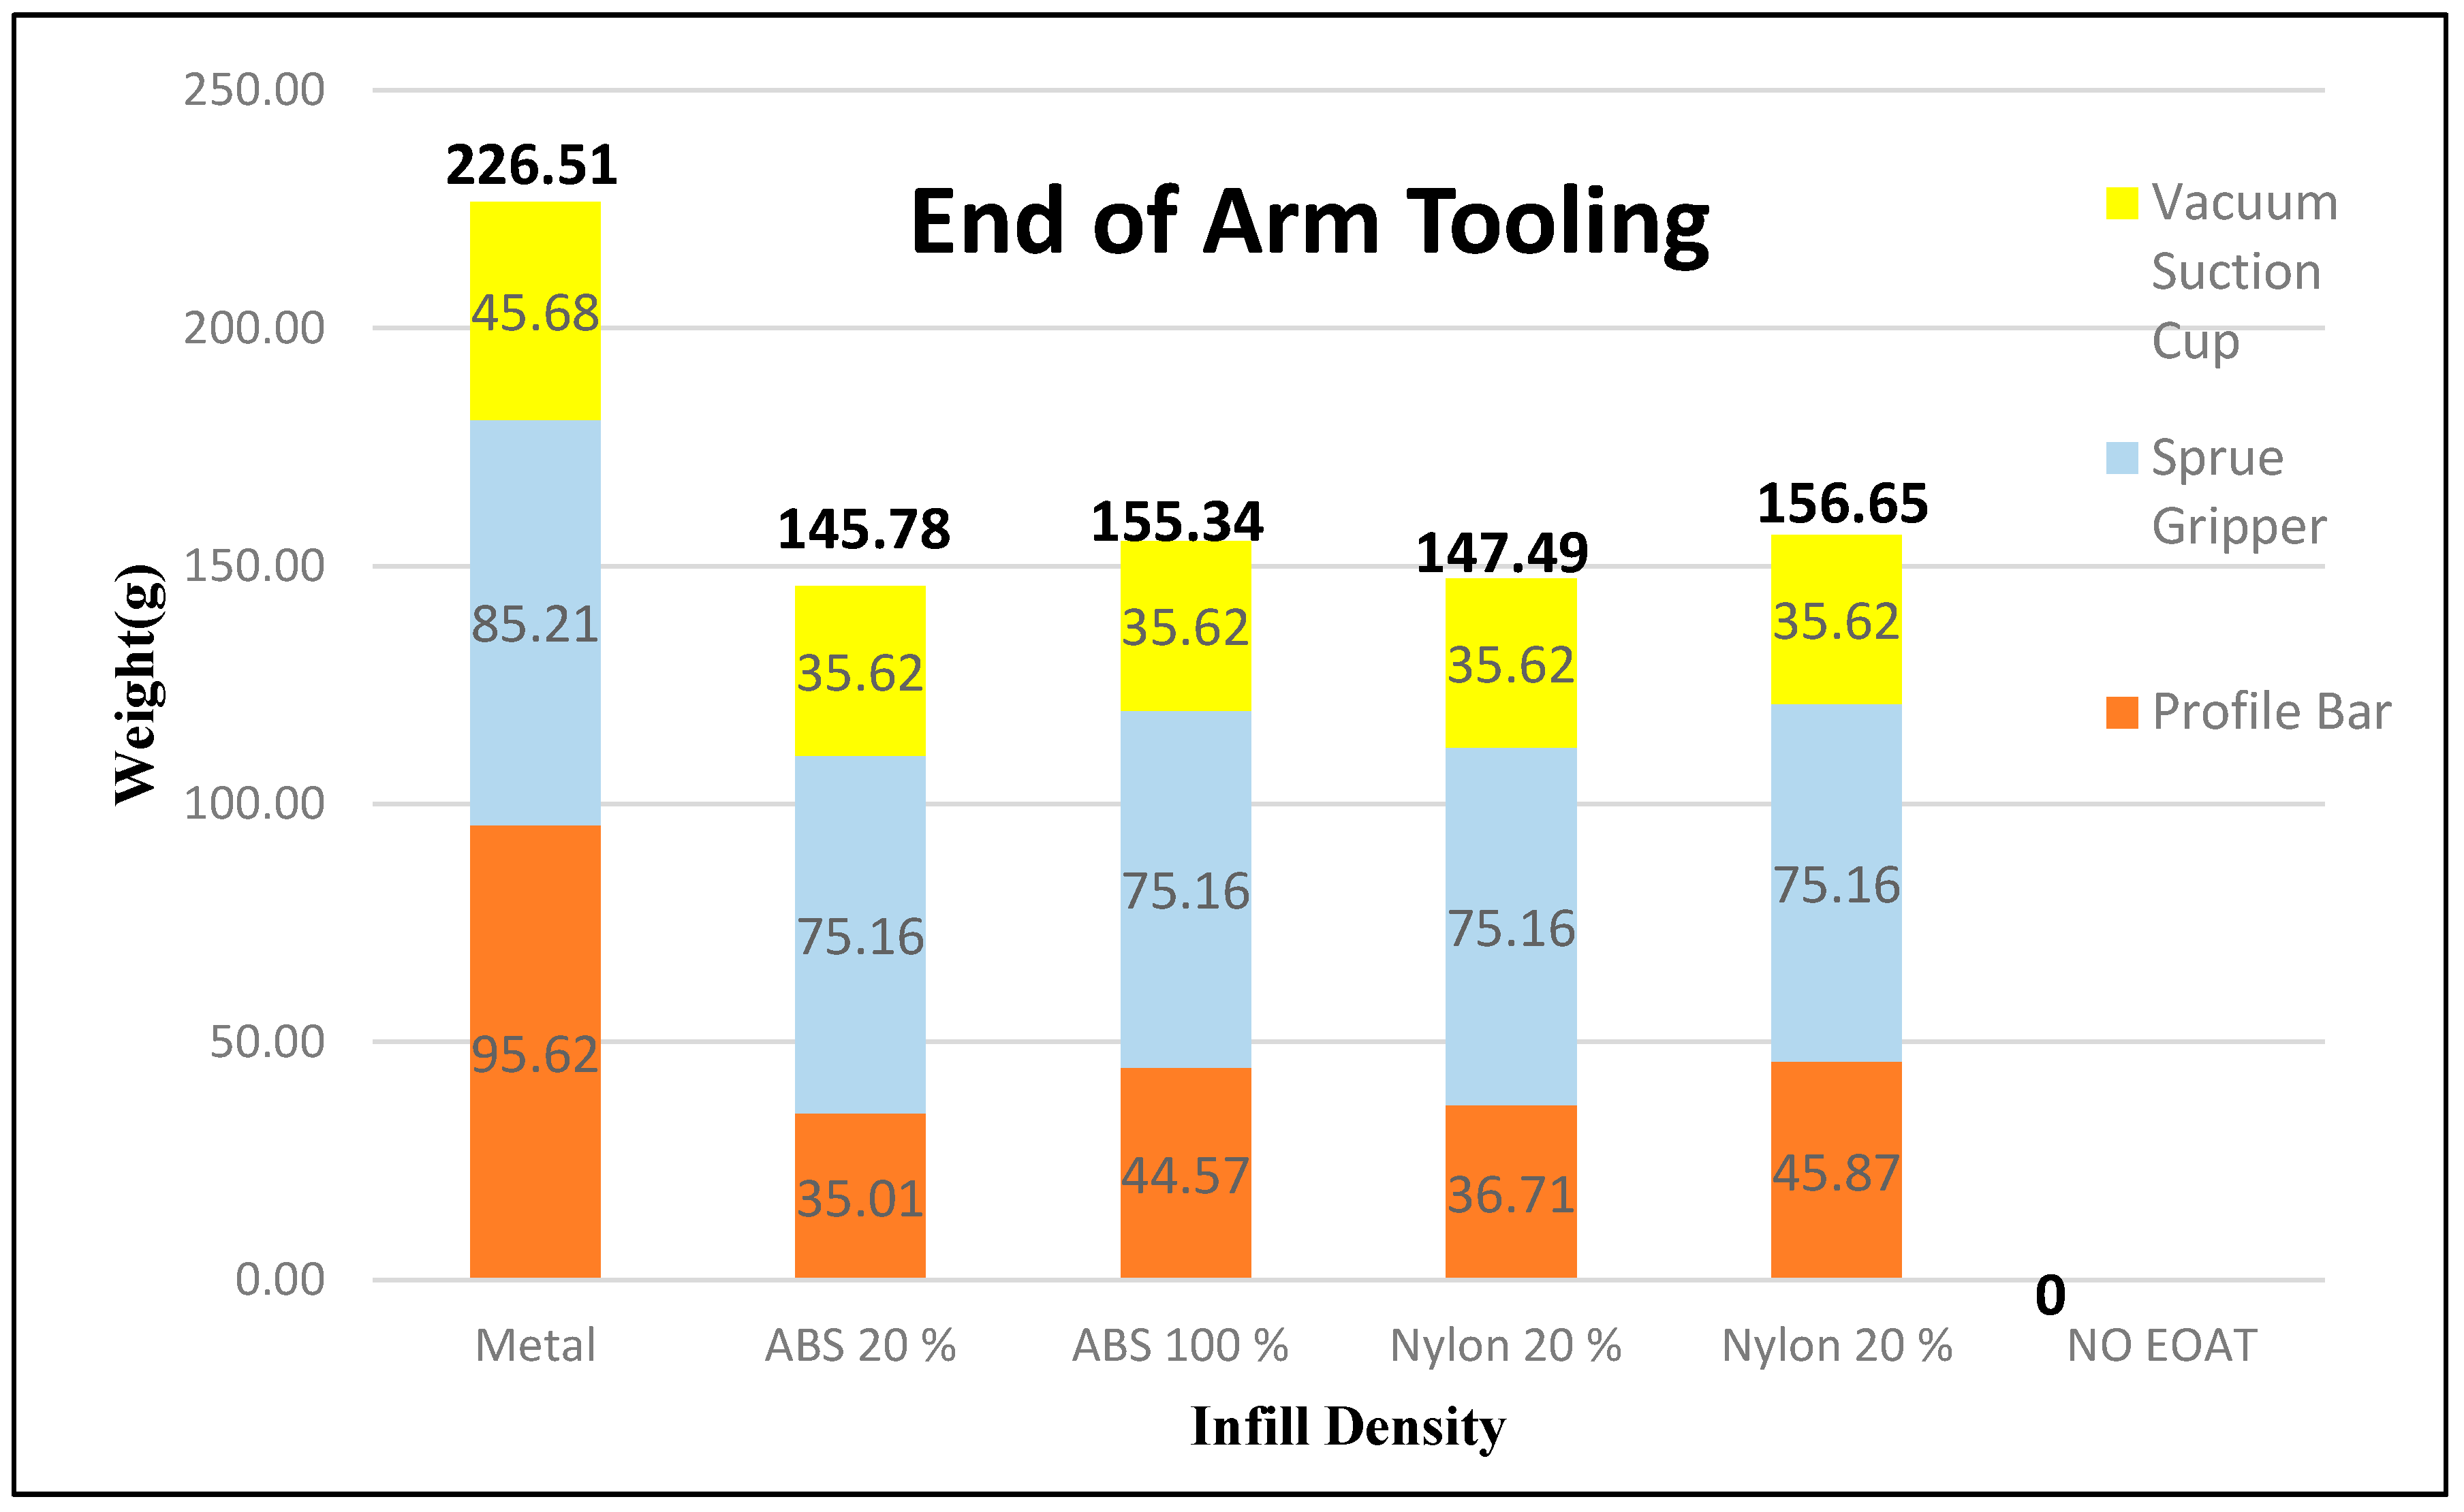
Weight is always a concern in robotics. The weight of the robotic arm is an important factor in order to achieve higher efficiency [11]. A study carried out by Helms et. al. [31], states that the key feature for the weight reduction of the EOAT will help reduce the dynamic inertia, energy consumption, and their negative effects on accuracy. The EOAT is made out of two different materials with 20% and 100% infill density of each material and off-the-shelf EOAT acting as a comparison to the samples. There are two major components of the EOAT that are made out of ABS and nylon materials with 20% and 100% infill density; a profile bar and adjustable mounting. The total weight of the off-the-shelf (metal) EOAT is 226.51 g. This is 69.86 g to 80.73 g or roughly 35.64% to 30.84% decrease in weight over the thermoplastic material counterparts (Figure 14). Off-the-shelf EOAT was made out of metal and metal tends to be heavier compared to thermoplastic materials.
Peak Power Measurement
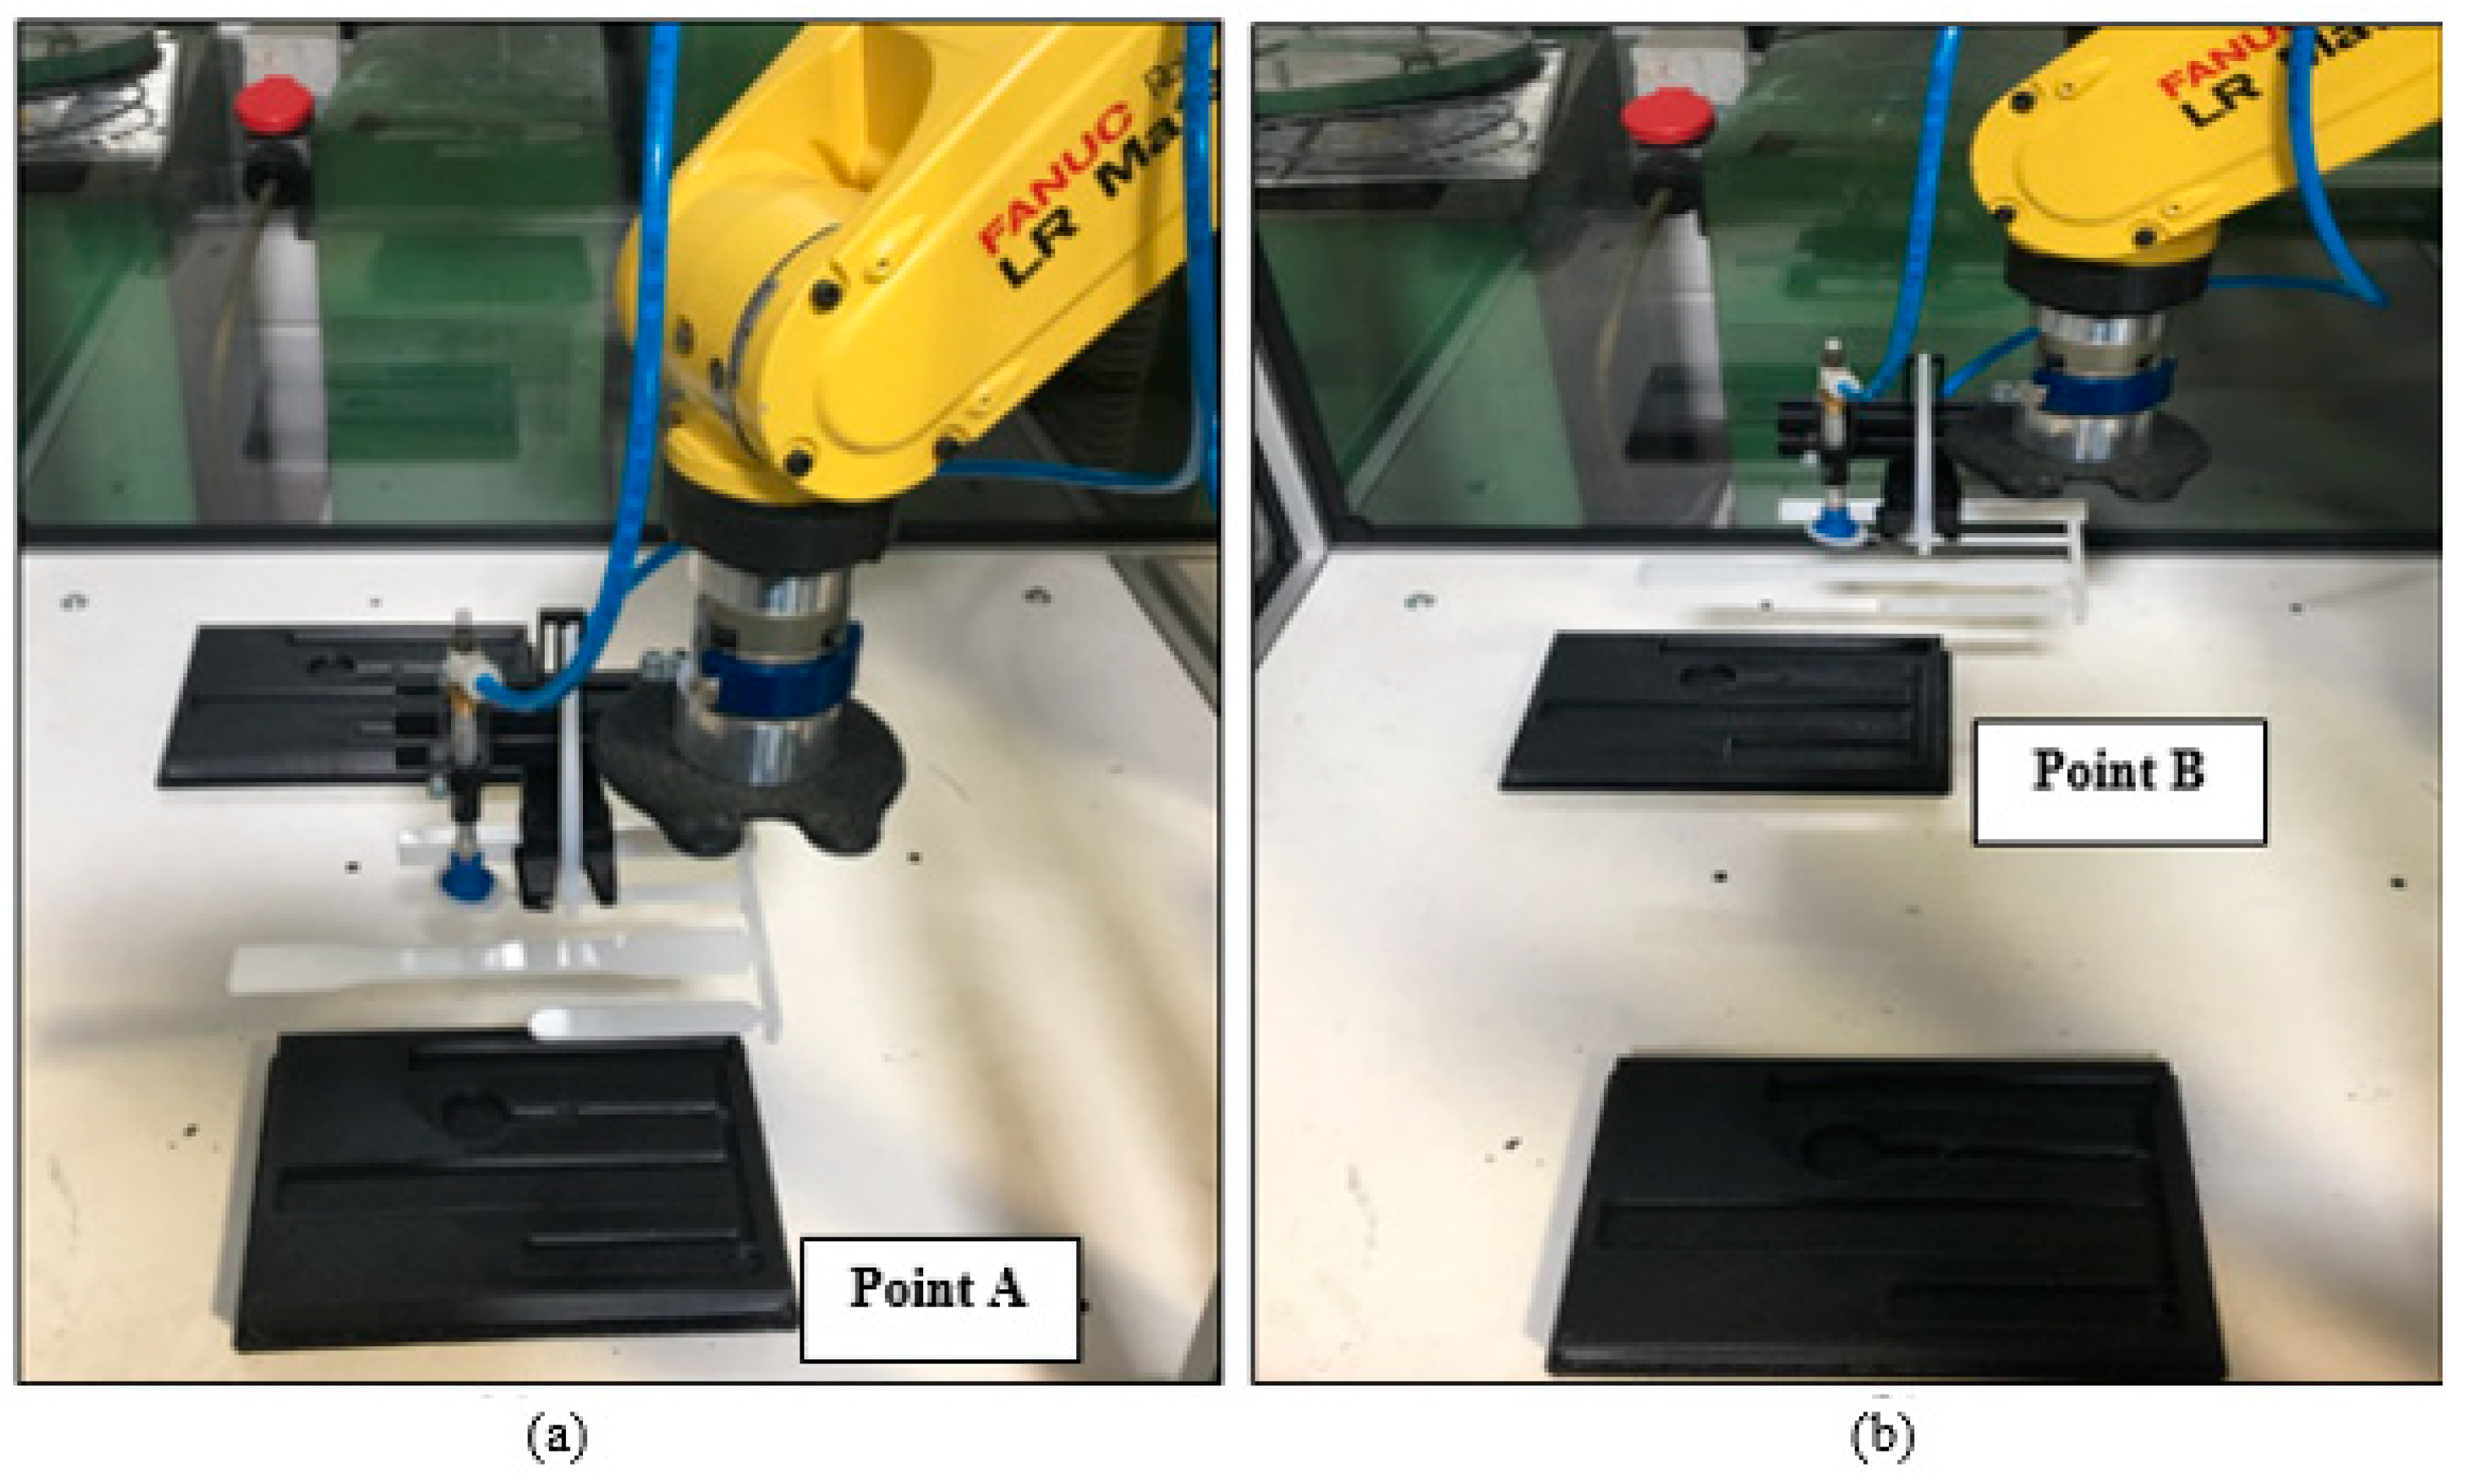
The reduction of weight of the EOAT is important to carry heavier payloads and increase the efficiency of the robotic arm system [11]. The peak power measurement for the FANUC Robot LR Mate 200iD was calculated based on the overall power of the system. The peak power measurements were accomplished by means of an AC Clamp Meter from HandyMan, which allows the measurement of the currents flowing through the conductor. The calculation of the power consumption was performed using Equation (1). The movement is shown in Figure 15, as the robotic arm picks the part from Point A and moves it to Point B, the current is evaluated. The tests of each sample were based on 25 cycles. Figure 16 shows the peak power measurements of the samples. Metal EOAT, also known as the off-the-shelf EOAT, has the highest peak power measurement of 514.651 W. It resulted in having the heaviest weight among the other samples. ABS and nylon 20% samples have the lowest peak power measurement due to the reason of having the lightest weight. ABS and nylon 100% have a higher peak power measurement than ABS and nylon 20% but lower than the off-the-shelf samples. In a similar study carried out by Wyatt et al. [32], the study analyzed the power measurement of metals and composites used on the robotic arm and found that the lighter material consumes less power compared to a heavier material. The maximum payload that the FANUC Robot LR Mate 200iD is able to carry is 4 kg, which includes the weight of the EOAT. With this in mind, thermoplastics EOAT will increase the weight of the payload that the robotic arm is able to carry and also increase the efficiency of the robotic arm due to the light weight design. Increases in the power to weight ratio (see Table 2) are likely to be achieved by replacing more of the EOAT with 3D printed material; i.e., replacing suction cups, coupling device etc.
4. Conclusions
In this work, the potential of increasing the efficiency of the robotic arm using 3D printed EOAT parts in terms of strength to weight ratio application has been evaluated. Increasing the efficiency of the robotic arm performance is of the utmost importance, this is particularly the case for 3D printed parts that will be utilized in zero inventory lean manufacturing and increase the robot payload capacity where different thermoplastic materials were used to fabricate EOATs parts. With this in mind a range of thermoplastic materials with different infill densities were 3D printed and analyzed for their mechanical properties as well as flaws in the fabricated parts. Nylon samples demonstrate a higher warping deformation compared to ABS samples due to nylon having a higher shrinkage factor. It was also noted that samples with a lower infill density had a faster fabrication time.
By carrying out a density test on the samples, it was evident that samples having a higher infill density tended to be heavier as well as had a higher density compared to samples with a lower infill density. This was due to having a higher infill density, which means that more material was required to fill inside the part. Nylon samples demonstrated a higher density compared to the ABS samples.
Digital microscope tests carried out discovered the effects of the material viscosity on the air gaps and layer height of the samples and how they affect the mechanical properties of the samples. ABS materials have a higher viscosity and therefore result in a stronger bond strength between the neighboring beads. It was analyzed that the viscosity of material can have an influence on the mechanical properties of the material through the three-point flexural test. ABS with 100% infill density had the highest mechanical strength among the other samples. ABS samples exhibit a brittle behavior, whereas nylon samples exhibit a ductile behavior. ABS with 100% infill density samples demonstrated the highest strength to weight ratio of the other thermoplastic samples and even with a peak power consumption higher than the samples with 20% infill density, the peak power of 100% infill density samples is still lower than the off-the-shelfs parts. ABS with 100% infill density samples were the most promising for replacing off-the-shelfs parts of the robotic arm. The potential of the fabrication of 3D printed parts extends the increase in payload capacity and improves the efficiency of the robotic arm system.
Author Contributions
J.L. conceived of the presented idea. D.O.U.J. programmed the robot and the interface, and completed material testing. D.O.U.J. prepared the initial manuscript draft. All authors discussed the results and contributed to the final version of the manuscript.
Funding
This publication has emanated from research conducted with the financial support of Athlone Institute of Technology under the Presidents Seed Fund, Enterprise Ireland funding under the Technology Gateway program, grant number TG-2017-0114 and Science Foundation Ireland (SFI) under Grant Number 16/RC/3918.
Conflicts of Interest
The authors declare no conflict of interest.
References
- Elfasakhany, A.; Yanez, E.; Baylon, K.; Salgado, R. Design and Development of a Competitive Low-Cost Robot Arm with Four Degrees of Freedom. Mod. Mech. Eng. 2011, 1, 47–55. [Google Scholar] [CrossRef]
- Palmerini, E.; Bertolini, A.; Battaglia, F.; Koops, B.J.; Carnevale, A.; Salvini, P. RoboLaw: Towards a European framework for robotics regulation. Robot. Auton. Syst. 2016, 86, 78–85. [Google Scholar] [CrossRef]
- National Bureau of Standards; NBS/RIA Robotics Research Workshop: Washington, DC, USA, 1981.
- Al-faiz, M.Z.; Shanta, A.F. Kinect-Based Humanoid Robotic Manipulator for Human Upper Limbs Movements Tracking. Intell. Control Autom. 2015, 6, 29–37. [Google Scholar] [CrossRef]
- Zhang, Y.; Chou, K. A parametric study of part distortions in fused deposition modelling using three-dimensional finite element analysis. Proc. Inst. Mech. Eng. Part B J. Eng. Manuf. 2008, 222, 959–968. [Google Scholar] [CrossRef]
- Love, L.J.; Kunc, V.; Rios, O.; Duty, C.E.; Elliott, A.M.; Post, B.K.; Smith, R.J.; Blue, C.A. The importance of carbon fiber to polymer additive manufacturing. J. Mater. Res. 2014, 29, 1893–1898. [Google Scholar] [CrossRef]
- Casavola, C.; Cazzato, A.; Moramarco, V.; Pappalettera, G. Residual stress measurement in Fused Deposition Modelling parts. Polym. Test. 2017, 58, 249–255. [Google Scholar] [CrossRef]
- Jiang, C.; Zhao, G.-F. A Preliminary Study of 3D Printing on Rock Mechanics. Rock Mech. Rock Eng. 2014, 48, 1041–1050. [Google Scholar] [CrossRef]
- Aburaia, M.; Stuja, E.M.K. New concept for design and control of 4 axis robot usin. The additive manufacturing technology. Energy Procedia 2015, 100, 1364–1369. [Google Scholar] [CrossRef]
- Boboulos, M.A. CAD-CAM & Rapid Prototyping Application Evaluation; Bookboon: London, UK, 2010. [Google Scholar]
- Glodde, A.; Afrough, M. Energy efficiency evaluation of an underactuated robot in comparison to traditional robot kinematics. Procedia CIRP 2014, 23, 127–130. [Google Scholar] [CrossRef]
- Petrick, I.J.; Simpson, T.W. 3D Printing Disrupts Manufacturing: How Economies of One Create New Rules of Competition. Res. Manag. 2013, 56, 12–16. [Google Scholar] [CrossRef]
- FANUC Training Academy. Available online: https//www.fanuc.eu/fi/en/lifetime-management/academy (accessed on 20 June 2018).
- Baich, L.; Manogharan, G.; Marie, H. Study of infill print design on production cost-time of 3D printed ABS parts. Int. J. Rapid Manuf. 2015, 5, 308. [Google Scholar] [CrossRef]
- Wang, T.M.; Xi, J.T.; Jin, Y. A model research for prototype warp deformation in the FDM process. Int. J. Adv. Manuf. Technol. 2007, 33, 1087–1096. [Google Scholar] [CrossRef]
- Alsoufi, M.S.; Elsayed, A.E. Warping deformation of desktop 3D printed parts manufactured by open source fused deposition modeling (FDM) system. Int. J. Mech. Mechatron. Eng. 2017, 17, 7–16. [Google Scholar]
- Christiyan, K.G.J.; Chandrasekhar, U.; Venkateswarlu, K. A study on the influence of process parameters on the Mechanical Properties of 3D printed ABS composite. IOP Conf. Ser. Mater. Sci. Eng. 2016, 114, 012109. [Google Scholar] [CrossRef] [Green Version]
- Salih, S.E.; Hamood, A.F.; Alsalam, A.H.A. Comparison of the characteristics of LDPE: PP and HDPE: PP polymer blends. Mod. Appl. Sci. 2013, 7, 33–42. [Google Scholar] [CrossRef]
- Ahn, S.; Montero, M.; Odell, D.; Roundy, S.; Wright, P.K. Anisotropic material properties of fused deposition modeling ABS. Rapid Prototyp. J. 2002, 8, 248–257. [Google Scholar] [CrossRef] [Green Version]
- Ramanath, H.S.; Chua, C.K.; Leong, K.F.; Shah, K.D. Melt flow behaviour of poly-ε-caprolactone in fused deposition modeling. J. Mater. Sci. Mater. Med. 2008, 19, 2541–2550. [Google Scholar] [CrossRef] [PubMed]
- Walia, P.S.; Lawton, J.W.; Shogren, R.L.; Felker, F.C. Effect of moisture level on the morphology and melt flow behavior of thermoplastic starch/poly (hydroxy ester ether) blends. Polymer 2000, 41, 8083–8093. [Google Scholar] [CrossRef]
- Sanatgar, R.H.; Campagne, C.; Nierstrasz, V. Investigation of the adhesion properties of direct 3D printing of polymers and nanocomposites on textiles: Effect of FDM printing process parameters. Appl. Surf. Sci. 2017, 403, 551–563. [Google Scholar] [CrossRef]
- Turner, B.N.; Strong, R.; Gold, S.A. A review of melt extrusion additive manufacturing processes: I. Process design and modeling. Rapid Prototyp. J. 2014, 20, 192–204. [Google Scholar] [CrossRef]
- Alic, A.; Zitko, R. Physics of 3D Printing; Seminar Ib: Ljubljana, Slovenia, 2017. [Google Scholar]
- Halidi, S.N.A.M.; Abdullah, J. Moisture effects on the ABS used for Fused Deposition Modeling rapid prototyping machine. In Proceedings of the 2012 IEEE Symposium on Humanities, Science and Engineering Research, Kuala Lumpur, Malaysia, 24–27 June 2012; pp. 839–843. [Google Scholar]
- Vigliotti, A.; Pasini, D. Stiffness and strength of tridimensional periodic lattices. Comput. Meth. Appl. Mech. Eng. 2012, 229–232, 27–43. [Google Scholar] [CrossRef]
- Song, J.; Helmig, C.; Schulz, A. Bending Test of Contact Materials. In Proceedings of the 52nd IEEE Holm Conference on Electrical Contacts, Montreal, QC, Canada, 25–27 September 2006; pp. 207–210. [Google Scholar]
- Belter, J.T.; Dollar, A.M. Strengthening of 3D printed fused deposition manufactured parts using the fill compositing technique. PLoS ONE 2015, 10, 1–19. [Google Scholar] [CrossRef] [PubMed]
- Soares, F.A.; Nachtigall, S.M.B. Effect of chemical and physical foaming additives on the properties of PP/wood flour composites. Polym. Test. 2013, 32, 640–646. [Google Scholar] [CrossRef]
- Peirson, B. Comparison of Specific Properties of Engineering Materials. In EGR 250—Materials Science and Engineering; Laboratory Module, School of Engineering, Grand Valley State University: Allendale, MI, USA, 28 June 2005. [Google Scholar]
- Helms, H.; Lambrecht, U.L. The potential contribution of light-weighting to reduce transport energy consumption. Int. J. Life Cycle Assess 2007, 12, 58–64. [Google Scholar]
- Wyatt, H.; Wu, A.; Thomas, R.; Yang, Y. Life Cycle Analysis of Double-Arm Type Robotic Tools for LCD Panel Handling. Machines 2017, 5, 8. [Google Scholar] [CrossRef]
Figure 1.
(a) Robot Control Isolator. (b) FANUC Robotic Arm. Adapted from [13].
Figure 1.
(a) Robot Control Isolator. (b) FANUC Robotic Arm. Adapted from [13].

Figure 2.
Pick and place task.

Figure 3.
Illustrate a profile model designed in SolidWorks 2017. (a) Front view. (b) Top view.

Figure 4.
Illustrate the infill density of the printed profile part. (a) 20% infill density. (b) 100% infill density.
Figure 4.
Illustrate the infill density of the printed profile part. (a) 20% infill density. (b) 100% infill density.

Figure 5.
Three Point Flexural.

Figure 6.
Illustration of the assembled End of Arm Tooling (EOAT). (a) Off-the-shelf EOAT parts. (b) EOAT parts drawn by SolidWorks.
Figure 6.
Illustration of the assembled End of Arm Tooling (EOAT). (a) Off-the-shelf EOAT parts. (b) EOAT parts drawn by SolidWorks.

Figure 7.
Illustrate profile bar part drawn using SolidWorks.

Figure 8.
Illustrate the fabricated profile bar with deformation towards the bottom layer. (a) ABS. (b) Nylon.
Figure 8.
Illustrate the fabricated profile bar with deformation towards the bottom layer. (a) ABS. (b) Nylon.

Figure 9.
Average density of 20% and 100% infill density of ABS and nylon samples.

Figure 10.
Average absolute deviations associated with each group investigated (ABS 20%, Abs 100%, nylon 20%, nylon 100%).
Figure 10.
Average absolute deviations associated with each group investigated (ABS 20%, Abs 100%, nylon 20%, nylon 100%).

Figure 11.
Rheology test for ABS and nylon.

Figure 12.
This is image is a representative of each categories of samples. (a) ABS with 20% infill density. (b) ABS with 100% infill density. (c) Nylon with 20% infill density. (d) Nylon with 100% infill density.
Figure 12.
This is image is a representative of each categories of samples. (a) ABS with 20% infill density. (b) ABS with 100% infill density. (c) Nylon with 20% infill density. (d) Nylon with 100% infill density.

Figure 13.
Flexural Behavior selected samples.

Figure 14.
Weights of the EOAT.

Figure 15.
Pick and place task (a) Picked up the part from point A. (b) Moved the part from point A to Point B.
Figure 15.
Pick and place task (a) Picked up the part from point A. (b) Moved the part from point A to Point B.

Figure 16.
Power measurement of first phase of movement.


Table 1.
Specific flexural yield strength of the samples.
| Material | Density (g/cm3) | Flexural Strength, Yield (MPa) | Specific Strength (kN·m/kg) |
|---|---|---|---|
| Metal (Al) | 2.70 | 67.021 | 24.823 |
| ABS 20% | 0.848 | 3.041 | 3.586 |
| ABS 100% | 0.992 | 7.237 | 7.295 |
| Nylon 20% | 0.892 | 2.162 | 2.424 |
| Nylon 100% | 1.036 | 4.479 | 4.323 |
Table 2.
Normalized Efficiency.
| Material | Weight (g) | Power (W) | Power to Weight Ratio (W/Kg) |
|---|---|---|---|
| Metal (Al) | 226.51 | 514.641 | 2272 |
| ABS 20% | 145.78 | 486.377 | 3336 |
| ABS 100% | 155.34 | 495.992 | 3192 |
| Nylon 20% | 147.49 | 485.234 | 3289 |
| Nylon 100% | 156.65 | 497.991 | 3179 |
© 2018 by the authors. Licensee MDPI, Basel, Switzerland. This article is an open access article distributed under the terms and conditions of the Creative Commons Attribution (CC BY) license (http://creativecommons.org/licenses/by/4.0/).
Share and Cite
MDPI and ACS Style
Ong U Jing, D.; Devine, D.M.; Lyons, J. 3D Printed End of Arm Tooling (EOAT) for Robotic Automation. Robotics 2018, 7, 49. https://doi.org/10.3390/robotics7030049
AMA Style
Ong U Jing D, Devine DM, Lyons J. 3D Printed End of Arm Tooling (EOAT) for Robotic Automation. Robotics. 2018; 7(3):49. https://doi.org/10.3390/robotics7030049
Chicago/Turabian StyleOng U Jing, Daniel, Declan M. Devine, and John Lyons. 2018. "3D Printed End of Arm Tooling (EOAT) for Robotic Automation" Robotics 7, no. 3: 49. https://doi.org/10.3390/robotics7030049
Note that from the first issue of 2016, this journal uses article numbers instead of page numbers. See further details here.