1. Introduction
Geospatial information is increasingly recognized as the common denominator in both today’s “web 2.0” peer-to-peer social network era and tomorrow’s “web 4.0”—where it is envisioned that the Internet becomes connected to trillions of micro-sensors placed into real-world objects of all types (
i.e., mechanical and non-mechanical), all with their own unique 128 bit IP address [
1]. In other words, a location aware
Internet of Things (iThings) that could theoretically collect and send time-stamped data to the cloud continuously about their position, movement, plus any number of other measureable phenomena, e.g., environmental data such as air/water quality, ambient light/noise/radiation data, energy consumption,
etc. When the potential of such a geospatial sensor web becomes realised, every feature of every building, every object on every street, every road sign, traffic light, street light, and shrub could conceivably be individually communicating their whereabouts and local conditions to the world. In such a world, the ability to find, interrogate, and filter out, both semantically and spatially, unwanted/unnecessary/unsolicited information while at the same time retrieve task-relevant data for making informed decisions will be paramount.
Today’s new smartphones (e.g., iPhone, Android Phone) are rapidly evolving as enhanced computing platforms in terms of hardware/software specifications and capabilities (e.g., more powerful CPU, larger RAM/storage capacity, touch screen interfaces). In particular, a noticeable trend of integrating location and orientation aware sensors (i.e., GPS receiver, digital compass and accelerometer) into mobile devices has significantly promoted the development of smartphones as tools to retrieve, analyze, and visualize information from the geospatial web. However, even now a data visualisation problem arises as the amount of Internet information available for spatial query and display is somewhat overwhelming for these devices and their users alike. For example, when trying to familiarize oneself in an unknown environment—e.g., “What are these buildings around me?” or, “What points-of-interest (POIs) are nearby?” or, “What are the air pollution levels along this street?”—display clutter or “information overload” can become a significant problem. This can cause confusion and disorientation for the user, and general annoyance and apathy towards the usefulness of any Location-Based Service (LBS) application.
In mobile spatial interaction (MSI) research, how to address the problem of optimizing information to personal needs through intelligent retrieval and display is essentially at the heart of this process. Previous work in this regard proposed a Local Visibility Model which searches for information by considering a user’s actual field-of-view [
2]. In [
3], a 2D directional-query processor is built on a similar visibility model, where building block outlines are treated as “footprints” used to geographically clip the visible search space in the horizontal plane. Other approaches for reducing information overload look at using map personalisation techniques that monitor past user task/map behaviour to assist and/or recommend next levels of display detail [
4,
5,
6,
7]. Semantic based filtering mechanisms are designed to exploit ontologies and RDF (Resource Description Framework) descriptions of linked data and networked knowledge to essentially de-clutter and adapt the exploration of the real world to the processing/display limitations of mobile devices [
8]. In our era of ever increasing multi-sensored urban landscapes, we propose yet another way to improve contextual relevance for users is to spatially filter this mounting data store by intelligently refining the search space in three dimensions.
3DQ (Three Dimensional Query) is our novel MSI prototype for calculating the three dimensional visibility shape (Vista space) at a user’s current location out to the horizon in a built environment.
3DQ then utilizes this shape as a query “window” to retrieve information on only those objects/sensors enabled “things” visible within a user’s 3D field-of-view as they move through the cityscape. Visibility shape searching addresses the information overload problem by providing “Hidden Query Removal” (HQR) functionality to heighten situation awareness on these commercial off-the-shelf (COTS) devices. In
3DQ we extend contemporary 2D buffer type range query functionality found in many of today’s mobile LBS applications to now incorporate database objects and spaces in the vertical dimension. More specifically, we move from traditional GIS desktop processing environments to a visibility query paradigm tailored to function in urban environments on smartphones. The result is a more accurate and expected search result for mobile LBS applications by returning information on only those objects visible within a user’s actual 3D field-of-view (
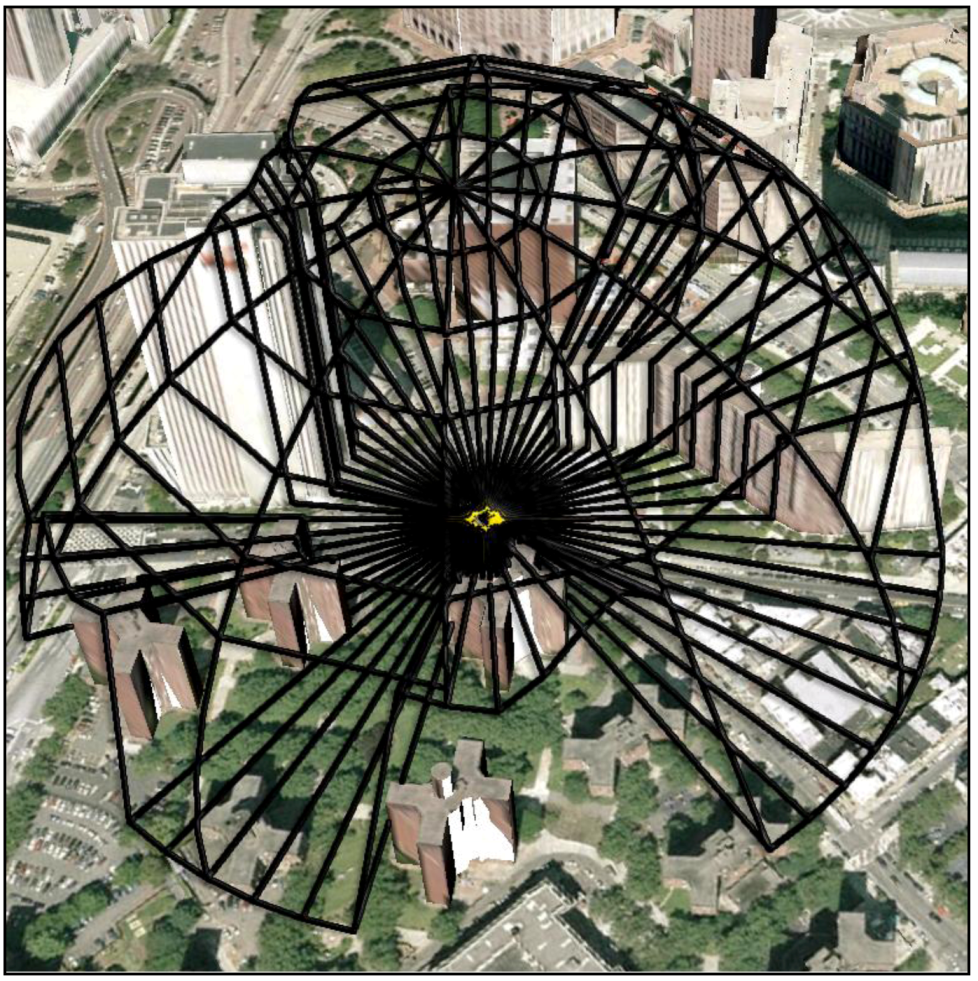
Figure 1). Contrary to this visibility query, retrieving objects that are just out of sight would be possible by subtracting the visible resultset from a standard 2D range query cast at the same location.
Figure 1.
3DQ search space interacting with a 3D cityscape model; only things intersecting the dome shaped volume get returned by the query.
Figure 1.
3DQ search space interacting with a 3D cityscape model; only things intersecting the dome shaped volume get returned by the query.
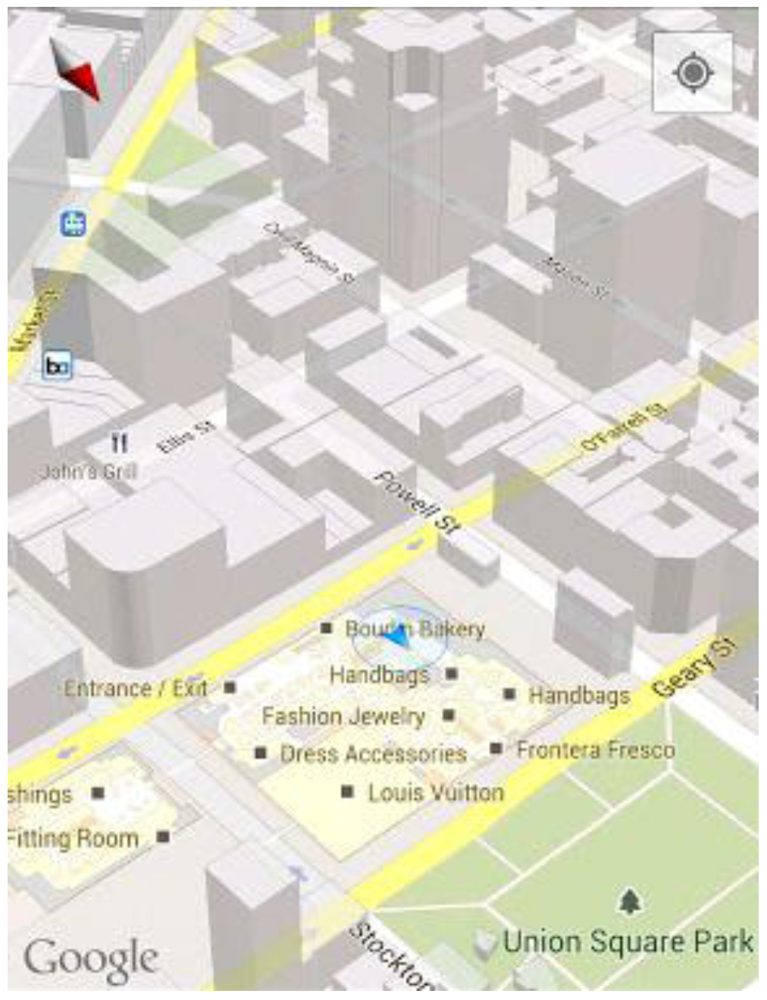
Visualisation of 3D built environment datasets on mobile COTS devices (e.g., Google Maps 5 for Android 2.3+) is now also a reality. This is made possible by rendering the mobile map from a single set of vector data instead of multiple sets of raster image tiles, thus allowing for smooth and continuous map viewing and scaling from different perspectives using the same set of vector data. Although Google Maps 6 is not yet photo realistic, the resulting 3D models are close to being geometrically accurate as they are derived from extruding building footprints to known heights for different parts of a building (
Figure 2).
Figure 2.
3D tilt, zoom, and rotation enabled mobile map displayed in Google Maps 6 for Android devices [
9].
Figure 2.
3D tilt, zoom, and rotation enabled mobile map displayed in Google Maps 6 for Android devices [
9].
To make our 3DQ prototype function effectively in real-time requires mobile spatial query techniques that extend today’s spatial database technology both on the server and on the mobile device itself. This paper describes the various mobile spatial query algorithms developed and results of tests carried out on a sample 3D vector dataset of Dublin City. The ultimate goal is for this research to act as a next-generation base for human interaction with the geospatial sensor web. To facilitate dynamic and real-time visualisation on a smartphone of 3D search spaces overlaid on a 3D mobile map, together with links to any returned query results attached to the dome. Therefore, a significant research challenge was to efficiently and accurately calculate the underlying visibility query shapes (2D and 3D Isovists) for each user location.
The remainder of this paper is organized as follows:
Section 2 introduces
3DQ system design and implementation, which also includes an introduction to the vector datasets utilized in our work.
Section 3 describes our main contributions by presenting a comprehensive discussion of the query algorithms and implementation of the
3DQ prototype. This is followed in
Section 4 by some evaluations of the performance of
3DQ in terms of query speed
vs. accuracy when using different search algorithms and parameters. Conclusions and plans for Future Work follow in
Section 5.
2. 3DQ System Design and Implementation
2.1. System Architecture
Considering the volumes of geo-referenced data already available in today’s geospatial web—much of it volunteered [
10]—plus the added legacy of various mapping agency built environment datasets, it is still not practical to accomplish all processor-demanding tasks efficiently on the mobile device itself. In such cases, a “client-server” architecture is the preferred option where calculation intensive tasks are carried out server side, leaving the mobile device as a thin client to take care of sending requests, receiving responses, and displaying query results to the users. In fact, the client-server communication paradigm remains a key element of many contemporary LBS implementations [
11,
12].
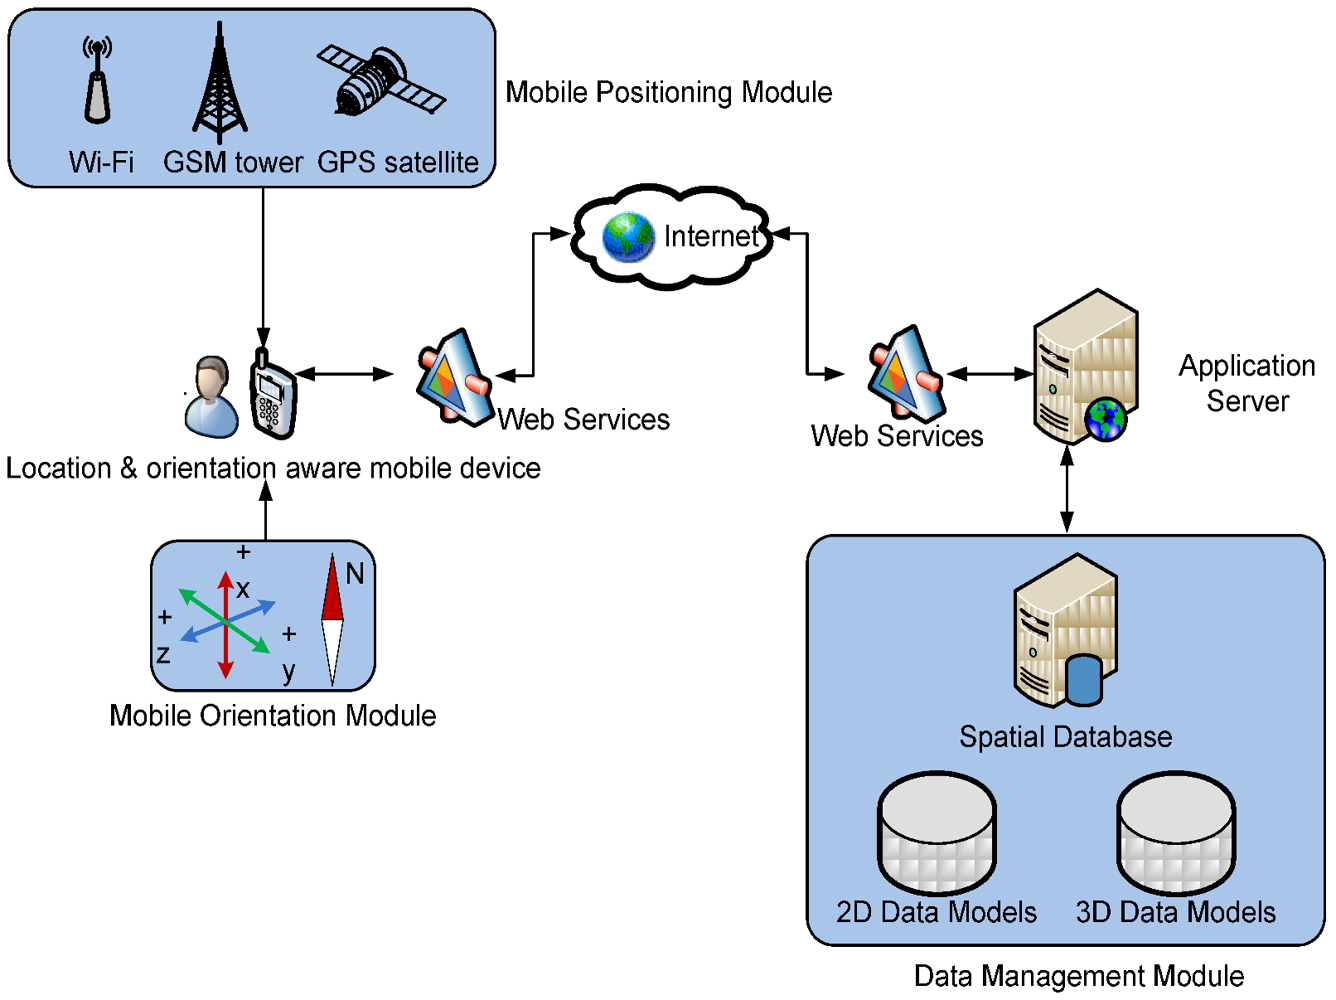
Figure 3.
Component diagram for the overall 3DQ system architecture.
Figure 3.
Component diagram for the overall 3DQ system architecture.
Due to the variety of competing mobile operating systems in existence (e.g., iPhone OS, Nokia Symbian/Windows Phone8, Google Android),
3DQ delivers mobile spatial querying as a browser friendly web-service to avoid multiple proprietary implementations. Our services utilize the
RESTful format, where a mobile device client collects readings from its integrated sensors (e.g., GPS, compass, accelerometer), constructs them into a standard URL, and sends them to the server for processing. Once the server finishes with the query operations, the resultset is organized and sent back in
GEO-JSON format, which is OGC standard compatible and completely text based [
13]. A component diagram for the overall system architecture of
3DQ is shown in
Figure 3, where communication between client and server follows the above mentioned approach whilst 2D and 3D spatial datasets (e.g., objects from the geospatial web, 2D/3D built environment models) reside in spatial databases on the server side.
In addition to the standard LBS client-server approach, we also adopt the latest open source technologies for client side spatial computing to store and index data, and perform computational tasks locally on the mobile device itself. For example, with the help of a portable spatial database (SpatiaLite) and raster map rendering software (TileMill), we can perform all 2D query functionalities locally and subsequently visualize the results on locally stored mobile maps in “off-line” (
i.e., no network connection) mode [
10].
2.2. Vector Dataset Requirements
Before looking at the details of 3DQ functionality, it is important to understand what types of datasets we are processing and what kind of information we are expecting to retrieve. As discussed previously, 3DQ aims to enable mobile users to retrieve information about their surrounding environment, such as non-spatial attribute information linked to geo-referenced buildings, points-of-interest (POIs), windows, doors and any sensors/iThings that may be attached to these objects. Once the physical objects are identified first, other types of typical Internet information associated with these objects is discovered and their links presented. For instance, class schedules linked to lecture rooms in a University, or environmental data from micro-sensors installed in/on objects like buildings. Therefore, detailed datasets that portray the true 3D built-environment with high physical granularity are a prerequisite for accurate information discovery and retrieval. In a 2D scenario, many such datasets are readily available. These include collections of vector geometry which are comprised of footprint polygons or vertices of physical geo-referenced objects like buildings and street furniture. In a 3D scenario, where flat 2D footprints no longer contain enough detail of the physical objects they represent, accurate geometries of different floors of a building are re-constructed to provide links to floor level and even window/door level detailed information.
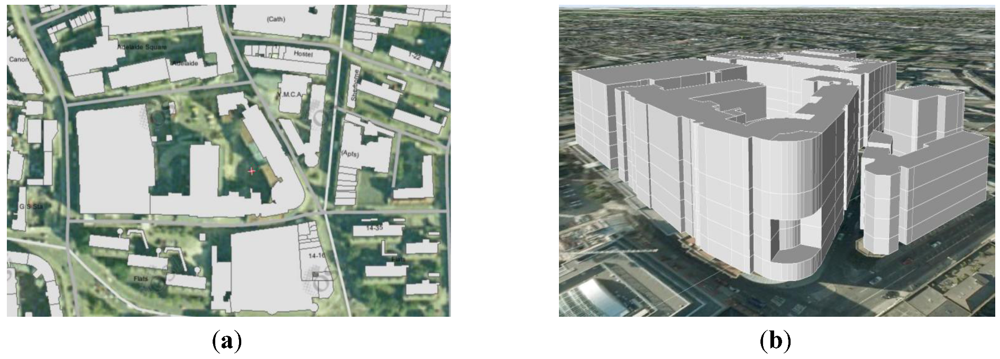
To prepare such 3D vector datasets of Dublin Institute of Technology (DIT), we attached non-spatial attributes (meta-data) to the various floors, windows, and doors of a selection of buildings, plus affixed a range of simulated environmental sensors to other scattered locations on a building’s façade. Together this provides the beginnings of a future iThings type environment for human interaction testing of our mobile 2D/3D visibility-based spatial search techniques in detailed sensor web landscapes (
Figure 4).
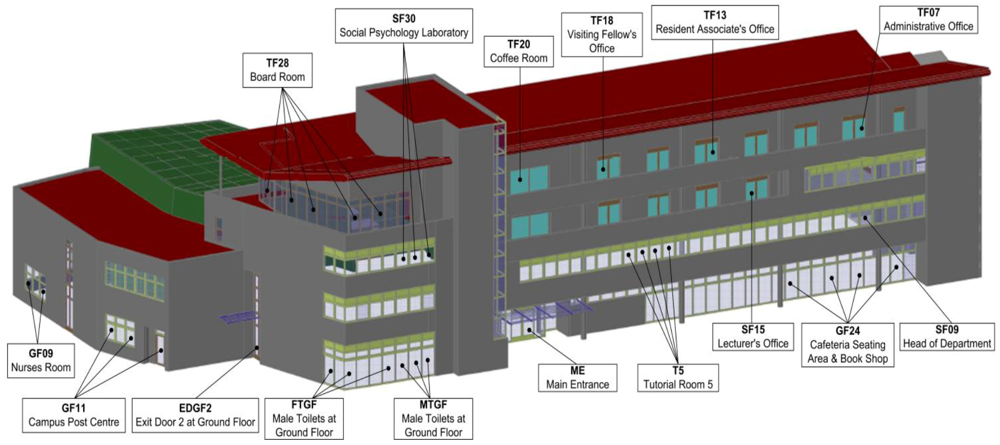
To obtain even more geometrically accurate 3D test models of a real-world environment, we also constructed 3D models using semi-automated techniques on point cloud data collected from laser scanners. While a description of this modeling process is out of scope for this paper, the results provided more accurate detail for each building, for instance, covered entrances within a façade, windows, doors, overhangs and rooflines,
etc. An example of one of these laser scanned buildings is shown in
Figure 5, where information on individual features of a building is stored and linked to external Internet sources in a spatial database.
Figure 4.
(a) 2D footprint testbed data of Dublin Institute of Technology (DIT) campus in Dublin (b) Extruded 3D building models at same location.
Figure 4.
(a) 2D footprint testbed data of Dublin Institute of Technology (DIT) campus in Dublin (b) Extruded 3D building models at same location.
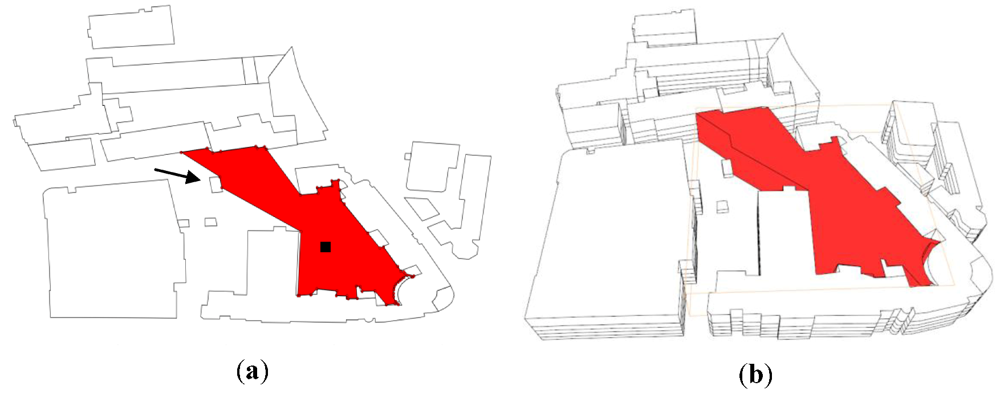
Figure 5.
A true 3D (geometrically accurate) model of a campus building derived from detailed laser scanning. Individual features are stored separately in the database.
Figure 5.
A true 3D (geometrically accurate) model of a campus building derived from detailed laser scanning. Individual features are stored separately in the database.
Three dimensional indexing is a requirement for storing and querying 3D vector objects efficiently for real-time processing, which at time of writing limits our spatial database options to Oracle Spatial 11g R2, although PostgreSQL with their anticipated PostGIS 2.0 extension for 3D indexing will be a useful open source addition to this very short list. However, we’ve uncovered clear limitations with Oracle’s spatial query operators when trying to determine spatial relationships among 3D geometries. These include creating 3D R-Tree indexes on 3D geometries using a minimum-bounding cube. Oracle only considers if these cubes intersect with one another as a method for determining whether their underlying 3D geometries actually intersect. Unfortunately, retrieving the actual 3D location where two geometries (vector objects) intersect in 3D is not yet supported.
For example, an important feature of 3DQ is to determine exactly where the intersection between a generated ray (simulating the 3D pointing direction of a smartphone) and a 3D building occurs. In this case, Oracle derives the intersection point using the 2D spatial operator SDO_INTERSECTION by first projecting the query shape (3D ray in this case) and the target (3D building) onto the ground plane and then only returning the 2D position of this 3D ray/building intersection. Using this information and combining it with the tilt angle (often approximate) and 2D distance to the nadir of the intersection point, we are left to compute the actual 3D intersection point of this query ourselves.
Also, for an accurately computed 3D Isovist volume, the generated dome shape will usually have a large number of surface elements relative to the complexity of the surrounding environment. If we want to consider this dome as a single 3D query shape (surface) in the form of an Oracle SDO_GEOMETRY (in order to make use of the SDO_INTERSECTION query operator), we find that its total number of surface elements will typically exceed the number of elements allowed in the SDO_ELEM_INFO_ARRAY—where it seems an arbitrary maximum of 999 coordinates (i.e., 333 3D points) are permitted.
In our case, where each surface element contains 12 coordinates defining its shape (four 3D vertices), a maximum of only 27 surface elements are then allowed in one SDO_ORDINATE list. As it happens, this is typically far fewer than what is required to accurately describe the boundary of a complete 3D visibility dome shape. To get round this limitation, we must first split the complete query dome into three or more sections and then query them individually against the database—instead of creating a single 3D volume as the query shape. The returned query results are then a sum of all object/section intersections after first removing any duplication. Ironically, one beneficial consequence of this extra processing is that it encouraged us to mirror the spatial database across multiple servers and then send each individual 3D dome section query to a separate database. The result is a much faster (~2 seconds) query process which potentially allows for near real-time query dome visualisations and searching on 3D mobile maps—one of the human interaction objectives for our work.
2.3. Commercial Software Alternatives
Some visibility based spatial analysis methods are also available in contemporary desktop GIS platforms. For example, ArcGIS provides two main toolkits for 3D visibility analysis; line-of-sight and 3D view-shed. However, these two commercial implementations differ from our approach in that 3DQ derives the 3D visibility shape first and then uses this 3D shape as a search “window” in a spatial database to retrieve attribute information about the user’s surrounding environment. Instead, the ArcGIS line-of-sight function is designed mainly for the purpose of architectural planning, where a single ray is used to represent visibility in a particular direction to determine whether this ray interests with any objects (e.g., buildings) in the plane—and which part of the ray is visible and which is not—without retrieving any information about the objects that it intersects.
In the case of ArcGIS 3D view-shed analysis, it is usually performed over a set of digital elevation models (DEM) without considering built environment objects. One example application is to determine an optimal site for setting up a radio station transmitter by taking into account ground fluctuations in the DEM. In ArcGIS, this DEM is in raster format and results in the calculated view-shed shape to also be in DEM like raster format, which makes it not usable as a true 3D query window for searching cityscapes where task-specific attribute information retrieval is required.
Moreover, current commercial visibility-based analysis methods are normally developed for desktop GIS environments, therefore not ideally suited for deployment in mobile applications. For example, in desktop GIS a user’s surrounding environment is considered static (i.e., the environmental setting does not change dynamically). Whereas in our application a user’s surrounding environment is dynamically pulled from the spatial database based on the user’s current mobile location and other query parameters. In this way, we can optimize the speed and efficiency of the system without ever loading the entire dataset, especially important when linking spatial and non-spatial attribute datasets covering a large region.
3. 3DQ Spatial Search Algorithms
Since the introduction of the “Isovist” concept in [
14] for describing the 2D visibility shape or 3D visibility volume at a given position, there have been a number of developments that employ Isovist-like approaches for urban environment analysis. The notion of a “Spatial Openness Index” (SOI) developed in [
15,
16] measures the volume of visual perception within a surrounding sphere from a given point of view, but without defining its shape. Other techniques to measure 2D and 3D visibility in an urban environment are shown in [
17], which calculate the visibility of pixel coordinates on Digital Elevation Models (DEMs). Their proposed “iso-visi-matrix” claims to be very useful from a visual perception viewpoint. Different to these approaches, visibility modeling algorithms developed in [
18,
19], calculate the visibility of local landmarks in an urban context. They determine the visibility of a “Feature of Interest” (FOI) for LBS applications that notify users when they are in a position that can actually see those landmarks.
3DQ acknowledges the importance and usefulness of carrying out 2D/3D visibility based analysis in the urban environment and aims to extend this idea by exploiting the actual 3D visibility shape (volume) as a query “window” in a spatial database to retrieve information on only those objects that a user can physically see from their given viewpoint.
When calculating 3D Isovists, a user’s visual perception is usually simulated and interpreted as a collection of “sight lines” or “line-of-sight” collisions with spatial objects in the environment [
20]. In this regard, the technique of ray casting is a common approach to determine sightline/object intersections where the collective intersection points of collisions eventually form the visibility shape used as the 3D query window. In most modern computer gaming applications, collision detection techniques are very well developed to determine and render only those visible objects in a game scene to optimize display speed. However, those type of calculations are normally Boolean value based operations, which means if the ray hits an object the returned value is “true”, but without any coordinate detail. For the purpose of computer graphics layered rendering, this technique (without further calculation of the intersection point) are proven to be quite efficient [
21,
22,
23]. However, our
3DQ prototype requires more than just determining which objects constitute a scene from a user’s viewpoint, we also need the 3D Isovist shape itself to determine where objects (e.g., buildings, sensors, linked Sensor Web information) are intersected. Therefore, accurate vertices (intersection points) of the visibility shape are necessarily required to form the corresponding query volume in a spatial database for subsequent spatial query processing operations.
In a 2D scenario, the vertical dimension of a built environment is ignored in favour of the geometry of building footprints on the horizontal plane. Ideally, the length of a ray, which simulates a sight line from a user’s view point, shall be infinite unless it hits an object along its path. However, to speed up the query calculation, this distance can be user definable from 10 s to 1,000 s of metres. For most cases in Dublin, we find that a search length (user’s perception distance) of around 200 m is in most cases still further than a person can actually see in any one direction. The footprints used to load the built environment around a user’s vicinity in our case, therefore, was limited to a 200 m radius in all directions. Setting a radius limit helps to speed up considerably the query calculation without significantly impacting the final shape of the query space in most cases—important if the user is interested in exploring more their immediate environment only.
An example of a visibility search in a 2D environment (
i.e., 2D Isovist) at a given location is shown in
Figure 6(a). The black square represents the user’s current location which is picked up from GPS on the mobile device. The surrounding built environment is constructed from the footprints of all building blocks within 200 m. Benefiting from R-Tree indexing in Oracle Spatial 11g, the retrieval of all buildings from a given location is quite efficient [
24]. The filled irregular shaped polygon is the user’s 360° visibility shape at that location. This 2D Isovist shape is then utilized as the query window (polygon) to retrieve all database objects that intersect it. The Isovist construction process is based on the method developed in [
25], which is an open source library for fast 2D floating-point visibility algorithms. Moreover, the 360° viewshed can be changed to any angle (via onboard mobile camera zooming) to simulate a user’s actual 2D “Field-of-View” or to 0° to correspond to a single ray pointed in the direction the mobile device is facing. This variation of viewshed angle provides flexibility for users to spatially filter any query results returned from the Sensor Web.
Figure 6.
(a) 2D Isovist view (b) Extruded 2.5D Isovist in a 3D environment.
Figure 6.
(a) 2D Isovist view (b) Extruded 2.5D Isovist in a 3D environment.
The 2D Isovist query is especially useful for conventional 2D mobile map searches, where it can serve as the preliminary filter to reduce the sometimes overwhelming amount of Internet information available at a given location. However, as Google Maps 6 has now progressed 2D mobile maps into 3D, a more realistic look and feel of the urban landscape is available. Although, with this added vertical dimension come 3D visibility calculations that are much more complicated than in 2D. For instance, the arrow in
Figure 6(a) points to a small building block where a 2D Isovist ray originating from the user's current position (black square) gets truncated. But this building’s height is much lower than the surrounding buildings so a user’s sight line can in fact see over top of this small block. Although computationally fast, to simply extrude a 2D Isovist to 2.5D, as shown in
Figure 6(b), would be incomplete as it does not pick up on this height difference. In fact, the results retrieved from an extruded 2.5D Isovist would be no different than those returned from a 2D Isovist, as the 3D coordinates for each returned object have the same x and y values. Yet, to derive an accurate 3D Isovist as described in [
26] is far too calculation intensive for real-time visualisation and searching and therefore not optimal for serving multiple users as a mobile web-service. Therefore, we developed ray casting techniques on vector datasets using a user defined radius to help save computation effort. Thus the final query shape of the 3D Isovist appears as the “dome” shape shown in
Figure 1 where the vertices that form the dome are the intersection points between each ray and any objects the ray hits, in this example out to 200 m.
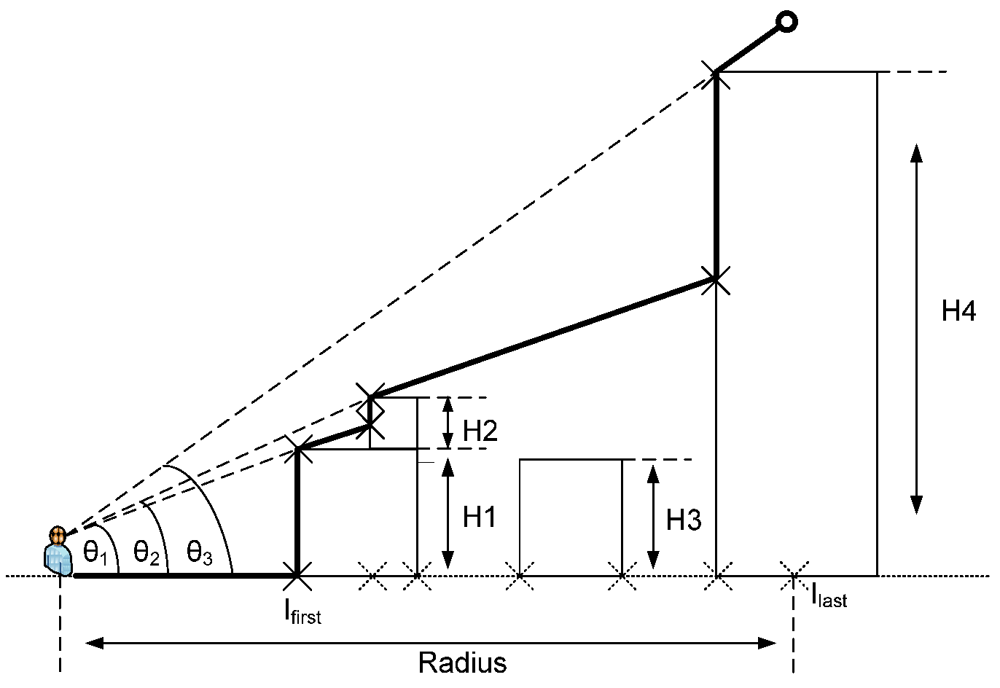
To overcome this 2.5D Isovist limitation, our first test includes an example demonstrating how 3D object intersection vertices are detected using
Search Algorithm 1 (
Figure 7). In this illustration, assume building blocks with different heights are along the path an Isovist ray travels. On the horizontal plane, the interval between each ray is predefined at 6° by default (horizontal ray spacing). While on the vertical plane, we first detect what objects the ray hits and then calculate the corresponding 3D intersection point. The next ray along this same horizontal direction is cast with a tilt angle of 15° and so on (vertical ray spacing) up to 90° declination.
As mentioned previously, Oracle Spatial does not return the exact 3D intersection point when a ray hits the building blocks. Instead, it projects the ray and building blocks onto a horizontal plane and returns a collection of 2D line segments. The intersection point is then determined by getting the first intersection point from all the segments, together with the tilting angle θ. The ray then continues to detect the next intersection point and so on until it stops when titling angle θ reaches 90°. This approach takes advantage of the 3D spatial indexing and query operators provided by Oracle Spatial and is a good first approximation of the true dome shape. However, it can be seen in
Figure 7 that constructing an Isovist dome using the tilting angle approach may miss certain intersection points vertically as a ray may overpass a building block due to the gap between any two fixed tilting angles.
The pseudo code for Search Algorithm 1 follows:
Algorithm 1: Tilting Ray Approach.
![Ijgi 02 00135 i001]()
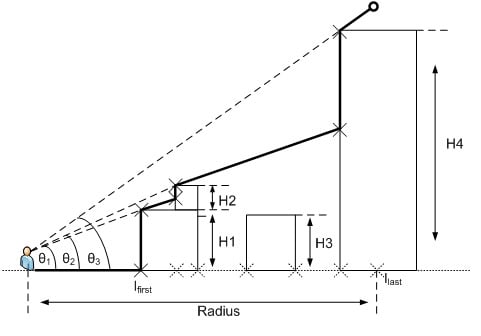
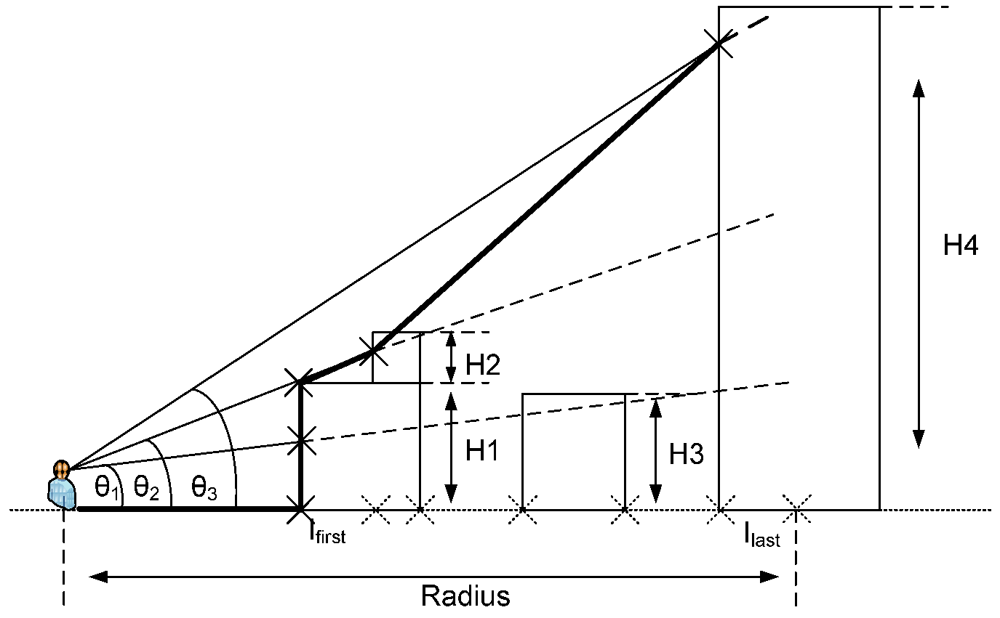
Our second test improves on Algorithm 1 by removing any vertical gaps in the projected Isovist rays.
Search Algorithm 2 acts like a “reverse water-flow”, where the ray does not stop at an intersection point but instead continues on along the same direction to determine the next intersection and the next until it finally stops at the specified radius (
Figure 8). The process starts by first determining the intersection points between each Isovist ray and the building block footprints in the horizontal plane at pre-defined intervals (6° horizontal ray spacing). The actual intersections are a list of line segments and each of them has a pair of intersection points <I
in, I
out>. The collection of I
in points gets ordered by their distance from the user’s location. We then determine the first intersection point I
first, which represents the first hit between a ray and a database object. The ray restarts from I
first and a tilting angle θ
1 is initialized once it reaches the top of the building. The next calculation happens at the next I
in point in the list, where if the height of the ray at that point is higher than the height of the building, the process carries on to the next I
in point in the list, otherwise, a new tilting angle is established and the same process iterates to the next I
in point.
Figure 7.
Search Algorithm 1 determining sight line intersections in a true 3D environment. The thick black line outlines the final query boundary shape of the 3D Isovist dome in this direction.
Figure 7.
Search Algorithm 1 determining sight line intersections in a true 3D environment. The thick black line outlines the final query boundary shape of the 3D Isovist dome in this direction.
Figure 8.
Search Algorithm 2 determining sight line intersections in a true 3D environment.
Figure 8.
Search Algorithm 2 determining sight line intersections in a true 3D environment.
Another advantage of Search Algorithm 2 is that instead of using vertical ray spacing to generate multiple rays in the same direction, it only needs to process one ray on the horizontal plane and then collect the height information of all building blocks along its path. In Algorithm 2, the 3D building objects, which are represented as solids in Oracle Spatial, are replaced as 2.5D data structures with a height value attached as a non-spatial attribute to each building footprint. Therefore, it can benefit from 2D spatial indexing when deriving the initial intersection list, which has a simpler and much faster data structure than 3D spatial indexing.
The pseudo code for Search Algorithm 2 follows:
Algorithm 2: Reverse Water-Flow Approach.
A common feature found in both
3DQ Algorithms 1 and 2 is a pre-defined horizontal ray spacing. However, no matter how small this interval is, there is still a risk of missing certain intersection points, which reduces the ultimate accuracy of the final query shape. As noticed in the 2D Isovist calculation in
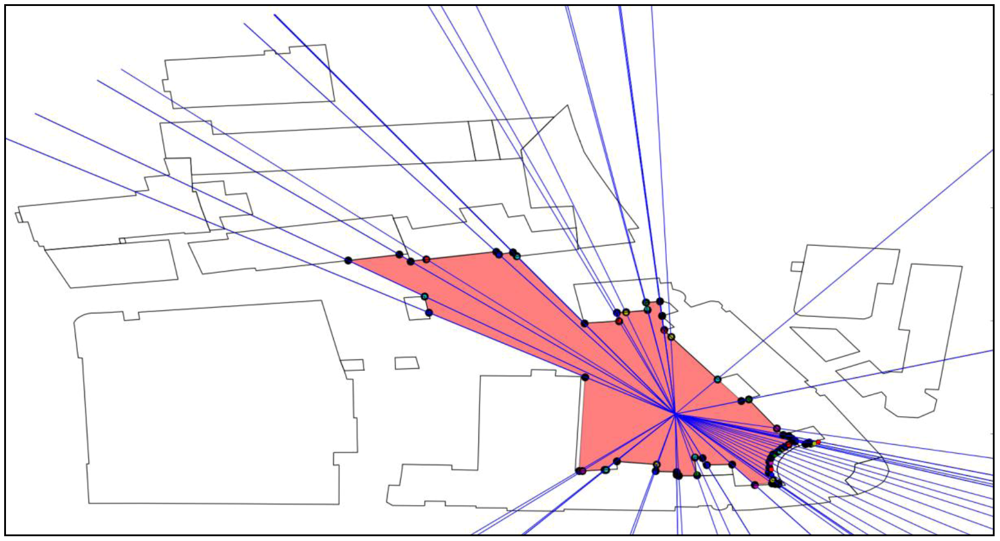
Figure 6(a), the 2D visibility shape is continuous at filling every visible corner/gap between building geometries. Our third test therefore applies Algorithm 2 on top of a 2D Isovist shape. Once the 2D Isovist is calculated, each vertex of the Isovist polygon together with the user’s location defines a ray direction. An example is shown in
Figure 9, where rays travel through each of the vertices of a 2D Isovist polygon instead of being evenly spaced by a constant angular value. Although it involves two steps of processing, Algorithm 3 produces a more accurate representation of true 3D visibility space.
Figure 9.
An example of generating horizontal rays out to the user specified radius and through the vertices of 2D Isovist/building footprint intersections.
Figure 9.
An example of generating horizontal rays out to the user specified radius and through the vertices of 2D Isovist/building footprint intersections.
The pseudo code for Search Algorithm 3 follows:
Algorithm 3: 2D Isovist Based Ray Sweeping Approach
As mentioned previously, in an accurately computed 3D Isovist, the generated dome will usually have a large number of surfaces relative to the complexity of the surrounding environment. Due to feature storage limitations with Oracle Spatial DBMS, we must therefore split the complete dome shape into three sections and then query them individually against the database—instead of creating a single 3D volume for the query shape. This led us to mirror the spatial database across three servers and then send each individual 3D dome section query to a separate database. In today’s cloud computing era, it may be possible to deploy this approach as a cloud-based service with multiple spatial databases running in different virtual machines at the same time. The result could be a much faster query process allowing for near real-time query dome visualisations on 3D mobile maps.
4. Evaluation of Query Speed vs. Accuracy
In this section, we present the performance evaluation of our three mobile Spatial Search Algorithms implemented in terms of speed
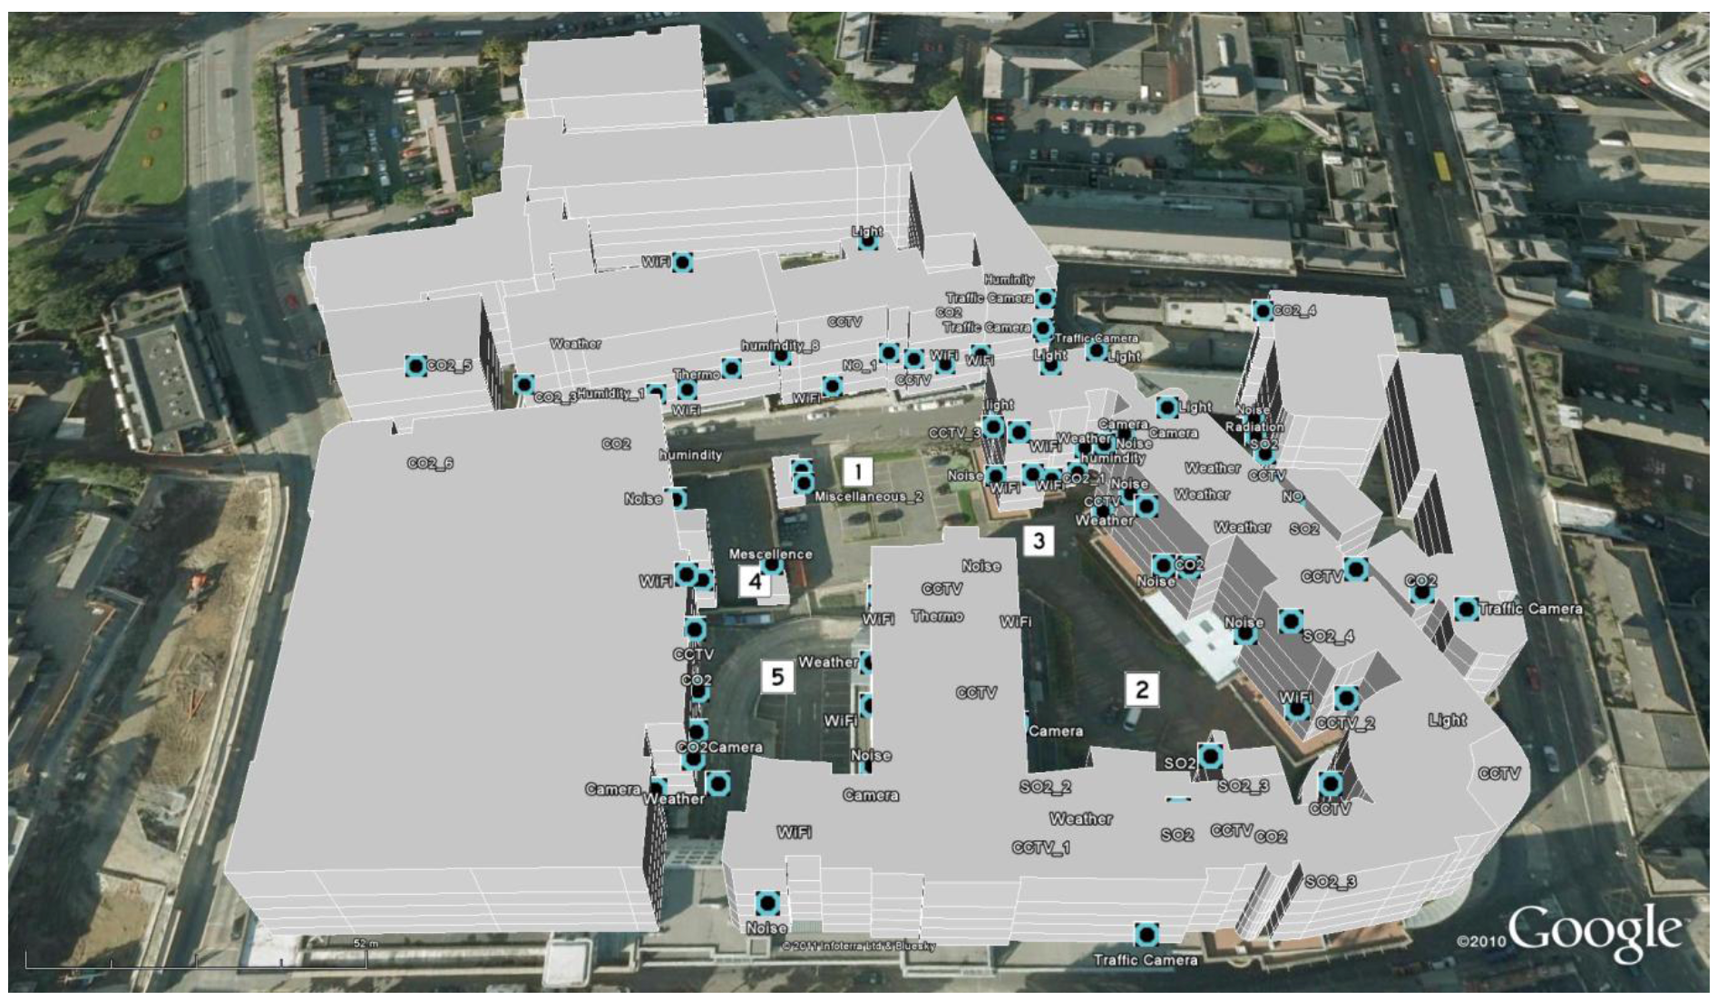
vs. accuracy. The datasets used include 2D footprints of DIT campus with actual heights stored as a non-spatial attribute, 3D wireframe building outlines stored as 3D multi-polygons, and extruded 3D solids from the 2D footprints up to known building heights. In addition, 100 3D point objects simulating environmental sensor “things” were attached to the façades of some buildings (e.g., on windows, walls, and doors) and on other objects (e.g., light posts) in the database. A screenshot of the combined test dataset is shown in
Figure 10.
Figure 10.
3D model of university campus affixed with 100 simulated environmental sensors.
Figure 10.
3D model of university campus affixed with 100 simulated environmental sensors.
The evaluation of each search algorithm was carried out at five different locations (each labeled in
Figure 10) around the campus. To test our approach on larger datasets, 2D footprints covering most of Dublin City and consisting of 345,316 polygons with height values attached as an attribute were also tested. The datasets are stored in three Oracle Spatial databases mirrored on three different machines. More specifically, machine one is running Windows 7 (32 bit) with 4G RAM and Core2Duo 2.8 GHz CPU, the other two machines are running virtual machines under Windows XP (32 bit) with 2G RAM and Core2Duo 2.2 GHz CPU. The programming language is Python 2.7 with the capability of providing OGC standard compatible
GEO-JSON output to mobile devices.
As discussed in
Section 2.2, the reason for setting up three spatial databases across different machines is because of an arbitrary limitation in the number of coordinates allowed for constructing a 3D geometry in Oracle Spatial. Our calculations for the 3D visibility shape itself are always carried out in one machine’s memory only. When using the calculated shape for the querying window, we split it into three parts to reduce the I/O load in each machine. Because
intersection is such an efficient spatial database function (requiring only fractions of seconds to compute), the arrangement of spreading a spatial database among different machines does not make much difference as it is not really a significant machine dependant calculation.
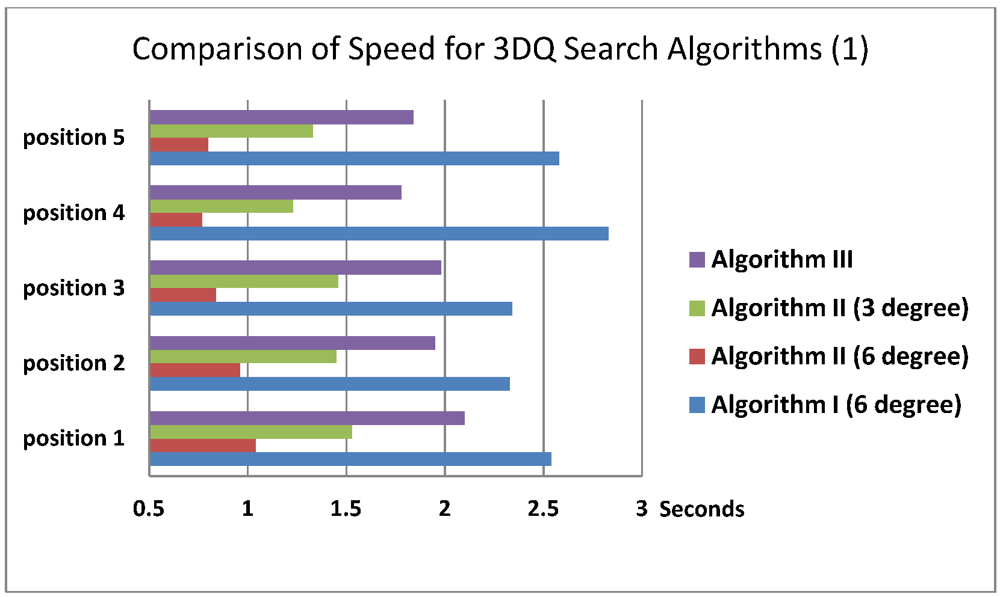
Figure 11 shows a comparison of query speed for the three different search algorithms. Search Algorithm 1 was applied to a limited 3D solid dataset of the nearby campus area while Search Algorithms 2 and 3 were applied against a complete 2D polygon map of Dublin City with building heights stored as a non-spatial attribute. Notice how 3D querying on 2D datasets proves to be usefully quicker—even though Oracle Spatial R-tree indexing limits the search space to only those database objects that are within a specified 2D radius in either case.
Figure 11.
Comparisons of query speed for different search algorithms at five positions on a small 3D solid and large 2D polygon datasets of Dublin City.
Figure 11.
Comparisons of query speed for different search algorithms at five positions on a small 3D solid and large 2D polygon datasets of Dublin City.
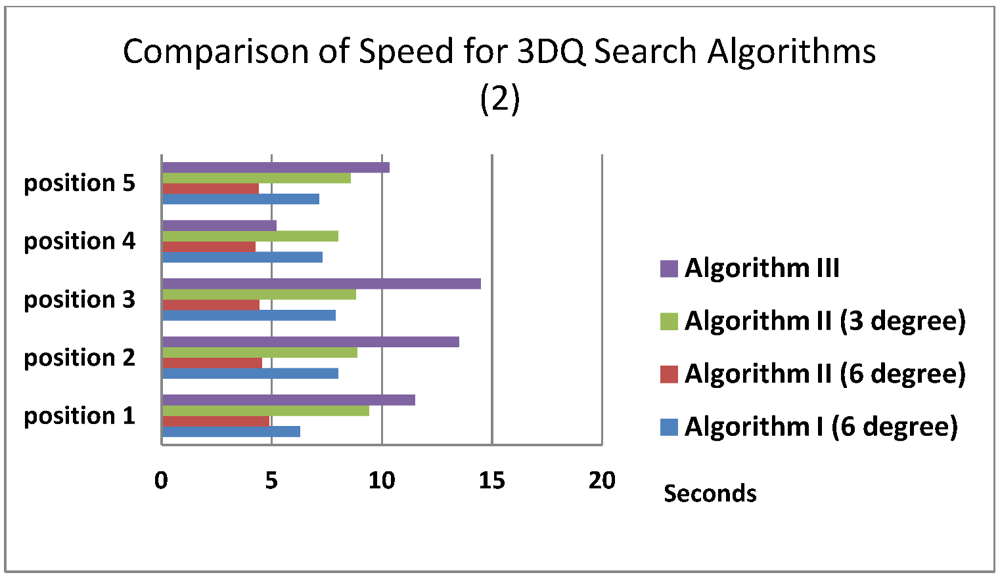
The above query speed experiment was run again on a complete Dublin City 3D solid dataset using all search algorithms. The results of this test are shown in
Figure 12. It can be seen that for each search algorithm, the time taken to complete a 3D query on 3D solid data is noticeably longer than when performed on 2D data of the same area with height stored as a non-spatial attribute. The reason for such a large dip in Algorithm 3 timings at Position 4 is because there are only 12 sensors visible due to the restricted visible search space at this location, illustrating the effectiveness of this approach for reducing information overload when dealing with large and complex spatial environments.
Table 1 shows a comparison of accuracy for all visibility query algorithms. Compared to a standard range query, where returning information on all 100 sensored iThings would overload the mobile display at every test query position, Search Algorithm 3 is shown to return most accurately the visible sensors in every query position with minimal cost to query speed (~1/2 s).
Figure 12.
Comparisons of query speed for different search algorithms at five positions on large 3D solid dataset of Dublin City.
Figure 12.
Comparisons of query speed for different search algorithms at five positions on large 3D solid dataset of Dublin City.
Table 1.
Comparisons of accuracy of three Search Algorithms at five query positions together with the maximum number of sensors actually known to be visible at each position.
Table 1.
Comparisons of accuracy of three Search Algorithms at five query positions together with the maximum number of sensors actually known to be visible at each position.
| | Position 1 | Position 2 | Position 3 | Position 4 | Position 5 |
|---|
| Algorithm I
(6° ray spacing) | 19/33 | 14/32 | 20/34 | 5/12 | 12/26 |
| Algorithm II
(6° ray spacing) | 20/33 | 18/32 | 20/34 | 9/12 | 13/26 |
| Algorithm II
(3° ray spacing) | 25/33 | 26/32 | 29/34 | 10/12 | 20/26 |
| Algorithm III | 30/33 | 29/32 | 32/34 | 11/12 | 24/26 |
5. Conclusions and Future Work
3DQ is designed to function in both today’s sensor web environments and tomorrow’s Web 4.0, where it is envisioned that trillions of micro-sensors throughout the world are capable of broadcasting all types of environmental conditions, events, and processes. As each iThing has a unique Internet ID and known coordinates, they are potentially accessible from anywhere on the Web with each event available for discovery and analysis through intelligent spatial querying. Thus the need for developing intelligent 3D spatial search techniques is clear to filter and personalise information for display on now ubiquitous, but still constrained, mobile devices. Such “situation awareness” queries would be very interesting to bikers, joggers, walkers, city workers, and all citizens who want to know, for example, the health of their immediate environment at any point in time.
Our mobile three dimensional query (3DQ) prototype provides 2D and 3D visibility based web-services for exploring today’s myriad of Internet information linked to urban landscapes directly on location and direction aware smartphones using a combination of pointing gestures and other visibility parameters. Moreover, 3DQ employs an open web-service orientated architecture that enables COTS devices to “Connect and Play” through their preferred mobile operating systems via a standard web browser.
This paper presented three mobile Spatial Search Algorithms developed for our 3DQ prototype to intelligently address the information overload problem specifically by providing “Hidden Query Removal” functionality, which contemporary mobile range queries based on bounding box or circle query shapes simply fail to do. Speed and accuracy are two very important requirements of any mobile LBS application. Among the three search algorithms tested, Search Algorithm 3 shows to be the most accurate while Search Algorithm 2 has the fastest speed. Further study into the trade-offs between speed and accuracy are underway to find the most suitable approach for deploying 3DQ in a real-world mobile eCampus application for student/staff users—currently under construction in time for the 2013 school year.
Our ultimate goal for
3DQ is to act as a next-generation base for human interaction within such geospatial sensor web environments/urban landscapes in real-time: Where the display of the 3D Isovist dome shape changes dynamically on top of a mobile 3D map as the user walks around their city, together with links to query results stitched to the dome itself. Currently, the Google Maps 6 visualisation API is not yet publically available for this, although it is expected to be released sometime in 2013. However, there are alternatives that can be used for testing in the meantime. For instance, VisioDevKit [
27] provides 3D rendering capabilities such that any visibility shape produced by
3DQ can be overlaid on the mobile display. To achieve our real-time 3D Isovist calculation/visualisation objective, improvements to efficiency in the three Search Algorithms will be further investigated. As our prototype currently adopts a “client-server” architecture, performance is mainly constrained to the latency of mobile networks. As mobile devices are becoming in time more powerful computing platforms, together with advances in open source mobile spatial database options, implementations of
3DQ Search Algorithms 2 and 3 as standalone applications entirely on the mobile device itself are other future directions for this work.
For efficient spatial querying, we consider only static locations of sensors. Although the sensor readings constantly change over time, the spatial index on their locations (point geometry in the spatial database) remains fixed. However, for efficient querying when sensor locations are dynamic (e.g., readings from mobile smartphones) the corresponding spatial index must be updated constantly, which is not optimal as the process of dropping and rebuilding spatial indexes can be time-consuming. To handle mobile sensors or more general geo-tagged streaming datasets (e.g., “big data”), future work will consider other indexing approaches for storing and retrieving great quantities of data, such as array based key-value pairs used for NoSQL databases.
In this paper, we focused on 3D algorithms for 3D visibility calculations and did not address related 3D visibility based augmented reality visualisations. Typically, mobile augmented reality applications utilize the mobile phone’s camera as the interface for users to interact with their surrounding environment. This is achieved by making use of the embedded digital compass to overlay in the camera view only information located in the same direction the device is pointing. But, in the background it uses a simple, all inclusive bounding circle to perform a spatial proximity query (range query) for retrieving any surrounding information/objects. In 3DQ, we deploy more selective 2D Isovist views and 3D field-of-view functions that apply actual visibility shapes instead of bounding circles to further refine the search shape. Future enhancements of 3DQ will also visualize retrieved results in an augmented reality camera view.
The 3DQ prototype is planned to be released for free download in 2013 on both Android and iOS platforms as part of the NUIM eCampus Demonstrator. The Demonstrator is currently under final construction with all project partners integrating the web-service functionalities developed in each collaborating research group.


