1. Introduction
As part of a larger epidemiological study examining potential health effects from exposure to wind turbines, the maps of wind farms available to researchers were inadequate for designing a study. Given that risk analyses so far have considered residents exposed when living less than 2 km from wind turbines, maps indicating the nearest community to a wind farm did not offer the precision and detail required for developing a spatial sampling framework [
1,
2]. The wind turbine map created for the purpose of this epidemiological study, as described in this paper, was used to create a buffer around each wind turbine to determine precisely where the population of interest was living. Using this information, a sampling framework and distribution method was designed and was tailored to the spatial distribution of potential participants.
Epidemiological studies that examine the potential risk that results from living near wind turbines have used surveys and self-report to determine health effects (mental and physical health), sleep disturbance, annoyance, noise sensitivity, neighbourhood type, and a variety of health symptoms [
1,
2,
3,
4]. There is not enough evidence to say whether wind turbines are a risk to health beyond annoyance [
5] although recent papers have found an impact on sleep [
2,
3], mental health [
2], and quality of life [
1] although these symptoms have been speculated to be a result of annoyance [
6]. Residents living near wind turbines claim that a variety of symptoms result from exposure including sleep disturbance, headache, tinnitus, ear pressure, dizziness, vertigo, nausea, visual blurring, tachycardia, and irritability [
7]. This symptom list is a contentious one, with some academics stating that these symptoms are common and that there are significant discrepancies in the quality of information available discussing wind turbines and health [
8].
Spatial methods have not been used to examine possible relationships between health and wind turbine exposure, although GIS has been used in some studies along with wind turbine maps for sample selection. A wind turbine map could be used to determine what the threshold is for health effects, what the prevalence of health effects are at a variety of distances, and to continue examining the factors that moderate a potential dose-response relationship all of which would not be measureable with the current maps which do not indicate the location of each wind turbine [
2,
4].
The key contributions of this paper are to discuss why a wind turbine map is a necessary resource for the aforementioned epidemiological study being conducted, and the challenges in producing this type of map. Challenges in retrieving reliable data, comparisons of public and private data sources, and suggestions for how to keep the map updated are particularly relevant to researchers outside of Canada. There are many applications for a wind turbine map in other research fields and jurisdictions and the significant constraints regarding data availability and quality within this study region will likely also apply to cases elsewhere.
2. Background
Wind turbine development in Ontario, Canada’s most populous province, has occurred rapidly over the past decade as a result of the Green Energy Act, yet there is no publically-available map documenting the presence of this infrastructure [
9,
10]. The media and wind turbine opposition groups have taken notice of this deficit; there are maps indicating wind farms by community or with a large polygon indicating the total area the turbine development spans, but there is no map indicating the locations of individual wind turbines within the province [
11,
12]. Wind turbine development, largely occurring in rural Ontario, has been met with resistance and in some cases fierce opposition from Ontario communities as a result of suspected health effects [
13,
14]. A map showing individual wind turbines would be a valuable resource for researchers to examine health effects, as the distance that a resident lives from a wind turbine could act as a proxy indicator of a “dose” and could be used to measure the dose-response relationship between wind turbines and health effects.
Wind energy development in Ontario involves a small group of provincial-level organizations. To build a wind turbine in Ontario, the project must be approved by the Ministry of Environment. This approval ensures that projects follow standards for setbacks: no construction of wind turbines less than 550 m from homes and wind turbines must be far enough from homes so that transmitted noise is less than 40 db when it reaches nearby homes [
10,
15].
If a wind turbine developer is interested in selling energy with a guaranteed pricing structure, they must apply to Ontario’s Feed-in-Tariff program (FIT) via the Ontario Power Authority (OPA). Once the wind turbine is built, the energy it produces will be managed by the system operator, the Independent Electricity System Operator (IESO), which brings wind projects into service and onto the power grid. The Ministry of Energy has legislative responsibility for Ontario Power Authority (OPA) and Independent Electricity System Operator (IESO). Wind energy developers in Canada are represented by the Canadian Wind Energy Association (CanWEA). Although the organizations listed above are involved with the development and operation of wind turbines, no organization has a list or map with information that is entirely corroborated by another.
2.1. The Need for a Wind Turbine Map
A map is an intuitive way to present and interpret local data [
16]. This map was created for health and health risk research, but there are many other possible uses, which are described in the discussion. Mapping the wind turbines in Ontario and not just the general locations or towns where wind farms are found is valuable for three key applications to health and wind turbine research which can all inform wind turbine policy and development.
First, the map can be used to calculate the distance that people live from a wind turbine. Using this information, it can be determined whether there is a dose-response relationship between the distance one lives from a wind turbine and health effects [
2]. Second, this map will allow for a calculation of wind turbine density. This can help in understanding the scope of development which can be used to interpret current health risk perceptions and the impact of wind turbine density on health [
17]. Third, a map showing each wind turbine can be used along with other data (topography, terrain, built structures, and wind turbine properties) to create sound and vibration models which can be used to model health risks [
18] or to determine the visibility of wind turbines from a person’s home. It is speculated that the visibility of wind turbines from a person’s home can impact their well-being [
1,
19].
2.2. Examples of Other Wind Turbines Maps
Maps of wind turbines in other jurisdictions were difficult to find and do not appear to be common resources. Maps with wind farm locations were found for some countries (China, the United States, Portugal, the United Kingdom, and France) and a map locating each wind turbine in Denmark was found. It may be that there are more wind turbine maps available but due to a language barrier and lack of knowledge about foreign government and policy they could not be found. It is possible that the details of each turbine location are not released for security concerns, a lack of interest from the public, or the complexity of compiling a map.
The Danish Ministry of Environment (Miljøministeriet Naturstyrelsen) has an interactive map which shows every wind turbine in the country [
20] which is an innovative resource that all other jurisdictions with wind turbines should aim to provide. This map allows users to create a buffer around each wind turbine in Denmark to see how much of the country is within certain distances of wind turbines. This is how a map of wind turbines in Ontario could be used as an excellent resource for both researchers and citizens
Another example of how a detailed wind turbine map could be used for analysis has been created by RenewableUK, a not-for-profit renewable energy trade association, has a map of all wind farms in Britain [
21]. The map, entitled “Every windfarm mapped—and the MPs who hate them” was created by The Guardian DataBlog using the renewable UK wind turbine map to assess whether there is a relationship between wind turbine development and whether the local Member of Parliament opposes wind turbine development [
22]. This map, however, is misleading given that a wind farm comprised of a single wind turbine and a large wind farm comprised of hundreds of wind turbines are represented identically. Hence, there is a need for maps like the one provided by the Danish government, which identifies each wind turbine.
3. Methods
To create a map of wind turbines, one must first gather data about wind turbine development. A list of wind farms within a certain region must first be compiled and following this, the location of each wind turbine within each wind farm must be determined. For this wind turbine map, a variety of resources were used to create a list of the wind farms in Ontario as well to gather data regarding the locations of each wind turbine. Once this data were collected, ArcGIS and Google Earth were used to compile the data to create a map for use in environmental health risk research. No unique methods were required for making a map to be used in health research.
3.1. Compiling a List of Wind Turbine Developments
Lists of wind turbines in Ontario were sought from the three groups with the strongest relationship to wind energy infrastructure in Ontario—Ministry of the Environment, Ministry of Energy, and the Canadian Wind Energy Association (CanWEA). The Ministry of Environment’s available data includes Certificates of Approvals and Renewable Energy Approvals, both which are submitted to the Ministry of Environment and are required for development; the Certificates of Approval were phased out and replaced by the Renewable Energy Approvals [
23,
24]. The Renewable Energy Approvals list is available through the Ministry of Environment website and sorts renewable energy projects by type (wind, solar, bioenergy) and by project status (Renewable Energy Approval, Under Technical Review, Returned/Incomplete/Withdrawn, Received and being screened for completeness) [
25].
The Ministry of Energy has legislative responsibility for Ontario Power Authority (OPA) which works to develop a sustainable energy system in Ontario and Independent Electricity System Operator (IESO) which manages the electricity market in Ontario. The IESO website has a list of built and some upcoming wind farms, but indicates that only large developments are listed [
26]. The OPA lists the wind projects in Ontario that have contracts with the OPA only. The website also does not individually list projects that are considered to be feed-in-tariff facilities or projects that are part of the Renewable Energy Standard Offer [
27]. The CanWEA website lists wind farms and each has a unique web page with Google Maps links locating the wind farm with a single marker [
12].
The inconsistencies of the lists between these public sources complicated the compilation of the wind turbine list. Ideally, one of these groups would have a cohesive list of the wind farms in Ontario that would be easily accessible to interested parties. All lists were accessed through the internet without restriction.
3.2. Mapping Individual Wind Turbines
Generally, the same organizations used as resources to create a wind farm list were accessed to find data about individual locations of wind turbines. Government documents were the first resource used to find information about the wind turbine locations. Once these documents were exhausted, online searches were done to find any relevant planning documents like noise assessment reports, environmental assessments, or project reports. For the remaining wind farms, counties and developers were contacted to see if they would be willing to share the data. The CofA and REA documents included key information: full project name, the site location, date of approval, and the number of wind turbines that were approved for development, and in rare cases the coordinates of the wind turbines. The site location descriptions in the CofAs ranged from a very specific description of the site, i.e., “Harrow Wind Farm Bounded by Third Concession Road to the North, County Road 50 to the South, Dunn Road to the East and Meadows Road/CR41 to the West” to very broad, i.e., Melancthon Grey Wind Project Phase 1, West of the Town of Shelburne”. The IESO and OPA did not provide data about the wind turbine locations or specific information about wind farm locations. On the CanWEA website, wind farm location data are listed but described vaguely, e.g., Frogmore Wind Farm is labelled as “Norfolk County, Norfolk, ON” and Melancthon Phase II is labelled as “Melancthon Township, ON”.
4. Results
Data were collected from public and private sources to create a listing and map of wind turbines in Ontario. In total, 1,420 wind turbines from 56 different wind farms were mapped. Every wind farm on the compiled list was mapped Google Earth. Researchers looking to find details about wind turbine locations for pre-construction wind turbines or wind farms that did not get approved may be able to find this information online but will likely face difficulty. Wind farms were included on the list if they were listed before January 2012 as having a Certificate of Approval, Renewable Energy Approval, or listed by two of: IESO, OPA, or CanWEA.
Table 1.
Comparison of project lists by source.
Table 1.
Comparison of project lists by source.
| | 3250 Argentia Road Wind Turbine | Amaranth I | Amaranth II | Arthur | Bisnett Line Wind Farm | Clear Creek | Comber East | Comber West | Conestogo | Cruikshank | Dunnville | Elgin Grovlea Farms Inc’s Wind Farm | Enbridge | Erie Shores | Ex Place Turbine | Ferndale | Frogmore and Cultus | Front Line | Gesner Wind Energy Project | GO Transit Lisgard Station Wind Turbine Project | Gosfield | Gracey | Grand Renewable Energy Park – Wind Component | Greenwich | Harrow | Huron | Kent Breeze | Kingsbridge | Kruger (Chatham) | Mohawk College's Fennell Campus Wind Project | Mohawk Point | Naylor | North Malden | OPG 7 Gomberg Turbine | Point Aux Roches | Port Albert | Port Alma (Kruger) | Port Dover Nanticoke | Powertree | Prince | Proof Line | Raleigh Wind | Ravenswood | Richardson | Ripley | Ryerson University Wind Facility | South Kent Wind Project | South Side | Spring Bay | Summerhaven Wind | Swanton Line | Talbot | Thames River | Westerhout poultry | Wolfe Island | Zephyr Farms Limited's Brooke-Alvinston Wind Farm |
|---|
| MoE 1 | x | x | x | x | x | x | x | x | x | x | x | x | x | x | x | x | x | x | x | x | x | x | x | x | x | x | x | x | x | x | x | x | x | x | | x | x | | | x | x | x | x | x | x | | xa | xb | | | | x | | | x | |
| OPA 2 | x | x | x | | xp | | | xp | | | | | xt | x | | | | | | | | | | xq | | | | x | | | | | | | x | | x | x | x | | | | | | | x | xa | xb | | | | | | | | |
| IESO 3 | x | xm | xn | | | | | | | | | | xs | xq | | | | | | | | | | xe | | | | xf | | | | | | | x | | x | xu | xv | | | | | | | | x | x | | | | | | | | |
| CanWEA 4 | x | xc | x | x | | x | x | | | x | | | xd | x | | x | x | | | | x | x | x | x | x | x | x | x | x | | | | | | x | | x | x | x | x | | xo | | | x | x | xa | xb | x | x | x | x | x | x | x | x |
There were many inconsistencies between the wind project lists (
Table 1). Of the wind farms listed (
n = 56), most were identified by the MoE (the CofA and REA lists were merged given that the source of these lists was the same entity, the MoE;
n = 46), followed by CanWEA (
n = 38), OPA (
n = 16), and finally the IESO (
n = 13). Of the wind projects named (
n = 56), few were identified by all four sources (
n = 10). When the wind farms were listed by only three sources (
n = 3) the source without the wind farm was the MoE. When wind farms were only identified by two sources (
n = 21) the data sources were the MoE and CanWEA (
n = 21) and MoE and OPA (
n = 3). When wind farms were only identified by one source (
n = 22), most were identified solely by the MoE (
n = 16) and the others were identified by CanWEA (
n = 6). The MoE and CanWEA lists named many wind farms and had overlap but there were many wind farms listed by the MoE that were not on the CanWEA list (
n = 18) and
vice-versa (
n = 10).
Data indicating where wind turbines were located came from several sources, falling into four main categories (
Table 2). All of this information was found online as digital copies, although some documents were hard copies that had been scanned and posted. The success of these four methods does not necessarily indicate that one source has more of this information than others, but is reflective of the process used by the researcher. The large majority of the wind turbines were mapped using three data sources. The first data source was energy development companies who shared data with the researchers directly upon request. The second source of data was the government Certificates of Approval and Renewable Energy Approvals. The third data source was a range of planning documents that had been posted online. These documents range from environmental assessments to notices of completion to build plans. The fourth method, which was responsible for locating the lowest number of wind turbines, was to request data from local government.
Table 2.
Sources for wind turbine spatial data.
Table 2.
Sources for wind turbine spatial data.
| Data Source | Used to Map |
|---|
| Wind Turbines (n = 1,420) | Wind Farms (n = 56) |
|---|
| Certificate of Approval/Renewable Energy Approval | 418 | 19 |
| Data from the county | 115 | 4 |
| Data from the developer | 417 | 9 |
| Online planning documents (Environmental assessments, planning documents, etc.) | 470 | 24 |
Once the wind farm sites were located, four methods were used to find the individual wind turbines to create a map indicating the locations of each wind turbine (
Table 3). Most mapping was done digitally in Google Earth and then converted into a shapefile. When shapefiles of wind farms were used, these were merged with the map converted from Google Earth. Within each wind farm, each turbine was mapped in the same way.
Table 3.
Methods used to map wind turbines.
Table 3.
Methods used to map wind turbines.
| Mapping Method | Used to Map |
|---|
| Wind Turbines (n = 1,420) | Wind Farms (n = 56) |
|---|
| Translation from one map to another | 395 | 21 |
| List of coordinates | 786 | 27 |
| Visible in Google Earth | 130 | 5 |
| Shapefile from other source | 109 | 3 |
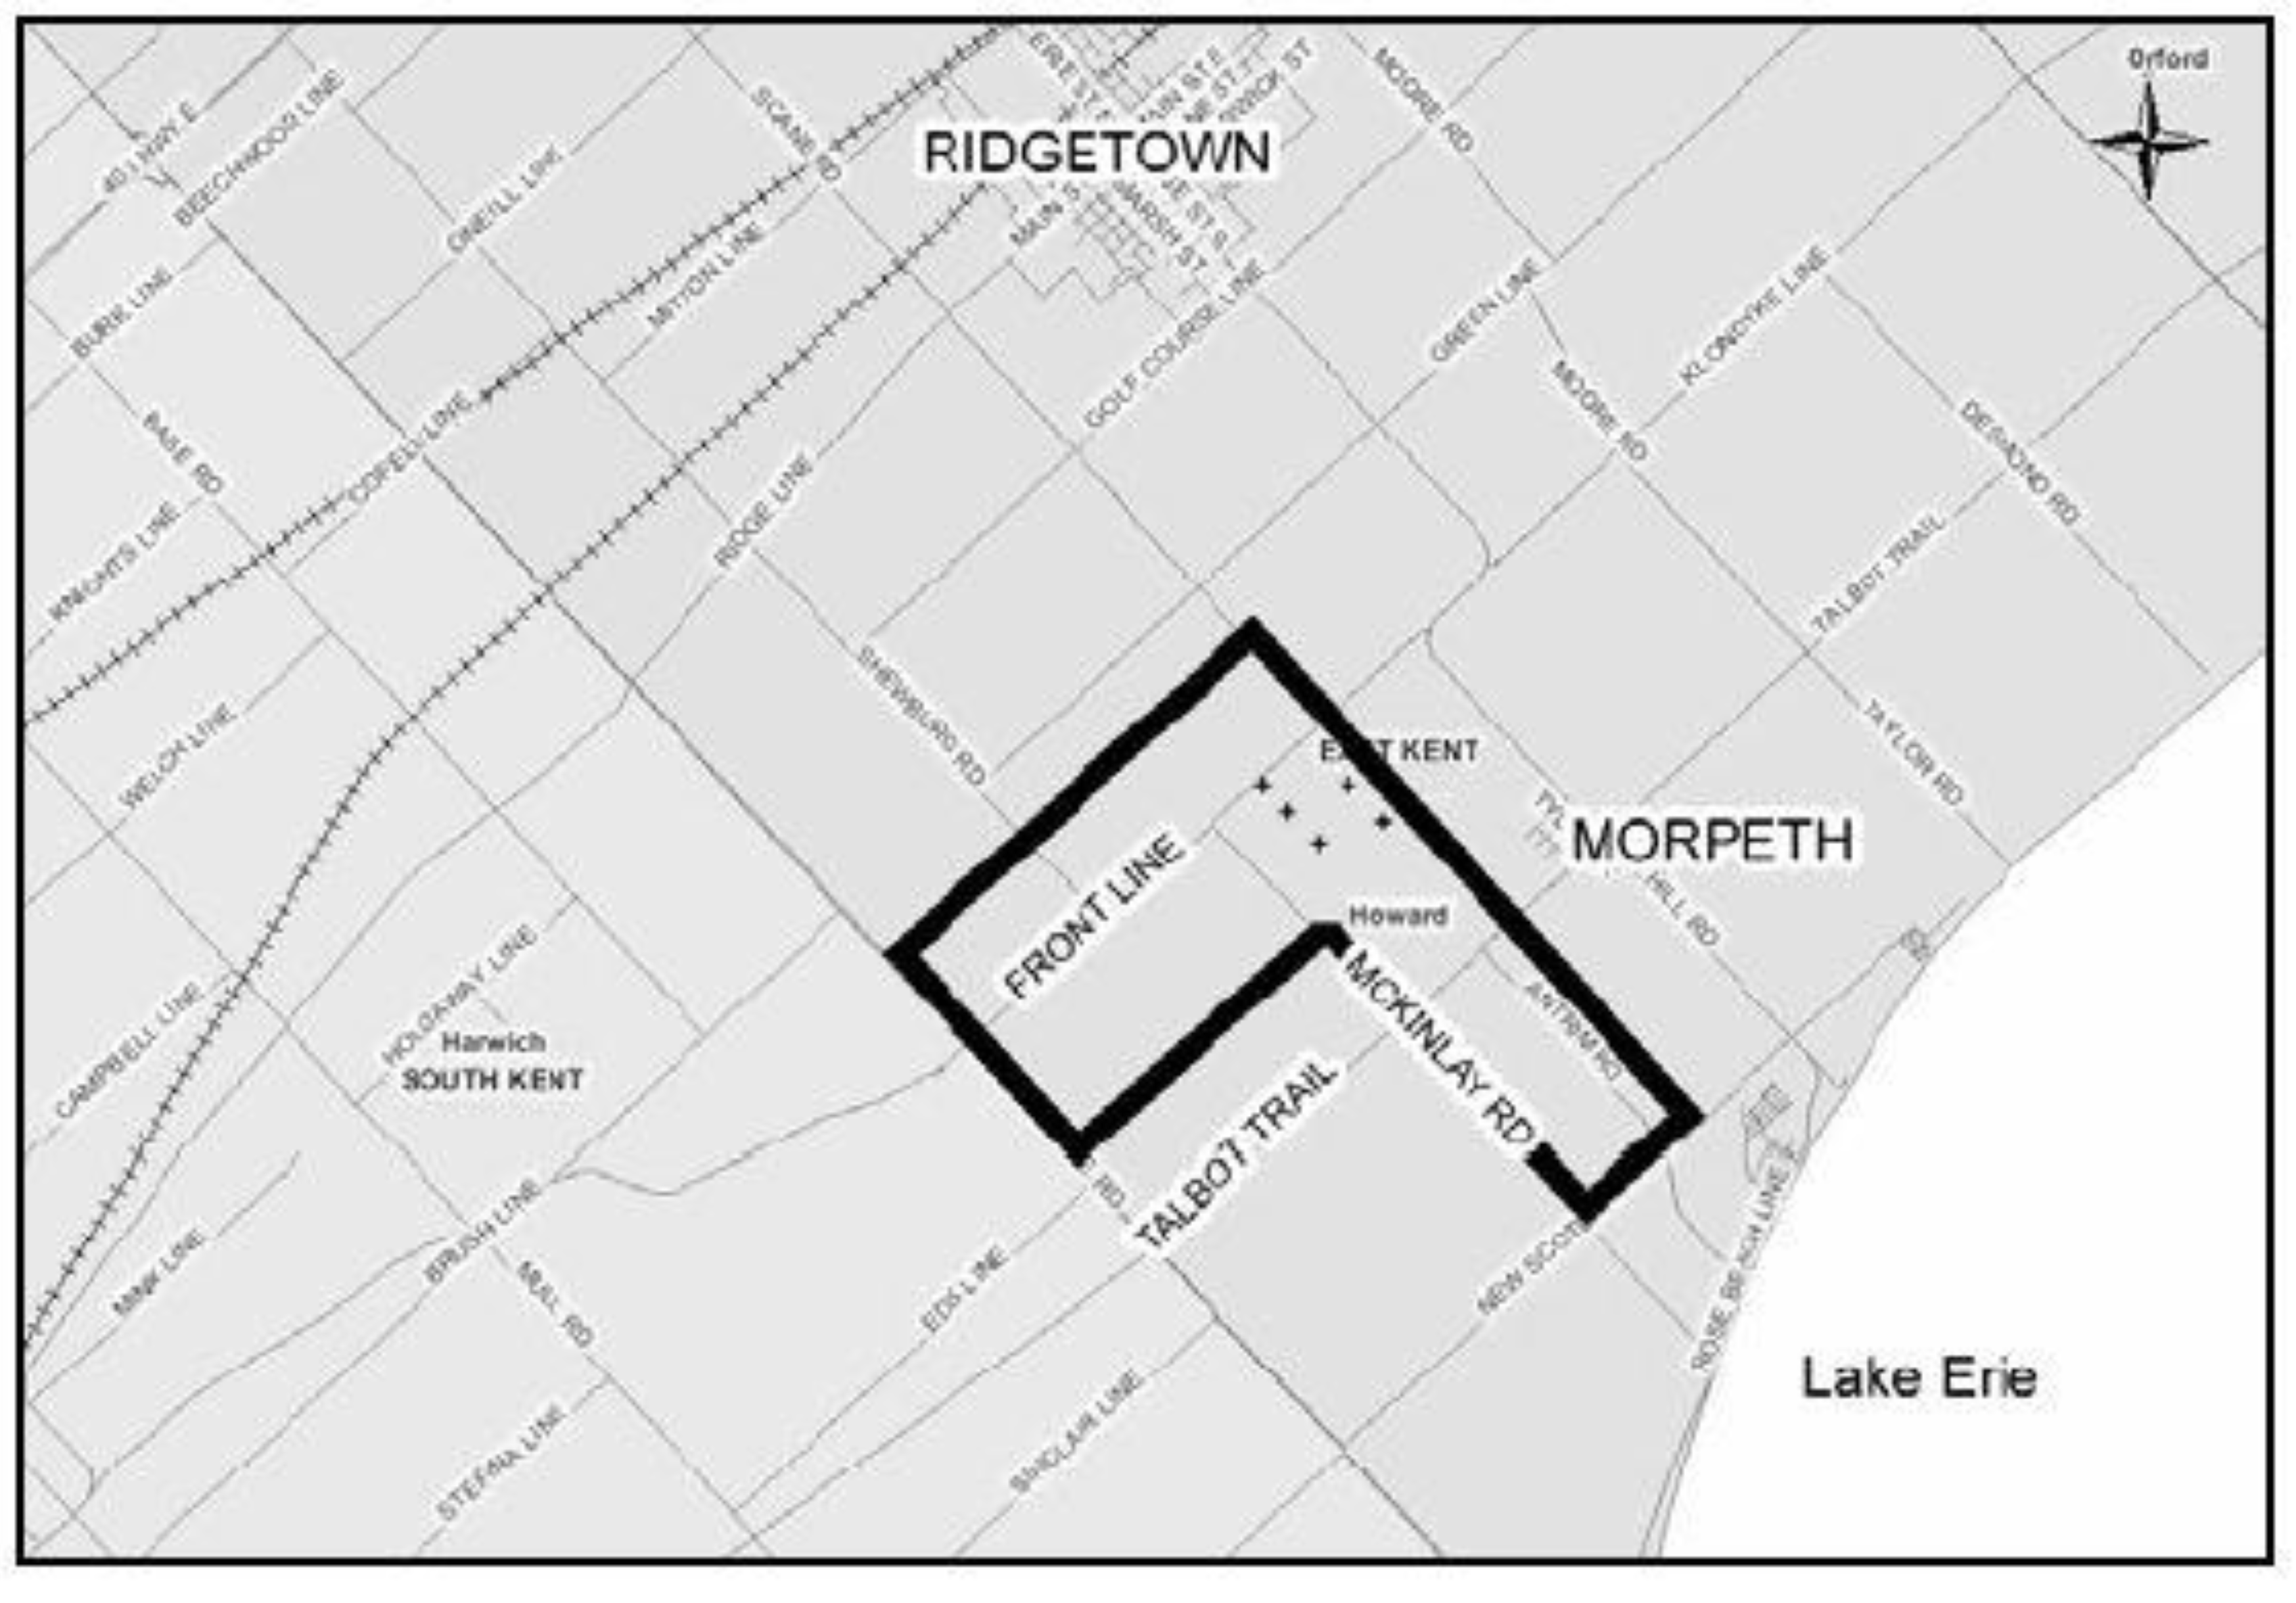
The method used to map most of the wind turbines was to use coordinates retrieved from any of the four data sources. Data from the Renewable Energy Approval and some developers were given in Northing and Easting coordinates. This was an easy and accurate way to map the wind turbines. A number of wind turbines were also mapped by translating the location of the wind turbines from one map to another. This was done when a map was found in planning documents showing roads and terrain as well as the wind turbines. This method was the least accurate way to map the turbine locations because locations were determined by approximation. The information from a found map was transferred to the Google Earth file (
Figure 1). This was done by creating a grid and coordinate system on both maps and transposing the points.
Figure 1.
Map from the notice of completion for Front Line Wind Farm.
Figure 1.
Map from the notice of completion for Front Line Wind Farm.
Another method used documents which did not have maps but gave geographic information, to get a general idea of where a wind farm was located. Occasionally, the wind turbines would be visible from the satellite imagery in Google Maps and the wind turbine coordinates were determined using Google Earth. For example, using address data from the CofAs, the satellite images in Google Earth were scanned to locate wind turbines. Areas with wind turbines can be identified without having to excessively zoom-in if the access roads to the wind turbines are visible in the satellite images. In Ontario, most wind turbines are installed in rural areas in a regular grid pattern. When wind turbines are installed, access roads are created which creates a unique pattern beyond the typical grid of the roads. In high-resolution imagery, wind turbines are unmistakeable when viewed at adequate magnifications. In lower resolution images, a wind turbine can be identified by a bright white spot and a dark line perpendicular to it, which indicate a wind turbine and its shadow. This method is recommended only when mapping wind turbines in an area where there is a wind farm, as other infrastructure may share these characteristics (e.g., a cell phone tower or smoke stack) especially when examining low-resolution images.
The fourth way that wind turbines were located, which led to the fewest number of mapped wind turbines, was to retrieve shapefiles from cooperative developers or government. Most groups were not willing to share this data, which is why wind turbines from only three wind farms were located this way. This method was only used for wind farms that could not be located through the previous three methods due to the coordination and time that it took to find the right people from whom to request this data. For example, Chatham-Kent has all of the wind turbines in the county mapped to a GIS file which was shared with the researchers to create a complete wind turbine map. This was the most accurate and precise method used to add wind turbines to the map.
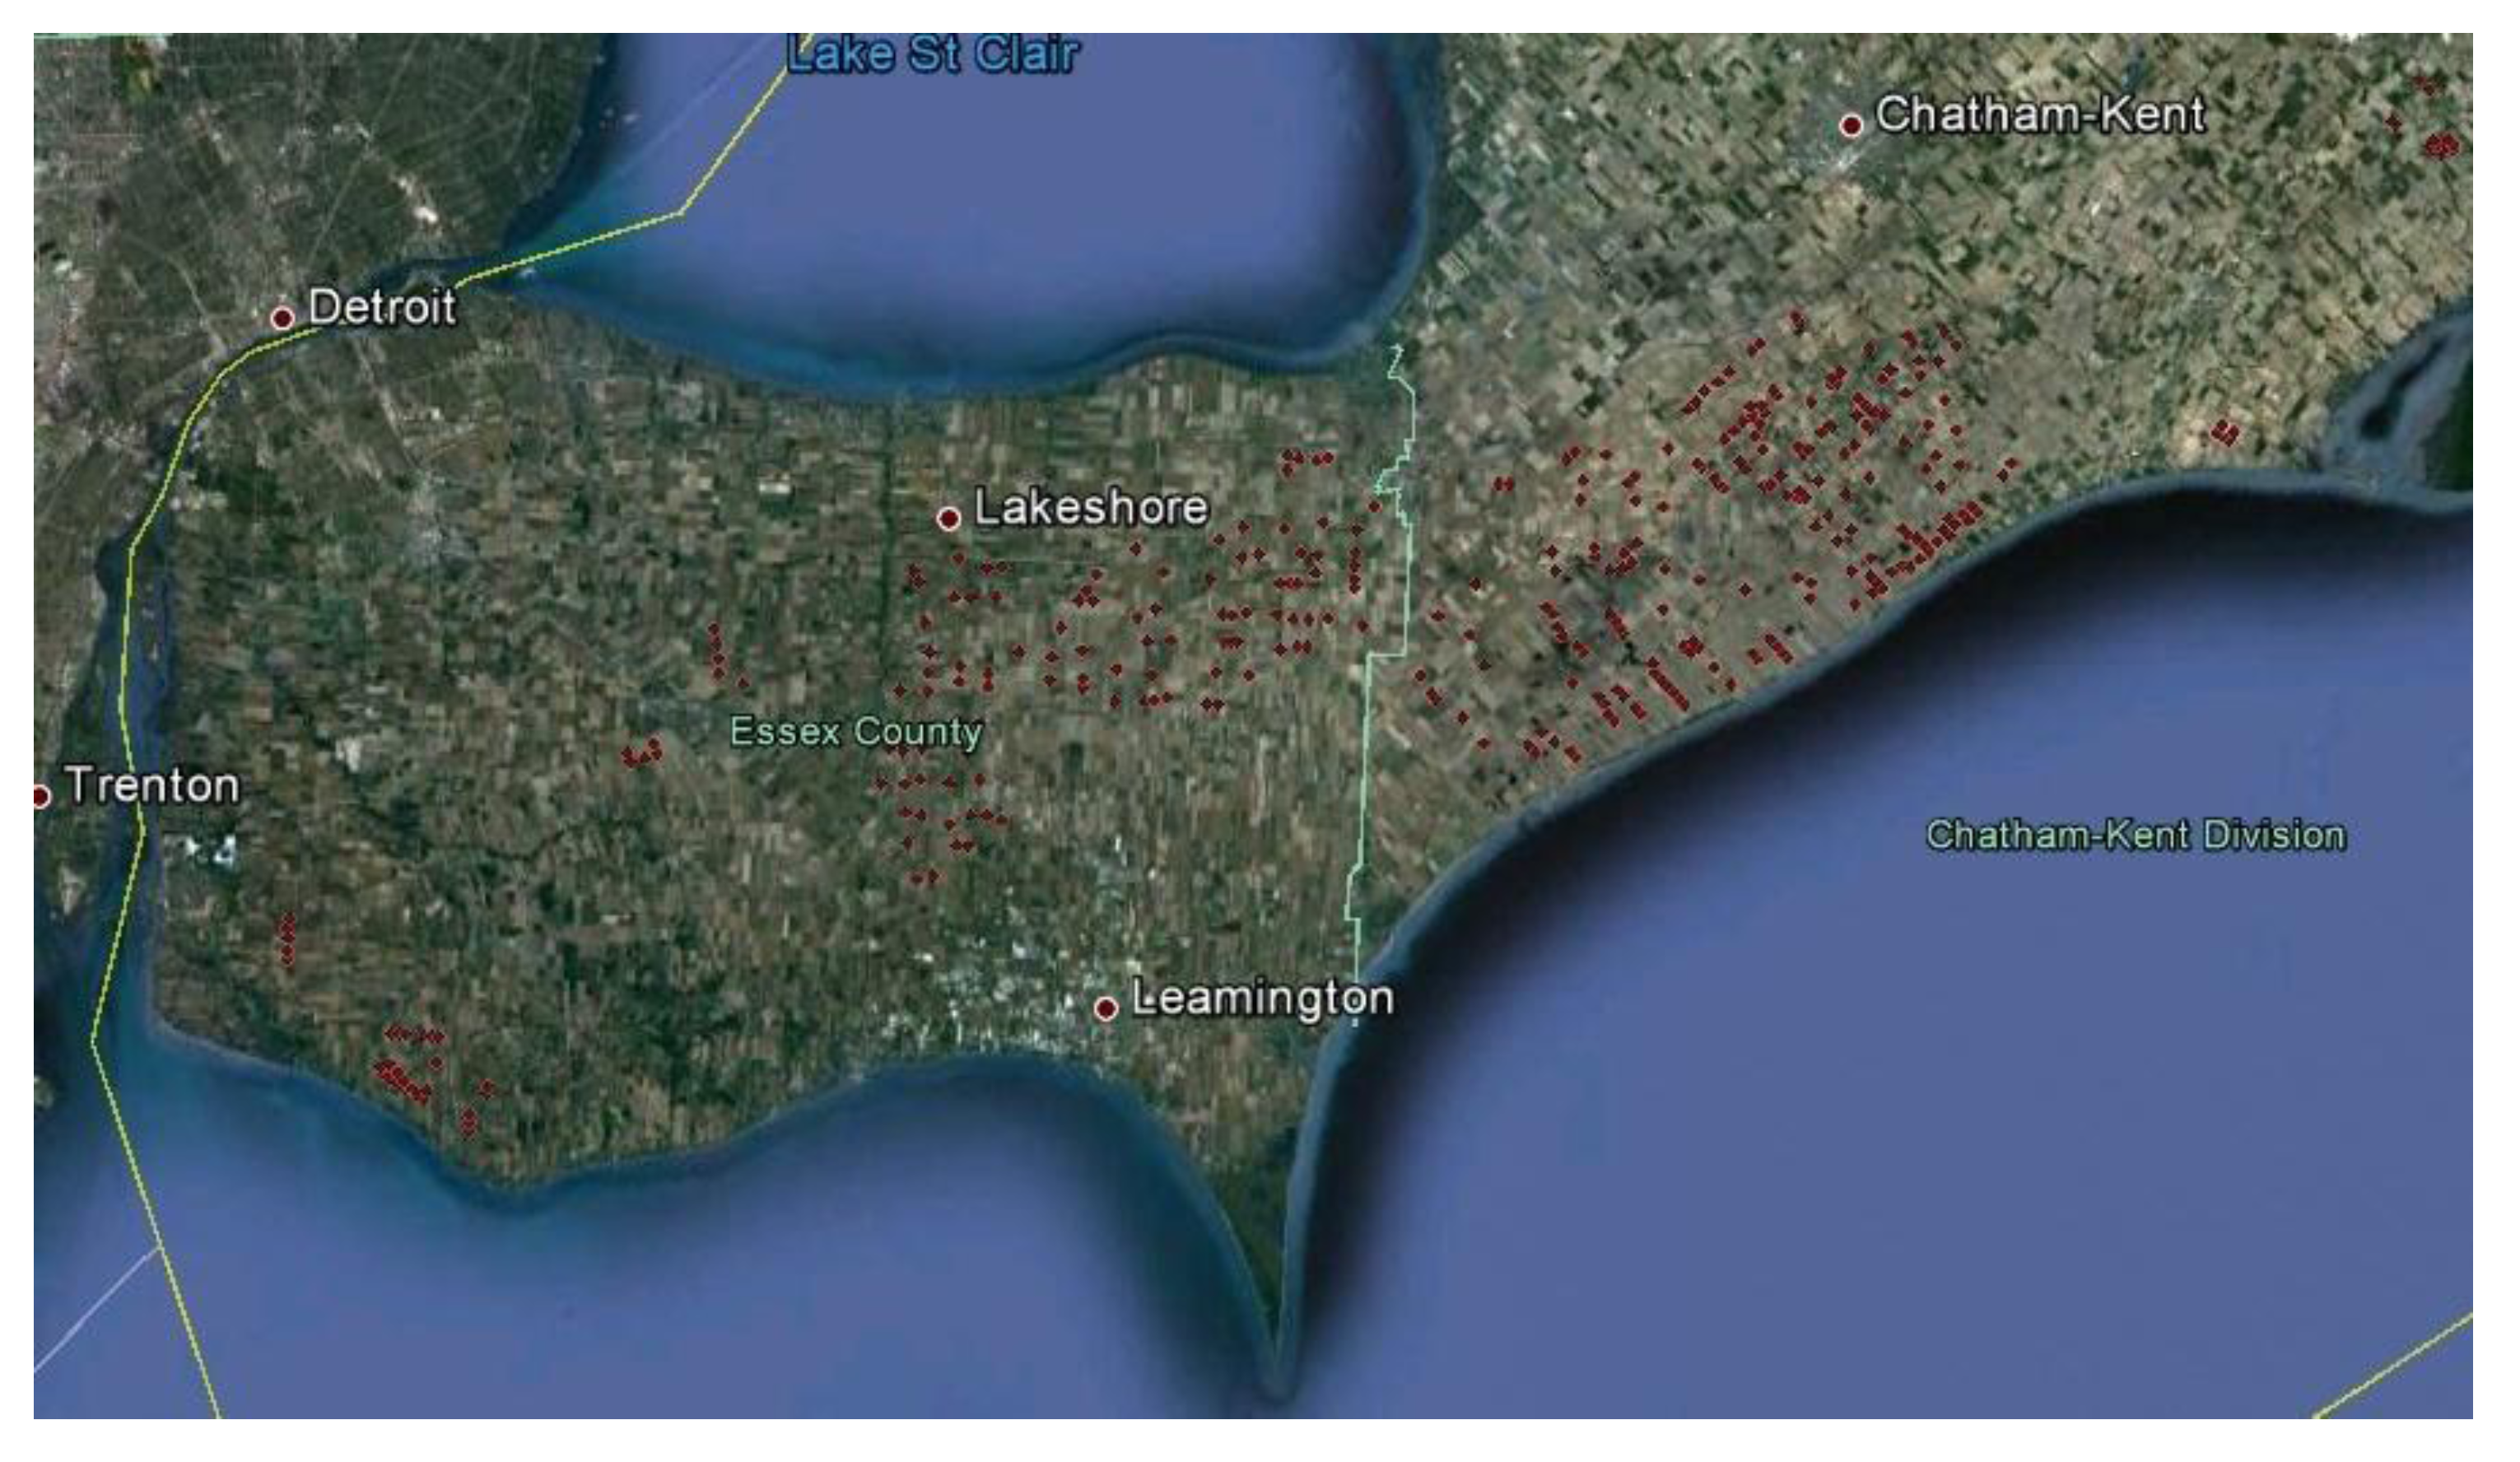
If additional data were found after the wind turbines were mapped it was used for triangulation. If differences or inconsistencies were noted, the coordinates or shapefile data were used instead of the data collected by satellite imagery or by translation from another map for the entire wind farm. So far, the map (
Figure 2) does not include any characteristics attributed to each turbine, but data has been collected including the date the development was approved, the date that the wind farm was operational, the make and model of the wind turbine, the wind turbine owner, and the wind turbine developer.
Figure 2.
Wind turbines mapped between Chatham-Kent and Windsor, Ontario.
Figure 2.
Wind turbines mapped between Chatham-Kent and Windsor, Ontario.
5. Discussion
The product of this work is a map comprised of 56 wind farms and 1,420 individual wind turbines across Ontario. A variety of private and public sources were used to compile the appropriate data, and a combination of mapping techniques were used to create the map. There were inconsistencies in the data sources, with project listings from the Ministry of the Environment being most thorough, followed by the private Canadian Wind Energy Association which represents the wind industry. The differences between the four lists considered and the fact that the MoE listings appeared to have some projects missing is concerning. Data from several mapping techniques were compiled in ArcGIS. This dataset was converted into a shapefile that can be used with programs like ArcGIS for future work in spatial analysis. The choice to use Google Earth over other mapping software was made because Google Earth has relatively up-to-date satellite imagery for large areas. Google Earth does have shortcomings compared to ArcGIS. It cannot locate addresses based on lots and concessions; it cannot be used for spatial analysis, and in some areas Google’s satellite images are of a low resolution and in excess of five years old, making the imagery unsuitable for locating wind turbines especially given the number of wind turbines in Ontario built after 2009.
5.1. Limitations and Challenges
There are four limitations to this map. First, a serious concern is that there may be inaccuracies in terms of which wind turbines have been mapped. Since the documents used were mostly government approvals or planning documents, it is possible that many of the wind turbines that are included in the map were not developed. Hence, the map likely overestimates the wind turbines in Ontario. Similarly, it is possible that some wind turbines have been constructed which have not gone through the appropriate paperwork, or that all documents may not have been uploaded. In this case, the number of wind turbines in Ontario could be underestimated. If researchers were to use this map for epidemiological research, “exposed” or “at risk” populations could potentially be over- or under-estimated. Before using this map, users will do further research or site visits to ensure that the wind farm has been developed.
A second significant limitation is that the wind turbine locations may vary in accuracy dependent on the mapping method used. A user of a map compiled in this way would be encouraged to verify the accuracy through site visits or further data collection. This limitation is noteworthy especially for environmental health and risk applications, where the distance between a home and wind turbine must be accurate to assess a potential dose-response relationship. Wind turbines mapped with coordinates (latitude and longitude) or from shapefiles are likely most accurate with the exception of inconsistencies that could arise from conversion between a shapefile and Google Earth kmz file. This method was time consuming due to the number of phone calls and emails that needed to occur although many townships and developers had this data available and were willing to share. Visually tagging wind turbines would only be inaccurate if the Google Earth satellite images are not geocoded accurately. Transferring data from one map to another was the least accurate method, especially if plans for the wind farm were not implemented identically. The most accurate and most precise way to have collected data for the map would have been to perform site visits and either collect GPS coordinates at the base of each turbine (with landowner permission) or to use triangulation and determine the wind turbine coordinates from a nearby location. This method would have been a very time-consuming venture given the number of wind turbines and spatial scale over which they are distributed in Ontario. For the scope of the epidemiological research that the map is being used for, this is a limitation that must be accepted. In the case that a health and environmental risk researcher wanted more precision, for example measuring the impact on sleep and comparing the coordinates of a wind turbine to the coordinates of a nearby resident’s bed, then collecting GPS data would be a better method. For the wind turbines mapped by transferring data from one map to another, data was triangulated when possible but there are likely inaccuracies which cannot be determined without site visits. Given that this research is using the wind turbine map to determine distance from nearby homes using addresses, there will also be inaccuracies due to the limitations of geocoding rural addresses and the resultant distance calculation will have inaccuracies at both end points.
A third limitation is that the map was initially imagined to be a product that could be shared publically, but due to data sharing agreements with a variety of public and private groups, this is not possible. For other maps like this, the map should be made public and as a crowd-sourced public resource, community members can keep the map updated. Residents living near wind turbines could verify the locations of existing wind turbines and also add new wind turbines as future developments occur. This method seems ideal for maps identifying resources that are dispersed across large areas with modest populations. Given that residents of wind turbine communities have shown demand for a map of this type [
11] and have attempted to create their own (see:
http://ontario-wind-turbines.org/ [
28]), a shared resource would likely be embraced.
Fourth, given that wind turbines are being built in Ontario at a rapid pace, this map requires frequent updates to prevent it from becoming obsolete. There are fewer challenges to gathering this data due to the updated approval process, but this is still an arduous task. The projects that have received Renewable Energy Approval are listed online and the list appears to be frequently updated [
25]. Further, the REA documents themselves appear to have the coordinates included for all proposed wind turbines [
29]. This limitation acts as another compelling reason for the map to be made public.
5.2. Future Work
This map can be used for a variety of research questions involving health and wind turbine exposure. As discussed previously, within the field of health and environmental risk the map could be used to calculate a dose-response relationship, to calculate the density of wind turbines and the impact of density on a variety of factors, to determine visibility, and to create sound and vibration models. This map can also be used to determine how many people live within a specific distance of wind turbines, assess economic impacts of wind turbine developments, or examine the impact that wind turbines have on wildlife and the environment.
Since inequalities between rural and urban Ontario have been brought up as an issue it may be interesting to transpose [
30,
31] the wind turbine layouts onto urban areas to get an idea of the breadth of development across rural Ontario. Similarly, one could transpose wind turbine densities in Germany or the Netherlands on Ontario to compare the extent of Ontario’s development to other jurisdictions. This feature has been used by the British Broadcasting Corporation to compare the footprints of natural disasters, ancient cities, war battles,
etc. [
32]. Given that there are perceived inequalities among Ontarians, this map can be contrasted with a map of wind resources in Ontario to determine if good wind resources and wind turbine development are correlated. Given that some local governments in Ontario such as Chatham-Kent, Essex County, and Malahide Township have interactive online GIS for anyone who is interested in wind turbine locations it is clear that local governments see value in sharing this information with the public even without specific goals in mind.


