Towards Sustainable Urban Planning Through Transit-Oriented Development (A Case Study: Tehran)


Department of Geo-Spatial Information System, Faculty of Geodesy and Geomatics, K. N. Toosi University of Technology, Tehran 15433-19967, Iran
*
Author to whom correspondence should be addressed.
ISPRS Int. J. Geo-Inf. 2017, 6(12), 402; https://doi.org/10.3390/ijgi6120402
Submission received: 28 October 2017
/
Revised: 21 November 2017
/
Accepted: 7 December 2017
/
Published: 11 December 2017
(This article belongs to the Special Issue Urban Environment Mapping Using GIS)
Abstract
:Sustainable development is regarded as a pivotal factor for smart urban planning. Transit-Oriented Development (TOD) is a well-known land use transportation integration (LUTI) planning method, which can fulfill sustainable development objectives. In this study, a new spatial index is developed to measure TOD levels in neighborhoods of Tehran, the capital of Iran. To develop the TOD index, several criteria and indicators are first computed using spatial analyses, before being aggregated using a fuzzy-analytic hierarchy process (fuzzy-AHP). The fuzzy-AHP method generates three types of factor maps: that are optimistic, pessimistic, and moderate. This process evaluates the sensitivity of the TOD index by determining the indicators’ weights from various views, or perspectives. The results of this sensitivity analysis show the robustness of results from various views. Furthermore, in order to assess the efficiency of the proposed method, the moderate TOD-level map is compared with both the level of public transit services and trip attraction in neighborhoods. This comparison shows that the TOD map has an accuracy of 77 percent in urban modeling, which verifies the efficiency of the proposed method for measuring TOD.
1. Introduction and Background to Topic
In recent decades, cities have expanded dramatically due to rapid urbanization processes. Consequently, several issues associated with the management of urban built environments, such as unplanned urban sprawl, unfair distribution of land uses, and inappropriate utilization of infrastructures, have emerged [1,2]. Nowadays, a significant rise in the use of private cars over public transit is one of the most conspicuous issues in many of cities. This issue can lead to both environmentally and non-environmentally harmful consequences, such as traffic congestion, global warming, climate change, environmental pollution, and socio-economic problems [3,4]. On the other hand, in most developing countries, the existing public transportation services are unsuccessful in attracting people because land use characteristics are not considered when planning and designing public transit. To facilitate decision-making processes in urban areas, it is therefore necessary to integrate land use and public transportation planning into a comprehensive index [4,5,6,7].
There is a mutual relationship between transportation and land use. For instance, land uses affect travel demand, while transportation networks have a prominent impact on the patterns of land use [8,9,10]. Therefore, transportation and land use should be considered in relation to one another, as a way of efficiently addressing urban planning from the perspective of sustainable development [7,11,12]. Sustainable development helps urban planners in managing infrastructures intellectually and in supporting economic, social, and environmental objectives in a city [13,14]. Several models have been developed to accomplish sustainable urban planning in cities. Among these sustainable models, Transit Oriented Development (TOD) has proven to be quite successful [15,16,17].
Various definitions have been offered for the TOD concept [18]. There are, however, some common elements to all of them, such as a compact mixed-use development pattern, pedestrian-friendliness, being close to public transit services, and being well-served by these services [19,20,21,22]. Additionally, the TOD concept uses several scales, which show its multi-scale character [23,24]. In order to achieve an efficient and comprehensive result, the TOD concept should be conducted on a region or a city, rather than on a specific distance around the public transit stations [6,12,25,26]. This approach, which is known as TOD planning, computes TOD levels over all areas. The results of the TOD planning help decision-makers in land use and transportation planning. For instance, by using TOD levels, TOD planning can be used to determine high potential neighborhoods for developing public transit services [12].
1.1. Literature Review
Many studies have implemented the TOD concept for local spaces around public transportation stations [3,11,15,20]. However, there are only a few studies that focus on the evaluation of TOD levels via the TOD index. Renne and Wells [26], and Evans and Pratt [6] investigated the importance of using an index in TOD studies. Indeed, for them, the TOD index has the capacity to measure TOD levels in an area, and they believe that these TOD levels can help decision-makers to plan efficiently. Wey [27] and Wey et al. [28] investigated the TOD concept in a site selection of public transport stations. For this purpose, they began by defining efficient criteria for smart growth and the TOD concept. Then, they employed the fuzzy analytic hierarchy process (fuzzy-AHP) and the fuzzy analytic network process (fuzzy-ANP) to evaluate the TOD’s criteria and determined an optimum set of public transit stations. This study has some limitations: (1) the selected sites for public transit stations were not globally optimal; (2) the considered indicators were not comprehensive and should be supplemented with some other influential indicators, such as diversity and demographic characteristics; and, (3) the indicators were evaluated in a qualitative form by experts, which is less precise than using a quantitative format. It should be noted that it is essential to compute the quantitative format using Geographic Information Systems (GIS).
To the best of our knowledge, Singh et al. [12] performed the first study on TOD planning. They developed a spatial TOD index to evaluate TOD levels across the entire study area. These TOD levels were employed for public transit site selection over the relevant study area. However, their study has some weak points: (1) the considered indicators were limited to five indicators: residential density, commercial density, entropy, land use mixedness, and number of business establishments; however, the authors and other studies emphasize that some other indicators, such as accessibility and street connectivity, should be considered in TOD planning; (2) the indicators were computed in a raster format, which is not suitable for urban planning because data gathering and municipalities’ plans are usually configured in the vector format; and, (3) the aggregation method that is used for combining the indicators and criteria is not flexible and cannot incorporate the uncertainties inherent in criteria and indicators [29].
1.2. Contribution and Objectives
This research contributes to the development of a comprehensive spatial TOD index whose aim is to cover the inherent uncertainties in urban planning at a regional scale. This index’s TOD level measurement is optimal when using the vector data format, and decision-makers can use it as a promising tool in urban planning. Therefore, this study follows three objectives: (1) developing a new TOD index based on a comprehensive set of indicators, as part of regional TOD planning from the perspective of sustainable development; (2) utilizing the vector format to compute the indicators since this format is more suitable for urban planning; and (3) employing a reliable aggregation method for combining the indicators and incorporating uncertainties in the planning [30,31].
2. Methodology and Materials
2.1. Study Area and Data
In this study, the 7th region, a central region of Tehran, was selected to develop the proposed TOD index. There are two main reasons for this selection. First, the region is a high-density area with various land uses, which makes land use planning essential. Second, the seventh region has a high level of trip generation and trip attraction; thus, public transportation plays a key role there. This is evidenced by the fact that all of the subway lines, as well as two major BRT lines, pass through the area. It is divided into five districts and 22 neighborhoods. The total population and area of this region is about 300,000 individuals and 1536 hectares, respectively. Data sets used in this study were provided by the Tehran Municipality. Figure 1 shows the study area and its neighborhoods. Moreover, the following data sets were used to develop the TOD index:
- spatial layers of the region’s boundaries, neighborhoods, and parcels, with the attributes of area and land use types;
- a street map with the attributes of type, pavement, and streets design data; and,
- a population map in the neighborhood scale with the attributes of educational level, professional status, age, and family members.
2.2. Methodology
In this research, we propose a multi-criterion decision-making (MCDM) method in four stages, as a way of developing a spatial index. MCDM helps decision-makers to make optimal decisions in multi-criteria problems. To this end, the method evaluates all the criteria and aggregates them with an efficient function [31]. Today, many studies use MCDM as a promising tool together with GIS, since most spatial problems are multi-criteria problems [4,5,7,12]. For instance, Singh et al. [12] utilized the MCDM method to determine the weights of TOD’s indicators and to aggregate them for the development of a TOD index; in another study, Babakan et al. [4] used the MCDM method to aggregate people’s priorities in selecting their settlements and to choose the best location for them to live in. In this study, we therefore use MCDM and GIS. In the first stage, the most significant criteria and indicators are determined. Although several studies, such as [6,12,26,32], have determined a set of criteria and indicators for TOD planning, this set is not comprehensive and it should be completed by adding other important indicators. Therefore, in the second stage, a comprehensive list of indicators is calculated that is based on adequate formulas. Since most indicators, such as density, mixed land use-ness, and accessibility are spatial, GIS can be utilized to calculate these indicators. In the third stage, in order to obtain the spatial TOD index, the calculated indicators are aggregated using an efficient decision-making method. The aggregation method used should be able to incorporate uncertainties in data and to compare indicators according to a scientific basis [30,31,33]. For this purpose, a fuzzy-AHP aggregation method is used. In the fourth stage, the result of the TOD index in the study area is evaluated through the use of some reference data.
2.2.1. The First Stage: TOD Concept, Criteria, and Indicators
Generally, a description of the TOD concept involves some important characteristics such as high-density areas, suitable land use diversity, a high mixedness level, and efficient public transportation services [22,25,34]. The TOD concept is defined as an approach that encourages the development of mixed and compact land uses, increasing the number of public transit passengers, and creating more livable communities [34]. According to Sung and OH [3] (p. 75), “TOD is a planning technique that aims to reduce automobile use and promote the use of public transit and human-powered transportation modes through high density, mixed use, environmentally-friendly development within areas of walking distance from transit centers”.
There are some essential criteria for TOD planning. Ewing et al. [35] suggested three criteria: density, diversity, and design. Additionally, further studies expand these criteria with the socio-economic development criterion, in order to enhance the efficiency of the TOD planning [6,12,27]. In this study, the aforementioned criteria are employed to develop the TOD index. Additionally, each criterion is evaluated by efficient indicators. Table 1 summarizes the criteria and indicators that are considered in this research. When compared to the indicators that are used in [12], in which the authors developed a successful implementation of TOD planning, we utilize further indicators to improve the evaluation of the criteria and TOD planning, including: (1) administrative density: this has a prominent role in transportation demand; (2) accessibility: the most important factor in land use-transportation integration models; (3) street connectivity: a principal factor in urban design and detecting deteriorated urban textures; (4) level of streets’ design: a fundamental factor for encouraging walking and cycling in the community; (5) demographic indicators such as population, educational level, family members, and the percentage of young people, all of which can specify the trip generation level, as well as the level of socio-economic development in an area; and, (6) level of facilities: this distinguishes trip attraction in a particular area. Educational, health, sport, religious, and recreational land uses are considered in determining the level of facilities.
2.2.2. The Second Stage: Calculation of Indicators
In this study, indicators are computed in the vector format at a neighborhood scale, as this approach implies several advantages:
- Urban planning in Tehran is initially performed at a neighborhood scale before being detailed at larger scales. Therefore, most of the required data are gathered and presented at this scale.
- Since most data sets are gathered at the neighborhood level, converting data into other levels and the raster data format may potentially result in some inherent errors.
- The border effect is an affecting factor when a raster data format is employed. This effect is reduced when the cell size of the raster data format decreases. This error occurs in the raster data format since in this format features, such as points, lines, and polygons are not determined explicitly. Therefore, metric functions (e.g., distance and area) and topological functions (e.g., connectivity and contiguity) are not satisfied. Additionally, using the raster data format increases computational cost and disaggregation errors. On the other hand, the use of the vector data format eliminates the border effects, and the computational cost decreases considerably because there is no need for disaggregation.
- Since a neighborhood is considered a homogenous environment, urban planning is conventionally conducted at a neighborhood scale. A raster cell, on the other hand, is a square area that contains different parts of the urban environment regardless of their characteristics. Thus, the vector format at a neighborhood level is expected to be more efficient than the raster format.
- Some indicators, such as density, land use mixedness, and diversity, are conventionally employed at the neighborhood level in urban planning, and utilizing these indicators on other levels is meaningless or inefficient. In addition, the raster data format is not justifiable for calculating these indicators in urban planning.
Some indicators, which are expressed through their methods and formulas, are detailed below. Other indicators, such as the indicators of socio-economic criterion, are obtained by selection operator, and consequently there are no specific methods and formulas to express them.
Density
Density is a vital indicator for evaluating the efficiency of urban planning and public transportation services. High-density areas have the potential to incorporate walking, cycling, a lively community, and an optimum usage of public transit. Therefore, developing high-density areas is necessary for TOD planning [17].
The density indicator is conventionally measured in the form of the variable of interest per unit of the area. Equation (1) is utilized to compute residential density. Similarly, other densities, such as commercial and administrative densities, can be calculated through Equation (1).
Diversity
Diversity is a prominent indicator in urban planning for determining the level of heterogeneity of land uses. This indicator can be employed to obtain a value, which describes a variety of different land uses in the study area. Different land uses in an area will support the various requirements of the relevant inhabitants, ensuring a lively and friendly community. Additionally, this indicator has a pivotal effect on trips modalities. For instance, a decrement of this indicator causes people to use private cars to meet their requirements. On the other hand, an increment of this factor means that there will be more walking and cycling in the community. Therefore, Cervero and Kockelman [35] believe that diversity can be used as an indicator for trip generation. Additionally, Ewing and Cervero [36] investigated the effects of the diversity factor on walking and the use of public transit.
There are different approaches to measuring diversity, such as entropy, Herfindahl–Hirschman Index, and the jobs-to-housing ratio. In this study, the entropy method is utilized, as it has some advantages over other method: (1) not requiring the use of some require demographic data that is hard to access, such as number of jobs; (2) being widely used in urban planning and travel studies and presenting a high reliability within these areas; and, (3) being able to incorporate more than two types of land uses, while other methods cannot [35,37,38]. These reasons bring us to conduct an estimation of diversity by using the entropy indicator, which is presented in Equation (2).
where E is the entropy indicator for the study area, Pi is the ratio of the area assigned to the land use i, and n is the number of different land uses in the study area [38]. The range of Equation (2) is between 0 and 1. The values 0 and 1 show that all land uses in the study are the same, or that they are evenly expanded in the study area, respectively [35].
Design
Design, which is a fundamental criterion in TOD planning, can significantly affect the TOD level. Measurement of the walkability in an area is one of the most important indicators for evaluating the design criterion because the design criterion and walkability have a strong mutual relationship to one another [39]. Zhang and Guindon [40] mentioned that, “to support a high degree of walking and cycling, residential and employment uses must be mixed on a very small scale”. In this study, walkability is measured using four indicators: street connectivity, the level of streets’ design, mixedness, and accessibility to facilities.
Street Connectivity
Different indicators, such as network density, cross density, alpha index, and gamma index have been developed to compute street connectivity. All of these indicators use graph theory for their computations. In this research, we employ the alpha index because it is highly adaptable to urban planning [41]. The alpha index (α) is defined as the proportion of the number of existing circuits in the study area to the maximum possible number of circuits. This index is computed using Equation (3) [42]:
where e and v are the number of segments and nodes in the street network, respectively. The value of the alpha indicator ranges between 0 and 1. Higher values of the indicator show that the urban network has a high degree of street connectivity, which in turn means that different places can be reached via several paths [43].
In Equation (3), circuits are formed with three edges. However, since city blocks are tetrahedrons (because of the specific conditions of streets’ orientations and the usual separation of parcels), it is more convenient to change Equation (3) into Equation (4):
In Equation (4), circuits are formed with four edges that are more compatible with the structure of urban environments.
Accessibility
Accessibility in an urban area is expressed as the availability of facilities, such as commercial, educational, recreational, and health centers, from a specified place, via a mode of transport. Accessibility is considered as a prominent indicator for evaluating the efficiency of urban development, because it links two main components of an urban environment, namely the land use pattern and the transportation network. The land use pattern defines the distribution of different facilities in the study area, while the transportation network indicates how easily a certain mode of transport can reach each activity. Thus, this indicator has been widely investigated in transportation and urban research, especially in LUTI models, such as TOD [4,7,10,21]. The accessibility indicator has two main parameters: (1) the travel cost, which is estimated by the spatial distribution of facilities and the transportation network; and, (2) the attractiveness of facilities. Based on this definition, the accessibility indicator can be calculated with Equation (5).
where Aim is the accessibility of place i to facility j via transportation mode m. Oj is the attractiveness of facility j, and ƒ(Cijm) is a function to calculate the travel cost between place i and facility j using transportation mode m [10,43].
Land Use Mixedness
Distributing various activities and land uses for increasing land use mixedness in neighborhoods is essential for TOD planning. Excessive distances between different types of land use result in more mobility, which increases the need to develop more infrastructures, and to use private cars for urban travels. Therefore, this may lead to the development of some policies that encourage people to use their private cars rather than walking or cycling (e.g., some facility centers provide free parking to encourage their customers to use their private cars) [4]. In addition, single land use development and inappropriate mixedness in an area both increase travel time. This increment can lead to traffic congestion, global warming, and environmental pollution. Thus, it is necessary to consider and measure land use mixedness in the area. The mixe-ness indicator is computed using Equation (6) [40]:
where MI is the mixedness indicator, Sc is the total area of commercial and administrative land uses, and Sr is the total area of residential land uses within the buffer distance i.
Socio-Economic Development
Economic activity has been proposed as a criterion for TOD planning by Renne and Wells [26], and Evans and Pratt [6]. TOD planning in an area needs both private and public investments. These investments provide some benefits such as improving financial profit, travel demand, and the level of facilities in the given area. Additionally, because of a higher density and various activities in high-level TOD areas, social and economic interactions will increase in these areas. Therefore, socio-economic developments have meaningful effects on the increase of the TOD level in an area. In this study, the socio-economic criterion includes some indicators that are mainly statistical and available in Tehran.
2.3. The Third Stage: Fuzzy-AHP
AHP is a MCDM method developed by Saaty [44]. AHP helps decision-makers determine how to weight the criteria and indicators in MCDM problems based on pairwise comparisons [45]. AHP is usually implemented in three stages: (1) representing the MCDM problem in a hierarchical structure that includes the goal, criteria, and indicators of the problem; (2) performing pairwise comparisons between criteria and indicators based on the decision-makers’ preferences, the latter being represented by a value ranging from 1 to 9; and, (3) calculating weights of the different criteria and indicators [45,46,47].
Since the AHP method is unable to model problem uncertainties [30,31,33], the fuzzy-AHP method was developed in spatial decision-making problems [47]. Fuzzy-AHP is an extended version of AHP that supports fuzzy numbers.
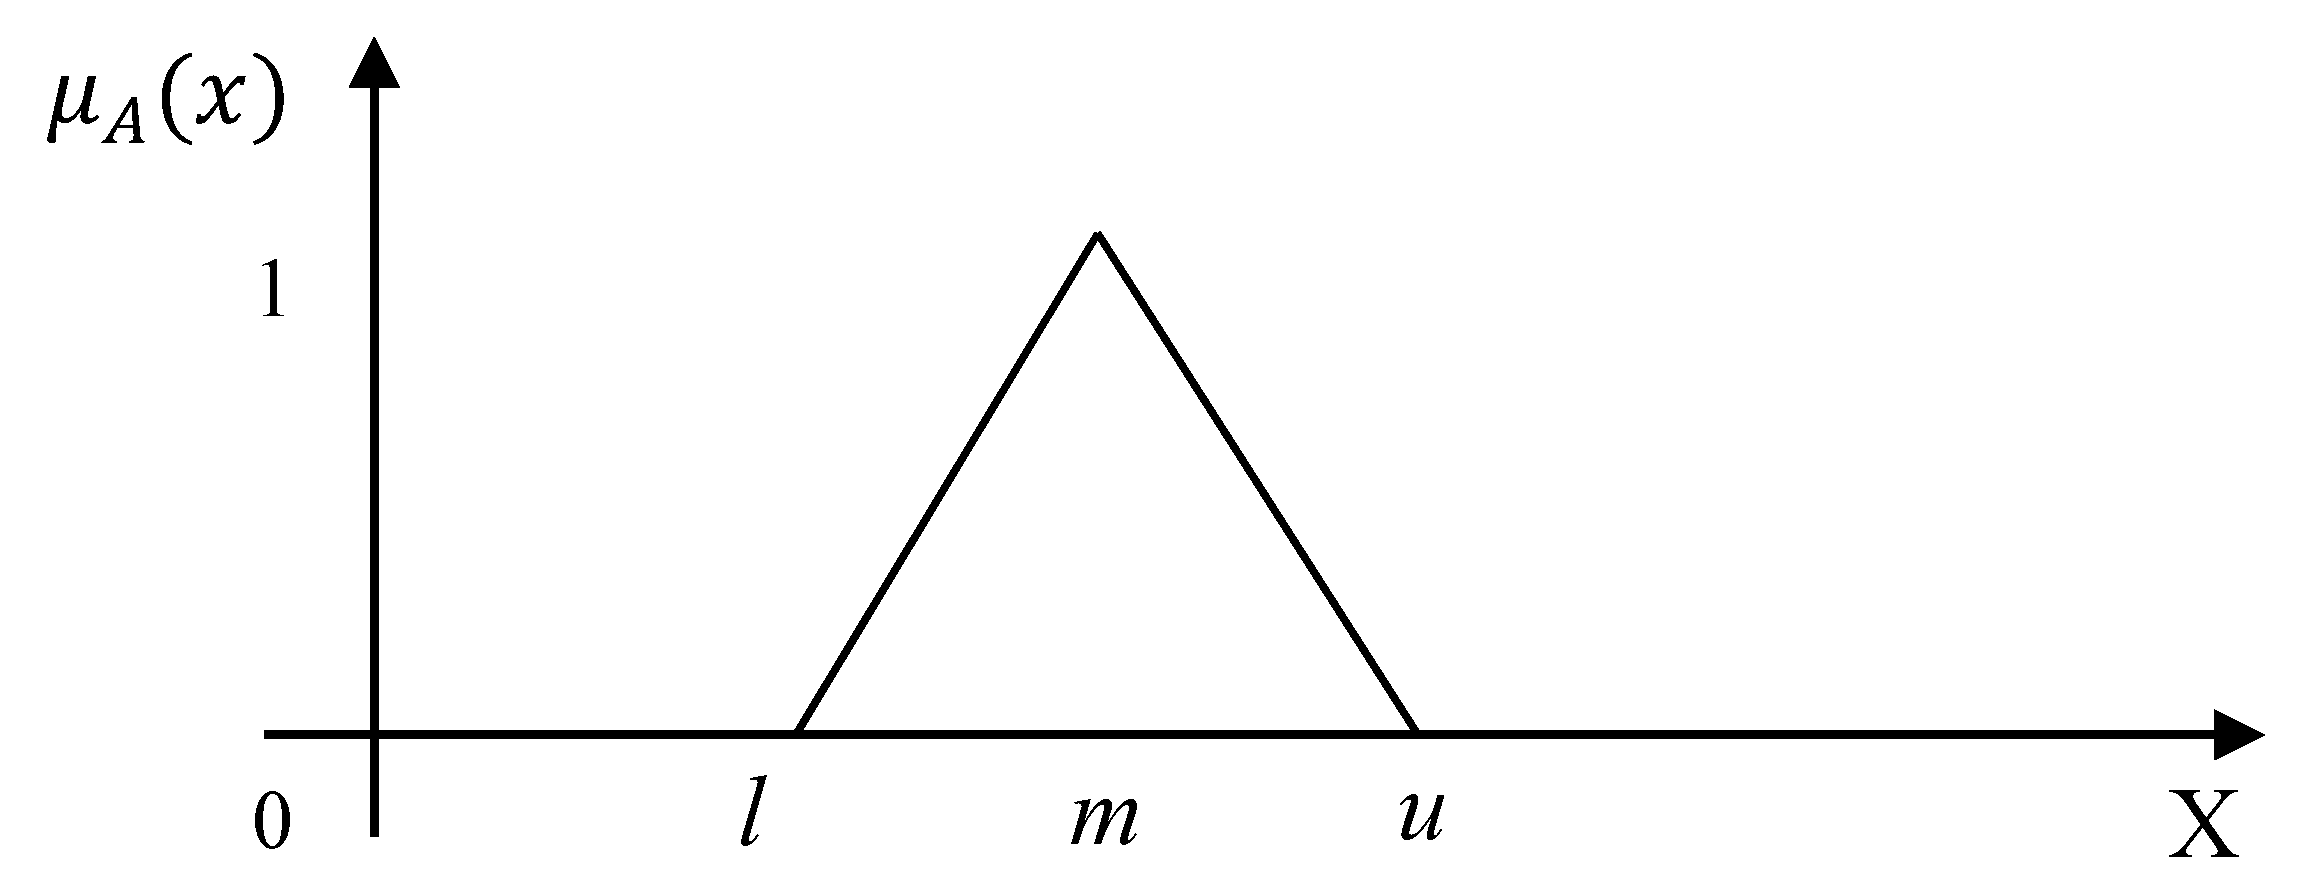
The fuzzy-AHP method is based on fuzzy numbers. There are several methods for representing fuzzy numbers, such as the triangular and Gaussian methods. However, triangular fuzzy membership functions represent quite a simple and fast method with reliable results, that are commonly employed in many studies to represent fuzzy numbers [30,48]. Therefore, in this study, the triangular fuzzy membership function is employed to compare and express criterion and indicator priorities. Each triangular fuzzy membership function can be defined with three parameters (i.e., l, m, and u), which are presented in Equation (7). Furthermore, Figure 2 schematically shows a fuzzy triangular membership function.
In Equation (7), l, m, and u represent the lower, median, and higher values of the triangular fuzzy membership function, respectively. Additionally, the membership function shows that the degree of membership of element x in the domain X belongs to the fuzzy number A. Many fuzzy-AHP methods that are relying on the triangular fuzzy membership function have been proposed [49]. In this study, we employ Chang’s fuzzy extent analysis [50], because it provides a simple and robust form for a decision-making process. To perform pairwise comparisons in this analysis, some linguistic variables are used. Each linguistic variable can be presented by a triangular fuzzy membership function. The parameters of the triangular fuzzy membership function are specified based on pessimistic, moderate, and optimistic views in pairwise comparisons. Table 2 presents linguistic variables with their fuzzy triangular numbers and parameters.
After pairwise comparisons, how indicators and criteria are weighted is determined based on three views: pessimistic, moderate, and optimistic. In order to compute TOD levels, the indicators and criteria are aggregated based on these three types of weights. However, in order to have robust results, the values of indicators should be normalized, since indicators have their own domains. These domains are different from each other and have effects on the aggregation result. In order to counter this, the normalization process converts the domain of each indicator into a specific value between 0 and 1. In order to normalize the indicators, Equation (8) is utilized:
where xi is the value of ith indicator and xnorm is the normalized value of that indicator.
2.4. The Fourth Stage: Evaluating the TOD Index
To evaluate the reliability of the proposed method, the TOD map that is obtained from the moderate view is compared with the two reference data sets provided by the Tehran municipality. In the first comparison, the level of public transit services (i.e., bus and subway services) in the neighborhoods is used as reference data to evaluate the TOD index. Since a neighborhood with a high TOD level may have high values for indicators such as density and diversity, it could need public transit infrastructures to satisfy business trips for its inhabitants. Given this, it is justifiable to evaluate the TOD levels by comparing them with the levels of public transit services in the neighborhoods. In this research, the level of public transit services is evaluated by the ratio of the number of public transit stations in each neighborhood to the total number of stations in the study area. Subsequently, a new index is defined by dividing the public transit level by the TOD level in each neighborhood. This new index is named the ratio of public transit level to the TOD level (RPT index). This indicator is then assigned to a class, depending on the balance of TOD levels and public transit levels in the study area. If the study area is able to appropriately cover its inhabitants’ trip demands, then the RPT index will be assigned to the moderate class.
Second, values of the TOD index are compared to a trip attraction map at the neighborhood scale, derived from Tehran municipality data. Neighborhoods with high TOD levels are liable to have positive factors such as high land use mixedness, accessibility, and street connectivity. These neighborhoods have the necessary capabilities to attract people engaging in different activities, which could be commercial, recreational, or administrative. The comparison between the TOD level and trip attraction is a way to evaluate the TOD index. For this purpose, an analogous classification process is used for TOD levels and trip attraction values. Following this, the number of neighborhoods belonging to the same class in the two classified maps is computed before being finally divided by the total number of neighborhoods in the region. This method provides an accordance index between the TOD levels and trip attraction maps. The higher the value of the accordance index, the more efficient the model.
3. Results
In order to produce the TOD index, all of the indicators are calculated in the vector format, at the neighborhood scale. To calculate the indicators’ equations, some parameters should be set. To calculate the entropy indicator (Equation (2)), eight types of land uses—residential, commercial, administrative, recreational, educational, health, sport, and religious land uses—were considered. Therefore, in Equation (2), each of these land uses is represented by parameter i, and its total area in the study by parameter Pi, and parameter n is defined as being equal to 8. In order to estimate the accessibility indicator (Equation (5)), all of the commercial and administrative centers are considered to be facilities, while their areas are equated to their attractiveness (parameter Oj). In addition, each neighborhood is defined as parameter i, and the inverse of the distance between each neighborhood’s centroid and each facility center is defined as the travel cost value function (ƒ(Cijm)). To compute the land use mixedness indicator (Equation (6)), a buffer with a 500-m radius around the residential areas is used to investigate the total areas for commercial, administrative, and residential land uses, since this buffer distance can still encourage people to walk in order to meet their requirements. It should be noted that all of the indicators were computed by ArcGIS and MATLAB. After setting the parameters and calculating the indicators, the latter are normalized using Equation (8), and weights for the criteria and indicators are determined with the fuzzy-AHP method and based on the pessimistic, moderate, and optimistic views [6,26]. As an example, the pairwise comparisons conducted for the TOD criteria are shown in Table 3.
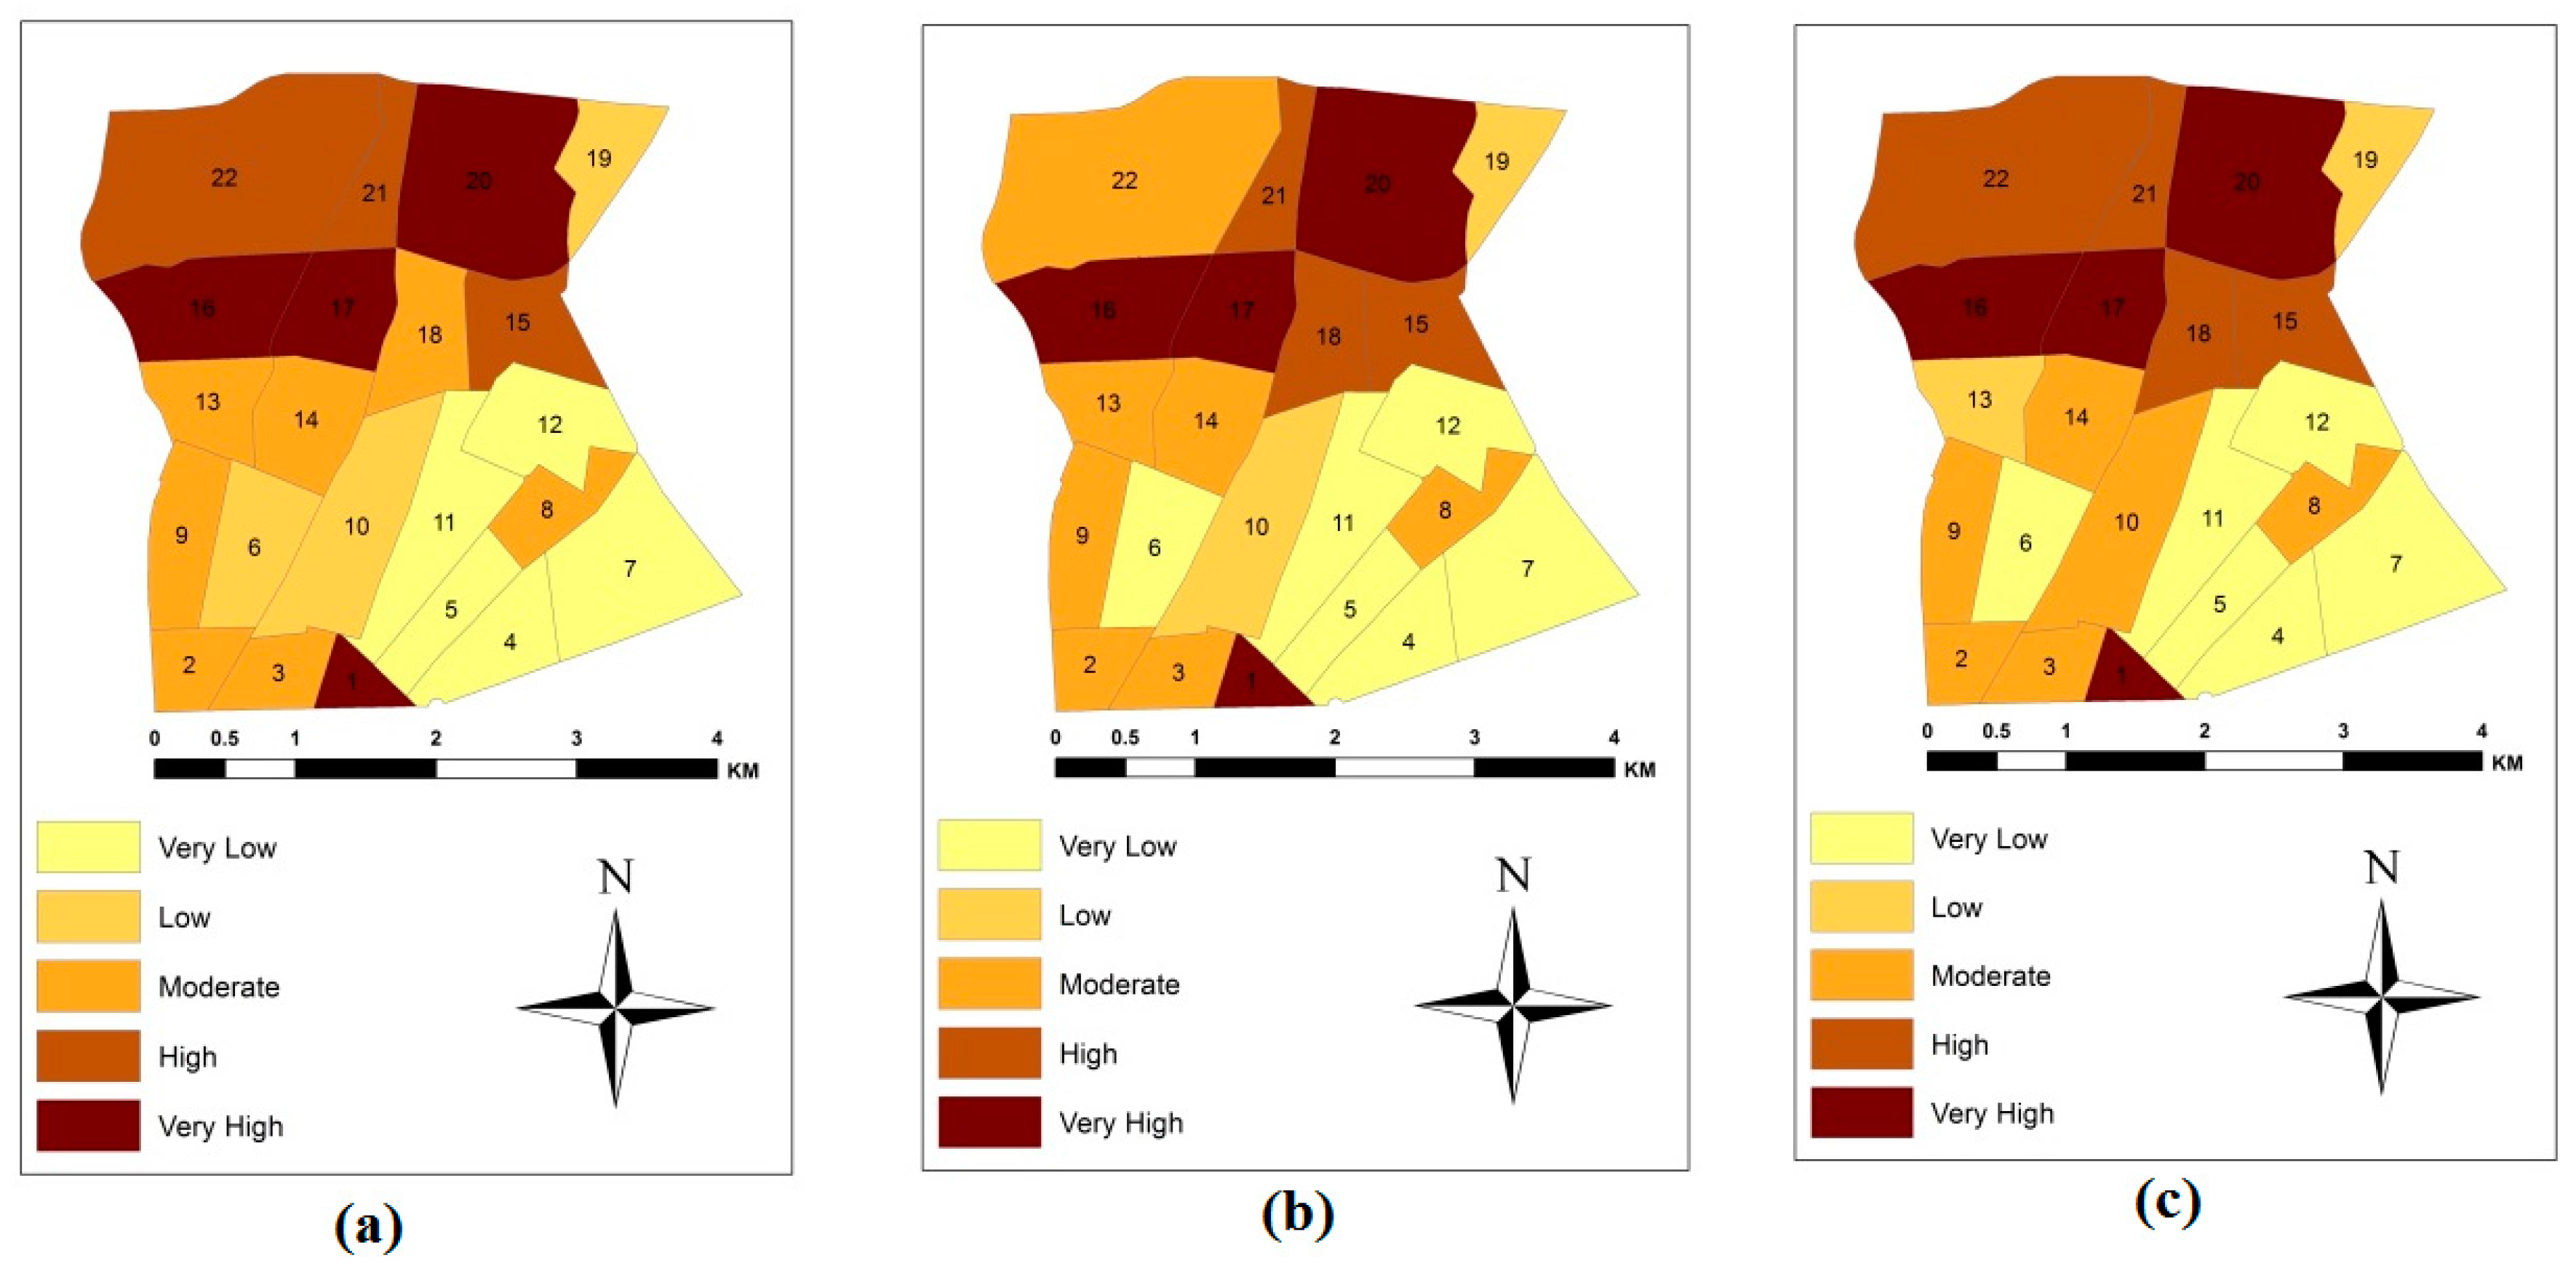
Similarly, these comparisons are performed for the indicators of each criterion to determine their relative weights. Finally, in order to obtain the TOD index, the normalized indicators are aggregated based on their three types of weights. As a result of this aggregation process, three maps are produced based on the optimistic, pessimistic, and moderate views (Figure 3). In Figure 3, in order to render the pattern of TOD levels in the study area, these levels are categorized into five classes: very low, low, moderate, high, and very high. The method that is used for classification is the natural breaks (Jenks) classification method [51].
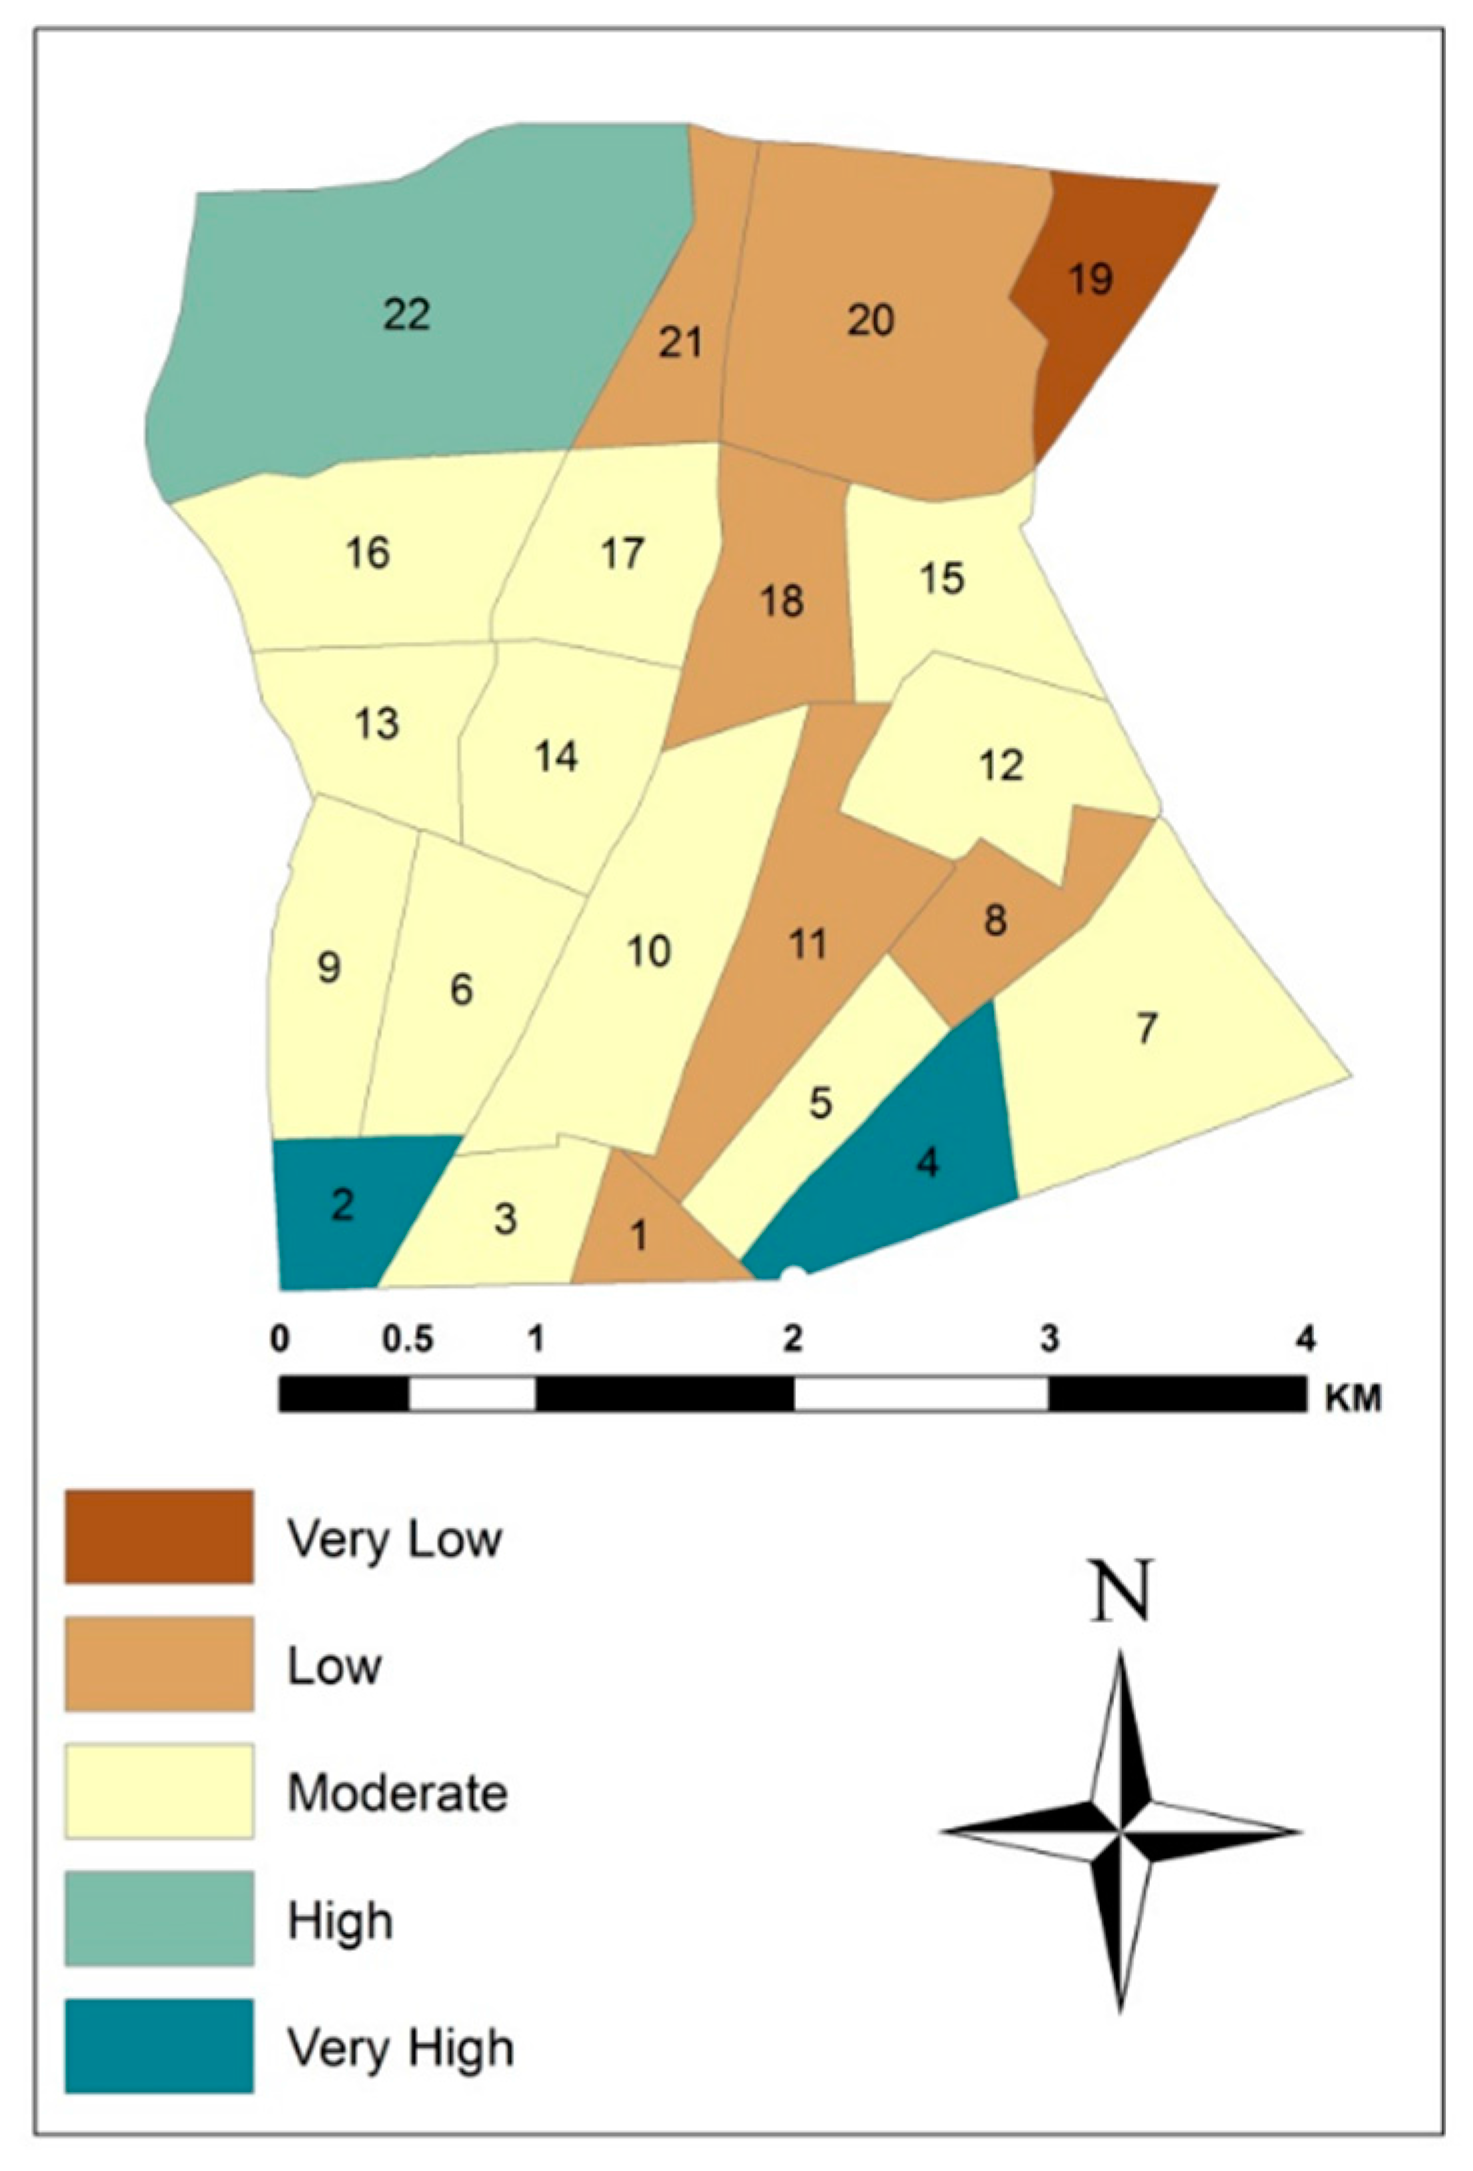
Following the fourth stage of the methodology, the TOD levels that were obtained from the moderate view are compared with two reference data sets. In the first comparison, moderate TOD levels are compared to public transit levels in the study area, and this comparison produces the RPT index, as shown in Figure 4. This comparison shows that the study area exhibits an appropriate balance for these two levels since Figure 4 shows us that most of the neighborhoods (55 percent of the study area) are assigned to the moderate class, while only three neighborhoods (14 percent of the study area) are assigned to very low or very high classes. Additionally, in the second comparison, the moderate TOD levels are compared to a trip attraction map in order to produce the accordance index. In this study, the accordance index is evaluated through three different classifications, consisting of three, five, and seven classes. The result of each classification is presented in Table 4. As an example, Figure 5 shows the results of the five class approach. These comparisons show the high reliability of the proposed model within urban planning.
4. Discussion
According to the result section, the proposed method results in three maps, since the aggregation method, i.e., fuzzy-AHP, computes TOD levels with three different views. These different views allow us to consider the uncertainties inherent in experts’ views, while using the proposed method. Additionally, as illustrated in Figure 3, the maps with different views are highly similar to each other. This indicates that the moderate, optimistic, and pessimistic views result in the same TOD class. Incorporating various views provides a sensitive analysis within TOD planning. The sensitivity analysis is a fundamental component in MCDM problems because it evaluates the robustness of results. This sensitivity analysis shows that the proposed TOD index provides a high degree of reliability. Consequently, fuzzy-AHP offers several advantages for our modeling approach: (1) producing the TOD index based on the various experts’ views; (2) providing more robust results by calculating the indicators’ weights according to the pairwise comparisons, where the inconsistency is computed; (3) providing more realistic results by modeling uncertainties in experts’ views; and, (4) providing a framework for sensitivity analysis.
As shown in Figure 3, neighborhoods 15 to 22 represent high TOD levels because they are located adjacent to two main streets that ensure a high level of walkability and cycling. Additionally, these neighborhoods have other positive characteristics that ensure that they are assigned high TOD levels, such as high land use mixedness, high accessibility to facility centers and recreational areas, and low levels of air pollution and traffic congestions. As a result of these high TOD levels, people are more interested in walking and using public transport services in these neighborhoods. To facilitate the use of public transit, the Tehran municipality has therefore provided several high-efficiency public transit services in these neighborhoods, such as a subway and BRT services. However, according to Cervero et al. [17], from the perspective of sustainable development, developing BRT services opens up opportunities of increasing the TOD level at the regional scale. On the other hand, neighborhoods 4, 5, 7, 8, 11, and 12 represent low TOD levels. This is due to several reasons, such as low street connectivity, the lack of commercial complexes, and the large numbers of dead ends and low-height residential buildings. These shortcomings have forced decision-makers to promote new land use plans in these neighborhoods. Furthermore, according to Figure 4, the RPT index value in most of the neighborhoods is appropriate. This means that there is a balance between the TOD level and the level of public transportation stations in each neighborhood. However, neighborhoods 1, 8, 11, and 18 to 21 have fewer public transportation stations than would be appropriate with respect to their TOD level (i.e., low and very low categories). In view of this inadequacy, the Tehran municipality has decided to develop some new public transportation stations in these areas. This decision confirms the efficiency of the TOD index that is proposed in this study. Therefore, the proposed TOD planning would help urban decision makers manage public transit systems and land use activities.
It should be noted that GIS plays a pivotal role in the proposed TOD planning because it facilitates the calculation of high-precision indicators. It is clear that imprecise indicators, either in the spatial dimension or resulting from attributes of the given indicator, have a prominent effect on the TOD level. For instance, if data sets are gathered at a lower scale and the indicators are computed at this scale, then the reliable TOD values necessary for urban planning are not obtained; or if the model incorporates only very few types of land uses, then the model is not robust in detecting diversity and the TOD level. Accordingly, the proposed model is not case sensitive, given that all of the required indicators for TOD planning are computed precisely, and there is no particular condition in the proposed model that might affect the relevant indicators. However, it should be noted that some of the proposed method’s indicators have a correlation with one another. For instance, the commercial density affects the diversity and land use mixedness.
5. Conclusions
The absence of an applicable and efficient planning approach comprising a wide range of urban planning components—including transportation, land use, and infrastructures—demands that researchers develop integrated planning methods. One of these approaches, which can adequately address the fragmented planning of urban areas, is regional TOD planning. In order to achieve this objective, this study proposed a four-stage methodology to develop a spatial TOD index. In the first stage, a comprehensive set of criteria and indicators for TOD planning were considered. In the second stage, the indicators were precisely computed at the neighborhood scale using GIS, which played a prominent part in achieving efficient and robust results. GIS has high capabilities for coping with MCDM problems in urban planning. In the third stage, a fuzzy-AHP method was used to aggregate the criteria and indicators. As a result, three maps were derived based on the pessimistic, moderate, and optimistic views. These maps provide a sensitivity analysis, since the indicators’ weights were changed according to the views. The sensitivity analysis showed that the variation of indicators’ weights in pessimistic, moderate, and optimistic views did not have a significant impact on the TOD levels. Consequently, the determined TOD levels showed a high degree of reliability at the neighborhood scale. At the fourth stage, in order to evaluate the efficiency of the proposed TOD planning method, the TOD map that was derived from the moderate perspective was compared to two reference data sets derived from Tehran municipality data. These data sets focused on public transit services and trip attraction. The first comparison highlighted the strength of TOD planning within transportation planning, given that it revealed how the proposed TOD planning has the capacity to evaluate the adequacy of the current public transit network in the area. Additionally, the proposed method aids decision-makers in finding the neighborhoods that need to develop public transit services. The second comparison revealed that the TOD planning had an accuracy of 77 percent in computing neighborhoods’ trip attraction.
It should be noted that the vector data format had an underpinning effect on the reliability of the results, since it allowed for the model to use topological and metric functions when computing the indicators. However, the precision of the vector data, either regarding attributes or regarding the spatial dimension, was another factor in producing a reliable result. If, for instance, the types of land use are minimized to two (residential and non-residential), the precision of indicators, such as diversity and land use mixedness, are dramatically deteriorated. Additionally, if the spatial scale of the data set shrinks to below 1:2000, then the precision of the metric calculation is reduced. Model reliability is therefore limited to the precision of the data sets. It should be noted that the model’s use of the indicators is not case sensitive, and the same model can be used in other cities with them. However, the indicators’ weights are based on the experts of different cities and can therefore be changed.
For future research in TOD planning, since the indicators have a degree of correlation with each other, it would be useful to consider this correlation in the aggregation function of the fuzzy-ANP method. Additionally, we suggest that an efficient Spatial Decision Support System (SDSS) should be developed, in order to make optimum decisions for improving the TOD levels in given neighborhoods. This SDSS would incorporate several factors, such as the policies of the municipality, neighborhood attributes, and environmental objectives. In addition, we highly recommend that a temporal dimension be considered within TOD planning, as some indicators change over time. For instance, the value of the accessibility indicator differs over a day because public transit systems adjust their services to the time of a day. Another future route we recommend would be to use advanced fuzzy expert systems, such as those presented in [30,31,34], for TOD planning, because these systems model the experts’ knowledge together with its inherent uncertainties and ambiguities.
Acknowledgments
The authors acknowledge the Tehran municipality for providing the data used in this study.
Author Contributions
Hamid Motieyan and Mohammad Saadi Mesgari conceived and designed the experiments; Hamid Motieyan performed the experiments; Hamid Motieyan and Mohammad Saadi Mesgari analyzed the data; Hamid Motieyan contributed reagents/materials/analysis tools; Hamid Motieyan wrote the paper.
Conflicts of Interest
The authors declare no conflict of interest.
References
- Bertolini, L.; Le Clercq, F.; Kapoen, L. Sustainable accessibility: A conceptual framework to integrate transport and land use plan-making. Two test-applications in The Netherlands and a reflection on the way forward. Transp. Policy 2005, 12, 207–220. [Google Scholar] [CrossRef]
- Chawla, L. Growing Up in an Urbanizing World; Routledge: New York, NY, USA, 2016. [Google Scholar]
- Sung, H.; Oh, J.-T. Transit-oriented development in a high-density city: Identifying its association with transit ridership in Seoul, Korea. Cities 2011, 28, 70–82. [Google Scholar] [CrossRef]
- Shirzadi Babakan, A.; Alimohammadi, A.; Taleai, M. An agent-based evaluation of impacts of transport developments on the modal shift in Tehran, Iran. J. Dev. Eff. 2015, 7, 230–251. [Google Scholar] [CrossRef]
- Singh, Y.; Zuidgeest, M.; Flacke, J.; van Maarseveen, M. A design framework for measuring transit oriented development. WIT Trans. Built Environ. 2012, 128, 719–730. [Google Scholar]
- Evans, I.; Pratt, R.H.; Stryker, A.; Kuzmyak, J.R. Transit-Oriented Development—Traveler Response to Transportation System Changes; Transportation Research Board: Washington, DC, USA, 2007. [Google Scholar]
- Babakan, A.S.; Taleai, M. Impacts of transport development on residence choice of renter households: An agent-based evaluation. Habitat Int. 2015, 49, 275–285. [Google Scholar]
- Waddell, P.; Ulfarsson, G.F.; Franklin, J.P.; Lobb, J. Incorporating land use in metropolitan transportation planning. Transp. Res. Part A 2007, 41, 382–410. [Google Scholar] [CrossRef]
- Yim, K.K.; Wong, S.; Chen, A.; Wong, C.K.; Lam, W.H. A reliability-based land use and transportation optimization model. Transp. Res. Part C 2011, 19, 351–362. [Google Scholar] [CrossRef]
- Shirzadi Babakan, A.; Alimohammadi, A. An Agent-Based Simulation of Residential Location Choice of Tenants in Tehran, Iran. Trans. GIS 2016, 20, 101–125. [Google Scholar] [CrossRef]
- Cervero, R. Integration of urban transport and urban planning. In The Challenge of Urban Government: Policies and Practices; World Bank Publications: Washington, DC, USA, 2001; pp. 407–427. ISBN 978-0-8213-4738-6. [Google Scholar]
- Singh, Y.J.; Fard, P.; Zuidgeest, M.; Brussel, M.; van Maarseveen, M. Measuring transit oriented development: A spatial multi criteria assessment approach for the city region Arnhem and Nijmegen. J. Transp. Geogr. 2014, 35, 130–143. [Google Scholar] [CrossRef]
- Jain, P.; Jain, P. Sustainability assessment index: A strong sustainability approach to measure sustainable human development. Int. J. Sustain. Dev. World Ecol. 2013, 20, 116–122. [Google Scholar] [CrossRef]
- Türe, C. A methodology to analyse the relations of ecological footprint corresponding with human development index: Eco-sustainable human development index. Int. J. Sustain. Dev. World Ecol. 2013, 20, 9–19. [Google Scholar] [CrossRef]
- Cervero, R. Transit-Oriented Development in the United States: Experiences, Challenges, and Prospects; Transportation Research Board: Washington, DC, USA, 2004; Volume 102. [Google Scholar]
- Cervero, R. Transit-oriented development and land use. In Transportation Technologies for Sustainability; Springer: New York, NY, USA, 2013; pp. 947–958. [Google Scholar]
- Cervero, R.; Dai, D. Brt tod: Leveraging transit oriented development with bus rapid transit investments. Transp. Policy 2014, 36, 127–138. [Google Scholar] [CrossRef]
- Nasri, A.; Zhang, L. The analysis of transit-oriented development (tod) in Washington, DC and baltimore metropolitan areas. Transp. Policy 2014, 32, 172–179. [Google Scholar] [CrossRef]
- Calthorpe, P. The Next American Metropolis: Ecology, Community, and the American Dream; Princeton Architectural Press: New York, NY, USA, 1993. [Google Scholar]
- Cervero, R.; Ferrell, C.; Murphy, S. Transit-Oriented Development and Joint Development in the United States: A Literature Review; Transportation Research Board: Washington, DC, USA, 2002. [Google Scholar]
- Belzer, D.; Autler, G. Transit Oriented Development: Moving from Rhetoric to Reality; Brookings Institution Center on Urban and Metropolitan Policy: Washington, DC, USA, 2002. [Google Scholar]
- Parker, T. Statewide Transit-Oriented Development Study: Factors for Success in California; California Department of Transportation (Caltrans): Sacramento, CA, USA, 2002.
- Dur, F.; Yigitcanlar, T.; Bunker, J. A spatial-indexing model for measuring neighbourhood-level land-use and transport integration. Environ. Plan. B 2014, 41, 792–812. [Google Scholar] [CrossRef]
- Zimbabwe, S.; Anderson, A. Planning for Tod at the Regional Scale: The Big Picture; The Center for Transit-Oriented Development: Washington, DC, USA, 2011. [Google Scholar]
- America, R. Why Transit-Oriented Development and Why Now? Reconnecting America: Okland, CA, USA, 2007. [Google Scholar]
- Renne, J.L.; Wells, J.S. Transit-Oriented Development: Developing a Strategy to Measure Success; Transportation Research Board: Washington, DC, USA, 2005. [Google Scholar]
- Wey, W.-M. Smart growth and transit-oriented development planning in site selection for a new metro transit station in Taipei, Taiwan. Habitat Int. 2015, 47, 158–168. [Google Scholar] [CrossRef]
- Wey, W.-M.; Zhang, H.; Chang, Y.-J. Alternative transit-oriented development evaluation in sustainable built environment planning. Habitat Int. 2016, 55, 109–123. [Google Scholar] [CrossRef]
- Motieyan, H.; Mesgari, M.S. A novel spatial index using spatial analyses and hierarchical fuzzy expert system for obtaining green tod: A case study in Tehran city. Geocarto Int. 2017, 1–46. [Google Scholar] [CrossRef]
- Janalipour, M.; Mohammadzadeh, A. Building damage detection using object-based image analysis and anfis from high-resolution image (case study: Bam earthquake, Iran). IEEE J. Sel. Top. Appl. Earth Obs. Remote Sens. 2016, 9, 1937–1945. [Google Scholar] [CrossRef]
- Janalipour, M.; Taleai, M. Building change detection after earthquake using multi-criteria decision analysis based on extracted information from high spatial resolution satellite images. Int. J. Remote Sens. 2017, 38, 82–99. [Google Scholar] [CrossRef]
- Schlossberg, M.; Brown, N. Comparing transit-oriented development sites by walkability indicators. Transp. Res. Rec. J. Transp. Res. Board 2004, 34–42. [Google Scholar] [CrossRef]
- Janalipour, M.; Mohammadzadeh, A. A fuzzy-ga based decision making system for detecting damaged buildings from high-spatial resolution optical images. Remote Sens. 2017, 9, 349. [Google Scholar] [CrossRef]
- Arrington, G.; Cervero, R. Tcrp Report 128: Effects of Tod on Housing, Parking, and Travel; Transportation Research Board of the National Academies: Washington, DC, USA, 2008; Volume 3. [Google Scholar]
- Cervero, R.; Kockelman, K. Travedand and the 3ds: Density, diversity, and design. Transp. Res. Part D 1997, 2, 199–219. [Google Scholar] [CrossRef]
- Ewing, R.; Cervero, R. Travel and the built environment: A synthesis. Transp. Res. Rec. 2001, 87–114. [Google Scholar] [CrossRef]
- Frank, L.D.; Schmid, T.L.; Sallis, J.F.; Chapman, J.; Saelens, B.E. Linking objectively measured physical activity with objectively measured urban form: Findings from Smartraq. Am. J. Prev. Med. 2005, 28, 117–125. [Google Scholar] [CrossRef] [PubMed]
- Frank, L.D.; Saelens, B.E.; Powell, K.E.; Chapman, J.E. Stepping towards causation: Do built environments or neighborhood and travel preferences explain physical activity, driving, and obesity? Soc. Sci. Med. 2007, 65, 1898–1914. [Google Scholar] [CrossRef] [PubMed]
- Molster, A.; Schuit, S. Voetsporen rond het station. In Proceedings of the Het Nationaal Verkeerskunde Congres, Rotterdam, The Netherlands, 21–22 November 2013. [Google Scholar]
- Zhang, Y.; Guindon, B. Using satellite remote sensing to survey transport-related urban sustainability: Part 1: Methodologies for indicator quantification. Int. J. Appl. Earth Obs. Geoinf. 2006, 8, 149–164. [Google Scholar] [CrossRef]
- Tresidder, M. Using Gis to Measure Connectivity: An Exploration of Issues; Portland State University: Field Area Paper; School of Urban Studies and Planning, Portland State University: Portland, OR, USA, 2005. [Google Scholar]
- Dill, J. Measuring network connectivity for bicycling and walking. In Proceedings of the 83rd Annual Meeting of the Transportation Research Board, Washington, DC, USA, 11–15 January 2004; pp. 11–15. [Google Scholar]
- Páez, A.; Scott, D.M.; Morency, C. Measuring accessibility: Positive and normative implementations of various accessibility indicators. J. Transp. Geogr. 2012, 25, 141–153. [Google Scholar] [CrossRef]
- Saaty, T.L. The Analytic Hierarchy Process: Planning, Priority Setting, Resource Allocation; McGraw-Hill International Book Company: New York, NY, USA, 1980. [Google Scholar]
- Boroushaki, S.; Malczewski, J. Implementing an extension of the analytical hierarchy process using ordered weighted averaging operators with fuzzy quantifiers in Arcgis. Comput. Geosci. 2008, 34, 399–410. [Google Scholar] [CrossRef]
- Hosseinali, F.; Alesheikh, A.A. Weighting spatial information in gis for copper mining exploration. Am. J. Appl. Sci. 2008, 5, 1187–1198. [Google Scholar] [CrossRef]
- Ertuğrul, İ.; Karakaşoğlu, N. Performance evaluation of turkish cement firms with fuzzy analytic hierarchy process and topsis methods. Expert Syst. Appl. 2009, 36, 702–715. [Google Scholar] [CrossRef]
- Maleki, J.; Hakimpour, F.; Masoumi, Z. A Parcel-Level Model for Ranking and Allocating Urban Land-Uses. ISPRS Int. J. Geo-Inf. 2017, 6, 273. [Google Scholar] [CrossRef]
- Erensal, Y.C.; Öncan, T.; Demircan, M.L. Determining key capabilities in technology management using fuzzy analytic hierarchy process: A case study of turkey. Inf. Sci. 2006, 176, 2755–2770. [Google Scholar] [CrossRef]
- Chang, N.-B.; Parvathinathan, G.; Breeden, J.B. Combining gis with fuzzy multicriteria decision-making for landfill siting in a fast-growing urban region. J. Environ. Manag. 2008, 87, 139–153. [Google Scholar] [CrossRef] [PubMed]
- Jenks, G.F. Optimal Data Classification for Choropleth Maps; Department of Geography, University of Kansas Occasional Paper: New York, NY, USA, 1977. [Google Scholar]
Figure 1.
(a) Tehran and the 7th region and (b) neighborhoods of the 7th region.

Figure 2.
Schematic presentation of a triangular fuzzy membership function.

Figure 3.
Transit Oriented Development (TOD) levels at the neighborhood scale based on three different views including: (a) pessimistic view; (b) moderate view; and (c) optimistic view.
Figure 3.
Transit Oriented Development (TOD) levels at the neighborhood scale based on three different views including: (a) pessimistic view; (b) moderate view; and (c) optimistic view.

Figure 4.
The values of RPT index in the 7th region of Tehran.

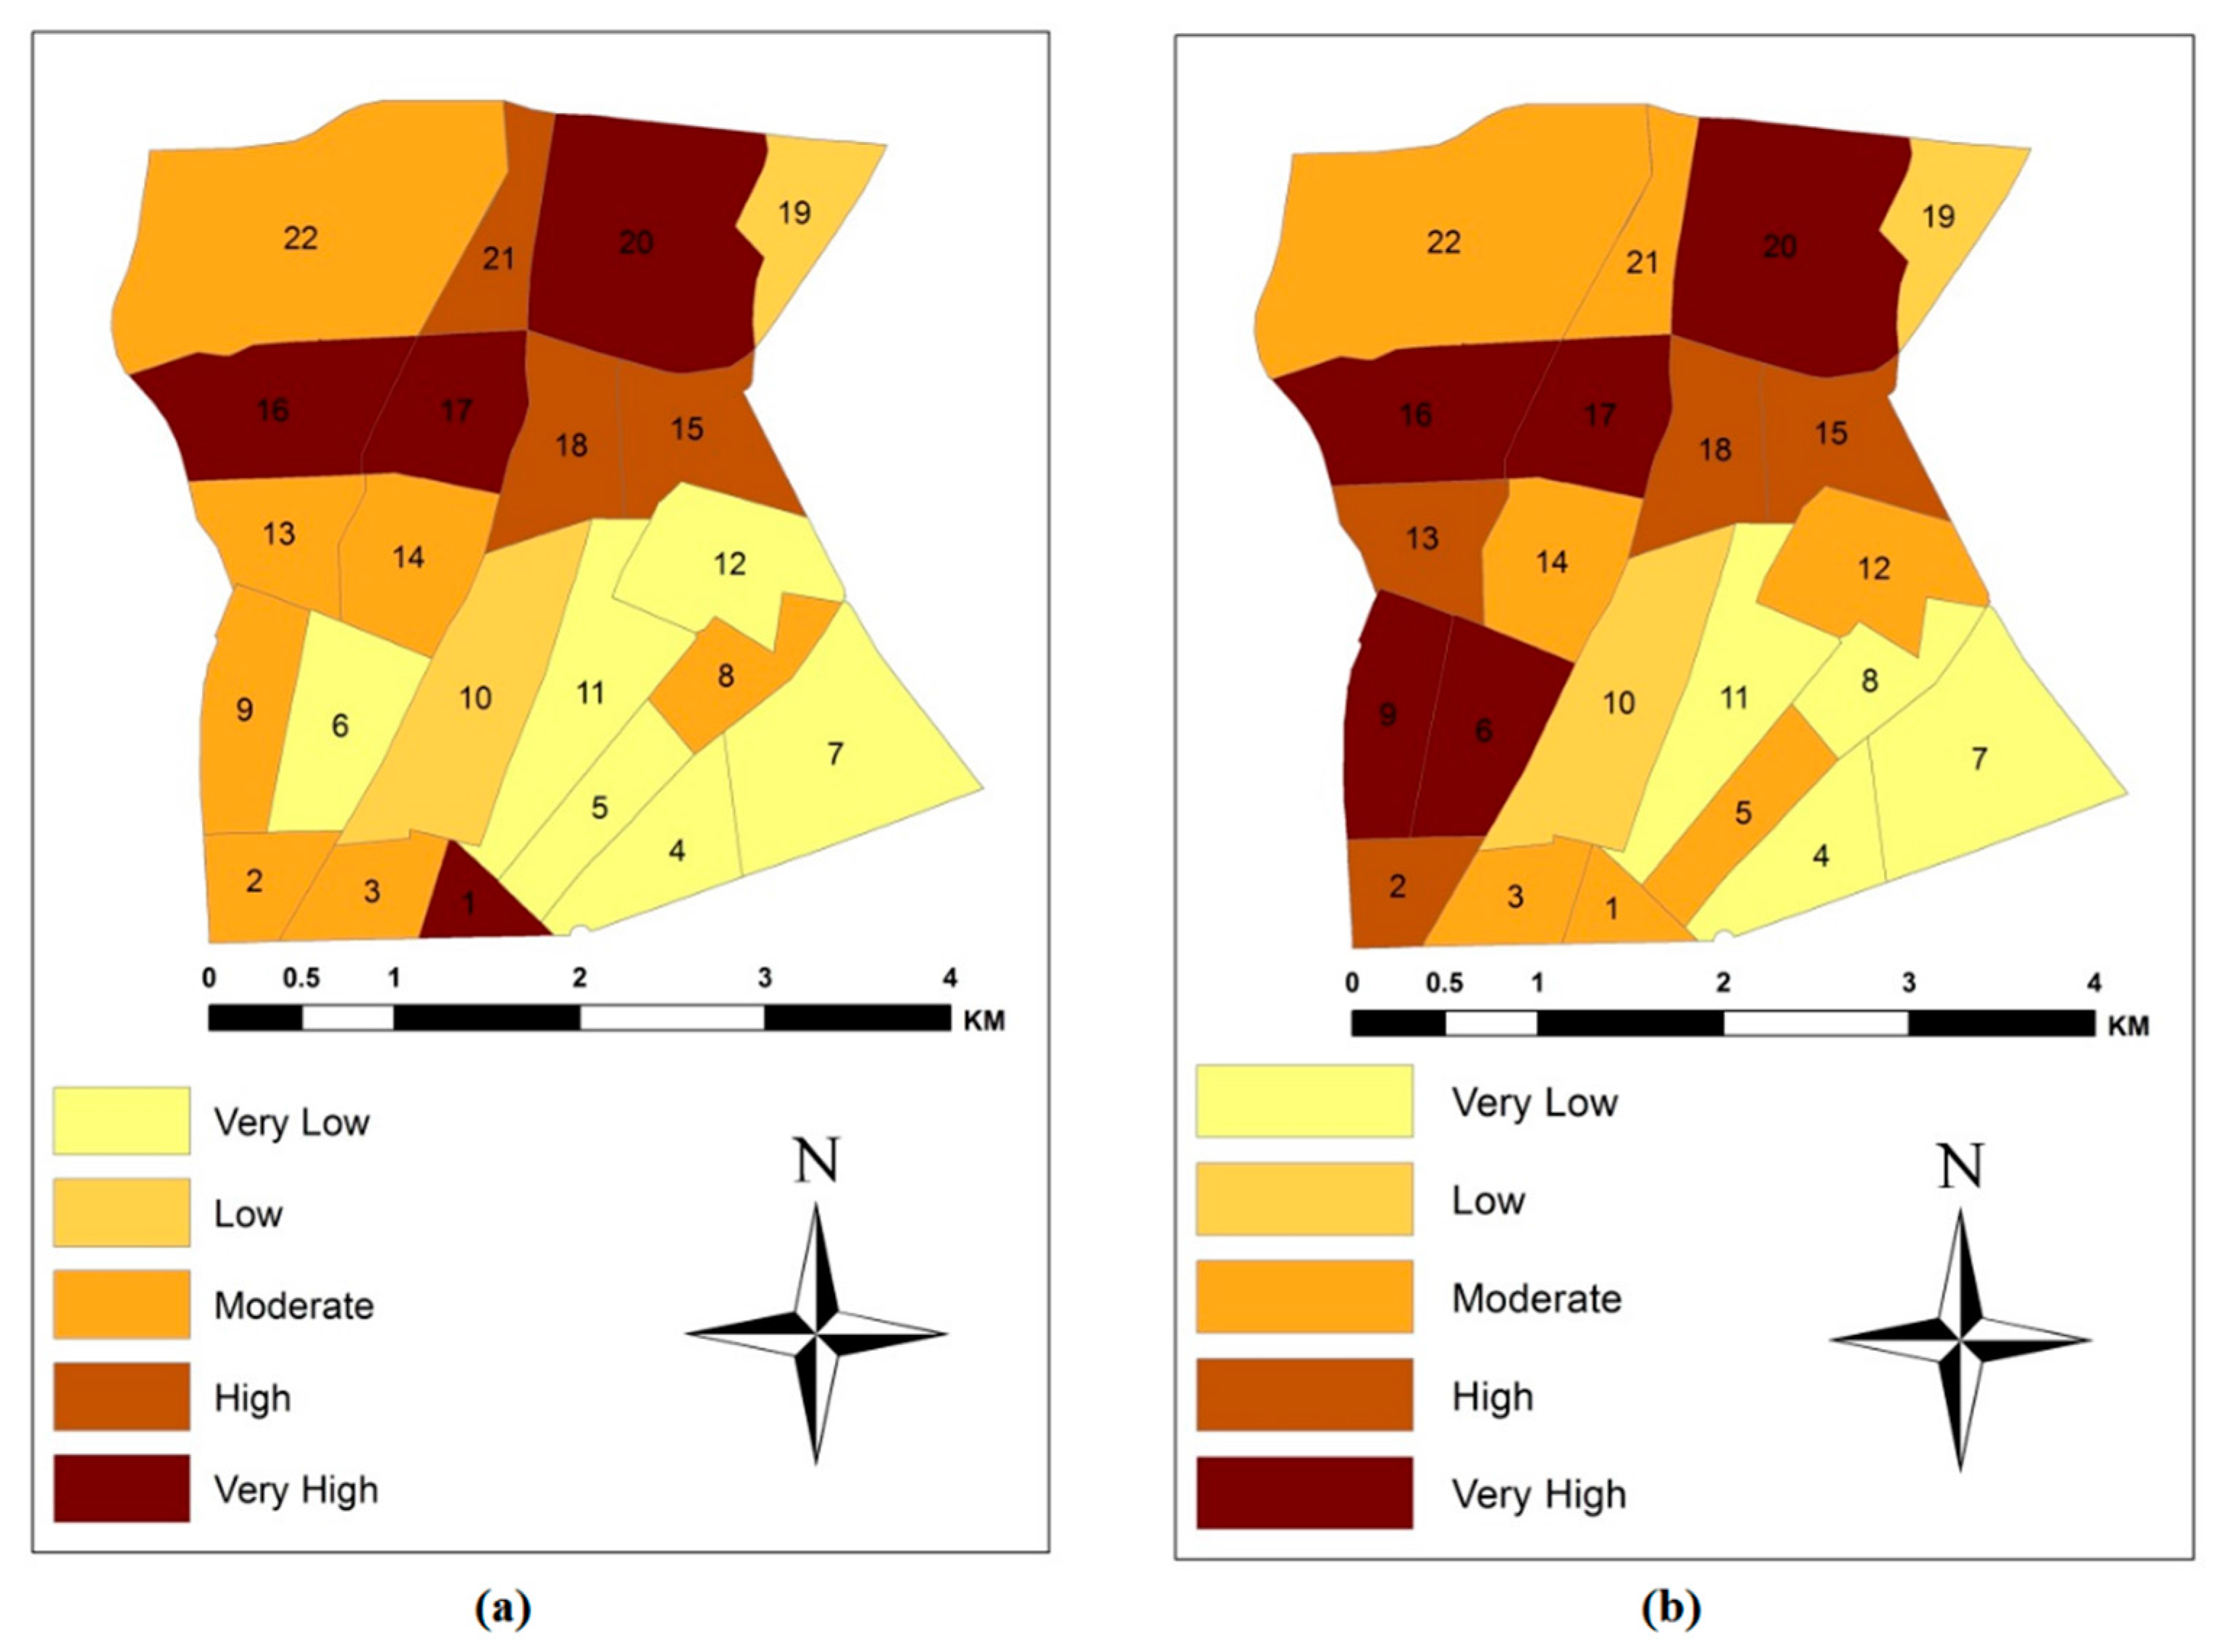
Figure 5.
Comparison between (a) the TOD index based on the moderate view; and (b) the attraction map.
Figure 5.
Comparison between (a) the TOD index based on the moderate view; and (b) the attraction map.

Table 1.
Criteria and indicators of the Transit-Oriented Development index.
| Criteria | Indicators |
|---|---|
| Density | Residential density |
| Commercial density | |
| Administrative density | |
| Diversity | Entropy Index |
| Design | Street connectivity |
| Accessibility | |
| Land use mixedness | |
| Level of streets’ design | |
| Socio-economic development | Population |
| Number of employees | |
| Percentage of young people | |
| Family members | |
| Educational level | |
| Level of facilities |
Table 2.
Fuzzy triangular numbers of linguistic variables.
| Linguistic Variables | Fuzzy Triangular Numbers | Reciprocal Fuzzy Triangular Numbers |
|---|---|---|
| Extremely strong | (9,9,9) | (1/9,1/9,1/9) |
| Very strong | (6,7,8) | (1/8,1/7,1/6) |
| Strong | (4,5,6) | (1/6,1/5,1/4) |
| Moderately strong | (2,3,4) | (1/4,1/3,1/2) |
| Equally strong | (1,1,1) | (1,1,1) |
| Intermediate | (7,8,9), (5,6,7), (3,4,5), (1,2,3) | (1/9,1/8,1/7), (1/7,1/6,1/5), (1/5,1/4,1/3), (1/3,1/2,1) |
Table 3.
Pairwise comparisons between criteria based on pessimistic, moderate, and optimistic views.
Table 3.
Pairwise comparisons between criteria based on pessimistic, moderate, and optimistic views.
| Criteria | Density | Diversity | Design | Socio-Economic Development |
|---|---|---|---|---|
| Density | (1,1,1) | (1,2,3) | (2.5,3.5,4.5) | (4,5,6) |
| Diversity | (1/3,1/2,1) | (1,1,1) | (2,3,4) | (3.5,4.5,5.5) |
| Design | (1/4.5,1/3.5,1/2.5) | (1/4,1/3,1/2) | (1,1,1) | (2,3,4) |
| Socio-economic Development | (1/6,1/5,1/4) | (1/5.5,1/4.5,1/3.5) | (1/4,1/3,1/2) | (1,1,1) |
Table 4.
The ratio of accordance of neighborhoods based on the values of TOD index and the attraction map using different classification methods.
Table 4.
The ratio of accordance of neighborhoods based on the values of TOD index and the attraction map using different classification methods.
| Number of Classes | Ratio of Accordance |
|---|---|
| 3 | 77% |
| 5 | 59% |
| 7 | 45% |
© 2017 by the authors. Licensee MDPI, Basel, Switzerland. This article is an open access article distributed under the terms and conditions of the Creative Commons Attribution (CC BY) license (http://creativecommons.org/licenses/by/4.0/).
Share and Cite
MDPI and ACS Style
Motieyan, H.; Mesgari, M.S. Towards Sustainable Urban Planning Through Transit-Oriented Development (A Case Study: Tehran). ISPRS Int. J. Geo-Inf. 2017, 6, 402. https://doi.org/10.3390/ijgi6120402
AMA Style
Motieyan H, Mesgari MS. Towards Sustainable Urban Planning Through Transit-Oriented Development (A Case Study: Tehran). ISPRS International Journal of Geo-Information. 2017; 6(12):402. https://doi.org/10.3390/ijgi6120402
Chicago/Turabian StyleMotieyan, Hamid, and Mohammad Saadi Mesgari. 2017. "Towards Sustainable Urban Planning Through Transit-Oriented Development (A Case Study: Tehran)" ISPRS International Journal of Geo-Information 6, no. 12: 402. https://doi.org/10.3390/ijgi6120402
Note that from the first issue of 2016, this journal uses article numbers instead of page numbers. See further details here.