Holo3DGIS: Leveraging Microsoft HoloLens in 3D Geographic Information

1
State Key Laboratory of Information Engineering in Surveying, Mapping and Remote Sensing, Wuhan University, 129 Luoyu Road, Wuhan 430079, China
2
Collaborative Innovation Center of Geospatial Technology, 129 Luoyu Road, Wuhan 430079, China
3
TianShui Sanhe Digital Surveying and Mapping Institute Co., Ltd., 1 Mingzhudong Road, Tianshui 741000, China
*
Author to whom correspondence should be addressed.
ISPRS Int. J. Geo-Inf. 2018, 7(2), 60; https://doi.org/10.3390/ijgi7020060
Submission received: 4 January 2018
/
Revised: 6 February 2018
/
Accepted: 8 February 2018
/
Published: 9 February 2018
Abstract
:Three-dimensional geographic information systems (3D GIS) attempt to understand and express the real world from the perspective of 3D space. Currently, 3D GIS perspective carriers are mainly 2D and not 3D, which influences how 3D information is expressed and further affects the user cognition and understanding of 3D information. Using mixed reality as a carrier of 3D GIS is promising and may overcome problems when using 2D perspective carriers in 3D GIS. The objective of this paper is to propose an architecture and method to leverage the Microsoft HoloLens in 3D geographic information (Holo3DGIS). The architecture is designed according to three processes for developing holographic 3D GIS; the three processes are the creation of a 3D asset, the development of a Holo3DGIS application, and the compiler deployment of the Holo3DGIS application. Basic geographic data of Philadelphia were used to test the proposed methods and Holo3DGIS. The experimental results showed that the Holo3DGIS can leverage 3D geographic information with the Microsoft HoloLens. By changing the traditional 3D geographic information carrier from a 2D computer screen perspective to mixed reality glasses using the HoloLens 3D holographic perspective, it changed the traditional vision, body sense, and interaction modes, which enables GIS users to experience real 3D GIS.
1. Introduction
Three-dimensional geographic information systems (3D GIS) attempt to understand and express the real world from the perspective of 3D space [1,2,3]. Currently, 3DGIS perspective carriers are mainly 2D (e.g., a computer screen) but not 3D (e.g., a head mounted display), which affects the expression of 3D information and further affects user cognition and understanding of 3D information. Virtual reality (VR), augmented reality (AR), and mixed reality (MR) headsets are common 3D perspective carriers. VR, AR, and MR enhance a user’s sense of experience and reality [4], but they are different from each other. VR places a user in a digital scene with an adequate immersion experience, but it cuts off the physical world [5,6,7]. AR presents a real physical world to a user and overlays digital content over the physical world in real time [8,9,10,11]. However, AR simply superimposes virtual objects into the real environment. It cannot properly handle the relationship between virtual objects and real objects. MR requires that the system can correctly handle the relationship between virtual objects and real objects. MR adopts the advantages of both VR and AR. It achieves a symbiotic blend between reality and virtuality. MR transforms the physical world into the virtual world in real-time completely. As a result, it can see real-world information and virtual reality information [12,13]. MR allows a user to experience depth, spatial persistence, and perspective, while AR cannot [14]. Therefore, using MR as the carrier of 3DGIS is promising and may overcome the problem of perspective 2D carriers in 3DGIS. However, there is a problem; the main problem is the lack of a commonly shared data structure and interface between MR and 3D geospatial information. To address the problem of accessing 3D geospatial information content on the MR platform, a typical MR head-mounted display (Microsoft HoloLens) is utilized as an example in this paper to show how to express and visualize 3D geographic information from a 3D perspective. The HoloLens is a pair of 3D perspective holographic glasses with a central processing unit (CPU), a graphics processing unit (GPU) and a holographic processing unit (HPU) [15]. The HPU is a proprietary chip that handles real-time spatial mapping and processing. The HoloLens has more advanced functions than those of traditional AR devices, such as stereoscopic 3D displays, gaze design, gesture design, spatial sound design, and spatial mapping [16]. Based on the above advantages, the HoloLens have been widely used in the research of visualization applications, including the application of the HoloLens in disasters and emergency management [17], the construction of virtual laboratories [18], the Mars exploration project [19], and anatomical medical, pharmacy, and other fields [20].
The objective of this paper is to propose an architecture and method to leverage the Microsoft HoloLens in 3D geographic information. The architecture is designed according to the three processes for developing a holographic 3DGIS; the three processes are the creation of 3D assets, the development of Holo3DGIS applications, and the compiler deployment of Holo3DGIS applications. For the first process, three methods are proposed, including the preprocessing of 2D basic geographic data, fast 3D modelling based on a specific set of rules, and the transformation of a general 3D model format. For the second process, four interactive methods are proposed, including gaze design, gesture design, voice design and spatial mapping. For the third process, two deployed methods are introduced, including the deployment of small scene patterns and the deployment of large scene patterns. Following this idea, a holographic three-dimensional geographic information system (Holo3DGIS) is realized. Then, basic geographic data of Philadelphia were used to test the proposed methods and Holo3DGIS. The experimental results showed that Holo3DGIS can leverage the Microsoft HoloLens in 3D geographic information.
The remainder of this paper is organized as follows: Section 2 describes the implementation of the proposed method regarding the integration of the HoloLens and 3DGIS. Section 3 describes the contents and results of the experiment and discusses the experiment. Finally, Section 4 concludes this paper and outlines future work.
2. Methods
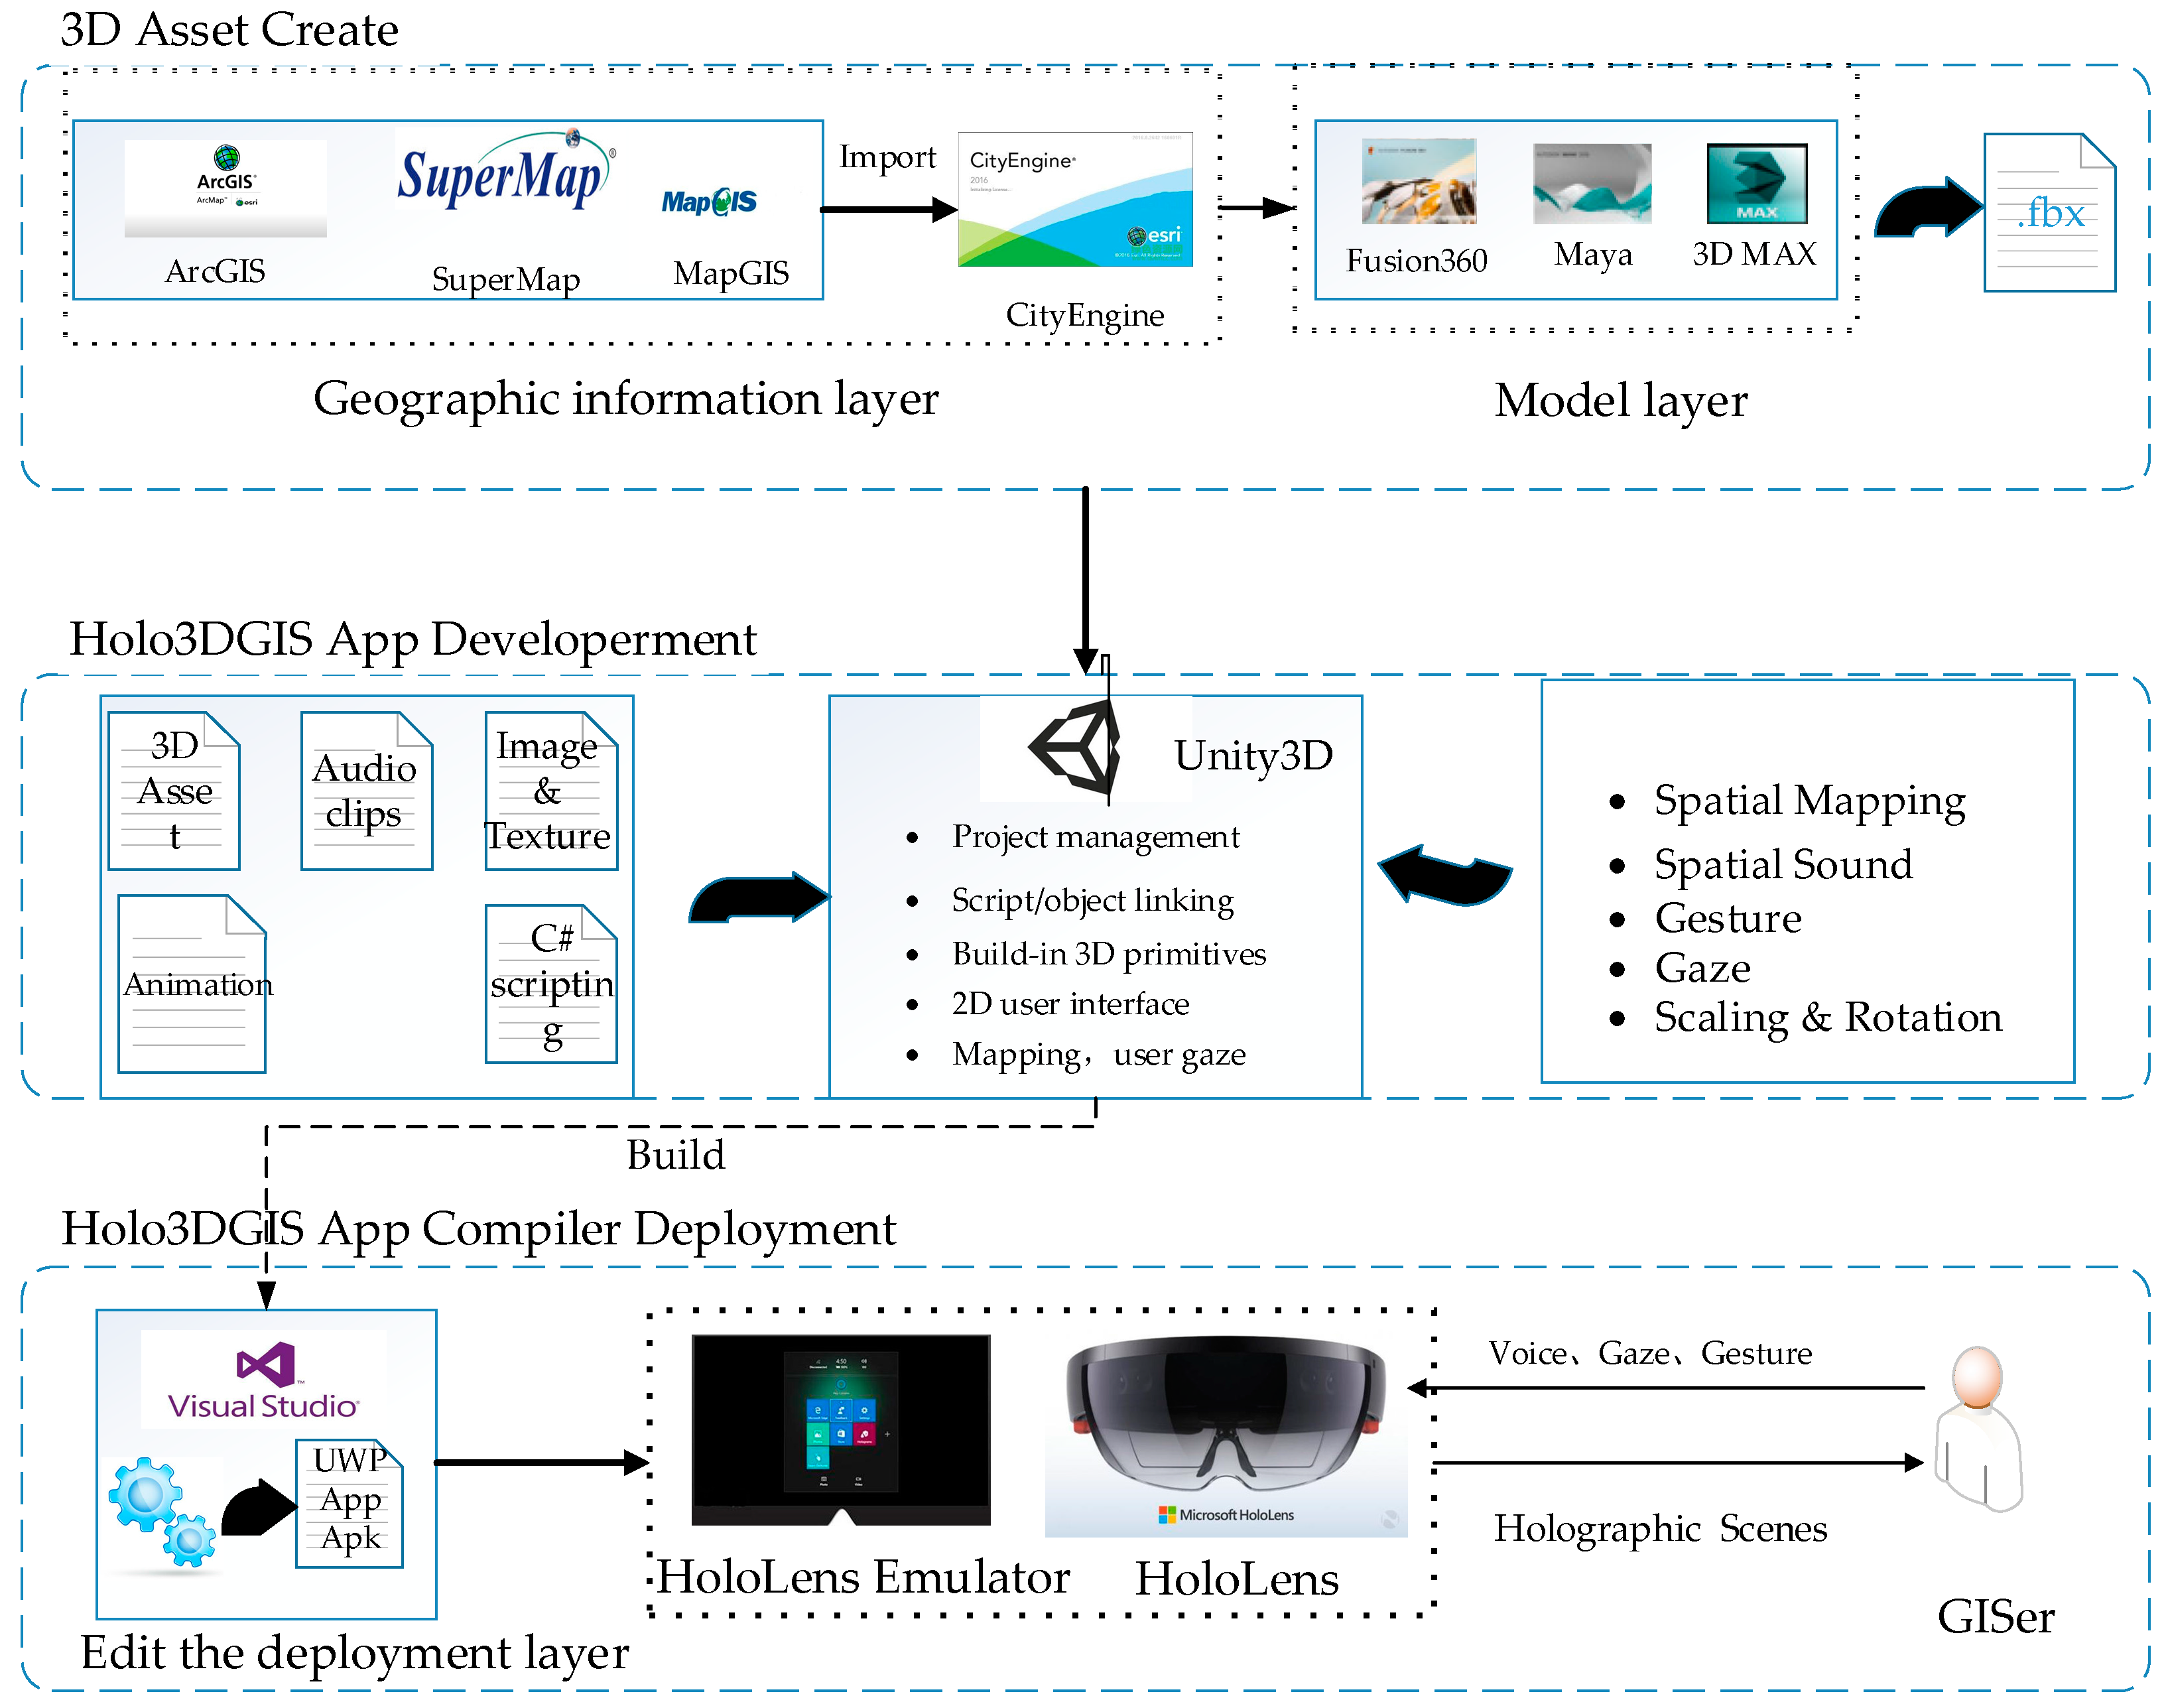
The main goal of this paper is to realize the integration of 3D geographic information and mixed reality with a head-mounted HoloLens display. To achieve this goal, Holo3DGIS is designed, as shown in Figure 1, with three processes: the creation of 3D assets, the development of Holo3DGIS applications, and the compiler deployment of Holo3DGIS applications. Creation of the 3D asset layer provides 3D geographical scene content for the Holo3DGIS application. Development of the Holo3DGIS application layer is responsible for designing the interaction between 3D geographic information and users. Compiler deployment of the Holo3DGIS application layer ensures that the application is deployed to the HoloLens or a high-performance computer.
2.1. Creation of the 3D Asset
A 3D asset mainly includes a geographic scene model and a third-party 3D model, which provide material and content for the Holo3DGIS application. The geographic scene model is a 3D geographical model that is transformed from basic 2D geographic data. The third-party 3D model is a model built by other modelling software. As shown in Figure 1, creation of the 3D asset consists of a geographic information layer and a third-party model layer. The geographic information layer is responsible for preprocessing 2D basic geographic information and rapidly executing the 3D model based on specific rules to create a geographic scene model for Holo3DGIS. The model layer mainly provides a third-party 3D model for Holo3DGIS, making full use of the existing 3D model. Since the default formats of different modelling software are inconsistent, format converters are needed to convert different model formats into a general 3D model with an FBX format (FBX is a free 3D data interchange format across platforms). Figure 2 shows a flowchart of the 3D asset creation method in the Holo3DGIS. The three processes of the flowchart are the preprocessing of 2D basic geographic data, the rapid 3D modelling of the data based on specific rules, and the transformation of the general 3D model format.
2.1.1. Preprocessing of 2D Basic Geographic Data
The preprocessing of 2D basic geographic data is based on the creation of the 3D geographic scene and the model. Basic geographic data mainly include digital elevation models (DEMs), basemaps, point features (e.g., infrastructure and trees), polyline features (e.g., streets), polygon features (e.g., buildings) and other data. Upon obtaining basic geographic data, the data requires preprocessing. The preprocessing of data includes two parts: the transformation of 2D geographic features into 3D geographic features and the levelling of surface data. The data processing steps are as follows:
Step 1: 2D features are transformed into 3D features based on terrain undulation (by the ArcGIS ModelBuilder tool); then, 2D point, line and polygon features can be transformed by batch processing into 3D point, polyline, and polygon features. The main idea is to complete the transformation of 2D features into 3D features using the Z information of the features for interpolation. The specific transformation algorithm flow is shown in Figure 3.
Step 2: The 3D polygons are burned into the DEM. Because most 3D polygons cannot merge into the DEM nicely, they need to be burned into the DEM. Burning includes two parts: editing the triangulated irregular network (TIN) and transforming the TIN into a grid. The specific algorithm flow chart for burning 3D polygons into DEMs is shown in Figure 4.
Step 3: The processed vector data, DEM image, basemap, and other data are stored in the file geodatabase. File geodatabase storage and the management of 3D geographic data provide the data interface for rapid 3D modelling using the CityEngine software.
2.1.2. Rapid 3D Modelling Based on Specific Rules
Three-dimensional geographic modelling requires combined data and attribute data from the 2D geographic information. Based on the CGA (computer generated architecture) [21] rules from CityEngine, the rules are repeatedly optimized to create high-quality 3D content. This paper, based on CityEngine ideals, uses the contoured and attribute information of preprocessed GIS vectors and raster data. Through rule-driven files, this method can quickly batch and generate 3D models of buildings, infrastructure, roads, and other data geographically. These rules can improve the efficiency of 3D modelling. Different geographic objects use different rule files (e.g., rule files for buildings and roads are different). However, the main concept is the same; they are divided and segmented by objects that need to be modelled, then classified and batched for modelling for the same categories. Table 1 shows the rule file for the 3D modelling of buildings. First, the 2D surface features are stretched based on the height property of the building. Then, after stretching, the buildings are divided and segmented according to the actual needs; after that, fine segmentation elements are classified, and the corresponding rules are defined for batch modelling. Finally, textures are attached to the segmented sections using the map function. The model generated by these rules can also manually adjust the height, texture, and other attributes of the model to facilitate personalized customizations.
2.1.3. Transformation of the General 3D Model Format
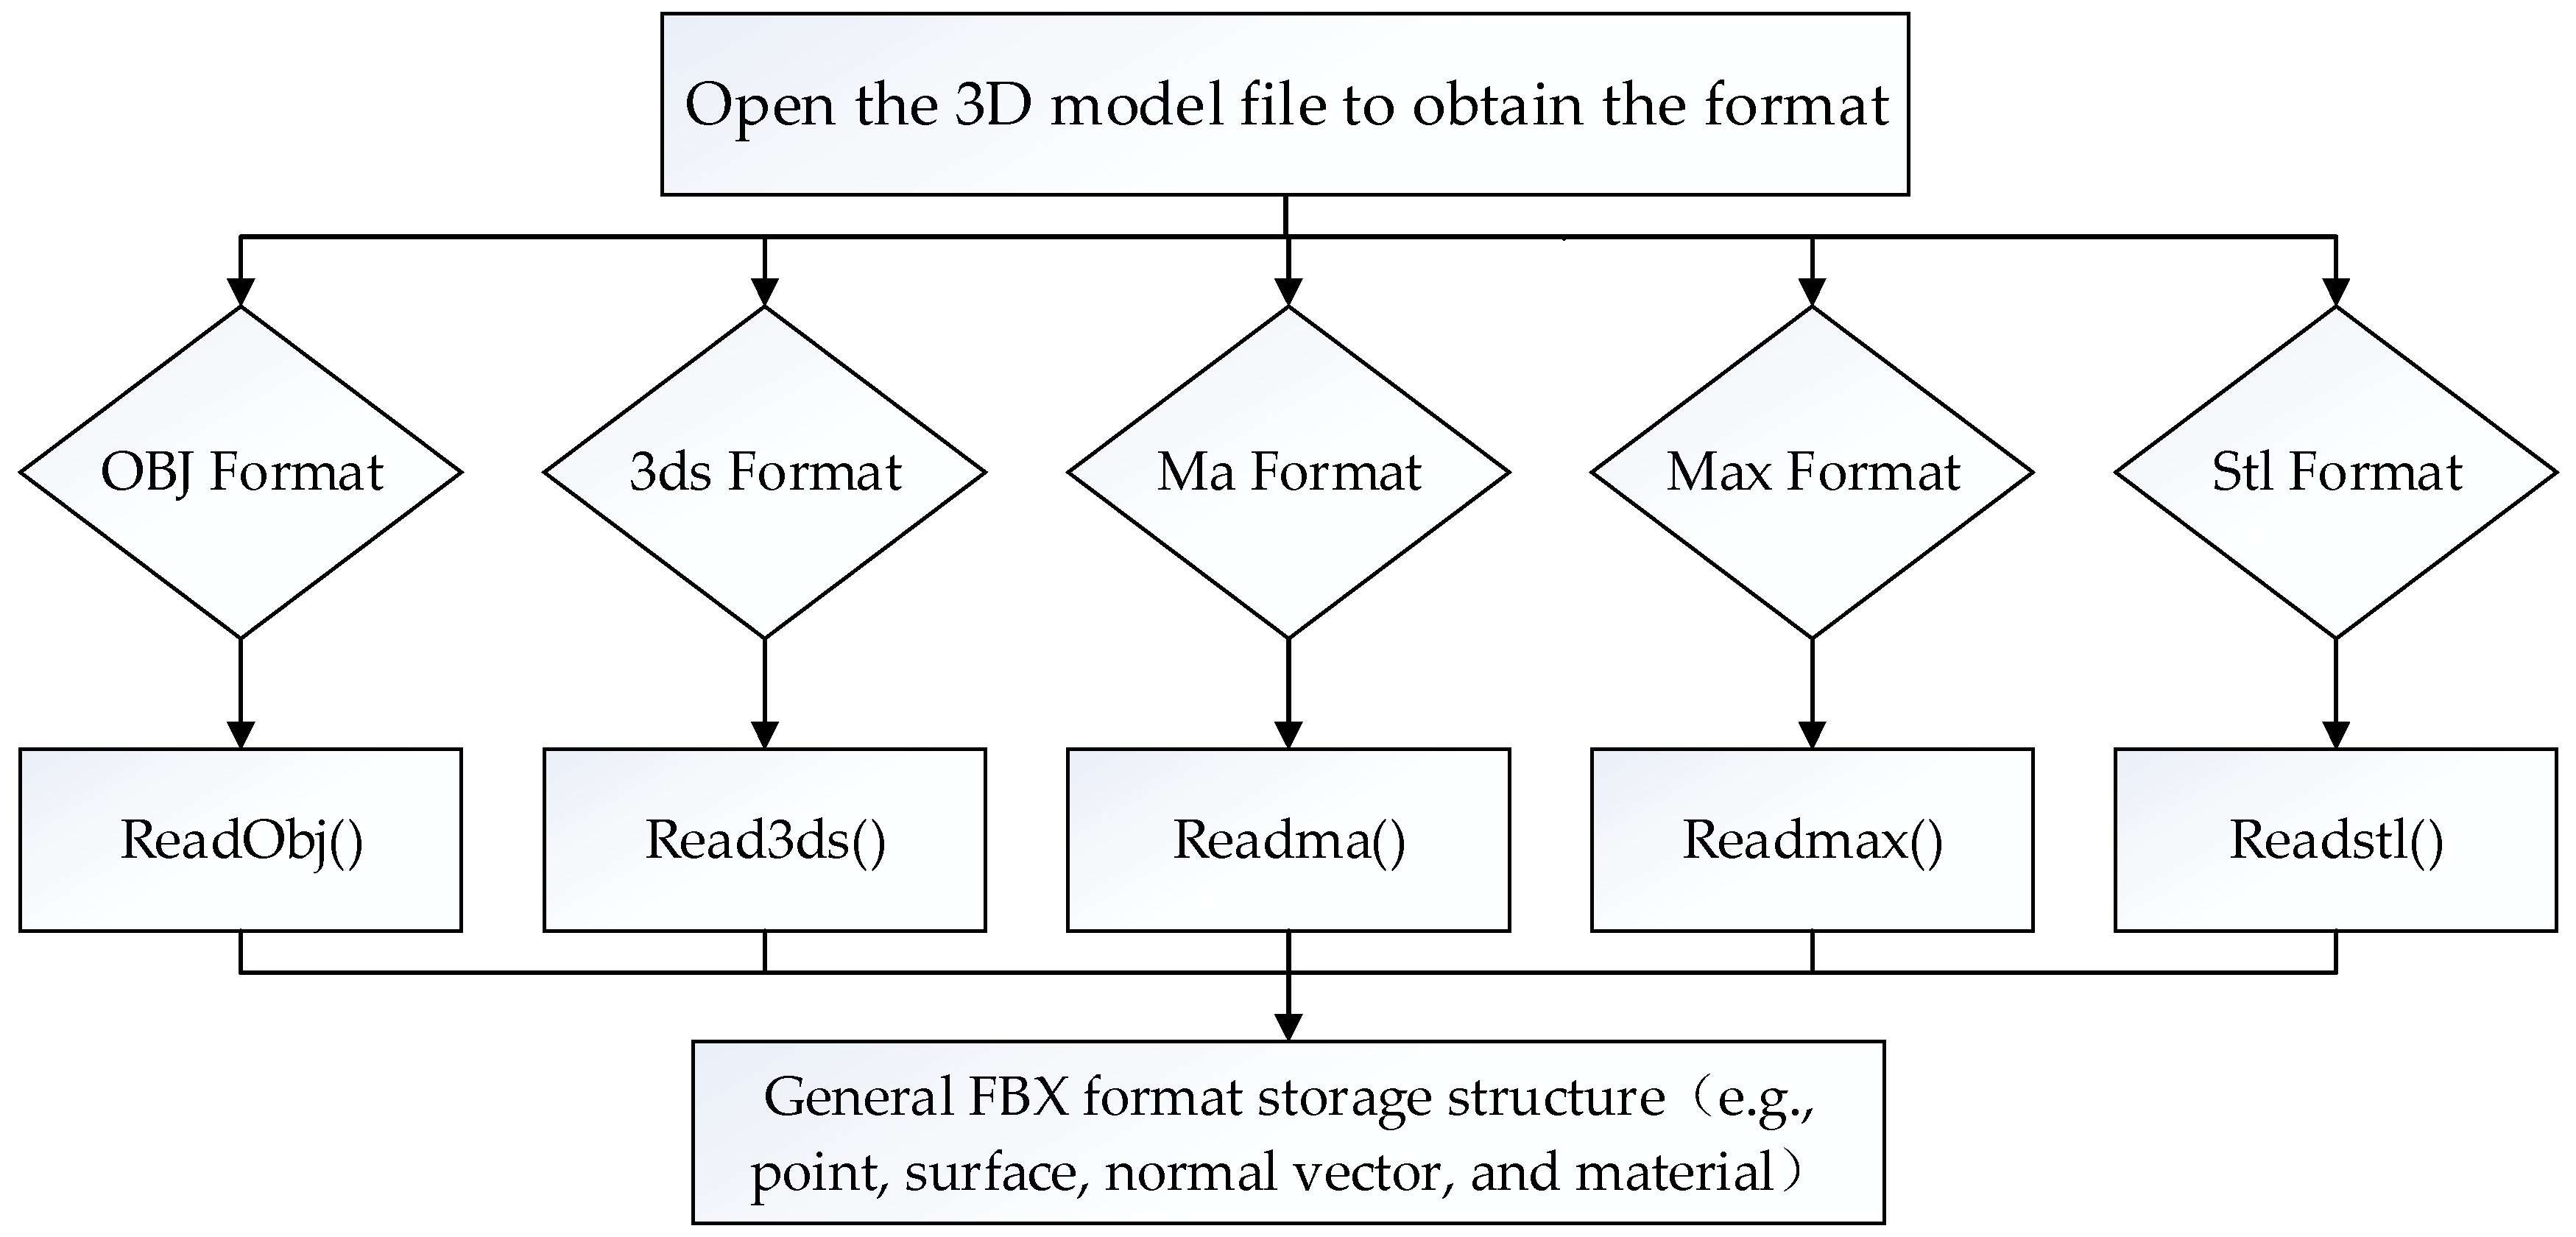
Three dimensional geographic scenes require the use of existing 3D models with different formats (such as Max, obj, x, FBX, and DAE) to save money by reusing 3D models. Different formats of 3D models are incompatible and heterogeneous; therefore, they must be transformed into a general 3D model format. The FBX format is a common and generally-accepted 3D model format. In this paper, different formats of 3D models are transformed into the FBX format. The specific conversion process is shown in Figure 5. First, the 3D model file is obtained; then the format of the file is determined and an existing reading algorithm that matches the format is found. Information on the file points, planes, normal vectors, material texture, and other information are obtained. Finally, these data are stored in the FBX general storage structure.
Through the abovementioned three steps, the creation of the 3D asset has been completed, and the 3D resource is transformed into a uniformly-compatible 3D model. The 3D model provides the basic content for the development of the Holo3DGIS application.
2.2. Holo3DGIS App Development
As shown in Figure 1, the development of the Holo3DGIS application is mainly comprised of two parts. The first part is the geographic scene model, which is created by the 3D asset layer. The second part is the interactive design, which is responsible for the interaction between the user, the virtual geographic world, and the physical world. In this paper, the Unity3D game engine is used as the core development platform. In addition, this study uses the Holotoolkit Software Development Kit (SDK) integrated with the Unity3D game engine. The Holotoolkit SDK integrates the basic class library that is responsible for the interaction design, where voice design, gaze design, and gesture design are responsible for achieving a natural and concise interaction between users and the 3D geographic information. The spatial mapping design is responsible for the interaction between the virtual world and the physical world and the seamless integration of the virtual world with the physical world. Figure 6 shows a logic diagram of the interactive design.
- Gaze design: Based on eye tracking technology, this method is the fastest way to obtain interactions between users and Holo3DGIS applications. It is also the first form of the user interaction input, which is used to track holographic objects. The design of the gaze function needs to not only capture the location of the user’s sight, but also add voices or visual information as feedback to the user. The specific implementation of the gaze function is based on the location and direction of the user’s head using the physical ray of the Unity3D engine; after colliding with the holographic object, the collision results include the location of the collision point and the information of the collision object, which results in the tracking of objects in the holographic geographical scene.
- Gesture design: The function of the gesture design is to transform the user’s intention into actual action. By tracking and capturing the input gesture based on the location and state of the user’s hand, the system automatically creates the appropriate response to manipulate the objects in the holographic geographic scene. Holo3DGIS only recognizes three gestures: air-tap, navigation gesture, and manipulation. The air-tap triggers click and double-click events. The navigation gesture is used to realize the rotation of holographic objects. Manipulation controls the movement of the holographic objects.
- Voice design: The interaction of the user and the holographic object through voice control can anticipate the actions of the user’s hands. The following rules need to be followed in the design of voice control: (1) create very concise commands. On the one hand, this is convenient for system identification. On the other hand, it is convenient for user memory; (2) use simple vocabulary; (3) avoid using single tone commands; and (4) avoid using the HoloLens system commands. Voice control provides users with a voice command experience by setting keywords and corresponding behaviors in the application. When the user speaks the keyword, the pre-set action is used. This method is used to store keywords and corresponding behaviors into the hash table, initialize keyword recognizer instances by registering the keyword, and registering voice commands to accomplish subsequent processing. The purposes of the voice design and the gesture design are the same: to realize the interactions with objects in the holographic geographic scene. However, the methods of realization between the voice design and the gesture design are different.
- Spatial mapping: Spatial mapping can introduce the virtual world into the real world and place the holographic 3D geographical scene into the most suitable location given the user’s physical space to achieve a combination between the real world and the virtual geographic world. The spatial mapping design mainly consists of two steps. First, by using the HoloLens deep camera to scan the target’s physical space, the scanned data and built-in triangulation are obtained to achieve modelling and digitization of the physical world. This is one of the indicators that distinguishes between MR and AR, which refers to the ability to model the physical world with a 3D camera. The second step is to calculate whether or not the digital physical space can fully accommodate the virtual geographic scene. If it can be accommodated, the combination of the virtual and the real worlds is realized. If not, the system provides users with feedback that cannot be combined with the virtual and real worlds. Through surface mapping, the HoloLens avoids placing images in obstructed positions and generates an experience that is contextualized to the user’s location.
2.3. Holo3DGIS App Compiler Deployment
The rendering ability of the HoloLens is limited compared to that of a high-performance personal computer (PC). By taking into account the performance of the ATOM processor (the smallest and least powerful processor in Intel history) and the HoloLens, Microsoft also restricts the volume of the HoloLens application program, where the holographic application cannot exceed 900 MB [22]. Therefore, this article uses two methods to deploy Holo3DGIS based on the application volume. When the volume of the Holo3DGIS application is within 900 MB, the small scene deployment pattern is adopted. When the Holo3DGIS application exceeds the limit of 900 MB, the large scene deployment pattern is adopted.
2.3.1. The Deployment Pattern of Small Scenes
The deployment pattern of small scenes deploys Holo3DGIS applications to the HoloLens devices directly. The process for computing and rendering the entire Holo3DGIS application, including the interaction process, is accomplished independently by the HoloLens. As shown in Figure 7, the holographic application consists of two parts: the physical world and the virtual world. The virtual world refers to the geographic scene created by the 3D asset layer. The physical world refers to the target space acquired by the HoloLens scanning digitization, and the physical world is registered into the virtual world through spatial mapping.
2.3.2. The Deployment Pattern of Large Scenes
Since Holo3DGIS applications are oversized, which leads to HoloLens rendering delays, this paper designs a deployment pattern for large scenes to solve the problem. Figure 8 shows the Holo3DGIS application deployment diagram for large scenes. The main technology of the deployment pattern for large scenes is the use of the HoloLens holographic remote player middleware. With the holographic remote player technology, the HoloLens is connected to the Unity3D engine on a PC. All rendering calculations are transferred from the HoloLens to a high-performance PC. The computer passes the rendered calculations of the holographic image through wireless-fidelity (Wi-Fi) and transmits it to the HoloLens in the form of frames. The HoloLens is only responsible for displaying, capturing, and transmitting interactive information, such as gestures and voices, to the PC computer in real time. During this process, the holographic remote player acts as an intermediate bridge between the PC computer and the HoloLens. The specific deployment design is shown in Figure 8.
3. Experiments and Results
Based on the proposed methodologies, this paper uses basic 2D Philadelphia geographic data and the developer version of Microsoft HoloLens. An experimental scheme based on HoloLens and 3D GIS integration is designed. The experiment mainly uses GIS technology, rapid 3D city modelling technologies, and mixed reality technologies. The technologies were implemented through ArcGIS (Environmental Systems Research Institute, Redlands, CA, USA), CityEngine (Environmental Systems Research Institute, Zurich, Switzerland), Unity3D (Unity Technologies, San Francisco, CA, USA), and HoloLens (Microsoft, Redmond, WA, USA) platforms. The main purposes of the experiment are as follows: first, through the use of spatial mapping technology, the real physical world is introduced into the virtual three-dimensional digital city of Philadelphia. The combination of the virtual world and the real world is integrated. The second goal is to use the 3D stereoscopic display technology of the HoloLens to bring a new and real 3D visual experience to the user. The third goal is to manipulate the holographic digital city by natural interactive means, such as gaze, gesture, and voice. This changes the interactive modes of traditional 3D GIS. The main contents of the experiment are described below.
3.1. Experimental Preparation
The experimental preparation mainly includes three parts: data, software and hardware. Data are the basic content of the experiment. Software is used to develop and deploy Holo3DGIS applications. Hardware renders and runs the platform of the Holo3DGIS application.
- Data: 2D basic geographic information data of Philadelphia [23], including a digital elevation model (DEM), basemap, point features (e.g., infrastructure and trees), polyline features (e.g., streets), polygon features (e.g., buildings), and other data.
- Software: ArcGIS 10.2 (2D GIS data preprocessing), CityEngine 2014.1 (rapid 3D modelling based on specific rules), Unity3D 5.4.0f3 (core engine for the development of Holo3DGIS applications), Visual Studio Community 2015 (a platform for Holo3DGIS application development, compilation, and deployment), and Windows 10 professional version (the HoloLens developer required either Windows 10 Pro, Enterprise, or Education systems).
- Hardware: Microsoft HoloLens developer Edition [24], PC (Dell, Intel (R) Xeon (R) CPU E3—1220 v3 at 3.10 GHz (4 CPUs), ~3.1 GHz).
3.2. Experimental Results and Analyses
This experiment mainly realizes the introduction of a 3D geographical scene into the physical world and provides a holographic 3D geographic information system to users. It brings users a new way to interact with three-dimensional geographic information systems.
3.2.1. Introduction of the Virtual Geographic World into the Physical World
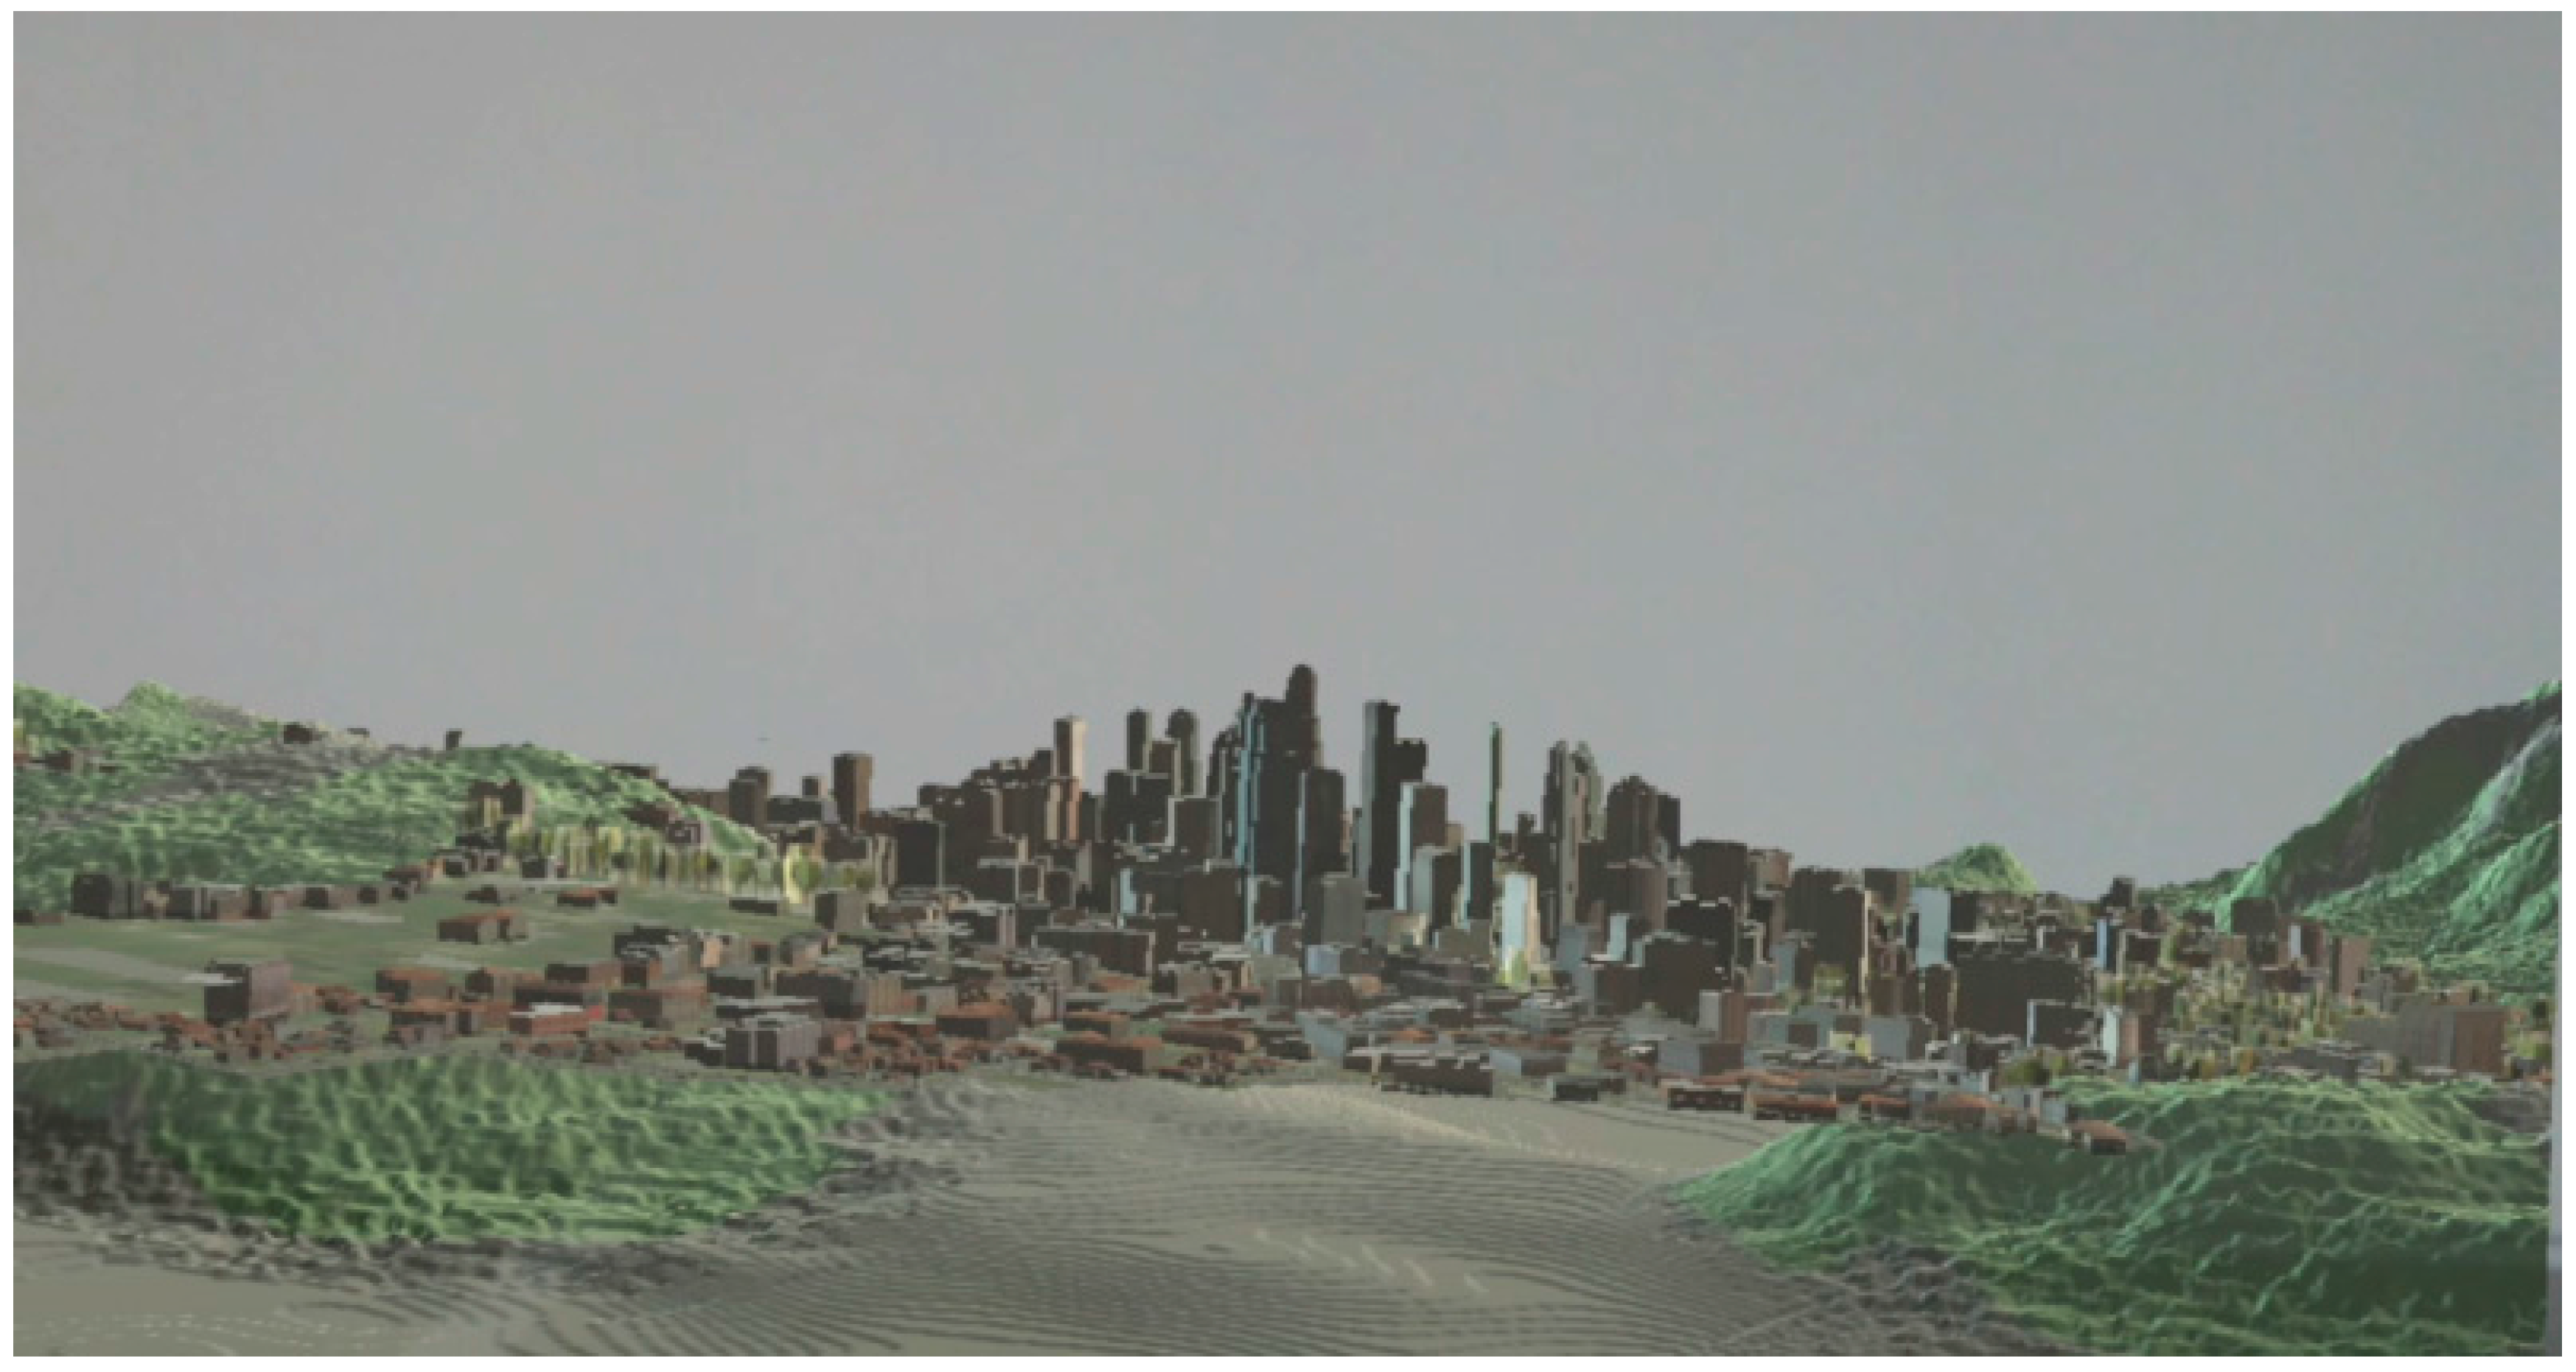
Based on the methods and the design of the experiment, the 3D digital city of Philadelphia is superimposed onto the physical world, and the combination of the two is realized. Figure 9 shows a schematic map of the introduction of digital city of Philadelphia onto the physical world. The white background is a physical wall, and the urban scene is a virtual Philadelphia 3D geographic scene. This is the integration result of the holographic digital city and the physical world. The Holo3DGIS used in this experiment has the following characteristics:
- In the Holo3DGIS application, geographic scenes and objects in the digital Philadelphia scene are created by the light and voice of the users’ peripheral world. Therefore, the digital Philadelphia scene is the part of the physical world and has the characteristics of a real-time virtual object.
- Interactive features: the digital city in the Holo3DGIS application can respond to the gaze, gestures and voice instructions of the GIS user. In addition to interacting with people, the digital city, as a part of the physical world, can interact with the surface of the physical world.
- Depth and perspective information: when the digital city in the Holo3DGIS application is placed in the physical world, it has a wealth of information and perspective; the distance and angle between users and digital city entities are measurable.
- Spatial persistence: the digital Philadelphia scene is inserted into the real world by an anchor in space; when a GIS user returns, the digital Philadelphia scene remains in its original position.
3.2.2. New Interactive Mode of the 3D GIS
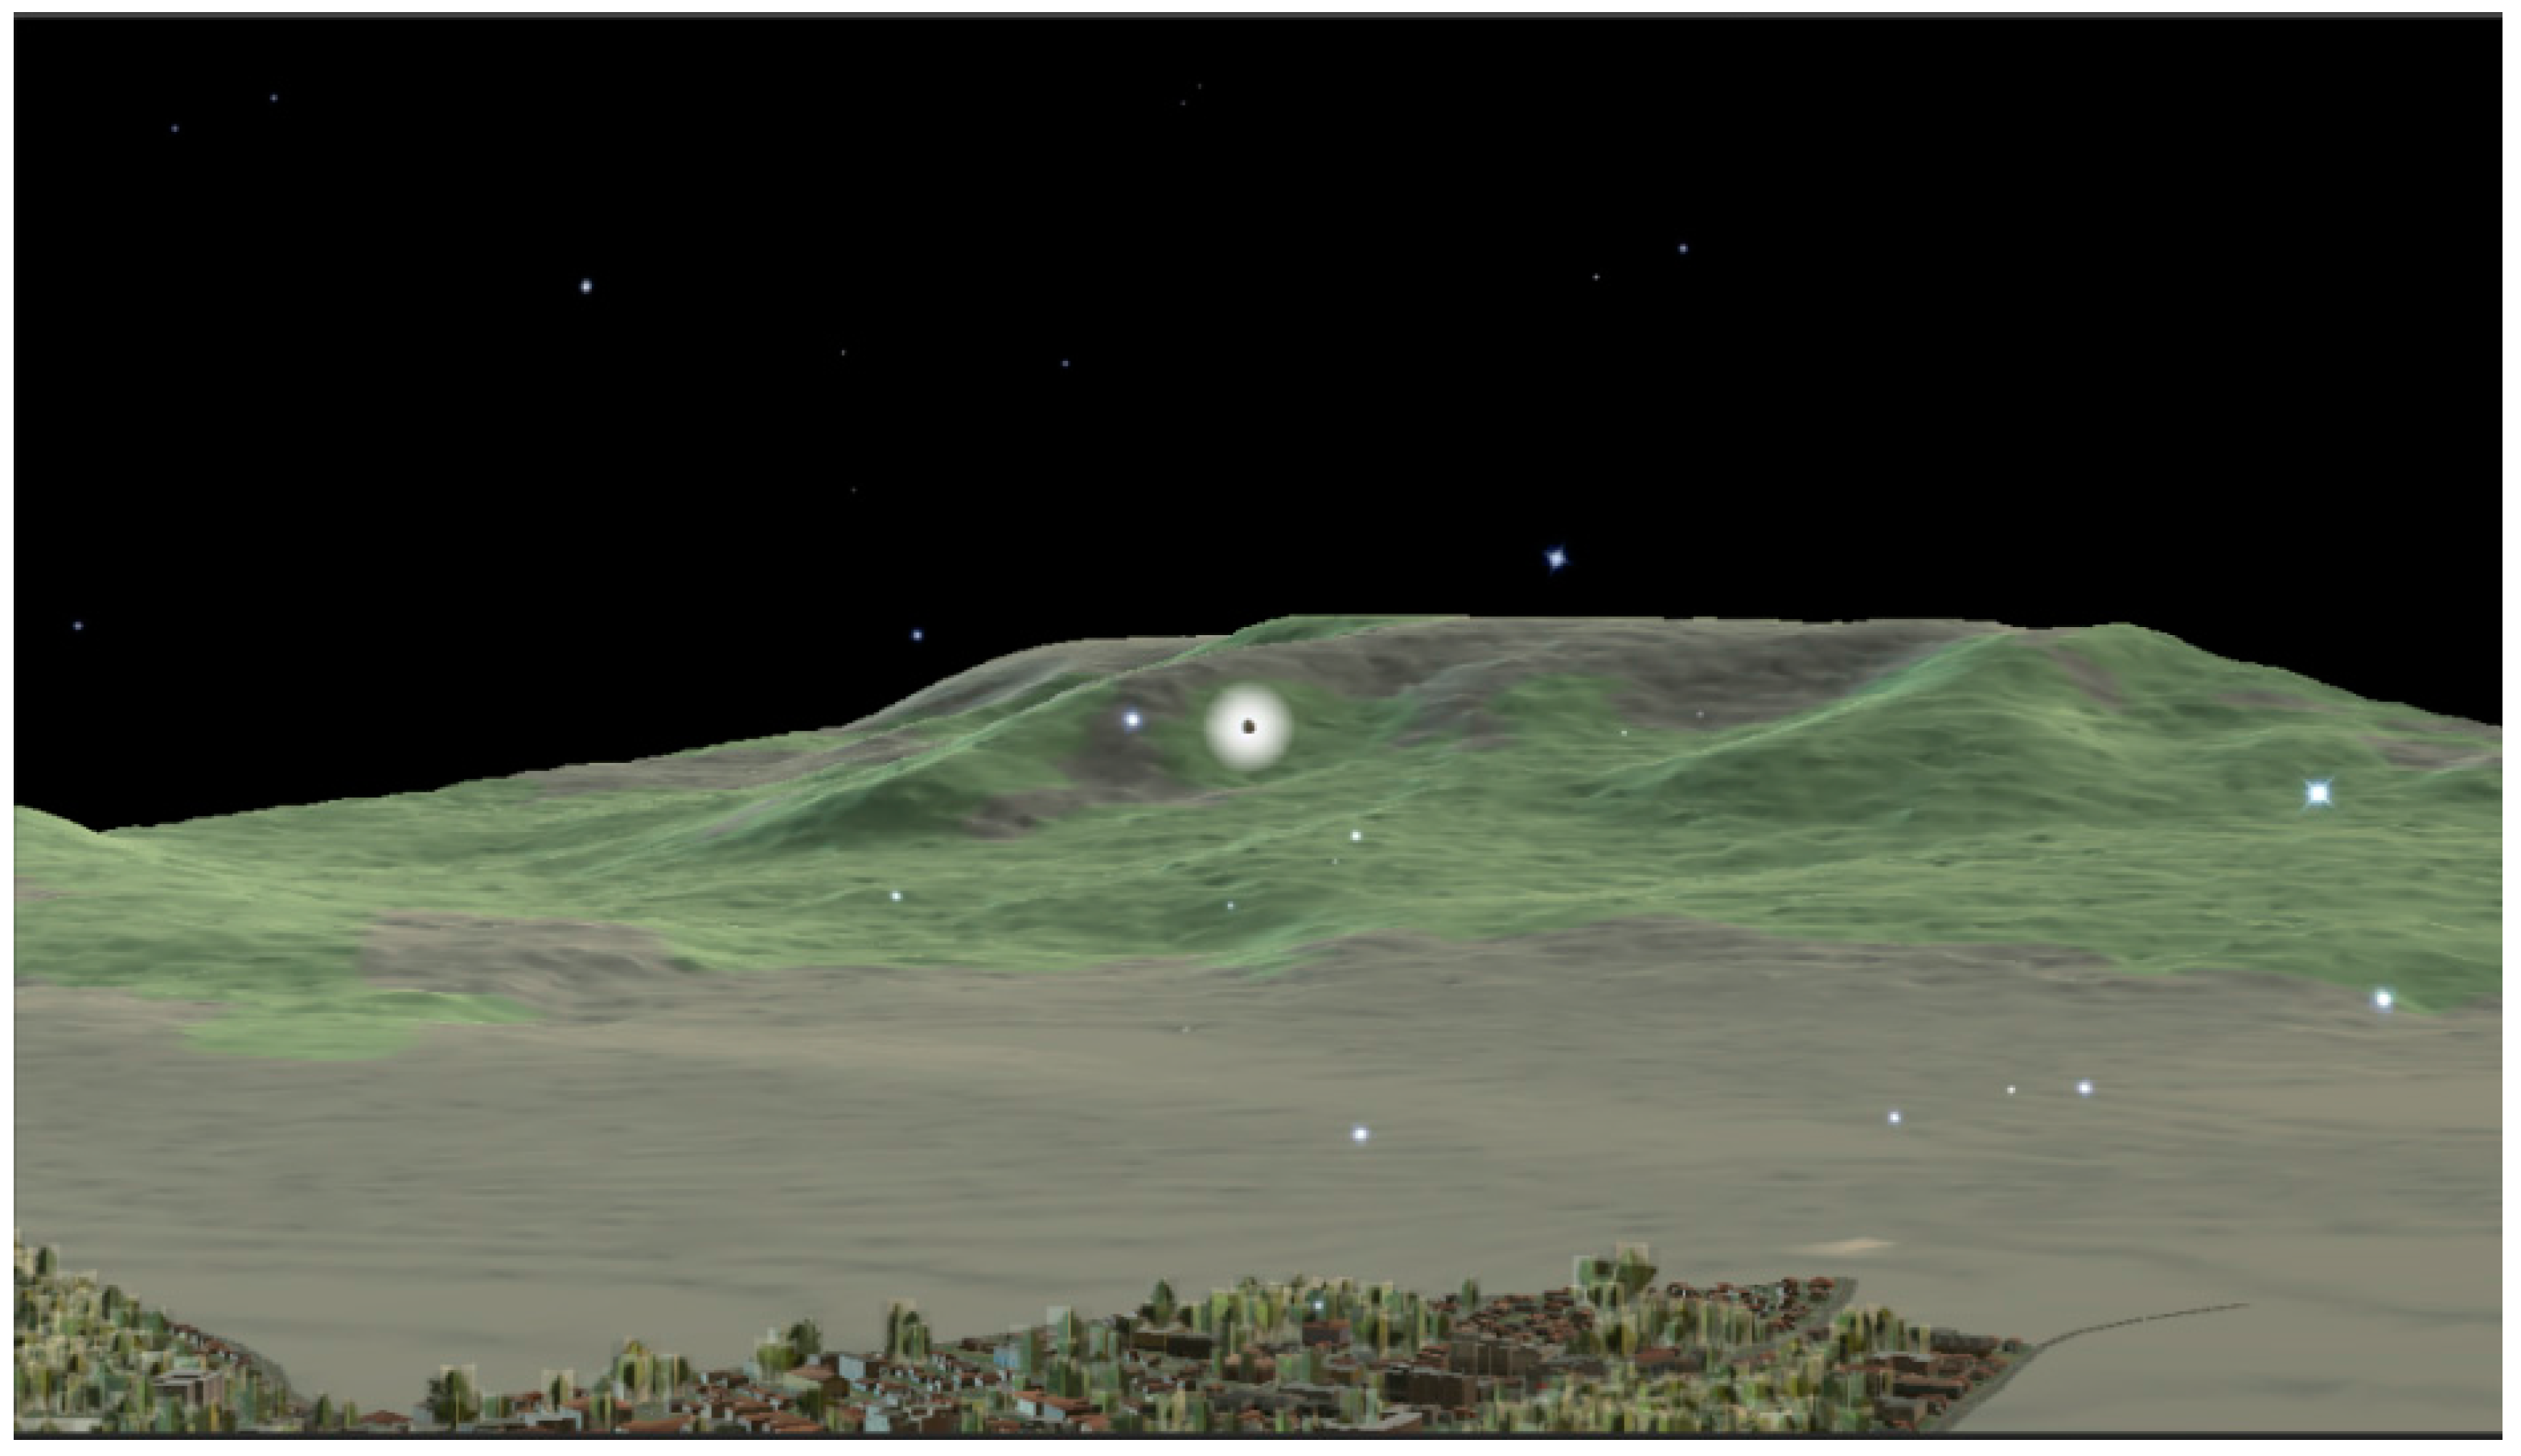
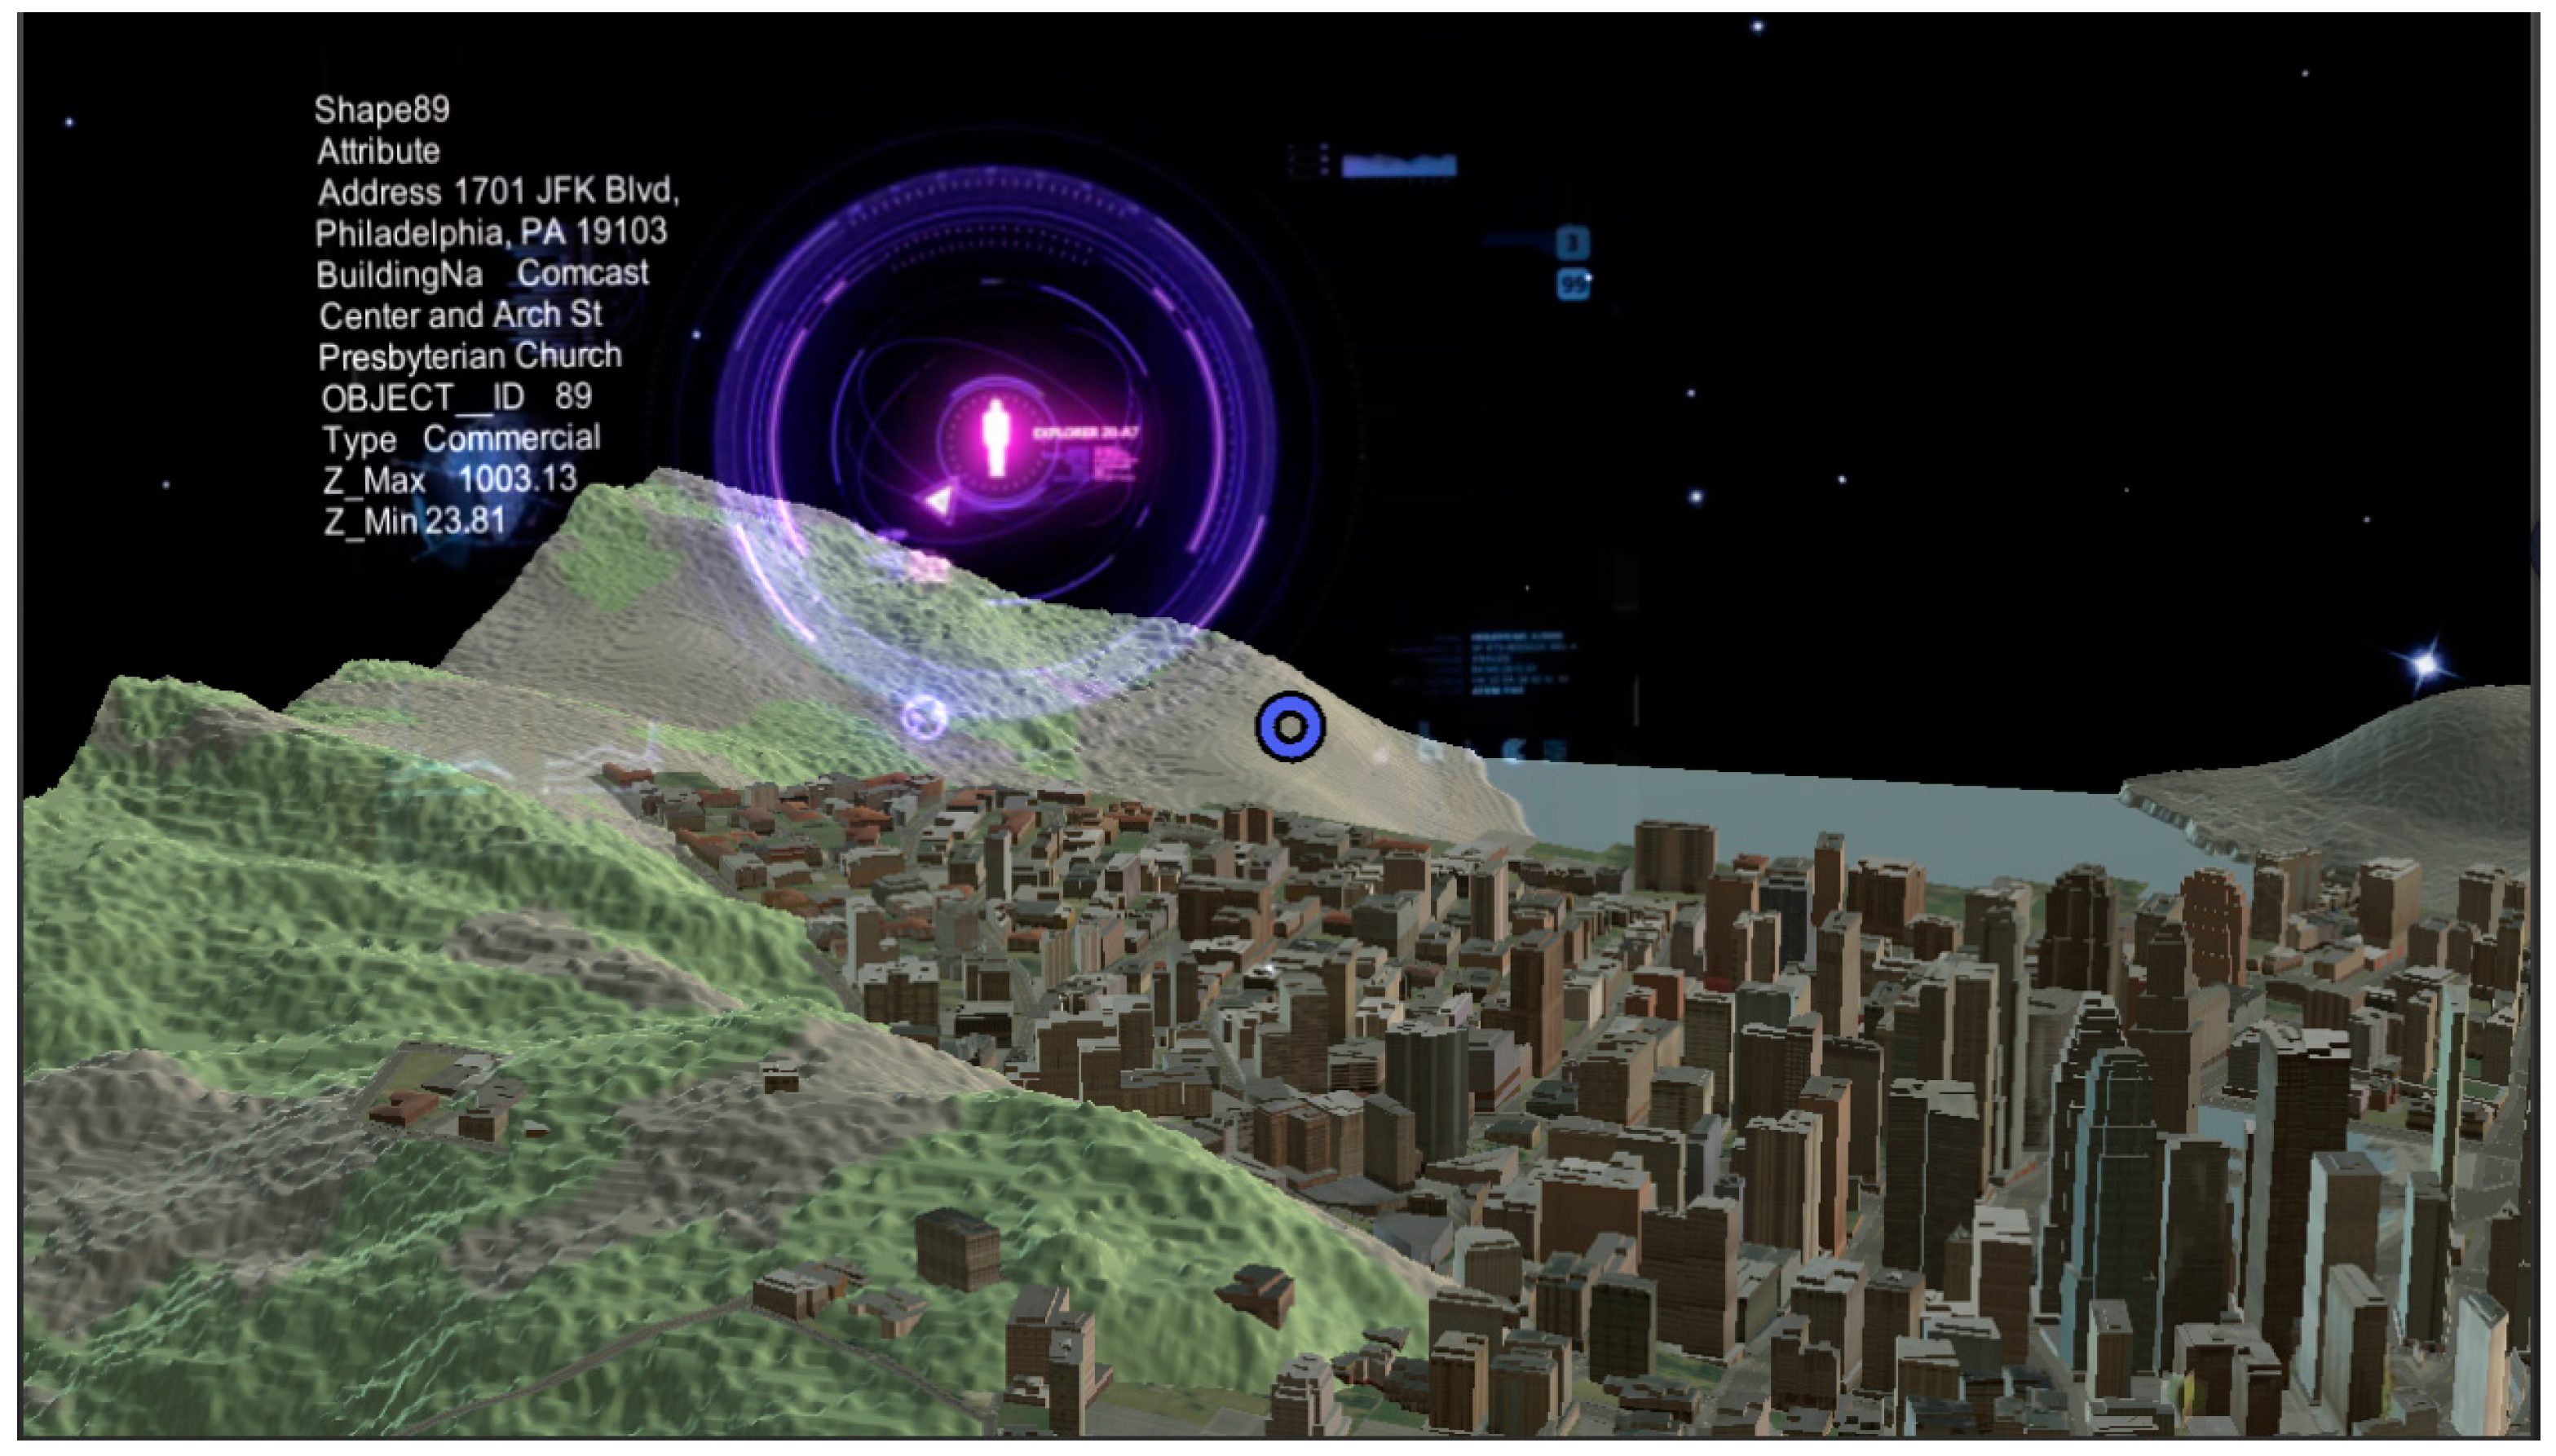
Traditional 3D GIS only provides a single way to interact, using the mouse and the keyboard, while Holo3DGIS provides several types of natural interaction, such as gaze, gesture, and voice, to achieve interaction between users and 3D geographic information. Out of the three interactions in Holo3DGIS, gaze is the first input and the primary form of targeting within the holographic geographic scene. Gaze reveals where the user is looking in the world and determines their intent [25]. Gesture and voice interactions are used to implement specific GIS operations. The principle of gaze design is the position and orientation of the user’s head, not their eyes, to determine their gaze vector. As the user looks around the room, the gaze vector intersects with the holographic 3D geographical scene, and the intersection point is where sight should be focused. To achieve gesture interactions, the hand needs to be tracked first to capture the gesture. The Holo3DGIS application only recognizes two gestures: “Put the index finger back to the face” and “Click (index finger points face down)”. The Holo3DGIS application automatically ignores all other gestures. The range of HoloLens gestures is only within the conical range ahead of the device, which is called a gesture frame. When the user’s hand moves away from the gesture box, there is a direction vector reminding the user to place the hand in the identifiable area. Figure 10 shows a schematic of the gaze interaction. The light ball locations are where the user’s line of sight is located in a geographical scene. These light balls are used to implement feedback to the user’s line of sight. Figure 11 shows a schematic of the gesture interaction. The schematic shows the properties and spatial information of the holographic object that are viewed by the gesture interaction. Gesture interactions, in addition to the query of geographic entities through air-tapping, also include “navigation gestures” to achieve the rotation of holographic geographic scenes, which allows users to browse the digital city of Philadelphia from different angles. In addition, using manipulation gestures, users can browse the city of Philadelphia from different scales, which allows the users to better understand the virtual geographic world. The voice design is similar to the gesture operation, but it only anticipates hand gestures. It is most convenient for users to operate three-dimensional geographic information with voice commands.
Holo3DGIS is similar to traditional 3D GIS interactions. Gaze is equivalent to the role of a mouse with a PC. Gesture and voice interactions are equivalent to the left key of the mouse. The difference between the two is mainly the level of experience and interaction; the former operates three-dimensional geographic information systems in a more natural way.
3.2.3. Performance Comparison
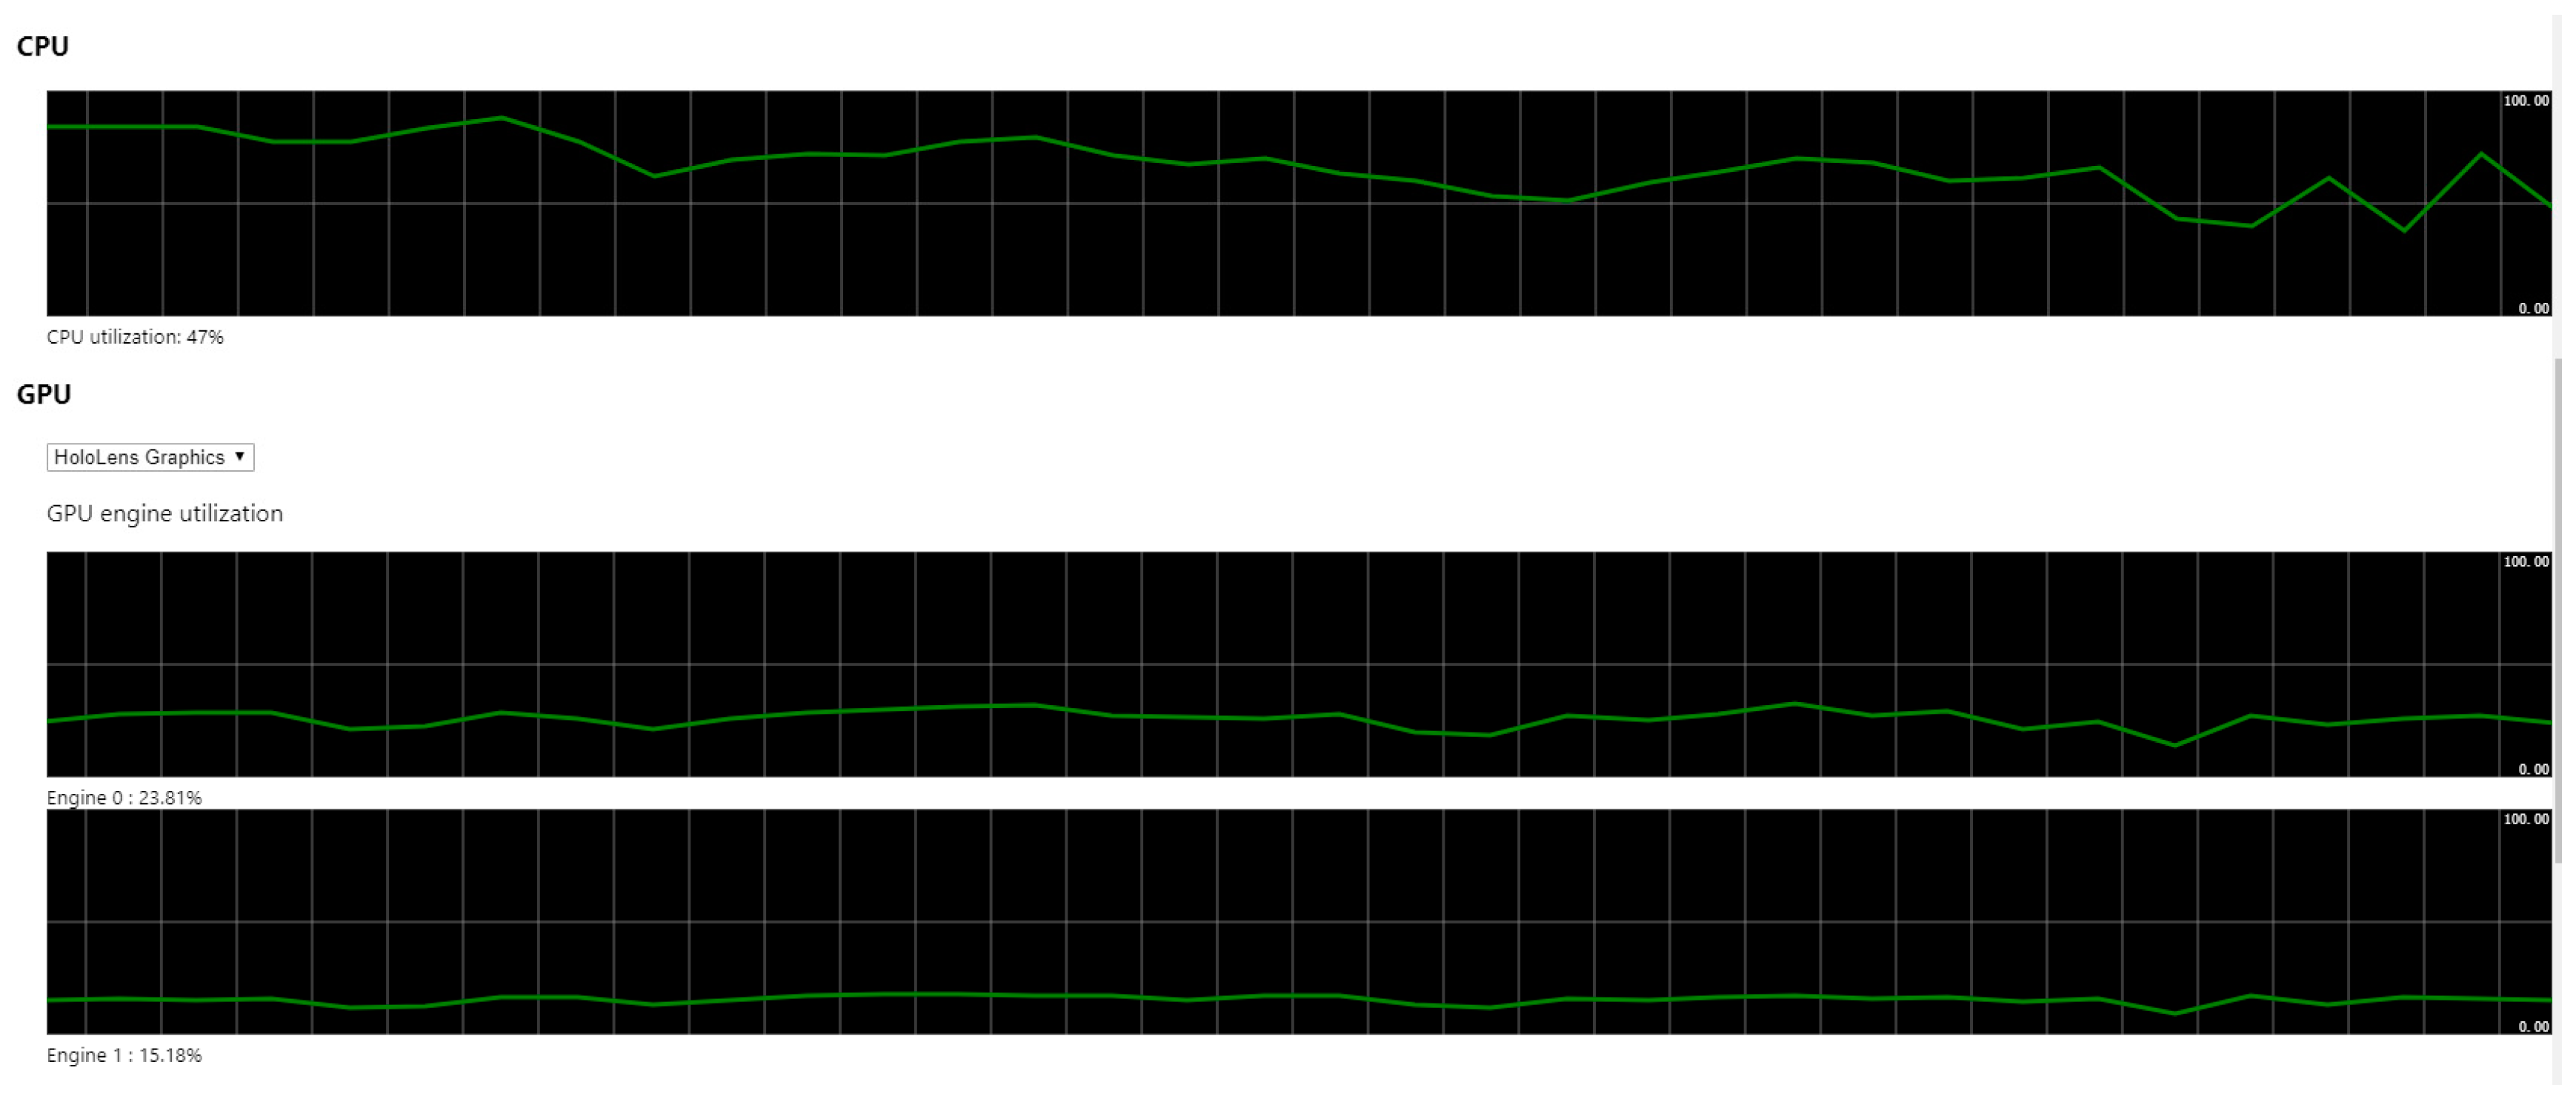
In this experiment, the same application is deployed by two deployment modes for a small scenario and a large scenario. The CPU and GPU data percentages corresponding to the two modes are obtained. The results show that the large scenario deployment mode can reduce the power consumption of the HoloLens. As shown in Figure 12 and Figure 13, a 576 MB Holo3DGIS application is deployed on the HoloLens and on PC computers; the rates of use for the HoloLens using CPU and GPU are compared. From the data in the figure, it can see that when the deployment of the Holo3DGIS application is transferred from the HoloLens to the computer, the utilization rate of the HoloLens CPU is reduced from 71% to 47%. The utilization rate of GPU Engine0 is reduced from 34.96% to 23.81%, and the utilization rate of GPU Engine1 increased from 0% to 15.18%. GPU Engine0 refers to the HoloLens GPU headset, GPU Engine1 refers to the computer GPU. Therefore, when the deployment of the holographic application was transferred from the HoloLens to the computer, the rate of use for the HoloLens CPU and GPU engines declined, while the rate of use for the computer GPU engine increased from 0% to 15.18%. From the above experiments, it can be seen that if the speed of the network and the performance of the computers meets the experimental requirements, the HoloLens can also be used as a rendering platform for geographic scene data.
3.2.4. Human Computer Interact Test
The human computer interact (HCI) test is aimed to report the users’ experience with the Holo3DGIS application. Through the HCI experiment, we test the availability of Holo3DGIS applications and improve its designs more humanized. The test contains the Microsoft HoloLens and the Holo3DGIS application deployed on the HoloLens. The process of HCI experiment includes three parts: the testers’ selection, design evaluation index system and questionnaire, and the test result report.
We invited 10 test subjects, who are professors in 3D GIS, PhDs in surveying and mapping or computer science, bachelor students in finance, leaders of surveying- and mapping-related companies, and Masters in GIS. The HCI experiment developed the first evaluation index system, which contained visual clarity, system efficiency, easy learning, interoperability, comfort, and flexibility, to record the user’s experience on Holo3DGIS application. The second evaluation index system is established after the first level index system. It is used as a questionnaire for testing users.
The test result shows that the users have positive subjective feelings on the human computer interaction interface of the Holo3DGIS application. Especially, users have a high evaluation of the visual impact and novelty of Holo3DGIS. In addition, users are also very satisfied with the Holo3DGIS interaction, and it brings a completely different form of interaction with the traditional 3D GIS. The main reason is as follows: Holo3DGIS overcomes the problem from the 2D perspective carriers and the interaction problem in 3D GIS, and it changes the traditional vision, body sense, and interaction modes, which enable GIS users to experience real 3D GIS. However, the HoloLens is a developer edition. We also have some problems in Holo3DGIS from the questionnaire survey. The problem is that user is not satisfied with the voice control and comfort in use. The problem of voice interaction is mainly related to the accuracy of the user’s pronunciation. Holo3DGIS will not recognize the voice if the user’s pronunciation is not correct. In addition, the Hololens weight can cause neck strain and nose discomfort after extended use. Additionally, the user may suffer from dizziness, because the user had difficulty adapting to the device at the beginning.
In sum, using MR as the carrier of 3D GIS is promising, and it overcomes the problem of perspective 2D carriers in 3D GIS. Additionally, Holo3DGIS applications can bring a perfect experience for the GIS user.
3.2.5. Limitations and Deficiencies
Although these methods can achieve 3D GIS integration with HoloLens, there are several problems:
- The Holo3DGIS application does not consider how to organize and schedule geographic scene data according to the display requirements. Therefore, using an MR device, such as the the HoloLens, to visualize 3D geospatial data may introduce a delay because geographic scenes exceed the computers rendering capabilities connected to the HoloLens. The result of this delay is that the user may suffer from nausea.
- Holo3DGIS applications can be developed based on the Unity3D engine, but the development mode will be limited to the Unity3D engine. To build individual development engines, The Holographic DirectX 11 application programming interface (API) is needed. DirectX 11 lacks a corresponding base library, and it requires designs from scratch; therefore, the difficulty coefficient of development is larger.
- MR devices, such as the HoloLens, have a very limited field of view (approximately 30° by 17.5°), which may narrow the user’s visual space. In addition, the user may suffer from fatigue because their eyes need to focus on the HoloLens plane within an inch of their eyes for quite some time. In addition, the HoloLens weight can cause neck strain after extended use. These three drawbacks may cause discomfort to the GIS user.
- Holo3DGIS applications are suitable for the first-person perspective, but they can also be used for third-person browsing. However, the latter is not as efficient as the former. The main reason is that the third-person perspective relies on the mixed reality capture system in the HoloLens device portal. The mixed reality capture system uses a 2-million-pixel red-green-blue (RGB) camera to capture the video stream; therefore, the effect is not satisfactory. All of the experimental screenshots in this article are obtained through a third-person mixed reality capture screen stream, which causes the result to be not as good as wearing the HoloLens holographic glasses directly. In addition, the screenshot of the spatial mapping captures both the real physical world and the holographic virtual image, while the gaze and gesture capture only the holographic virtual image. To improve the resolution of the screenshot, the pixels for the third-person perspective must be solved. Spectator view can be used to capture the mixed reality picture, and the resolution of the output picture can reach 1080p or even 4K. At the same time, relying on a single lens reflex (SLR) and other high-definition multimedia interface (HDMI) image recording equipment can provide a wider view. Currently, third person viewing screens used at HoloLens conferences are shown through spectator view. This is a method that requires two HoloLens devices, an HDMI-capable camcorder, and a high-performance computer for support.
4. Conclusions
This paper focuses on the integration of MR and 3D GIS. However, there are barriers and challenges when developing MR 3D environments for the visualization and inspection of 3D geospatial information. The main problem is the lack of commonly-shared data structures and interfaces between MR and 3D geospatial information. To address this problem and access 3D geospatial information content with MR, this paper proposes architecture and methods to use the Microsoft HoloLens with 3D geographic information. The proposed method for the development of holographic 3D GIS is based on three processes: generation of the 3D asset, development of the 3D GIS application, and compiler deployment of the 3D GIS application. This method presents a new approach for data visualization in 3D geographic information systems. Basic geographic data of Philadelphia was used to test the proposed methods and the Holo3DGIS. The experimental results showed that the Holo3DGIS can use the Microsoft HoloLens in 3D geographic information.
Advantages of the integration of MR and 3D GIS are as follows:
- The real world is a complex and imperfect three-dimensional map. The integration and interaction of virtual geographic information scenes and real-world data through mixed reality technology will greatly improve the GIS user’s application experience. It changes the traditional vision, body sense, and interaction mode.
- Holo3DGIS has perspective information and depth information, which enables GIS users to experience real 3D GIS.
- MR provides a set of new input and output interactions for the GIS; it outputs an interactive feedback loop between the real world, the virtual geographic world, and the user to enhance the sense of authenticity throughout the user’s experience. In addition, it provides a new research direction and means for 3D GIS data visualization.
- GIS provides functions for the collection, processing, storage, and spatial analysis of geographic data for a mixed reality. Moreover, GIS broadens the scope and application for mixed realities.
Further studies will focus on the following aspects:
- Commonly-shared data structures and interfaces between MR and GIS need to be established. Currently, GIS access to the MR platform requires the transformation of data format. On the one hand, this could increase the cost of MR development. On the other hand, the transformation of data formats could cause the data quality to become worse, which would diminish the user’s experience.
- By adding a geospatial analysis model service to the Holo3DGIS application, the dynamic display of changes in geographic processes in holographic mixed realities could be obtained.
- By adopting distributed computing technologies, holographic rendering calculations could be transferred from a single computer to multiple computers for parallel computing. Solving the lack of computing ability with a single computer could be accomplished with larger geographic scenes.
- By designing a service-oriented Holo3DGIS framework by publishing 3D geographic data into services and designing samples, accurate interfaces and contracts for communication can be obtained. MR could gain access to virtual geographic scene services in a standard manner. The virtual geographic scene service could be used by other MR users in the network. MR geographic resources could be accessed on demand.
Acknowledgments
This work was supported by grants from the National Key R and D Program of China (no. 2017YFC0803700), the National Nature Science Foundation of China (NSFC) Program (no. 41771422), the Nature Science Foundation of Hubei Province (no. 2017CFB616), the innovative group program of Hubei Province (no. 2016CFA003), and the fundamental research funds for the central universities (No. 2042017kf0211).
Author Contributions
Xingxing Wu and Wei Wang conceived of the idea of the paper. Xingxing Wu, Zeqiang Chen, and Guanchen Chen analyzed the data and performed the experiments. Xingxing Wu and Zeqiang Chen wrote the paper.
Conflicts of Interest
The authors declare no conflict of interest.
References
- Macatulad, E.G.; Blanco, A.C. 3DGIS-Based Multi-Agent Geosimulation and Visualization of Building Evacuation Using GAMA Platform. ISPRS Int. Arch. Photogramm. Remote Sens. Spat. Inf. Sci. 2014, XL-2, 87–91. [Google Scholar] [CrossRef]
- Verbree, E.; Maren, G.V.; Germs, R.; Jansen, F.; Kraak, M.J. Interaction in virtual world views-linking 3D GIS with VR. Int. J. Geogr. Inf. Syst. 1999, 13, 385–396. [Google Scholar] [CrossRef]
- Germs, R.; Maren, G.V.; Verbree, E.; Jansen, F.W. A multi-view VR interface for 3D GIS. Comput. Graph. 1999, 23, 497–506. [Google Scholar] [CrossRef]
- Rebelo, F.; Noriega, P.; Duarte, E.; Soares, M. Using virtual reality to assess user experience. Hum. Factors 2012, 54, 964–982. [Google Scholar] [CrossRef] [PubMed]
- Frank, L.A. Using the computer-driven VR environment to promote experiences of natural world immersion. In Proceedings of the SPIE Engineering Reality of Virtual Reality, Burlingame, CA, USA, 4–5 February 2013; Volume 8649, pp. 185–225. [Google Scholar] [CrossRef]
- Tingoy, O.; Gulluoglu, S.; Yengin, D. The use of virtual reality as an educational tool. In Proceedings of the 3rd International Technology, Education and Development Conference, Valencia, Spain, 9–11 March 2009. [Google Scholar]
- Sabir, M.; Prakash, J. Virtual Reality: A Review. In Proceedings of the 2nd International Conference on Advance Trends in Engineering and Technology, Jaipur, India, 17–19 April 2014. [Google Scholar]
- Berryman, D.R. Augmented reality: A review. Med. Ref. Serv. Q. 2012, 31, 212–218. [Google Scholar] [CrossRef] [PubMed]
- Uchiyama, H.; Saito, H.; Servières, M.; Moreau, G. AR City Representation System Based on Map Recognition Using Topological Information. Lect. Notes Comput. Sci. 2009, 5622, 128–135. [Google Scholar] [CrossRef]
- Sielhorst, T.; Feuerstein, M.; Navab, N. Advanced Medical Displays: A Literature Review of Augmented Reality. J. Disp. Technol. 2008, 4, 451–467. [Google Scholar] [CrossRef]
- Mackay, W.; Wellner, P. Computer augmented environments: Back to the real world. Haematologica 1993, 94, 170–172. [Google Scholar]
- Insley, S. Augmented Reality: Merging the Virtual and the Real. Eng. Technol. 2003, 8, 1–8. [Google Scholar]
- Wang, X.; Dunston, P.S. User perspectives on mixed reality tabletop visualization for face-to-face collaborative design review. Autom. Constr. 2008, 17, 399–412. [Google Scholar] [CrossRef]
- Brigham, T.J. Reality Check: Basics of Augmented, Virtual, and Mixed Reality. Med. Ref. Serv. Q. 2017, 36, 171–178. [Google Scholar] [CrossRef] [PubMed]
- HoloLens Hardware Details. Available online: https://developer.microsoft.com/en-us/windows/mixed-reality/hololens_hardware_details (accessed on 12 November 2017).
- Furlan, R. The future of augmented reality: Hololens-Microsoft’s AR headset shines despite rough edges [Resources_Tools and Toys]. IEEE Spectr. 2016, 53, 21. [Google Scholar] [CrossRef]
- Holodisaster: Leveraging Microsoft HoloLens in Disaster and Emergency Management. Available online: https://www.researchgate.net/publication/312320915_Holodisaster_Leveraging_Microsoft_HoloLens_in_Disaster_and_Emergency_Management (accessed on 18 December 2017).
- Stark, E.; Bisták, P.; Kučera, E.; Haffner, O.; Kozák, Š. Virtual Laboratory Based on Node.js Technology and Visualized in Mixed Reality Using Microsoft HoloLens. Fed. Conf. Comput. Sci. Inf. Syst. 2017, 13, 315–322. [Google Scholar] [CrossRef]
- NASA, Microsoft Collaboration will Allow Scientists to ‘Work on Mars’. Available online: https://www.jpl.nasa.gov/news/news.php?feature=4451 (accessed on 18 December 2017).
- Roth, D.; Yang, M.; Ahuja, N. Learning to recognize three-dimensional objects. Neural Comput. 2002, 14, 1071–1103. [Google Scholar] [CrossRef] [PubMed]
- Müller, P.; Wonka, P.; Haegler, S.; Ulmer, A.; Van Gool, L. Procedural modeling of buildings. ACM Trans. Graph. 2006, 25, 614–623. [Google Scholar] [CrossRef]
- Performance Recommendations for HoloLens Apps. Available online: https://developer.microsoft.com/en-us/windows/mixed-reality/performance_recommendations_for_hololens_apps (accessed on 20 December 2017).
- Geographic Information Data of Philadelphia. Rar. Available online: https://pan.baidu.com/s/1eSuAOCi (accessed on 20 December 2017).
- The Commercial Suite and the Development Edition are Fully Equipped for All HoloLens Developers, Whether You’re Working as an Individual or a Team. Available online: https://www.microsoft.com/en-us/hololens/buy#buyenterprisefeatures (accessed on 20 December 2017).
- Gaze. Available online: https://developer.microsoft.com/en-us/windows/mixed-reality/gaze (accessed on 20 December 2017).
Figure 1.
System architecture diagram.

Figure 2.
3D asset creation method flowchart in the Holo3DGIS application.
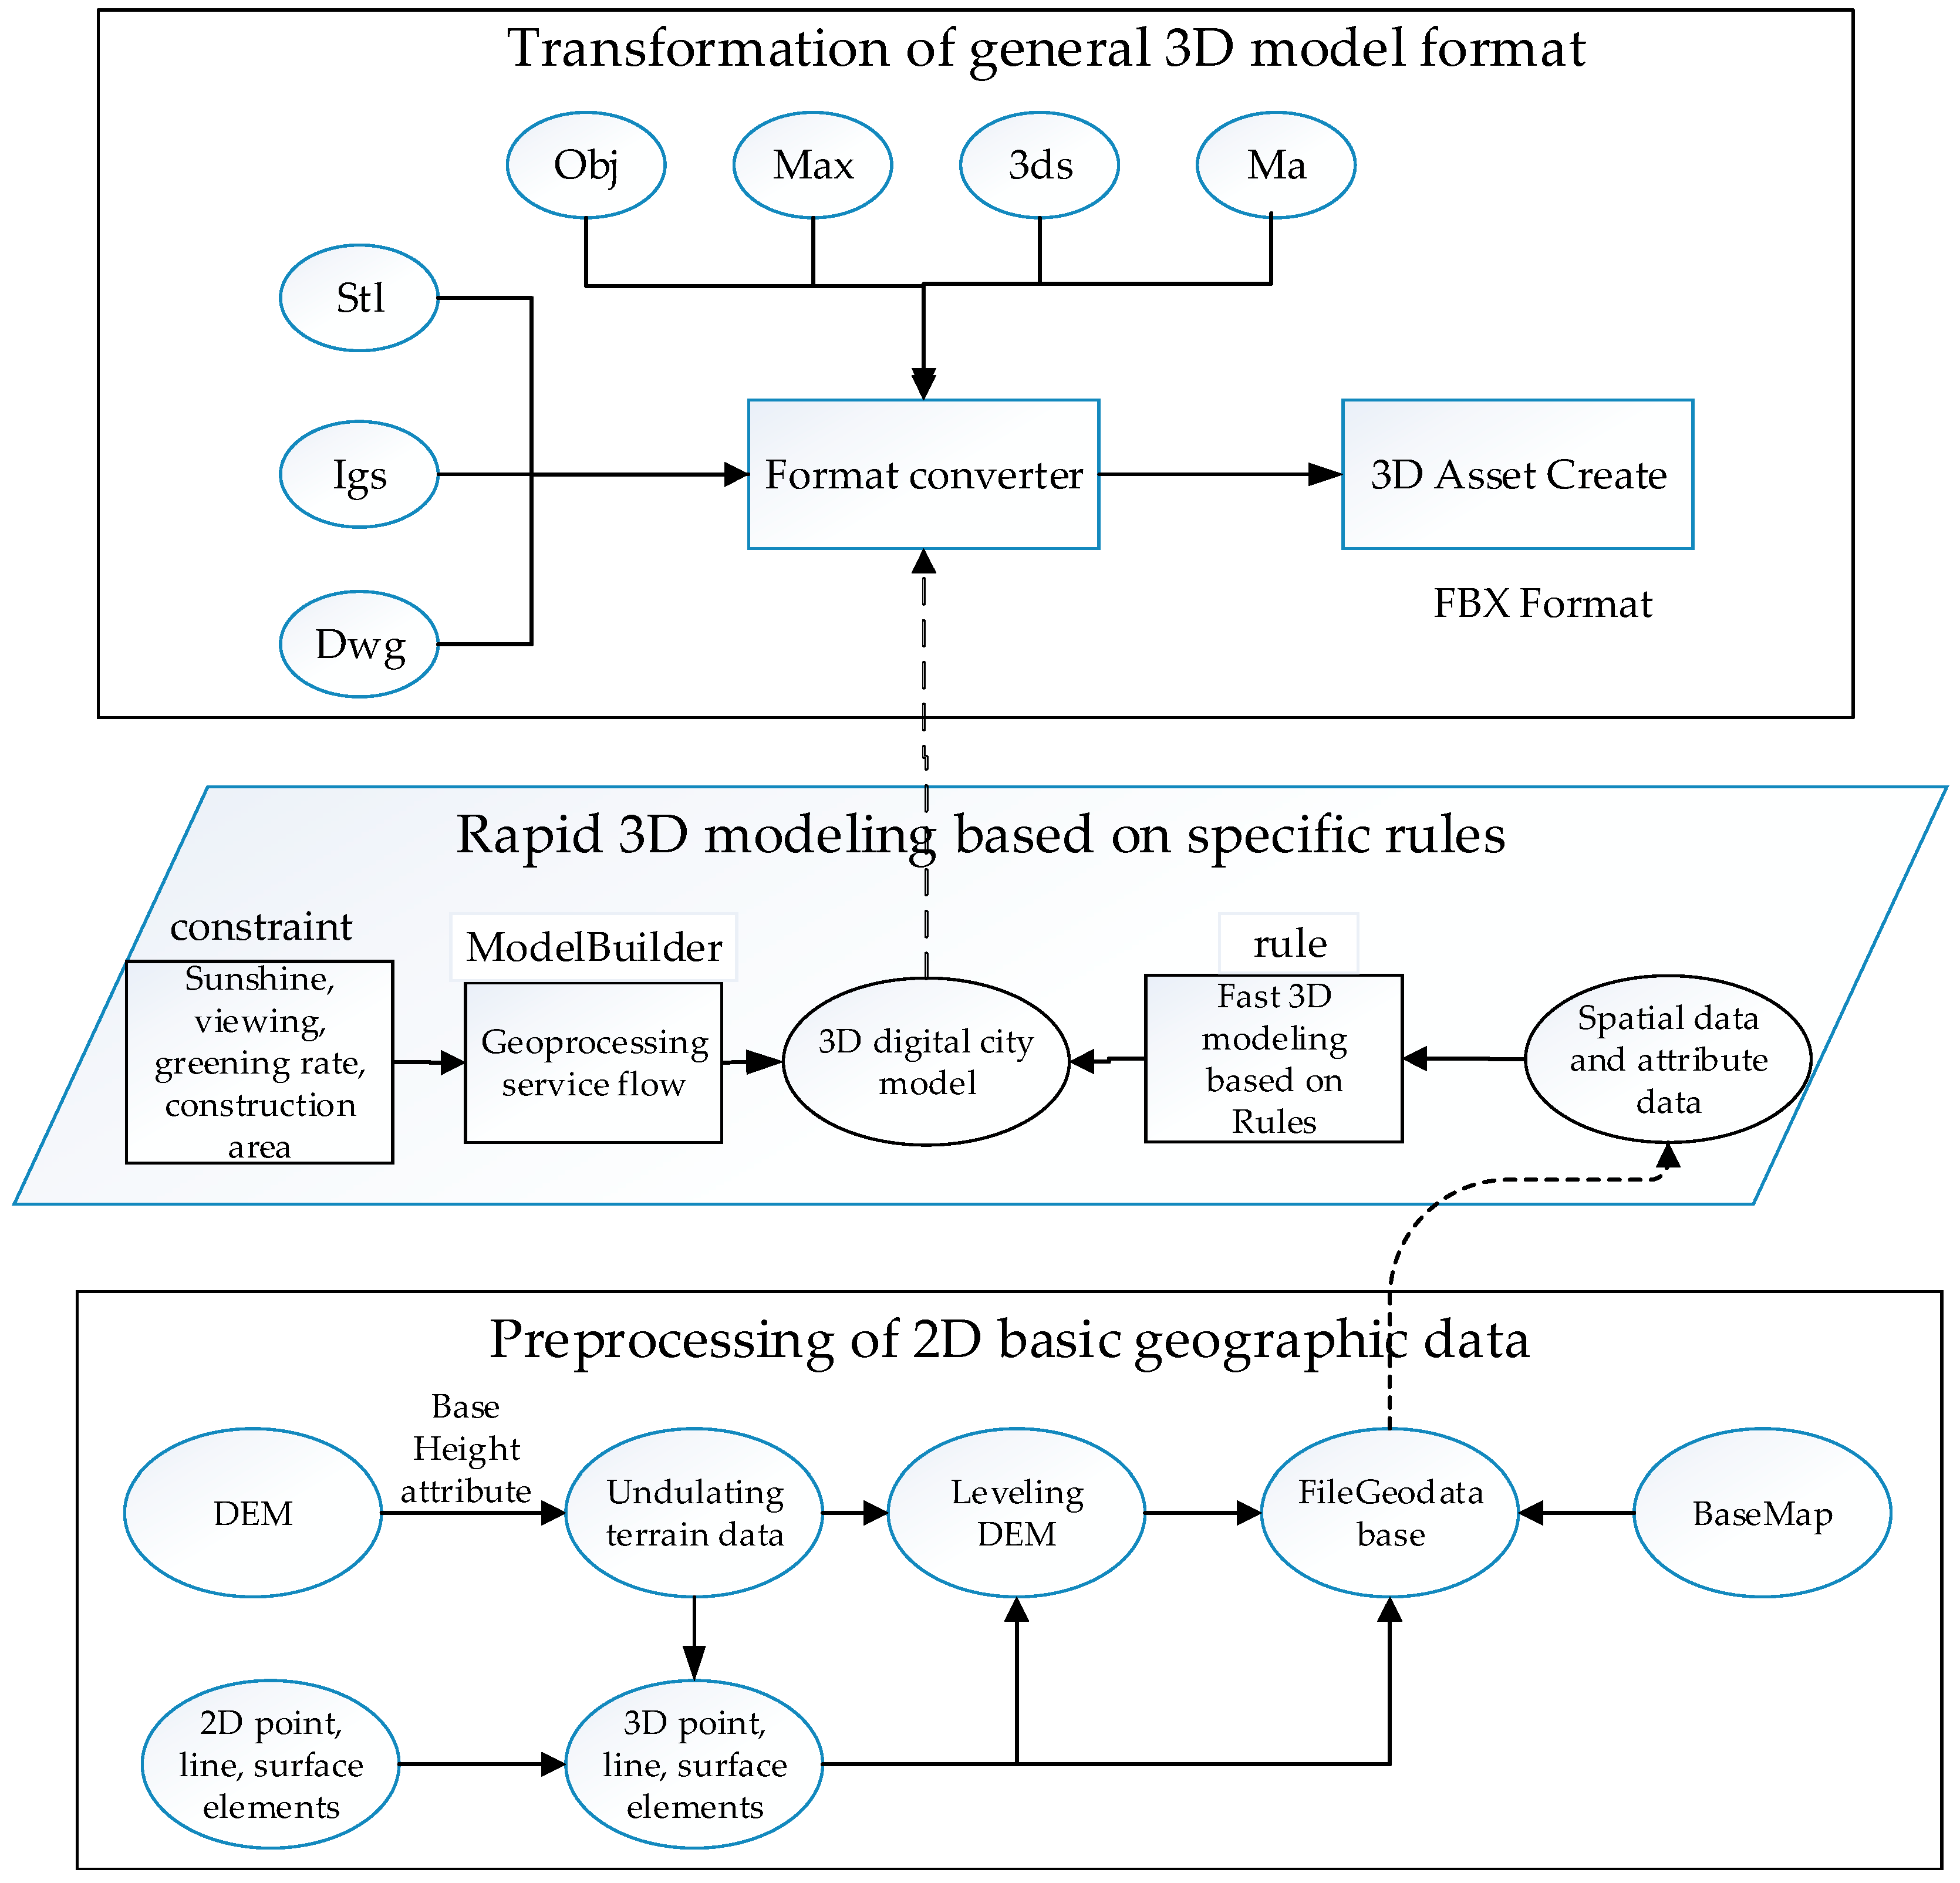
Figure 3.
The algorithm flowchart of 2D features transformed into 3D features.
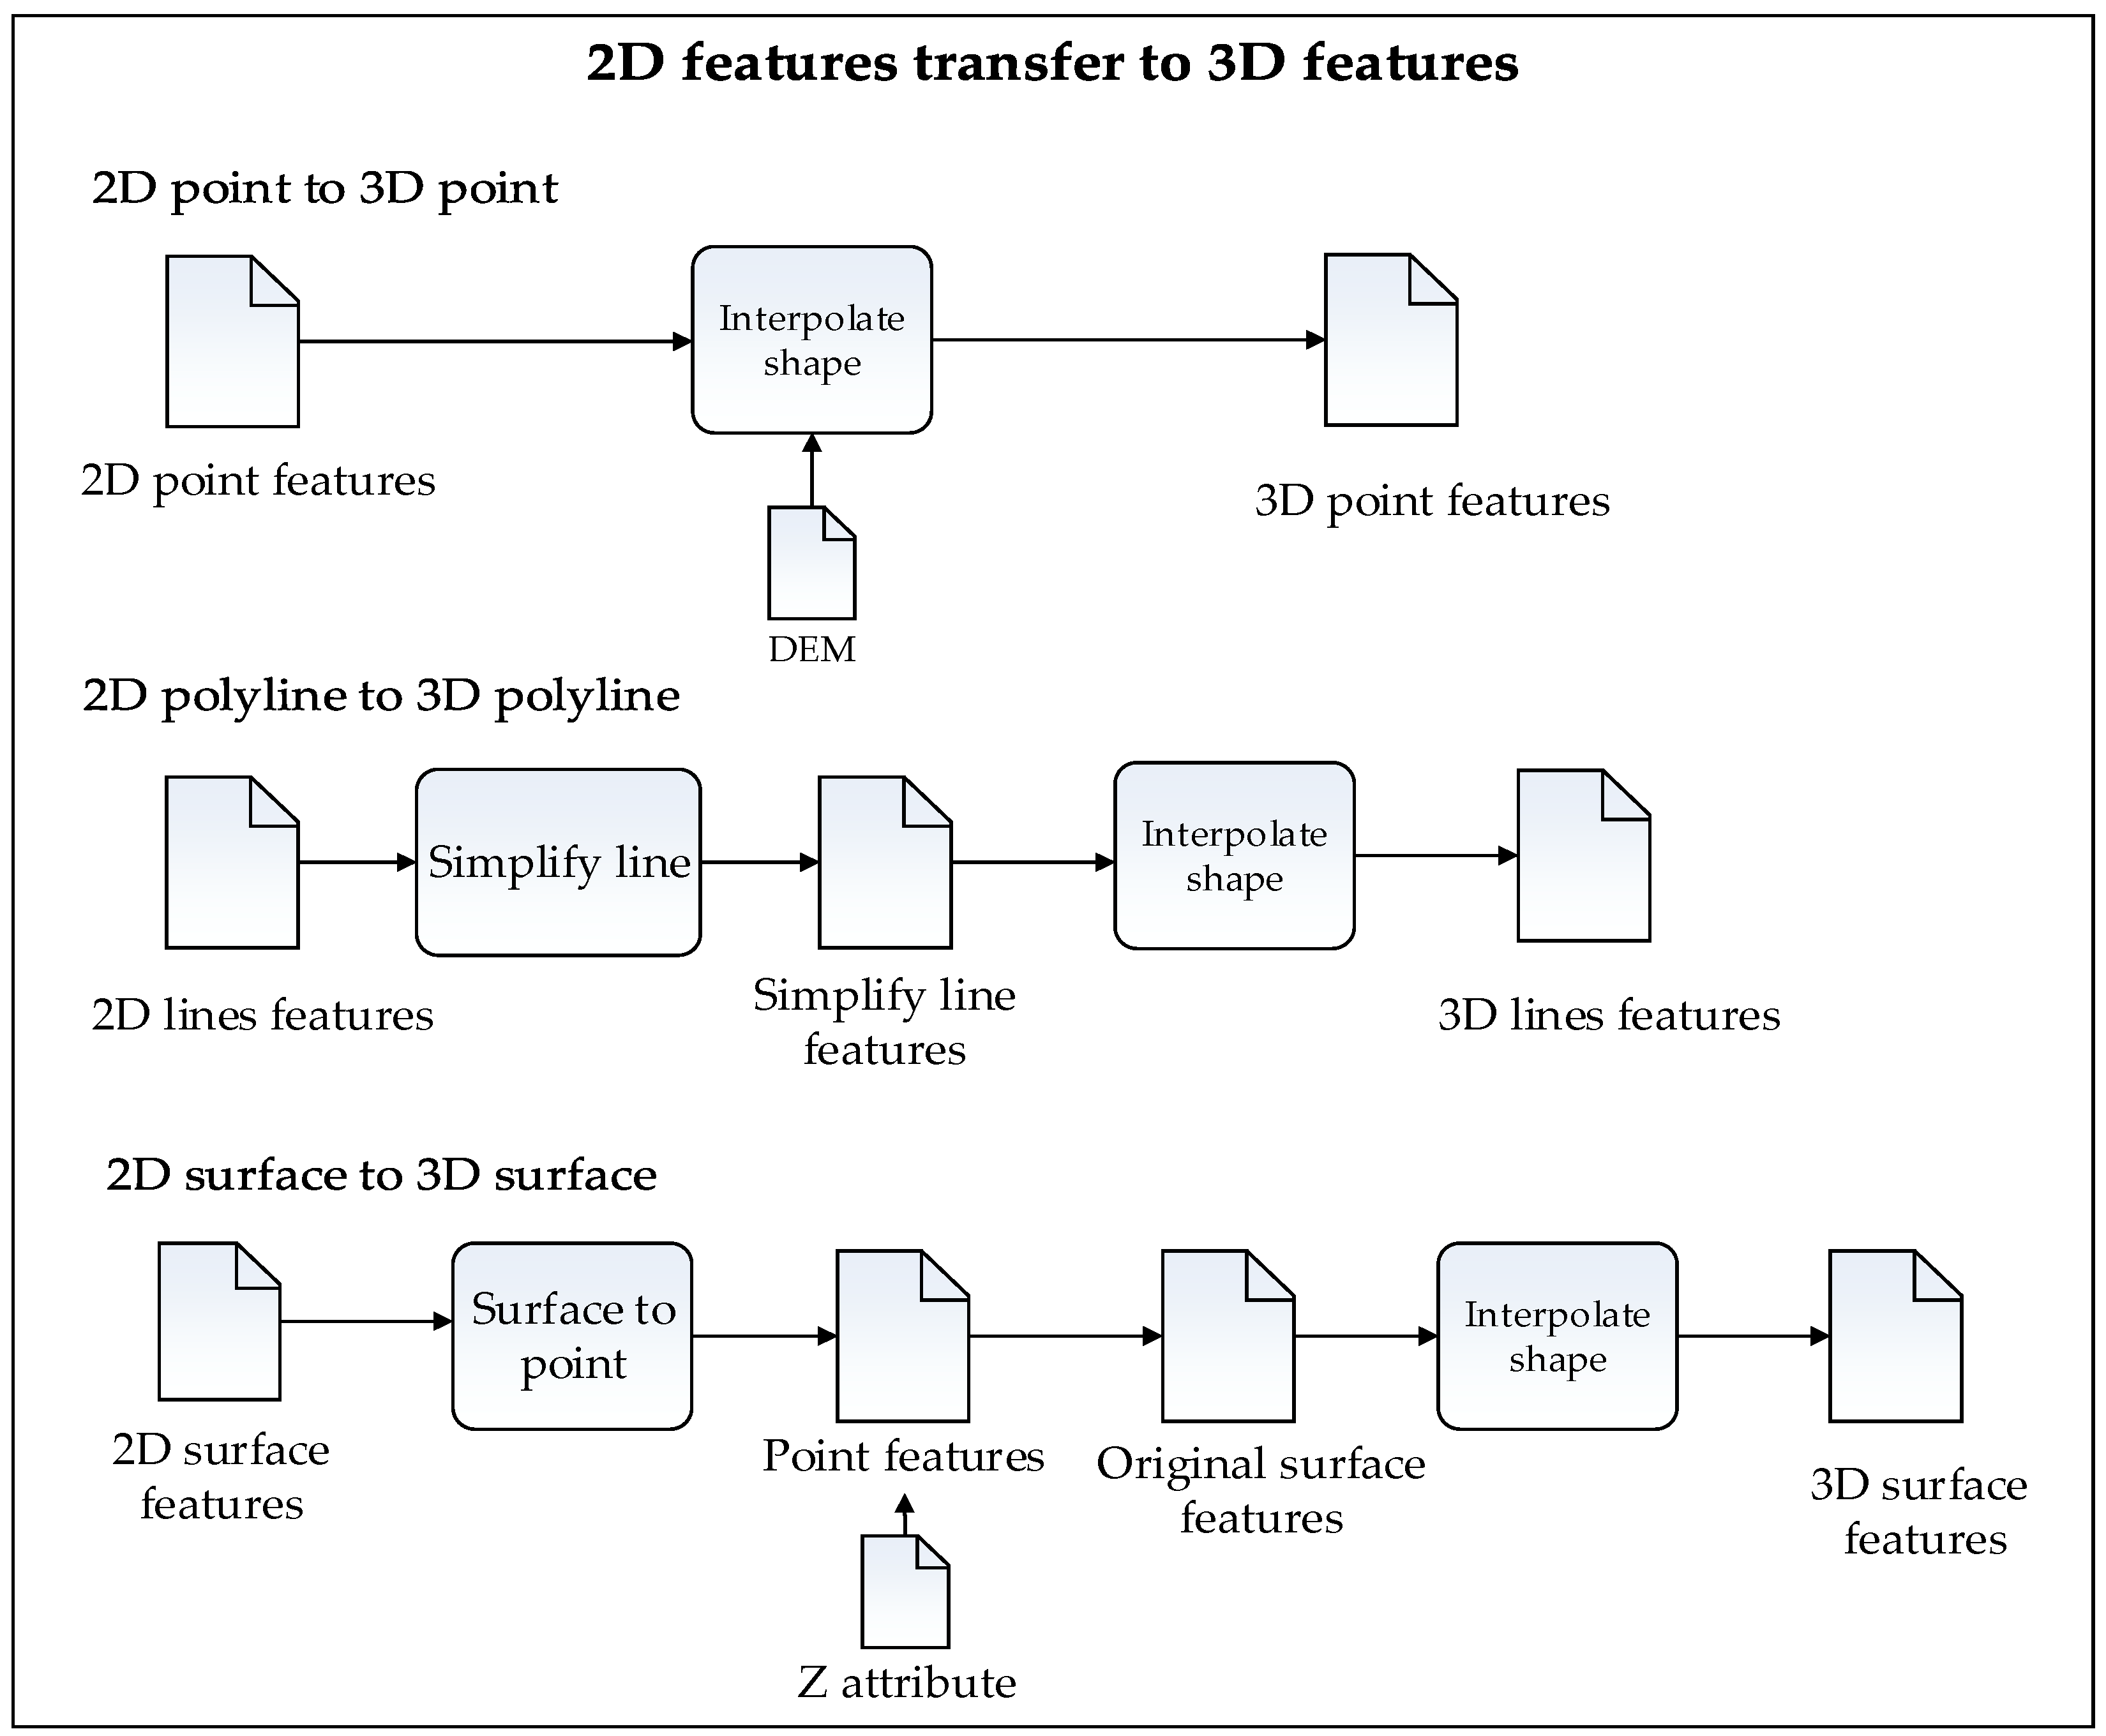
Figure 4.
Algorithm flow chart for burning 3D polygons into DEMs.
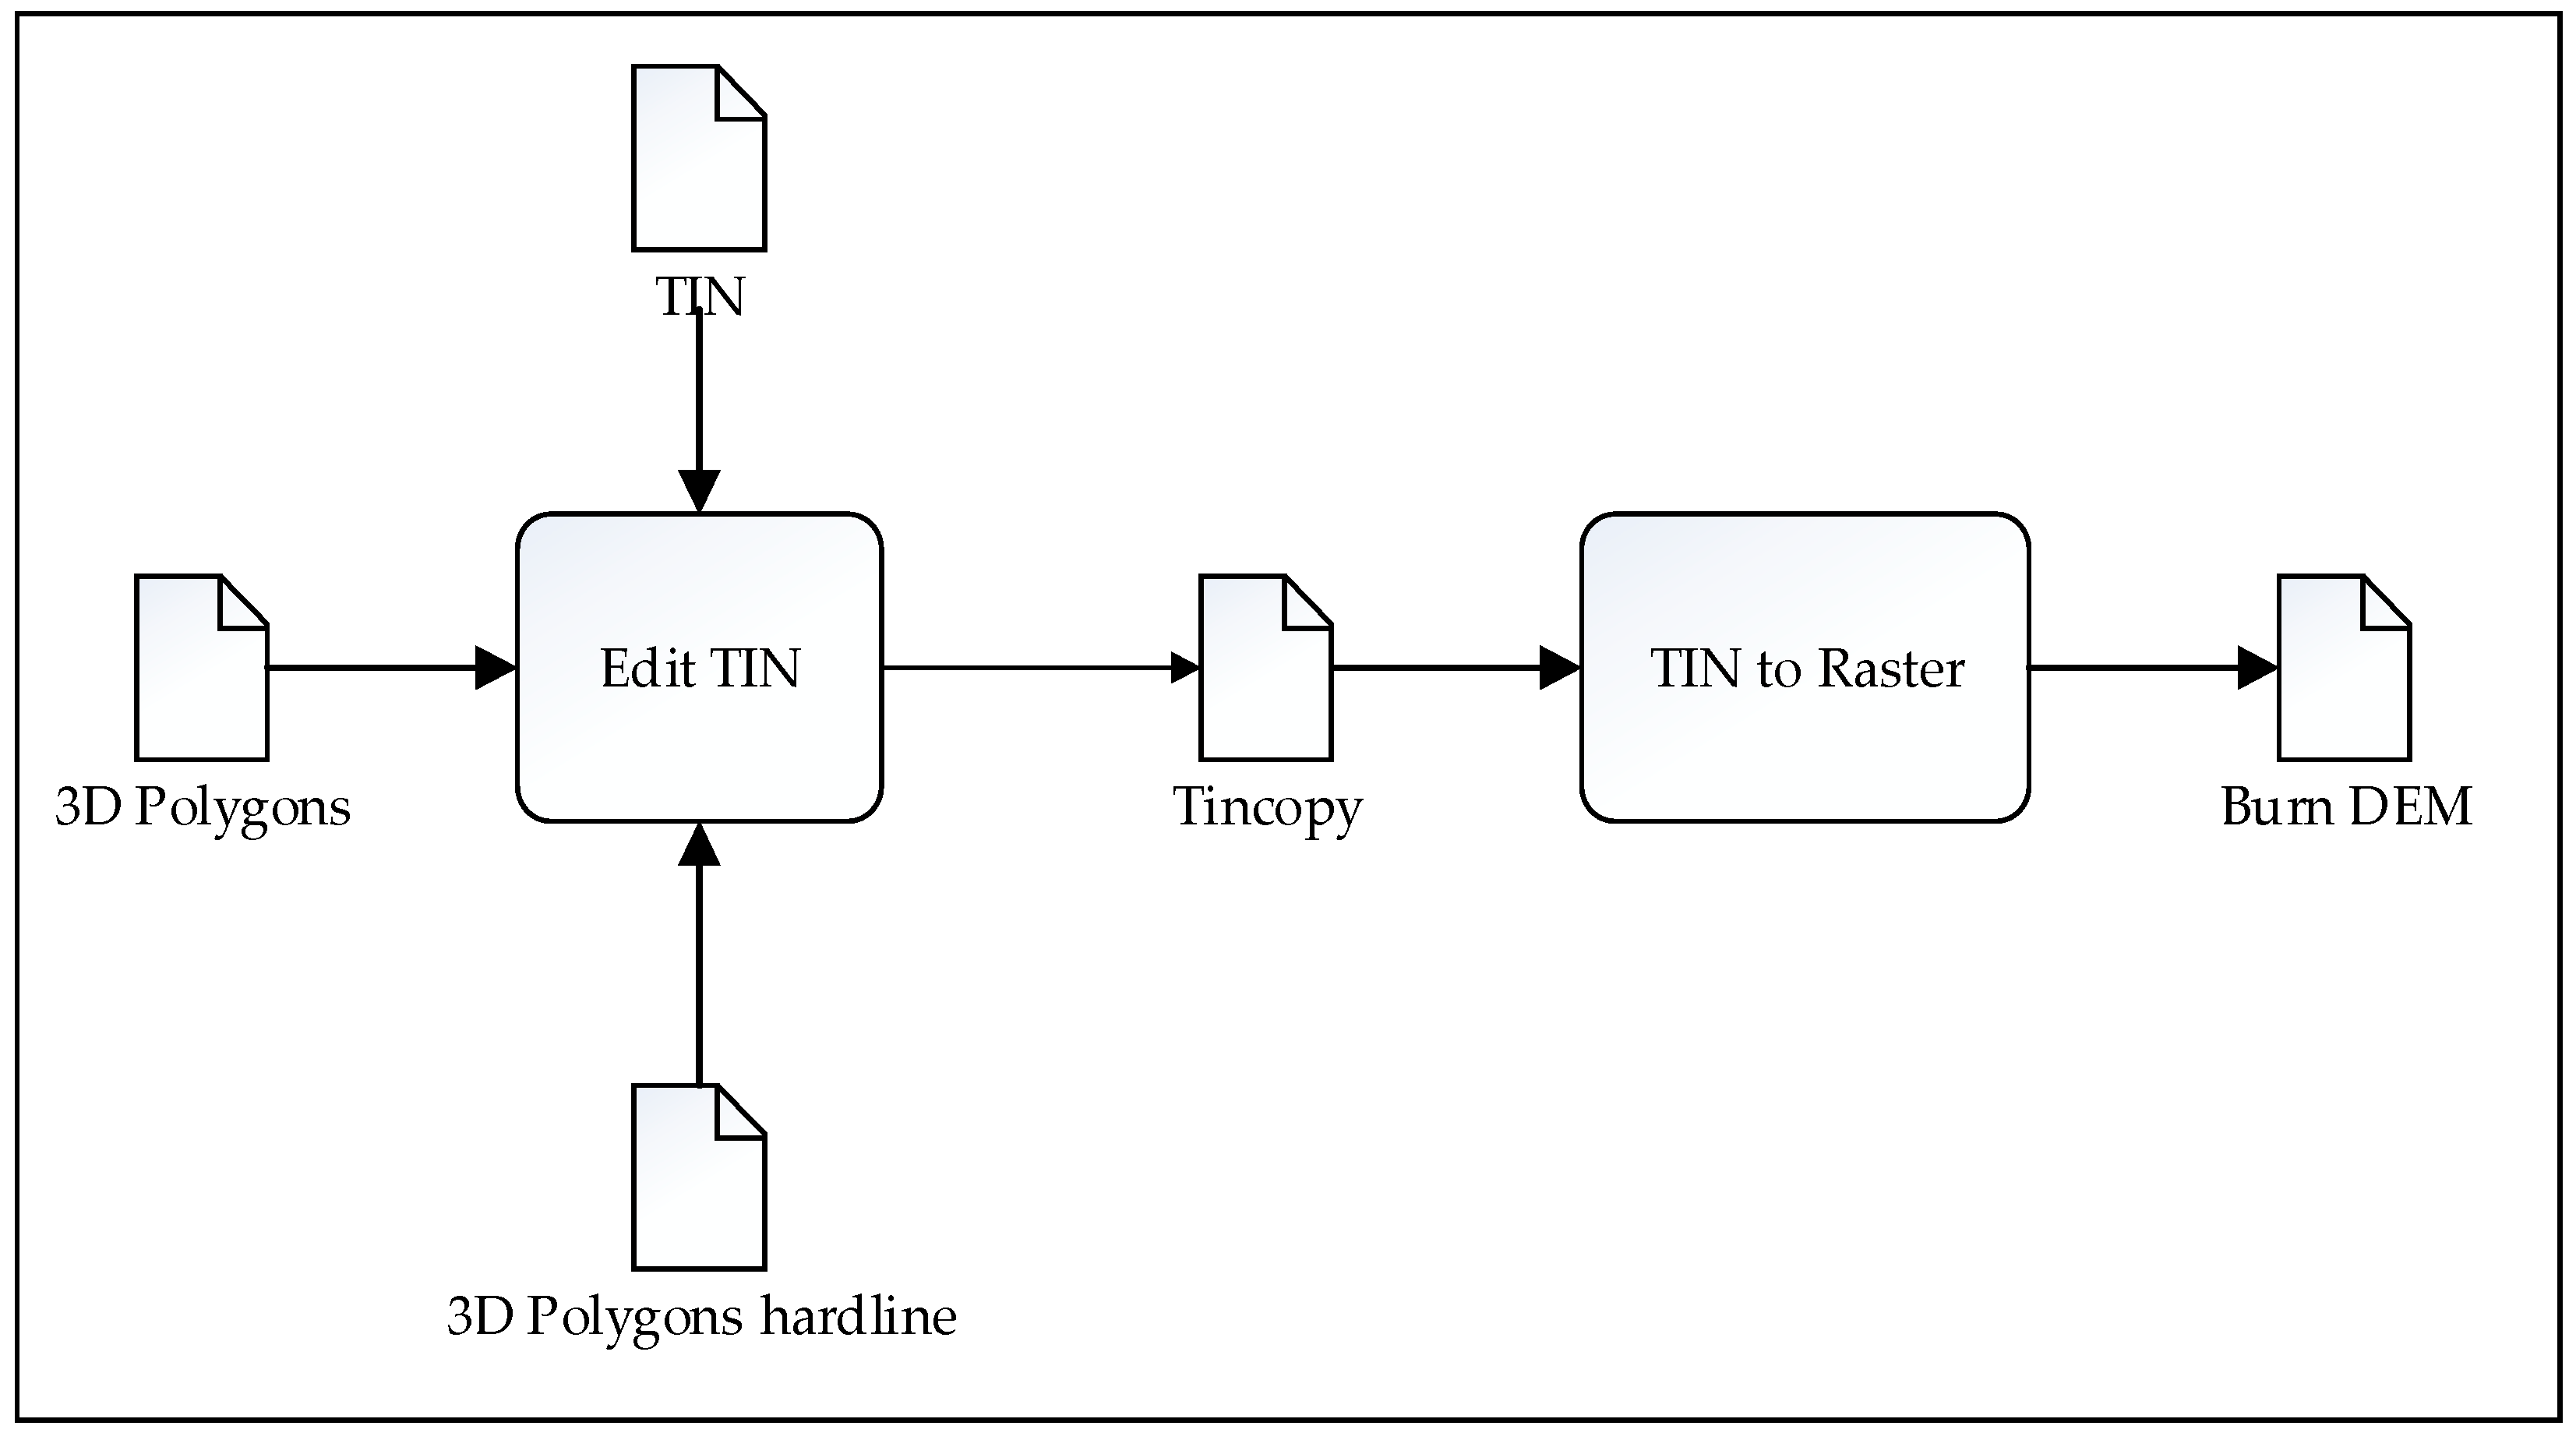
Figure 5.
Flowchart of the model format conversion.

Figure 6.
Logic diagram of the interactive design.
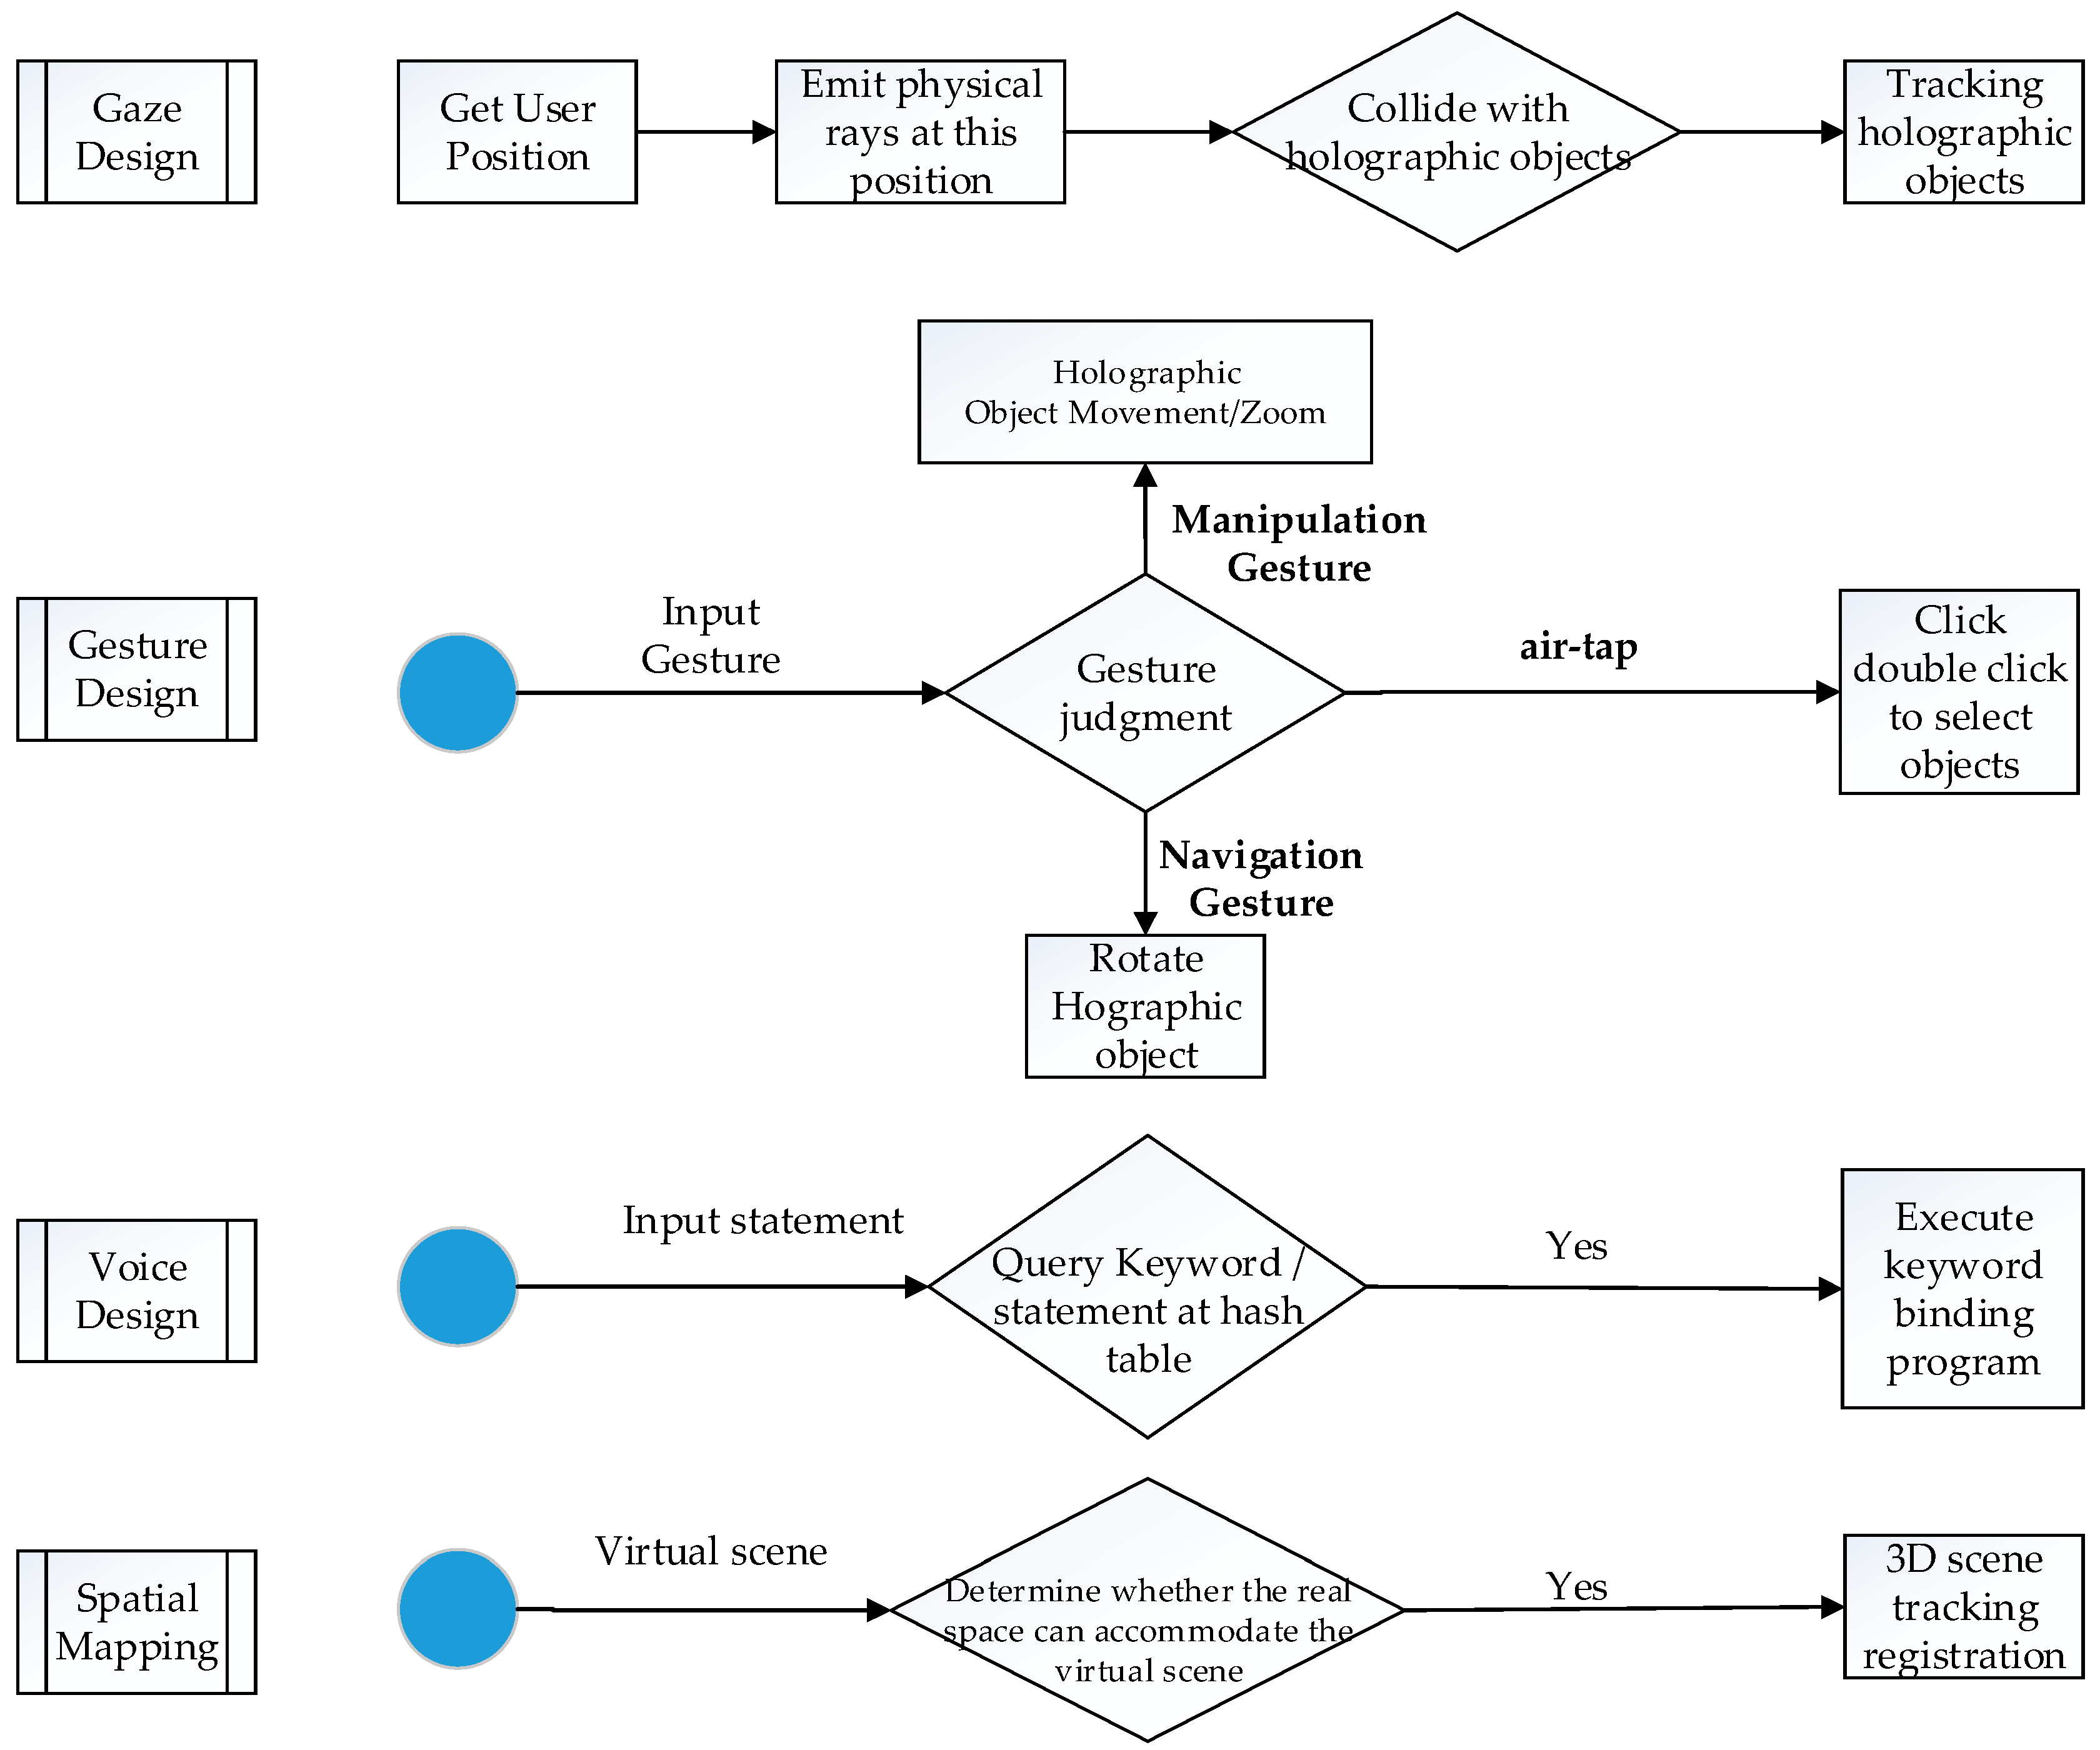
Figure 7.
Holo3DGIS application deployment for small scenes.
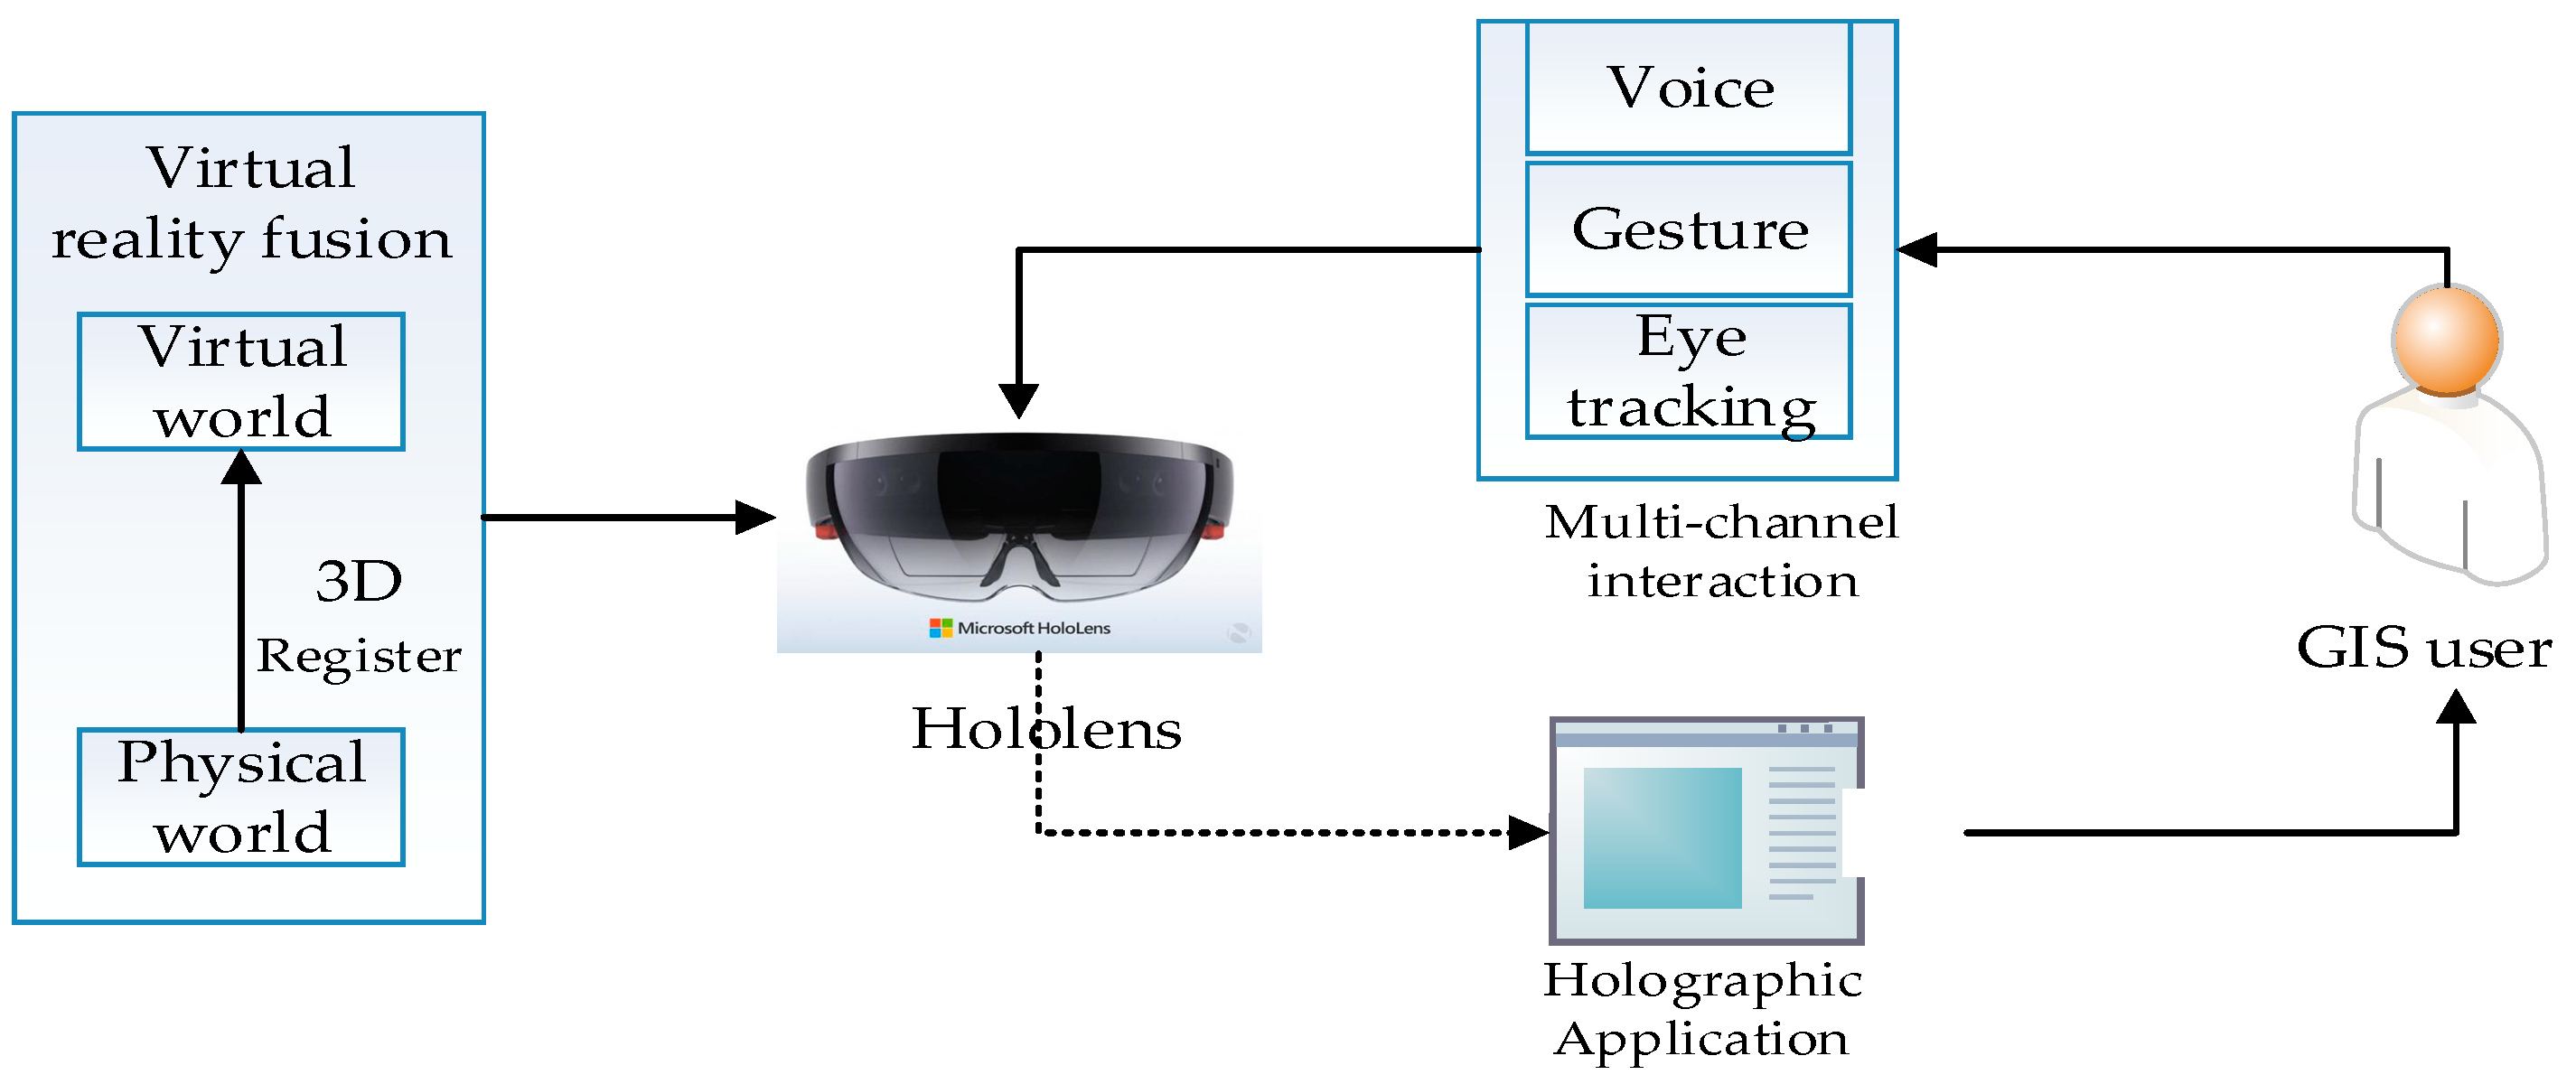
Figure 8.
Holo3DGIS application deployment for large scenes.
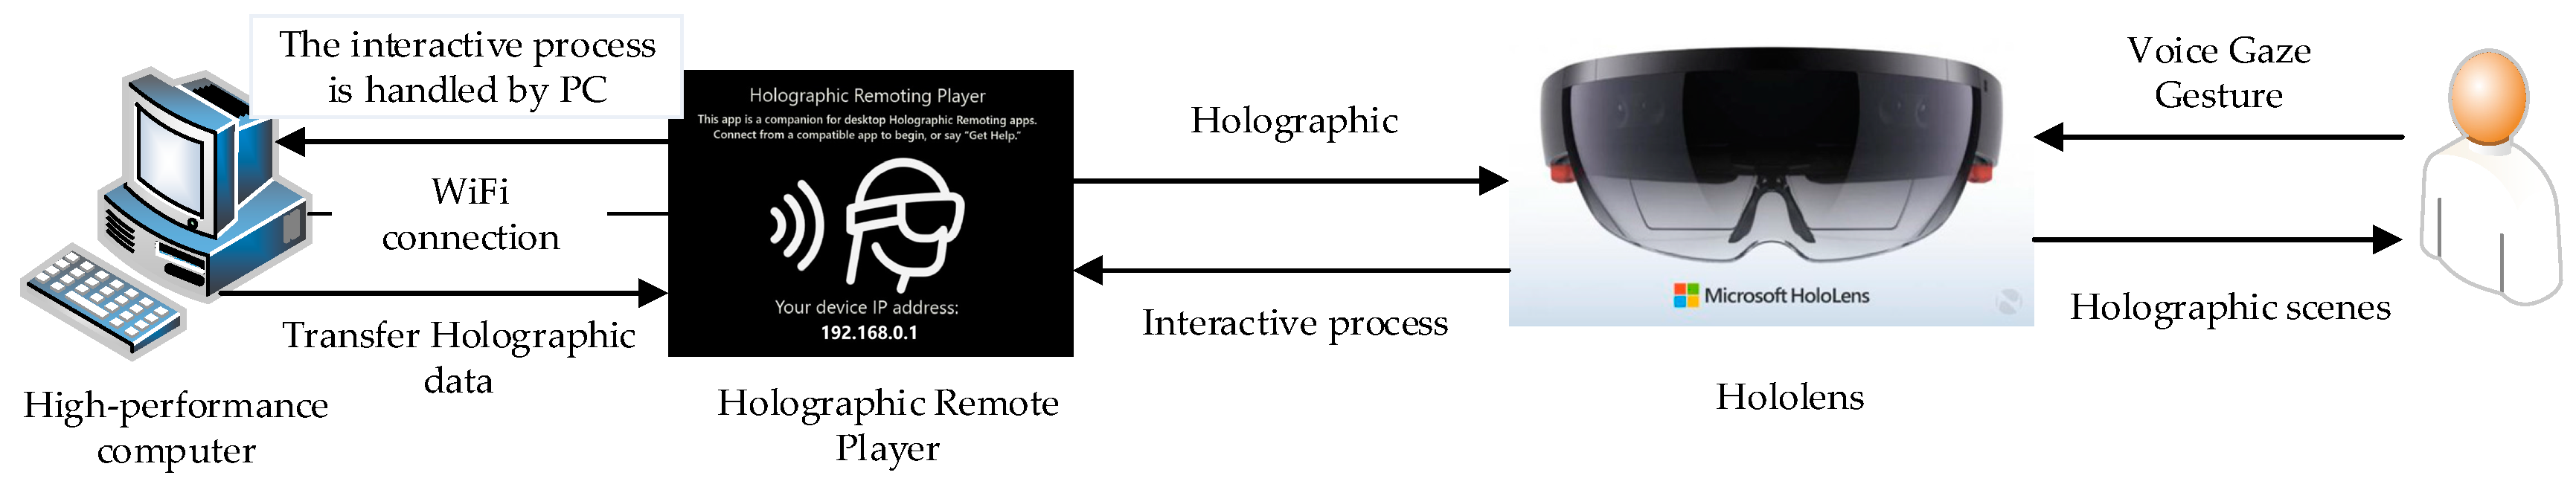
Figure 9.
Schematic map showing the introduction of the digital Philadelphia scene into the physical world.
Figure 9.
Schematic map showing the introduction of the digital Philadelphia scene into the physical world.

Figure 10.
Gaze interaction schematic.

Figure 11.
Gesture interaction schematic.

Figure 12.
Holo3DGIS application deployed on HoloLens headsets: CPU and GPU usage percentages.
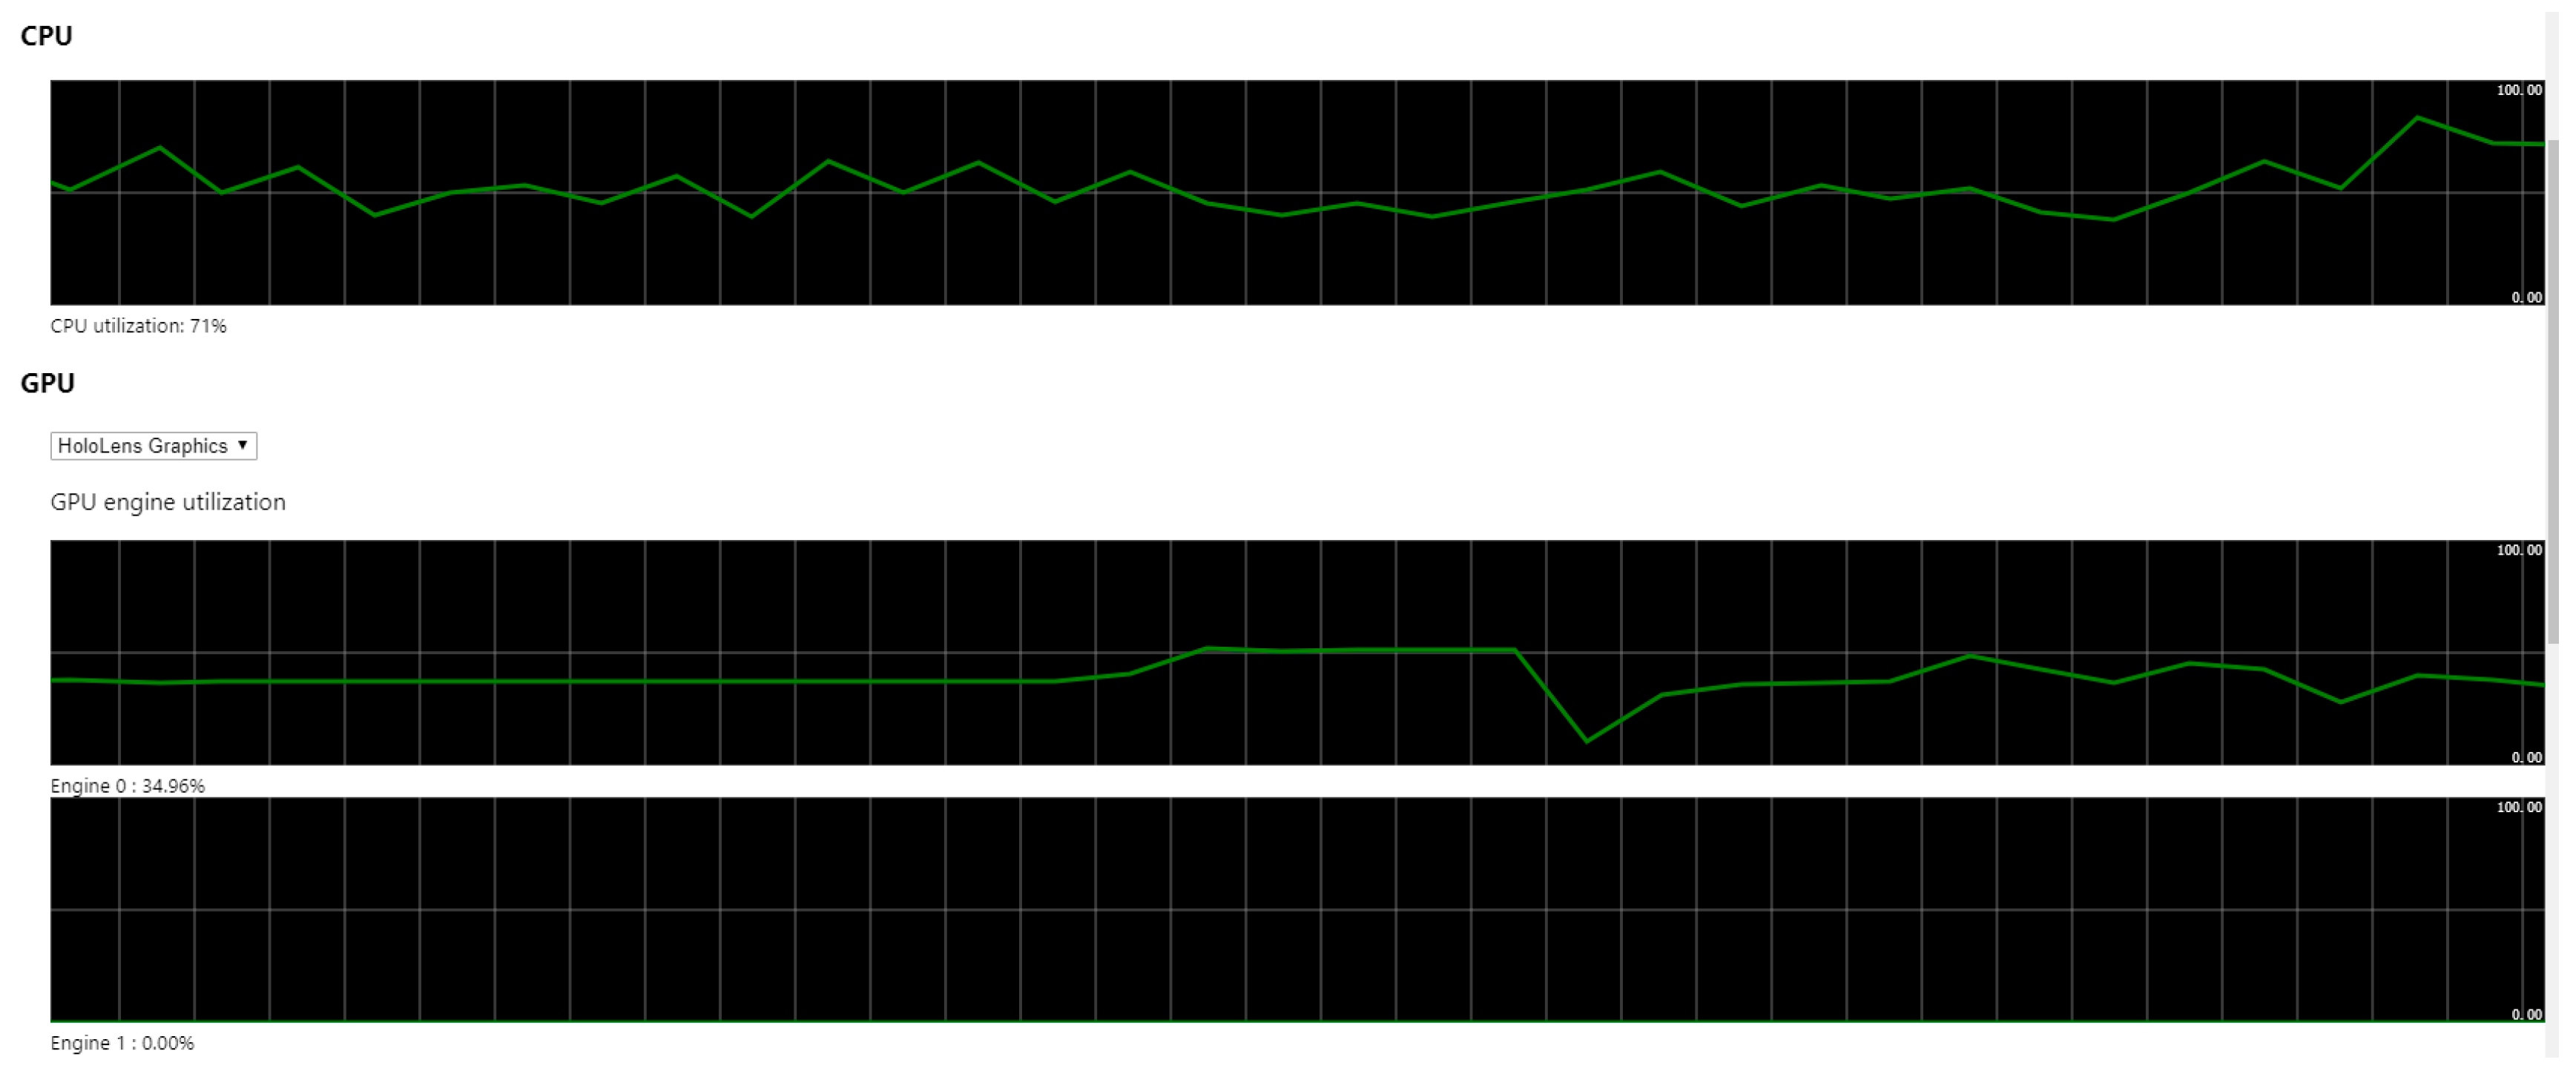
Figure 13.
Holo3DGIS applications deployed on PC HoloLens: CPU and GPU usage percentages.


Table 1.
The general process for modelling buildings.
| Data Preparation: 2D Building Vector, Contour Line, and Texture Map |
|---|
| Interpretative statement: the terms in the following passage (Lot, Building, Frontfacade, Floor and (Wall | Tile |Window)) are variables in the CGA rules file. Extrude(), comp(), split(), Repeat() and texture() are the functions of the CGA rules. The symbol -->is similar to equate (=). The result of the CGA file execution is a textured 3D building model. Lot -->extrude(height) Building // Creating the 3D buildings Building -->comp(f){front: Frontfacade | side:Sidefacade | top:roof} // Divide the building into three parts: the front, the left and the right Frontfacade -->split(y) Repeat{Floor} // Divide the building into target floors Floor -->Split(x) Repeat{Wall | Tile |Wall} //Split the floors into walls, windows, doors, and floors (Wall | Tile |Window) -->texture(texture_function) // Paste the texture for each segmented part with the mapping function |
© 2018 by the authors. Licensee MDPI, Basel, Switzerland. This article is an open access article distributed under the terms and conditions of the Creative Commons Attribution (CC BY) license (http://creativecommons.org/licenses/by/4.0/).
Share and Cite
MDPI and ACS Style
Wang, W.; Wu, X.; Chen, G.; Chen, Z. Holo3DGIS: Leveraging Microsoft HoloLens in 3D Geographic Information. ISPRS Int. J. Geo-Inf. 2018, 7, 60. https://doi.org/10.3390/ijgi7020060
AMA Style
Wang W, Wu X, Chen G, Chen Z. Holo3DGIS: Leveraging Microsoft HoloLens in 3D Geographic Information. ISPRS International Journal of Geo-Information. 2018; 7(2):60. https://doi.org/10.3390/ijgi7020060
Chicago/Turabian StyleWang, Wei, Xingxing Wu, Guanchen Chen, and Zeqiang Chen. 2018. "Holo3DGIS: Leveraging Microsoft HoloLens in 3D Geographic Information" ISPRS International Journal of Geo-Information 7, no. 2: 60. https://doi.org/10.3390/ijgi7020060
Note that from the first issue of 2016, this journal uses article numbers instead of page numbers. See further details here.