Evaluating and Optimizing Urban Green Spaces for Compact Urban Areas: Cukurova District in Adana, Turkey


Landscape Architecture Department, Cukurova University, Adana 01330, Turkey
*
Author to whom correspondence should be addressed.
ISPRS Int. J. Geo-Inf. 2018, 7(2), 70; https://doi.org/10.3390/ijgi7020070
Submission received: 13 December 2017
/
Revised: 8 February 2018
/
Accepted: 17 February 2018
/
Published: 22 February 2018
(This article belongs to the Special Issue Urban Environment Mapping Using GIS)
Abstract
:In recent decades, the ever-decreasing number of green spaces have become insufficient to meet public demands in terms of accessibility, spatial distribution and the size of urban green areas. This is mainly due to increasing attention on the issue of accessibility to urban green spaces. This paper aims to quantify accessibility according to existing qualitative and quantitative characteristics of urban green spaces (UGS) in Çukurova district in Adana, Turkey. Firstly, qualitative and quantitative characteristics of UGS are divided into five main categories: area size, amenities of the UGS, transportation, focal points and population density. A set of 59 criteria are used by referring to the literature and expert views. Secondly, the Weighted Criteria Method was used to determine the significance of levels within these criteria and the existing situation of each park was identified and scored via field work. Thirdly, accounts of the distance of UGS service areas distance from people or users were optimized according to the total scores of existing UGS sites. Finally, the service areas of UGS were mapped by using Network Analysis tools. Results highlight some practical implications of optimizing accessibility for urban planning, for instance, specific land uses might be chosen for highly accessible UGS particularly those characterized by their high area size and equipment variety, low population density, and proximity to units.
1. Introduction
In cities in the developing world, unplanned and informal settlements have increased social and spatial inequality, resource consumption and environmental degradation [1]. International studies over the last 15 years underline the significance of nature for people’s well-being, but it is mainly the reality of urban outflow which stresses the urgent need for urban greenery. In Turkey and other developing countries, urban planning practice has mainly focused on compensating for the shortage of housing and, as a result, it has prioritized construction. Urban green areas have been progressively narrowed, despite being essential components for quality of life in cities in terms of accessibility, spatial distribution, the size of neighborhood park areas and varieties of presentation.
Urban parks and open green spaces are of strategic importance for quality of life in our progressively urbanized society. Parks also permit citizens to enjoy open spaces for leisure activities that promote emotional stability and improve quality of life [2,3,4,5]. Among several developing world cities, unplanned and informal settlements have resulted in increased social and spatial inequality, resource consumption and environmental degradation [1]. Increasing attention is being paid to the issue of accessibility to urban green spaces (UGS), which is becoming one of the most debated issues in sustainable urban planning [6]. During the past few decades, the concept of accessibility, which often denotes the level of services in terms of the spatial distribution of parks, has been a crucial element for planning UGS. Accessibility to urban parks is adequate when the population is in harmony with the park’s spatial distribution [1,3].
The ever-decreasing number of UGS have become insufficient to meet public demands in terms of accessibility, spatial distribution and the size of UGS. As a result, the regulation of green areas in each country is based on different laws. Moreover, the scope of external applications is evaluated in a broader hierarchy that includes whether the UGS is a playlot, playground, recreational ground, neighborhood park, community park, city park or metropolitan park. Each of these areas’ criteria, such as the area size, the field size per capita, the service area radius and pedestrian access distance, vary from country to country. In Turkey, appendix-1 of the Regulation on the Principles of Planning, as promulgated in the official journal no. 23804 on 2 September 1999, defines the total area for the above-mentioned spaces as 10 m2/inhabitant.
The geographic information system (GIS) has been used to identify green space areas with high ecological, recreational and aesthetic values to protect specific green space areas from development [7]; to present a GIS-based decision support tool for modelling planning scenarios related to the creation of new green space areas as part of neighborhood greening strategies [8]; to quantify the spatial configuration of UGS that are used in landscape metrics [9,10,11]; to assess the accessibility of many proposed green space enhancements [1,12]; to implement a web-based platform [13]; to quantify accessibility to parks [3,14] and to analyze the delineation of distance-based catchment areas [15,16].
GIS is widely used to examine the pattern of accessible UGS. From simple radius-buffering methods aimed at evaluating the number of facilities and the proportion of the population within a fixed area [17,18], recent research has developed to integrate urban landscape characteristics or socio-economic data with more advanced methods for distance evaluation [19,20]. The Network Analyst is the most common approach in current research streams that is used for measuring accessibility to UGS or other urban facilities with GIS. It is to use indicators/measures which count the number of services (e.g., green areas, hospitals, other urban services) within a fixed distance (or time) from the origin points of users, or vice versa. These indicators are simply based on a distance relation between users and the service under examination and are generally easy to calculate, without the need for further analyses or data collecting [3].
This study’s starting position is the fact that UGS must be located within an appropriate travel distance for pedestrian access and must be of adequate size to serve the existing population. Parks that lack a luxurious variety of amenities and equipment according to the appropriate standards may have certain conditions and provide inadequate services despite being large areas. Additionally, this research aims to identify spatial and planning principles to provide an optimum level of utilization of UGS and to understand which areas are more suitable to be adapted into new UGS according to the municipality’s land-use plan. Moreover, the use of a maximum distance index that does not depend on any criterion is likewise insufficient. The methodological framework suggest that it is not sufficient to determine the service area of green areas considering only a few variables (i.e., accessibility distance, population, square meters of green per capita etc.). Accordingly, qualitative and quantitative characteristics of UGS should also be included in the assessment of accessibility so that the UGS service area can reach more populations and regions. As such, this study shall investigate the adequacy of UGS services in the Çukurova district in the city of Adana, the fifth most populated city in Turkey, in terms of accessibility and regarding the quantities and qualities of UGS.
2. Materials and Methods
2.1. Study Area and Available Geo-Datasets
The study area selected for this study consists of 10 selected neighborhoods in the Çukurova district, an urban context that is characterized by a high density of urban settlements (37°03′ N–35°17′ E). The district is one of the third most crowded population areas in the city of Adana and the most densely developed region in Adana (Figure 1). The study area, 42 km2, covers 21.5% of Adana’s urban settlement area (approximately 200 km2). The population reached 362,351 in 2016 [21]. Çukurova has undergone significant economic development and rapid urban expansion over the past 30 years. Private green spaces are still relatively rare however, which means that the provision of green space services mainly depends on public green spaces [6]. However, Çukurova is characterized by a relative shortage of public spaces and services, especially UGS (Table 1). Currently, the amount of UGS is approximately 1.8 m2/inhabitant, which is much less than the minimum amount specified by national legislation (10 m2/inhabitant).
UGS located in the urban settlement are not equally distributed in the study area. These UGS areas are mainly centered in the southern and eastern neighborhoods of the district, although their quantities and scopes decrease the development areas on the northern and western sides [22,23,24]. This situation is a fundamental problem that needs to be resolved in terms of the efficiency of the UGS. Therefore, the Çukurova district was chosen as a model study for the following two main reasons:
- constructional activities are continuous in the Çukurova district. These activities will lead to an increased need for UGS as an attraction center for the increasing population density. This is a significant opportunity for highly effective and integrated UGS system installation; and
- there is a need to resolve fundamental problems in the neighborhood context to ensure accessibility, quantities and quality and equal distribution for the establishment of new green areas and the development of existing green areas. This is because population units are determined to be the smallest administrative boundaries at the neighborhood level.
Four main datasets were used in this study. (1) The geographical distribution of UGS was obtained directly from field work and the latest public green space list published by the Çukurova municipal government departments [25]; (2) The overview of the city’s street network (pedestrian roads, crosswalks, overpasses and underpasses) was prepared from digital and paper maps, scaled 1:1000, and recent Google Maps images; (3) Geographic distribution data on urban residential communities was obtained from the Çukurova municipal government departments, existing on maps at scale of 1:1000, along with implementation data on the development plan and master plan 1:5000 scale (May 2010); (4) Neighborhood population data on the Çukurova district was obtained from the Turkish Statistical Institute [21].
2.2. Methods
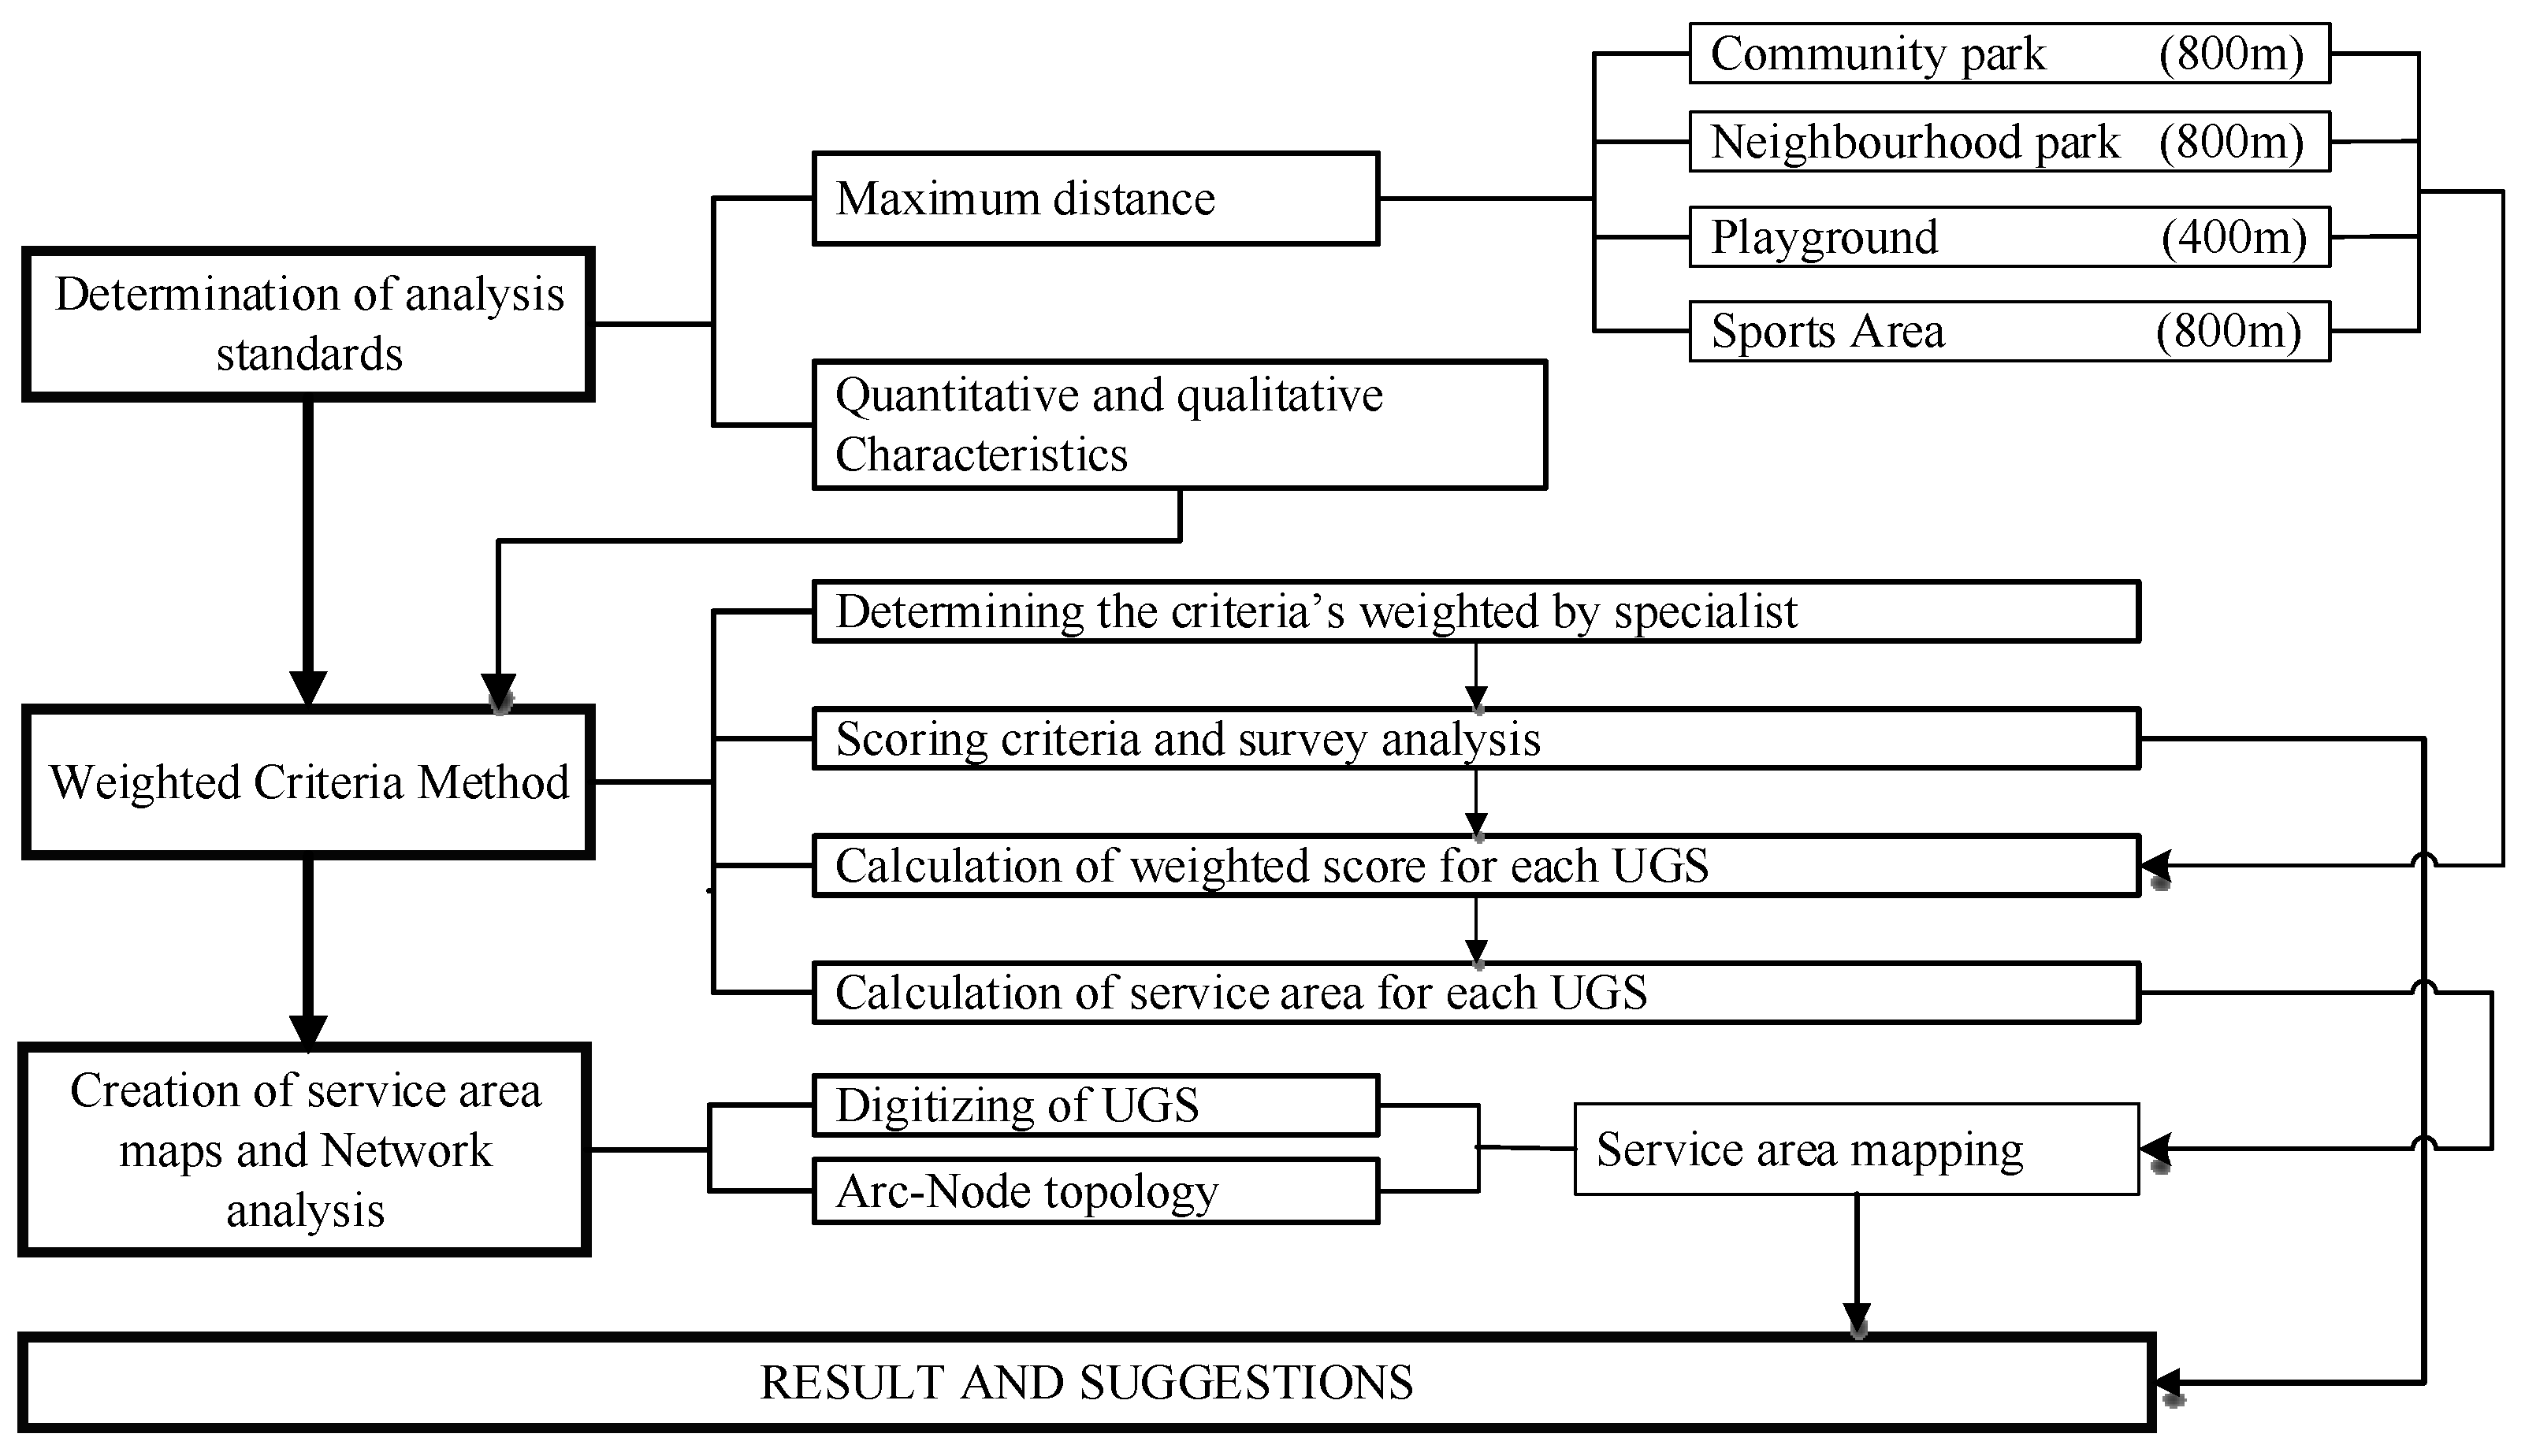
This study consisted of the following six phases: (1) Locating the UGS by means of survey studies, aerial photography and the Adana City Implementary Development Plan (1:1000 scale); (2) determining the primary standards by referring to the literature and expert views; (3) adapting the weighted criteria method to the evaluation of the service area based on the main criteria specified in the second stage; (4) evaluating the quantitative data and calculating the service area; (5) mapping the service areas of the UGS using network analysis; (6) enhancing the UGS’ spatial sufficiency and accessibility potentials and developing suggestions according to the final maps (Figure 2).
2.2.1. Determination of Analysis Standards
The primary indices of UGS service areas have been identified as maximum distance for pedestrians and the spaces’ quantitative and qualitative characteristics as a result of conducting research and interviews with experts [15,26,27,28,29]. While the maximum distance for pedestrians describes the relationship between UGS and users (residential places, schools, commercial areas, religious places etc.), the quantitative and qualitative characteristics describe the nature of UGS’ properties.
Maximum Distance
UGS need to be located within a convenient maximum distance to meet users’ daily recreational needs. According to sustainable urban development strategies, users must benefit equally from public services, which are considered an important measure for ensuring the accessibility of social justice. Therefore, these considerations reflect important and necessary principles of accessibility [30]. Many studies on public facilities, including UGS, have been conducted with a focus on their accessibility and walking score. Herzele and Wiedeman [28], Altunkasa [31], Uz [32], Oh and Jeong [14], Kellett and Rofe [33], Duncan et al. [34] and Onder et al. [35] likewise recommended maximum distance standards of 400 m to playgrounds and 800 m to neighborhood parks, recreation areas and community parks. Their results indicate similarities between Turkey and other countries.
Quantitative and Qualitative Characteristics
Fifty-nine criteria were eligible for use in this research as a result of the interviews conducted with 50 experts and study of the relevant literature. Firstly, 29 criteria were determined as a result of studying the relevant literature (Table 2). Secondly, non-existent criteria in Table 2 were obtained from interviews conducted with 50 experts (landscape architects, urban planners and designers and architects), who highlighted which criteria could affect accessibility. Thirdly, these criteria were separated into main groups and subgroups by an expert. Consequently, the quantitative and qualitative characteristics of the UGS were classified into five main groups; area size, nature of the UGS, transportation, focal points and population density (Table 3). While all these criteria can be used about community parks, 58 criteria have only been applied to neighborhood parks, 52 criteria for sport and recreational grounds and 50 criteria for playgrounds owing to differences between the facilities and equipment of the UGS.
2.2.2. Weighted Criteria Method
The weighted criteria method is based on the numeric description of the criteria condition in the workspace (in general, from positive to negative). These criteria were used to determine the proficiency or service level of the examination area. The level of importance of the evaluation criteria differs because the capabilities for influencing the proficiency or service level are variant. Therefore, establishing weights is an essential aspect of these methods.
At county level, the first example of the weighted criteria method was developed for the Santa Barbara County in 1974 to design a cyclist network connection between housing, school, workplace and recreational areas. It used a computerized model to evaluate the impact of development alternatives using weighted criteria. The following studies [22,23,24,26,31,58] developed the methodology to be used for different purposes. In this study, the criteria describes characteristics of the UGS and then quantifies a weighted score of the park.
The weighted criteria method is based on the following three-step process:
- (1)
- Weighting: As the significance level of criteria can vary according to different experts (landscape architects, urban planners and designers and architects etc.), each of the main group, sub-group and criteria is given a weighted score grading between 0 and 100 on the basis of interviews conducted with 50 experts using questionnaires. Thus, each criterion is standardized and the coefficient of the weights (CW) is determined. The calculation of weight coefficients was conducted according to the examples presented in Table 3:
- The mean of the criteria without subgroups directly constitutes the weighted coefficient. Example: Size of park area × 100−n (n = 0).
- The weighted coefficient for the criteria of the only main group was calculated by multiplying the mean weighted percentage of the criteria by that of the main group. The main group × criteria’s mean weighted percentage (100−n).Example: Access and connectivity × sidewalk width × 100−2 (n = 2).
- The weighted coefficient for the criteria of the subgroup and main group was calculated by multiplying the mean weighted percentage of the criteria by that of the main group and subgroup. The main group × subgroup × criteria’s mean weighted percentage (100−n).Example: Access and connectivity × pedestrian facilities × crosswalk × 100−3 (n = 3).
where n: The number of subgroups. - (2)
- Scoring: The determined 59 criteria were assigned 0–3 points to identify the criteria score (CS) from different qualitative and quantitative characteristics of the UGS and an assessment form was created. The reason for the changes in values was to highlight the distinction between the positive and negative conditions of the parks [26]. The rating assignment process of the evaluation form was carried out in three main categories according to the characteristics of the criteria. These categories comprised proportional criteria, evaluable criteria and unevaluable criteria. Proportional criteria converts values to percentage values by means of proportioning. Evaluable criteria assigns a value between 0 and 3 depending on the condition of the criteria. Unevaluable criteria are assigned 3 points in the case of a positive condition, but are assigned 0 points in the case of a negative condition (Table A1).
- (3)
- Calculating the Weighted Score for UGS: Each UGS is evaluated in terms of its qualitative and quantitative characteristic and calculated weighted score (WS).
2.2.3. The Optimizing of the Service Area
This section marks Stage 3 (Calculating Weighted Score for UGS) of the calculation of the service areas. In the first stage, the weighted scores for each criterion were calculated by multiplying the criteria scores by the weighted coefficient value (Equation (1)), then the total UGS weighted scores were calculated by adding up each weighted score (Equation (2)).
WSa (Weighted Scoren) = CWn (Coefficient of weightedn) × CSn (Criteria scorea)
In the second stage, the maximum weighted score was calculated for every UGS type. The maximum weighted score, which was 300 points, was obtained from adding up each maximum weighted score as calculated by multiplying the criteria’s maximum scores (3 points) by the weighted coefficient value (Equation (3)).
In the final stage, the total weighted score of the connected service area values was accepted as the percentage between the sum of the highest criteria scores (300 points) to obtain the total weighted score for each UGS. These values were calculated by multiplying the optimum walking distance to the UGS type (CP: 800 m; NP: 800 m; S: 800 m; P: 400 m) by these percentage ratios (Equation (4)).
where UGS: Urban green space, WS: Weighted Score, CW: Coefficient of weighted, CS: Criteria score, X: Urban green space code, n: Criteria.
2.2.4. Network Analysis and Arc-Node Topology
In recent years, the modelling of the accessibility of green spaces has evolved substantially thanks to enhanced GIS features, and in particular the development of GIS network analysis modules, such as the ArcGIS Network Analyst Tool and the computational capabilities of personal computers. Using the network analysis method of GIS, this study analyzed the actual accessibility of urban parks to pedestrians in Çukurova, similar to previous studies [14,27,59]. In the network analysis, centers, arcs, nodes, and impedances are key elements in the analysis (Figure 3). Therefore, in the first stage, Arc-Node topology was formed to define the service area. In this research, arcs define pedestrian routes that connect citizens to the parks. An impedance refers to barriers that prevent movement between links, and different impedance values were assigned according to route types, such as pedestrian roads, crosswalks, underpasses and overpasses. Therefore, these lengths (walking and crossing roads, underpasses and overpasses) are added walking distance and are subsequently also defined as arcs. Nodes are intersections of links (entrance[s] to the park, crossroads and road intersections). The extend of the network is line-shaped, which means that the service areas of each park are determined by 400 m and 800 m buffers (according to UGS) for pedestrian routes within the network’s extent. Consequently, it was determined that network analysis could be used to provide the boundaries of the service areas of parks and show where citizens can access them within a given distance.
2.2.5. Service Area Enhancement Suggestions
After determining the service areas, suggestions to enhance the model planning scenarios related to the creation of new green space areas as part of distance-based neighborhood greening strategies and to assess the accessibility of many proposed green space enhancements. Upgrading the weighted UGS scores, the possibility of changing and improving criteria was determined for the quantitative and qualitative characteristics of green space. These criteria enabled the enhancement of the service areas that were assigned a score of 3, and subsequent changes in these service areas were determined. The possibility of changing both improvement criteria (42 in number) and limited improvement criteria (17 in number) was identified through interviews conducted with experts (Table A1).
3. Results
This study aims to optimize UGS’ service areas regarding the quantities and qualities of UGS in the Çukurova district. Additionally, it aimed to identify the location and planning principles for UGS that will provide optimum benefits. The study was conducted for 105 UGS that were determined through survey studies in Çukurova, comprising of 2 community parks, 32 neighborhood parks, 54 playgrounds and 17 sport and recreational areas.
To calculate the UGS’ weighted score and optimum service area, some variables should be set. The first step was determining the criteria that could affect accessibility and separating them into main groups and subgroups. The second step was weighting. All main groups, subgroups and criteria are determined using the Weighted Criteria Method and based on expert views (Table 3). Table 3 demonstrates the weighted coefficient for each type of UGS that ranges from 0.22 to 19.43 over 100 points. The mean of the criteria without subgroups directly constituted the weighted coefficient. As such, the size of the park area (19.43), population density (13.49) and sidewalk width (10.04) are essential for evaluating the quality of green areas because of their high-weighted coefficient value. The weighted coefficient for all types of UGS were similar, because the weighting was based on the criteria, not on the UGS types.
The third step was scoring. To highlight the distinction between the positive and negative conditions of UGS by conducting field work, criteria were scored 0–3 points (Table A1). After setting the variables and calculating the weighted coefficient, the total weighted score, maximum weighted score and optimum service area were computed using Equations (1) and (2), Equation (3), and Equation (4) respectively (Table 4). Therefore, the service area distance is optimized the total weighted score.
Following the previous steps, in order to map maximum service, a network with a 400 m (for P) and 800 m (for S, CP, and NP) radius around the UGS was used to investigate the total areas for pedestrian accessibility areas. This network distance shows maximum accessibility if UGS are of the maximum weighted score (Max score: 300) or all criteria have the best score. Secondly, to compute the optimum service area, the maximum service area distance (400 m and 800 m) optimized the total weighted score of UGS (Equation (4)) and were mapped by using ArcGIS Network Analyst tool (Figure 4).
The general results were that the average of the total weighted score was as follows: CP: 166.82; NP: 121.09; P: 98.37; and S: 83.27 (Table 4). Moreover, the quantitative and qualitative characteristics of green spaces show that community parks (100%) and neighborhood parks (50%) were generally of moderate quality. While a significant proportion of neighborhood parks (41%) were inadequate in terms of quality, a tiny part demonstrated good quality. The vast majority of playgrounds (63%) and sports fields (88%) were also inadequate.
Figure 4 shows the comparison of UGS service areas (CP: 800 m; NP: 800 m; S: 800 m; and P: 400 m) and their optimum service areas according to their own quantitative and qualitative characteristics. The UGS service areas covered CP: 16.6%; NP: 69.3%; S: 43.6%; and P: 42.1%. However, these ratios sharply decreased after computation of optimum service area (CP: 4.9%; NP: 29.6%; S: 7.1%; and P: 10.9%).
In line with these results, this study aimed to develop recommendations for increasing the optimum service areas based on the weighted scores of UGS. The increased percentages of optimum service areas were calculated by the re-evaluation of the qualitative characteristics of UGS with the highest score of improvement criteria (Table 5). Only two parks increased their optimum service areas over 50%. The overall increase of parks was concentrated between 40% and 30%. Consequently, this study observed that the park with the highest weighted score demonstrated a slight increase, whereas there was a more significant increase in the parks with low weighted scores.
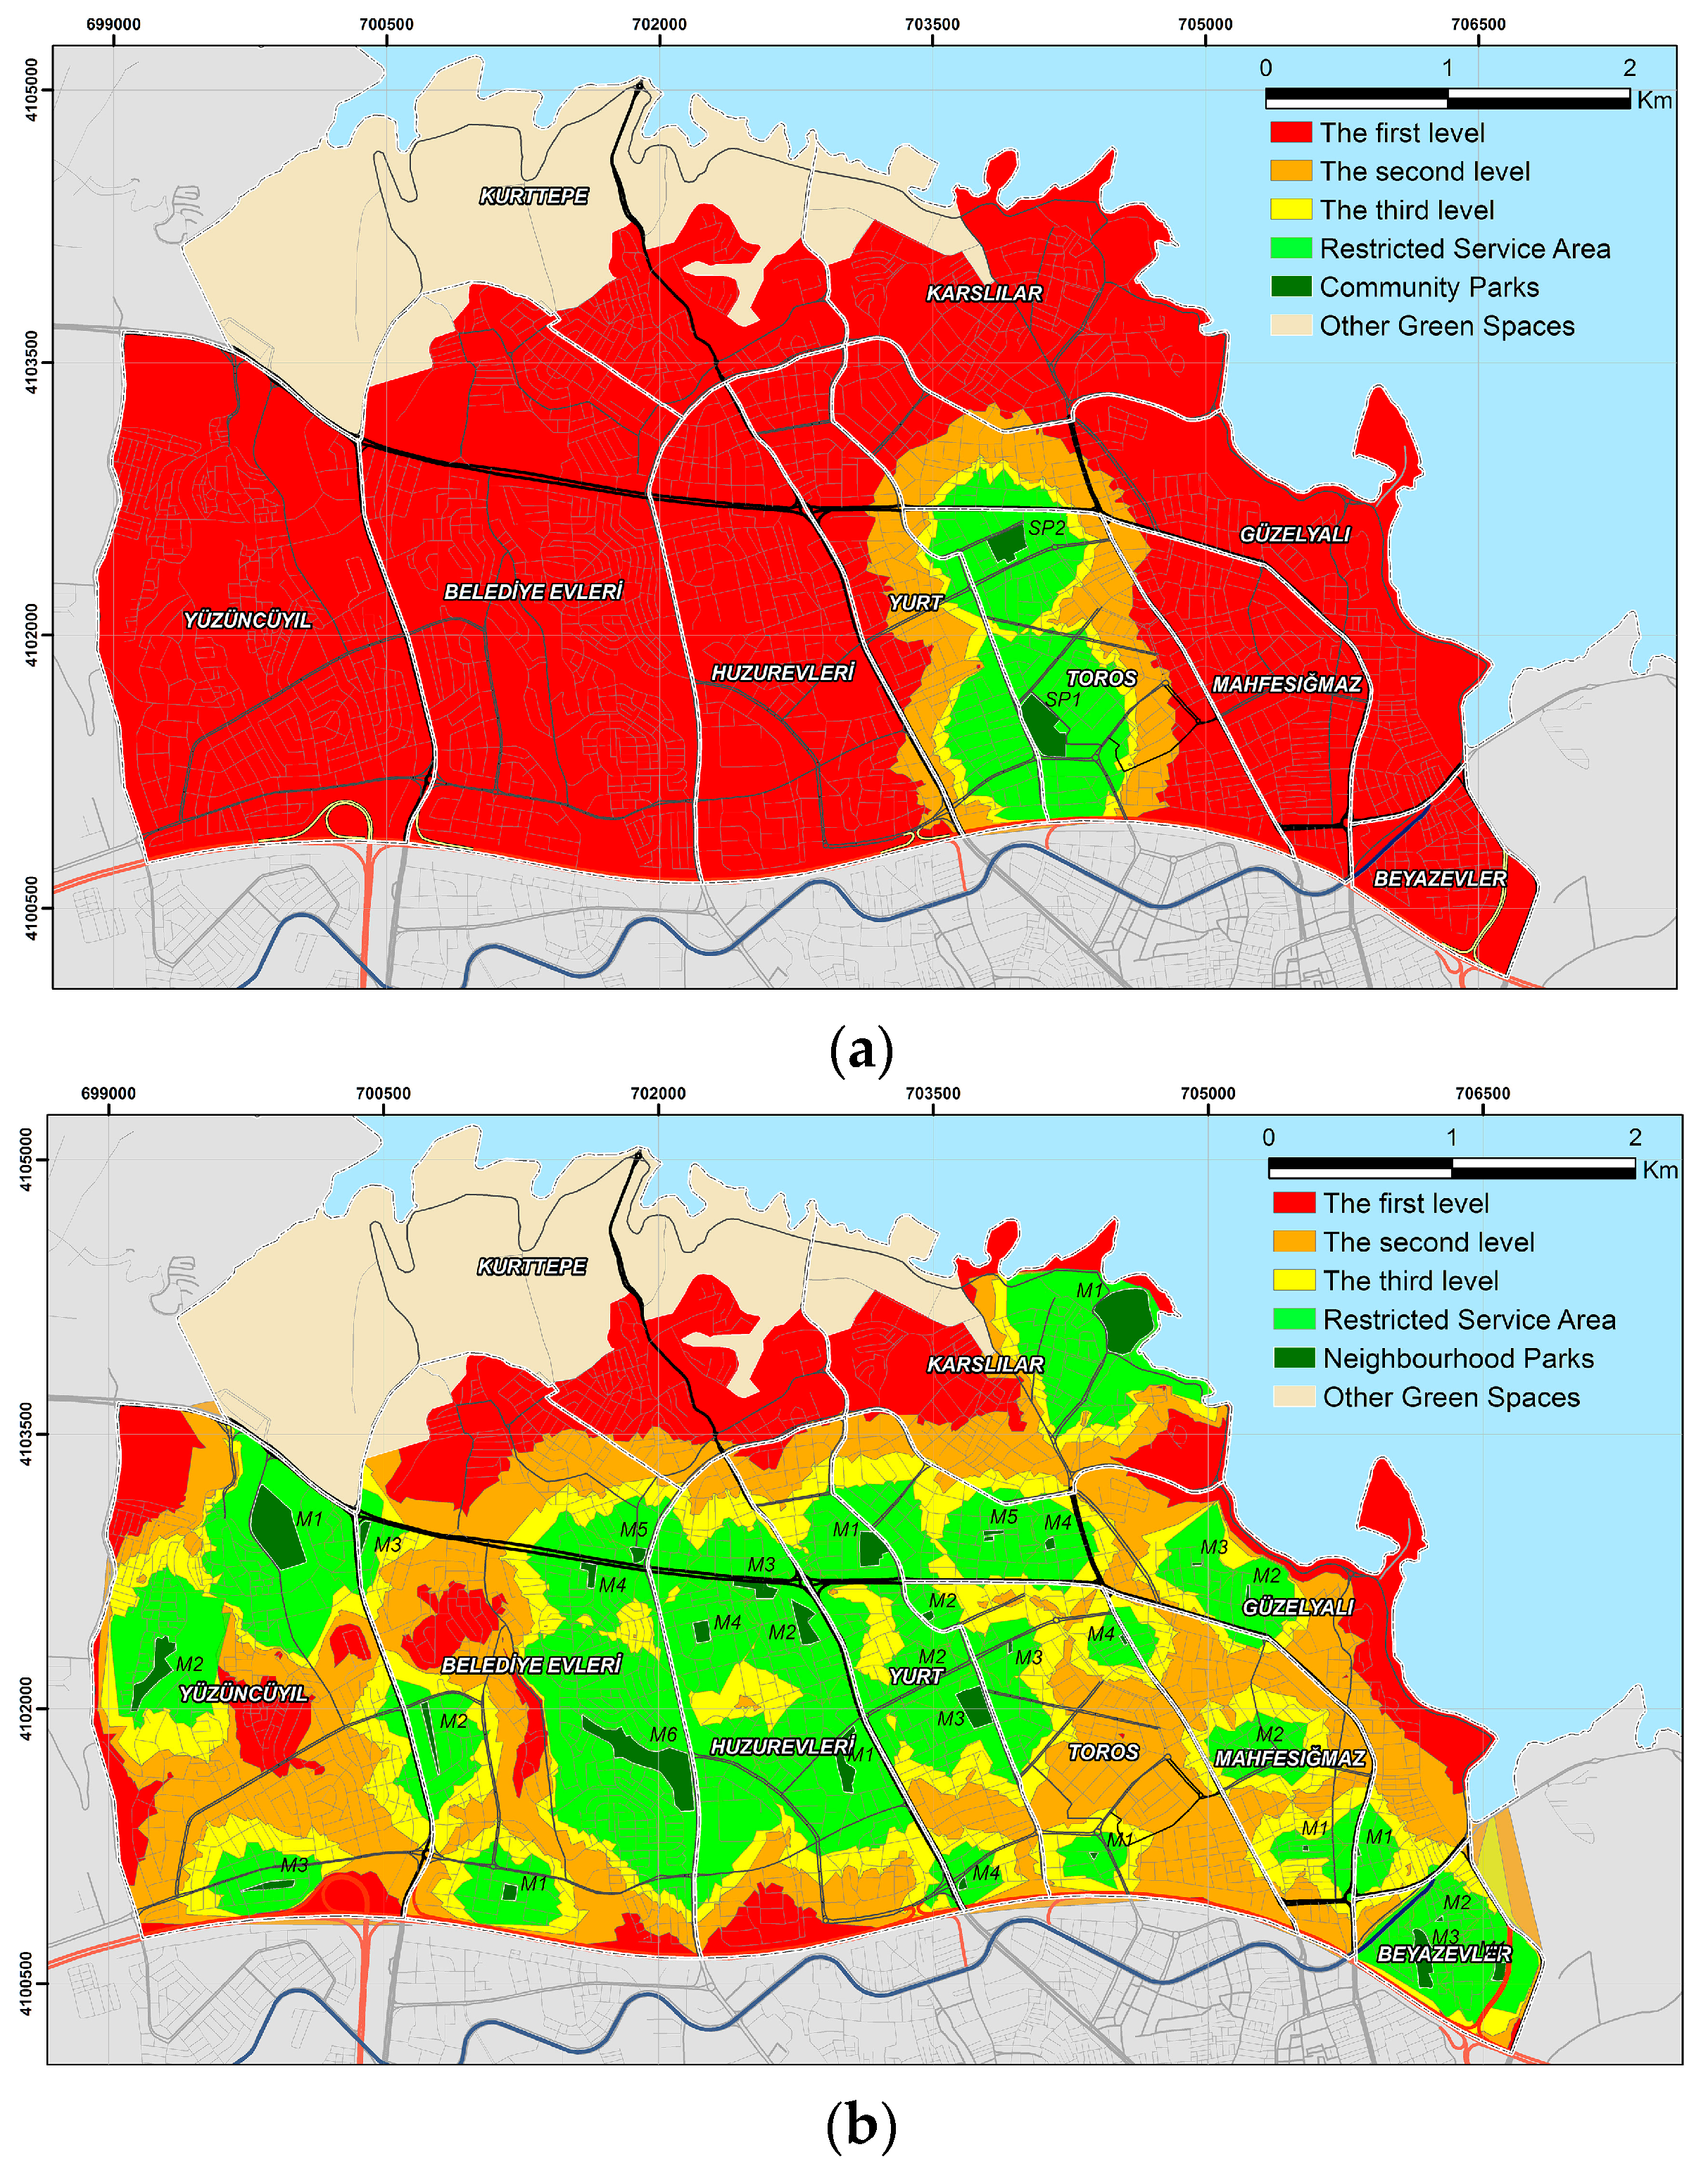
Last of all, in order to understand the geographical configuration of areas where UGS were inaccessible and which location was suitable for new UGS, service area maps were created according to priority levels. The first priority area for new UGS is the region outside the maximum service areas (CP: 800 m; NP: 800 m; S: 800 m; and P: 400 m). The second priority area is the region between the maximum service area and optimum service area. The third priority area is the region between the optimum service area and the increased service area (Figure 5). The first and second priority areas are especially important for new planned UGS, because there is no pedestrian accessibility to UGS in this area. However, the second priority areas have limited pedestrian access, despite the inadequate characteristics of UGS. When the park facilities improve, the third priority area can then be served. In other words, the optimum service area will be higher.
Figure 5 and Table 6 show that community park service areas mostly covered the center of the district, which led to high degree of first priority areas in the study area (83.1%). There are few or almost no first priority areas in neighborhoods (28.8%), owing to the presence of more numerous neighborhood parks and it possessing the highest optimum service area (29.6%). However, sports and recreational parks mostly located on the right side of the district and were rarely located on the left side of district. Therefore, the first priority areas were at the second highest level with 56.1%. Although playgrounds are homogenously located in the district, the first priority areas had the highest levels (57.3%) due to their distance effecting accessibility.
Consequently, when the qualities and quantities of UGS are at the highest level, UGS is accessible for 76% of the Çukurova district. However, this rate dropped to 41% because of the optimizing service area. This percentage is expected to rise to 55% with the improvement of these qualities and quantities. When the following identified deficiencies are eliminated, the parks will become entirely adequate and the optimum service area will be higher.
- Community Park and Neighborhood Park: Water features, toilets, borders, fountains and plantation are insufficient to meet the public needs in addition to aesthetic and functional needs. Shelters and pavilions should be located according to climatic conditions. Moreover, this study observed that there was no regular maintenance for trash bins, boards or park borders, which should not be overlooked in terms of functionality and aesthetic characteristics. Finally, the playground facilities in CP and NP need to be constructed according to proper planning and design principles to choose correct locations, to maintain appropriate plantation, to form a relationship with other facilities and to have security.
- Playground: These areas were not constructed according to proper planning and design principles to choose correct locations, to maintain suitable plantation, to form a relationship with other facilities or to have security. The playgrounds were designed for only a particular age group of children and contained similar play equipment and functions. They did not include different play equipment that could be used by different age groups, such as equipment with animal and human figures, play hills, spacious lawns, water surfaces and sandpits. Moreover, the playgrounds were neglected and of a traditional character, and they were not qualified to serve the physical, social and psychological development of children of all age groups.
- Sport and Recreational Grounds: These areas were not constructed according to proper field size and did not possess a variety of facilities and equipment or plantations. Notably, the ergonomic and constructional characteristics of the equipment were not considered at the design stage.
- Moreover, all types of UGS were found to be insufficient for meeting the population needs regarding their area size. In addition, UGS and their surroundings were not suitably designed for the physical, social and psychological nature of people with disabilities to allow them easy access and enable them to use the equipment.
The rest of this percentage (i.e., 45%) comprises of 3% for UGS, 14% for recreational areas and 28% for priority areas for planned new UGS (Figure 6).
4. Discussion
Urban parks and open green spaces are of strategic importance to ensure quality of life in our progressively urbanized society. Parks also permit citizens to enjoy open spaces for leisure activities that promote emotional stability and improve quality of life [2,3,4,5]. Among several developing world cities, unplanned and informal settlements have resulted in enlarged social and spatial inequality, resource consumption and environmental degradation [1]. Increasing attention is being paid to the issue of accessibility in relation to UGS, which is becoming one of the most debated issues in sustainable urban planning [6].
Accessibility is a broad, flexible and slippery concept [60,61]. During the past few decades, the concept of accessibility, which often denotes the level of services in terms of the spatial distribution of parks, has been a crucial element in the planning of UGS. Accessibility to urban parks is adequate when the population is in harmony with the park’s spatial distribution [1,3]. When park facilities meet the high demands for park services in densely populated areas, the supply is thought to be adequate, and thus accessibility is considered convenient.
This paper’s objective was to establish a methodological framework for evaluating and optimizing UGS in densely built urban areas. UGS must be located within an appropriate travel distance for pedestrian access and they must be of an adequate size to serve the existing population. Additionally, UGS should provide the optimum level of utilization with their characteristic features.
GIS use and the ability to model procedures make it feasible to determine which areas are more suitable to be adapted into new UGS in line with accessibility and network distance, although it is not commonly used among users of Euclidean distance. Nevertheless, network distances are more precise and closer to real distances, even if they need network layers of streets and require a longer computing time when calculating distance.
This paper is based on the theoretical foundations of landscape architecture and the new discipline of landscape urbanism, combined with spatial analysis and GIS. The steps of its methodological framework are as follows:
- newly proposed method for evaluating the accessibility of UGS (based on accessibility distance, combined with the qualitative and quantitative characteristic of parks).
- Optimum service areas that include all evaluation criteria (the five main groups of area size, amenities of the UGS, transportation, focal points and population density), along with the appropriate data and destinations, in addition to the use of network analysis. This will lead to the increased accessibility of parks, not only for existing UGS but also for proposed urban green areas.
- This paper argues that using only indices relating to square meters of green per capita, service area distance and population, are not satisfactory for accessibility analysis. Parks that lack a rich variety of amenities and equipment according to appropriate standards may be unqualified and provide inadequate services despite physically being large areas. Moreover, this study argues that the use of a maximum distance index that does not depend on any criterion is likewise insufficient. The methodological framework proposes to take account of the overall service areas of the new UGS with evaluation criteria regarding the wider region and services to the population.
5. Conclusions
This paper’s objective was to establish a methodological framework for evaluating and optimizing UGS in densely built urban areas. The methodology of this study can be useful for helping to understand the spatial distribution of urban parks more accurately and to establish effective policies for urban park management for some of the most high dense population cities in the world. UGS that provide large spaces and diversity should be considered near the borders of neighborhoods, as this will allow many individuals living in different neighborhoods to benefit from these parks. The findings showed that field size is the most challenging criterion regarding improving the quantitative aspects of UGS. Thus, the optimal size of parks should be considered as part of its effectiveness in servicing the area. Field size and spatial population distribution for neighborhood parks according to population density should, therefore, be determined in urban development plans, especially in new urban development areas. Also, UGS planning should be developed based on scientific studies that take into account their aesthetic, functional and social benefits. To sum up, the expected benefits of UGS are inadequate in urban areas owing to the priority given to building areas, the uneven spatial distribution of parks, the shortcomings of the park amenities and their weak service areas and accessibility issues. They can be adapted as part of a process of participatory decision-making from the corresponding structures of bureaucracy, municipality and state, as well as from suggestions by experts, especially urban planners. Based on these findings, this study offers suggestions for enhancing the service areas of UGS in the Çukurova district and suggests angles for future study.
Acknowledgments
This work was supported by the [Scientific Projects Administration Unit of Çukurova University] under Grant (number FYL-2014-1926).
Author Contributions
Muge Unal and Cengiz Uslu developed the theoretical formalism, performed the analytic calculations and performed the numerical simulations. Muge Unal contributed to the final version of the manuscript.
Conflicts of Interest
The authors declare no conflict of interest.
Appendix A

Table A1.
Urban green space evaluation criteria, characteristics and scores used for evaluation.
| Proportional Criteria | |||
|---|---|---|---|
| Evaluation Criteria and Characteristics USED | Score | Evaluation Criteria and Characteristics USED | Score |
| * 1. Size of Park Area | * 2. Size of Playground Area in the Community/Neighborhood Park Area | ||
| • For district and neighborhood parks, 0–57,763 m2 and above | 0–3 | 0–19,254 m2 and above for playgrounds area | 0–3 |
| • For playgrounds, 0–10,830 m2 and above | 0–3 | ||
| • Sports facilities, 0–57,763 m2 and above | 0–3 | ||
| |||
| * 3. Size of Sport and Recreational Grounds Area in the Community/Neighborhood Parks Area | * 4. Connectivity Lane To Park | ||
| 0–4132 m2 and above for sports and recreational grounds area | 0–3 | Score for the roads | 0–3 |
| 3. Regarding the idea that playgrounds and sport and recreational grounds should exist in neighborhood parks, based on the method explained in standard no. 1, ‘Size of Parks Area’, the sport and recreational ground ratio (3.63 m2) in 10 m2-UGS has been compared with the minimum acceptable value (11.383 m2) in neighborhood parks. As a result of this comparison, 4.132 m2 is the minimum acceptable value for sport and recreational grounds located in neighborhood parks. The size of sport and recreational grounds located in neighborhood parks has been specified in relation to the paths that border these sport and recreational ground (as parcels). 4. Owing to the geometrical shape of UGS parcels, the number of sides is accepted as the number of surrounding roads. Each road has been evaluated according to the types of the roads stated by [62] and the scores assigned to them. The total score has been divided by the number of the sides of the parcel, and an average score between 0 and 4 has been calculated. Since the methodology requires that all scores are between 0 and 3, this average score has been proportioned by 3. Footpaths 4, Local roads (15 m) and blind streets (15 m) 3, Frontage roads (19.5 m) 2, Secondary roads (24 m) 1, Main roads (36.5–46 m) 0. | |||
| * 5. Population Density | |||
| The norm for urban green spaces per capita: | |||
| 3.63 m2 and above for community and neighborhood parks | |||
| 2.72 m2 and above for playgrounds | 0–3 | ||
| 3.63 m2 and above for sport and recreational ground | 0–3 | ||
| 5. Firstly, to calculate the population density of UGS, the ratio of the service area intersected with the neighborhood boundaries was determined. As this ratio applied to the population of parks, the ‘total service area population (TSAP)’ was calculated with Equation (5). Secondly, the number of parks per capita was calculated by comparing park sizes with the obtained population values. Finally, the population density index (PDI) was calculated with Equation (6).
| |||
| Evaluable Criteria | |||
| Evaluation Criteria and Characteristics USED | Score | ||
| 1. Road Width in the Park | 2. Suitable Equipment for People with Disabilities | 3. Suitable Pavements for Facilities in the Park | |
| 2.25 < Road width | 5 and 6 pieces equipment | 4 and 5 features | 3 |
| 1.5 < Road width < 2.25 m | 3 and 4 pieces equipment | 2 and 3 features | 2 |
| Road width < 1.5 m | 1 and 2 pieces equipment | 1 feature | 1 |
| No road | No equipment | No features | 0 |
| |||
| 4. Suitable Material Selection for Children in Playground Facilities and Activity Areas | 5. Playground’s Relationships with Other Facilities | 6. Ergonomic Characteristics of Play Equipment | |
| 3 appropriate materials | Related to 3 elements | 5 and 6 characteristics | 3 |
| 2 appropriate materials | Related to 2 elements | 3 and 4 characteristics | 2 |
| 1 appropriate material | Related to 1 element | 1 and 2 characteristics | 1 |
| No appropriate materials | No relation | No appropriate characteristics | 0 |
| 4. While evaluating, the criterion of the materials’ appropriateness was determinant: (1) Grass area or sand soil; (2) Game elements made of wood or plastics; (3) Secure connection points.
5. While evaluating this criterion, the distance of the spaces to the following area was determinant: (1) Close distance to lavatory/toilet; (2) Close distance to fountains; (3) Away from the streets. 6. While evaluating this criterion, the following characteristics were determinant: (1) Ideal slide slope; (2) Ideal slide width; (3) Ideal distance between stairs; (4) Ideal swing height and chain length; (5) Ideal seat width; (6) Ideal seesaw length and height. | |||
| 7. The Variety of Play Equipment in Playground Facilities | 8. Ergonomic Features of Shelter or Pavilion | 9. Ergonomic Features of Benches or Banks | |
| 5 or more kinds of play equipment | 5 and 6 features | 5 and 6 features | 3 |
| 3 and 4 kinds of play equipment | 3 and 4 features | 3 and 4 features | 2 |
| 1 and 2 kinds of play equipment | 1 and 2 features | 1 and 2 features | 1 |
| No play equipment | No features | No features | 0 |
| 7. Instrument diversity, such as slides, swings, seesaws, climbing instruments and sandpits, has been considered.
8. and 9. While evaluating these criteria, the presence of the features was determinant, such as (1) Ideal seat height of 40–45 cm; (2) Ideal seat width of 35–40 cm; (3) Backrest; (4) Ideal backrest height of 50 cm; (5) Ideal angle between the seat and backrest of 95–105°; (6) Armrest [64]. | |||
| * 10. Sidewalk Width | 11. Suitability for Use at Night | 12. Ergonomic Features of Trash Bins | |
| 2.25 m < Road width | Completely illuminated | 5 features | 3 |
| 1.5 m < Road width < 2.25 m | Half illuminated | 3 and 4 features | 2 |
| Road width < 1.5 m | Semi-illuminated | 1 and 2 features | 1 |
| No road | Completely dark | No features | 0 |
| 10. Scores stated by [63] were used. 11. This criterion has been evaluated in relation to the amount of light provided by lighting elements. 12. While evaluating this criterion, the appropriateness of the following characteristics was determinant: (1) Ideal height; (2) Whether being of close ones or not; (3) Ideal waste throw angle; (4) Appropriate capacity; (5) Binbags or vicinity of buckets. | |||
| * 13. Pedestrian Lane Slope | 14. Sidewalk Pavement for Connectivity of Lane to Park | ||
| 0–2% almost flat and 2–6% gentle slope | 4 and 5 features | 3 | |
| 6–12% moderate slope | 3 and 2 features | 2 | |
| 12–20% steep | 1 feature | 1 | |
| 20–30% stiff and 30% and above | No features | 0 | |
| 13. Scores stated by [62] were used. 14. While evaluating this criterion, the convenience of material characteristics was determinant, such as (1) Structural characteristics of the surface material that do not limit pedestrian use; (2) Appropriate joint density and width; (3) Reflection characteristics of the surface (albedo); (4) Nonslip surface characteristics under rain conditions; (5) Sufficiency of road infrastructure (tamped soil, stabilised filling or rubble, etc.). | |||
| Unevaluable Criteria | |||
| Evaluation Criteria and Characteristics USED | Score | ||
| Orientation in park circulation, Ramps (suitable for people with disabilities), Borders, Spatial safety of benches, Maintenance of plants, Maintenance of equipment, Drainage system, Suitable plant selection for facilities, Tree canopy, Orientation and signalling effect with plantation, Visual control with plantation, Wind control with plantation, Locating playground by climatic conditions, Plantation in playgrounds, Sports facilities’ accurate positioning, Suitable plantation in sports facilities, Suitable pavement in sports facilities, Connections of sports facilities with main traffic routes, Presence of Water (artificial lakes, ornamental pools etc.), Presence of Amphitheatre, Presence of toilets, Presence of board, Suitable shelter/pavilion material selection for climate condition, Locating shelter/pavilion by climatic conditions, Suitable bench/bank material selection for climate condition, Suitable materials for trash cans, Presence of lighting, Fountains’ own usage area, Suitable height for fountains, * Presence of crosswalk for park access, * Signalisation for park access, * Pedestrian traffic load, Physical barriers in pedestrian facilities, * Presence of green zone between walkway and driveway, * Presence of other parks and urban green spaces near the park, * Presence of commercial area near the park, * Presence of educational destination near the park, * Presence of religious destination near the park, * Presence of cultural destination near the park, * Parks with landscapes. | |||
| No/Inappropriate/Don’t exist | 0 | ||
| Yes/Appropriate/Exist | 3 | ||
| Unevaluable criteria have been assigned a score of 3 when the criteria are positive; otherwise, they have been assigned a score of 0 when the criteria are negative. | |||
| (*) Limited Improvement Criteria cannot be improved in the conditions listed above due to the increase in population density and unplanned urban settlement (e.g., size of park area, population density, pedestrian traffic load etc.). Improvement Criteria are not dependent on other factors such as urban settlement, population density, location and time to be improved (e.g., tree canopy, maintenance of equipment, suitable pavement etc.). | |||
References
- Wright Wendel, H.E.; Zarger, R.K.; Mihelcic, J.R. Accessibility and usability: Green space preferences, perceptions, and barriers in a rapidly urbanizing city in Latin America. Landsc. Urban Plan. 2012, 107, 272–282. [Google Scholar] [CrossRef]
- Lee, G.; Hong, I. Measuring spatial accessibility in the context of spatial disparity between demand and supply of urban park service. Landsc. Urban Plan. 2013, 119, 85–90. [Google Scholar] [CrossRef]
- La Rosa, D. Accessibility to greenspaces: GIS based indicators for sustainable planning in a dense urban context. Ecol. Indic. 2014, 42, 122–134. [Google Scholar] [CrossRef]
- Mougiakou, E.; Photis, Y.N. Urban Green Space Network Evaluation And Planning: Optimizing Accessibility Based on Connectivity and Raster GIS Analysis. Eur. J. Geogr. 2014, 5, 19–46. [Google Scholar]
- Yao, L.; Liu, J.; Wang, R.; Yin, K.; Han, B. Effective green equivalent—A measure of public green spaces for cities. Ecol. Indic. 2014, 47, 123–127. [Google Scholar] [CrossRef]
- Unal, M.; Uslu, C.; Cilek, A. GIS-Based Accessibility Analysis for Neighbourhood Parks: The Case of Cukurova District. J. Digit. Landsc. Archit. 2016, 1, 46–56. [Google Scholar] [CrossRef]
- Mahon, J.R.; Miller, R.W. Identifying high-value greenspace prior to land development. J. Arboric. 2003, 29, 25–33. [Google Scholar]
- Randall, T.A.; Churchill, C.J.; Baetz, B.W. A GIS-based decision support system for neighbourhood greening. Environ. Plan. B Plan. Des. 2003, 30, 541–563. [Google Scholar] [CrossRef]
- Zhang, L.; Wang, H. Planning an ecological network of Xiamen Island (China) using landscape metrics and network analysis. Landsc. Urban Plan. 2006, 78, 449–456. [Google Scholar] [CrossRef]
- Maimaitiyiming, M.; Ghulam, A.; Tiyip, T.; Pla, F.; Latorre-Carmona, P.; Halik, Ü.; Sawut, M.; Caetano, M. Effects of green space spatial pattern on land surface temperature: Implications for sustainable urban planning and climate change adaptation. ISPRS J. Photogramm. Remote Sens. 2014, 89, 59–66. [Google Scholar] [CrossRef]
- Li, X.; Zhou, W.; Ouyang, Z.; Xu, W.; Zheng, H. Spatial pattern of greenspace affects land surface temperature: Evidence from the heavily urbanized Beijing metropolitan area, China. Landsc. Ecol. 2012, 27, 887–898. [Google Scholar] [CrossRef]
- Barbosa, O.; Tratalos, J.A.; Armsworth, P.R.; Davies, R.G.; Fuller, R.A.; Johnson, P.; Gaston, K.J. Who benefits from access to green space? A case study from Sheffield, UK. Landsc. Urban Plan. 2007, 83, 187–195. [Google Scholar] [CrossRef]
- Ghaemi, P.; Swift, J.; Sister, C.; Wilson, J.P.; Wolch, J. Design and implementation of a web-based platform to support interactive environmental planning. Comput. Environ. Urban Syst. 2009, 33, 482–491. [Google Scholar] [CrossRef]
- Oh, K.; Jeong, S. Assessing the spatial distribution of urban parks using GIS. Landsc. Urban Plan. 2007, 82, 25–32. [Google Scholar] [CrossRef]
- Wolch, J.; Wilson, J.P.; Fehrenbach, J. Parks and Park Funding in Los Angeles: An Equity-Mapping Analysis. Urban Geogr. 2005, 26, 4–35. [Google Scholar] [CrossRef]
- Lwin, K.K.; Murayama, Y. Modelling of urban green space walkability: Eco-friendly walk score calculator. Comput. Environ. Urban Syst. 2011, 35, 408–420. [Google Scholar] [CrossRef]
- Nicholls, S.; Shafer, C.S. Measuring Accessibility and Equity in a Local Park System: The Utility of Geospatial Technologies to Park and Recreation Professionals. J. Park Recreat. Adm. 2001, 19, 102–124. [Google Scholar]
- Moseley, D.; Marzano, M.; Chetcuti, J.; Watts, K. Green networks for people: Application of a functional approach to support the planning and management of greenspace. Landsc. Urban Plan. 2013, 116, 1–12. [Google Scholar] [CrossRef]
- Sander, H.A.; Ghosh, D.; van Riper, D.; Manson, S.M. How do you measure distance in spatial models? An example using open-space valuation. Environ. Plan. B Plan. Des. 2010, 37, 874–894. [Google Scholar] [CrossRef]
- Pham, T.T.H.; Apparicio, P.; Séguin, A.M.; Landry, S.; Gagnon, M. Spatial distribution of vegetation in Montreal: An uneven distribution or environmental inequity? Landsc. Urban Plan. 2012, 107, 214–224. [Google Scholar] [CrossRef]
- Turkish Statistical Institute Address Based Population Registration System (ABPRS). Available online: http://www.turkstat.gov.tr/ (accessed on 26 May 2017).
- Boyacigil, O.; Altunkasa, M.F. A Case Study on Determining Effective Active Green Space Opportunities in Upper Northwest Urban Development Area of Adana. J. Fac. Agric. 2009, 22, 58–67. [Google Scholar]
- Altunkasa, M.F.; Berberoglu, S.; Uslu, C. Assessment of Social Facility Areas in Terms of Urban Life Quality: A Model Proposal for Adana City Considering the Cultural Places, Open and Green Spaces; TUBITAK Project Report; TUBITAK: Adana, Turkey, 2011.
- Ender, E. Studying the Quality and Quantity of Active Green Spaces in Cukurova District in Adana; Cukurova University, Institute of Natural and Applied Sciences: Adana, Turkey, 2011. [Google Scholar]
- Çukurova Government, Departments of Municipal. Cukurova Municipal Parks and Gardens. Available online: http://www.cukurova.bel.tr/Cukurova_Taniyalim/detay.aspx?SectionID=GZ9F5Jy7Wq8FDWOBBHc3yQ%3D%3D&ContentID=GZ9F5Jy7Wq8FDWOBBHc3yQ%3D%3D (accessed on 20 February 2018).
- Gold, S. (Ed.) Recreation Planning and Design; McGraw-Hill: New York, NY, USA, 1980. [Google Scholar]
- Nicholls, S. Measuring the accessibility and equity of public parks: A case study using GIS. Manag. Leis. 2001, 6, 201–219. [Google Scholar] [CrossRef]
- Van Herzele, A.; Wiedeman, T. A Monitoring Tool for the Provision for Accessible and Attractive Green Spaces. Landsc. Urban Plan. 2003, 63, 109–126. [Google Scholar] [CrossRef]
- Miyake, K.K.; Maroko, A.R.; Grady, K.L.; Maantay, J.A.; Arno, P.S. Not Just a Walk in the Park: Methodological Improvements for Determining Environmental Justice Implications of Park Access in New York City for the Promotion of Physical Activity. Cities Environ. 2010, 3, 1–17. [Google Scholar] [CrossRef] [PubMed]
- Yenice, M.S. A spatial sufficiency and accessibility analysis for urban green spaces: A case study for Burdur, Turkey. Turk. J. For. 2012, 13, 41–47. [Google Scholar] [CrossRef]
- Altunkasa, M.F. The Process of Urban Development of Adana and Green Spaces; Adana City Council Environment Working Group: Adana, Turkey, 2004. [Google Scholar]
- Uz, O. Research for Green Spaces in Eskisehir City Center, Using Remote Sensing and Geographical Information Systems; Anadolu University: Eskişehir, Turkey, 2005. [Google Scholar]
- Kellett, A.J.; Rofe, M.W. Creating Active Communities: How Can Open and Public Spaces in Urban and Suburban Environments Support Active Living? University of South Australia: Adelaide, Australia, 2009. [Google Scholar]
- Duncan, D.T.; Aldstadt, J.; Whalen, J.; Melly, S.J.; Gortmaker, S.L. Validation of Walk Score® for Estimating Neighborhood Walkability: An Analysis of Four US Metropolitan Areas. Int. J. Environ. Res. Public Health 2011, 8, 4160–4179. [Google Scholar] [CrossRef] [PubMed]
- Onder, S.; Polat, A.T.; Korucu, S. The evaluation of existing and proposed active green spaces in Konya Selcuklu District, Turkey. Afr. J. Agric. Res. 2011, 6, 738–747. [Google Scholar] [CrossRef]
- Handy, S.; Clifton, K. Evaluating Neighborhood Accessibility: Possibilities and Practicalities. J. Transp. Stat. 2001, 4, 67–78. [Google Scholar]
- Takano, T.; Nakamura, K.; Watanabe, M. Urban residential environments and senior citizens’ longevity in megacity areas: The importance of walkable green spaces. J. Epidemiol. Community Health 2002, 56, 913–918. [Google Scholar] [CrossRef] [PubMed]
- Wu, J.; Plantinga, A.J. The influence of public open space on urban spatial structure. J. Environ. Econ. Manag. 2003, 46, 288–309. [Google Scholar] [CrossRef]
- Jim, C.Y.; Chen, S.S. Comprehensive greenspace planning based on landscape ecology principles in compact Nanjing city, China. Landsc. Urban Plan. 2003, 65, 95–116. [Google Scholar] [CrossRef]
- Shay, E.; Spoon, S.C.; Khattak, A.J. Walkable Environment and Walking Activity; Southeastern Transportation Center, University of Tennessee: Knoxville, TN, USA, 2003. [Google Scholar]
- Stevens, R.D. Walkability around Neighborhood Parks: An Assessment of Four Parks in Springfield; University of Oregon: Eugene, OR, USA, 2005. [Google Scholar]
- Giles-Corti, B.; Broomhall, M.H.; Knuiman, M.; Collins, C.; Douglas, K.; Ng, K.; Lange, A.; Donovan, R.J. Increasing walking: How important is distance to, attractiveness, and size of public open space? Am. J. Prev. Med. 2005, 28, 169–176. [Google Scholar] [CrossRef] [PubMed]
- Herbst, H.; Herbst, V. The development of an evaluation method using a geographic information system to determine the importance of wasteland sites as urban wildlife areas. Landsc. Urban Plan. 2006, 77, 178–195. [Google Scholar] [CrossRef]
- Cerin, E.; Macfarlane, D.J.; Ko, H.H.; Chan, K.C.A. Measuring perceived neighbourhood walkability in Hong Kong. Cities 2007, 24, 209–217. [Google Scholar] [CrossRef]
- Emur, S.; Onsekiz, D. The Importance of Open and Green Areas in the Components of Urban Life Quality—The Analysis of Park Areas in Kayseri/Kocasinan District. J. Grad. Sch. Soc. Sci. 2007, 22, 367–396. [Google Scholar]
- Zhu, X.; Lee, C. Walkability and Safety around Elementary Schools. Economic and Ethnic Disparities. Am. J. Prev. Med. 2008, 34, 282–290. [Google Scholar] [CrossRef] [PubMed]
- Sugiyama, T.; Thompson, C.W. Associations between characteristics of neighbourhood open space and older people’s walking. Urban For. Urban Green. 2008, 7, 41–51. [Google Scholar] [CrossRef]
- Dyck, D.; Deforche, B.; Cardon, G.; De Bourdeaudhuij, I. Neighbourhood walkability and its particular importance for adults with a preference for passive transport. Health Place 2009, 15, 496–504. [Google Scholar] [CrossRef] [PubMed] [Green Version]
- Santana, P.; Santos, R.; Costa, C. Walkable Urban Green Spaces: Health Impact Assessment in Amadora, Portugal. Real Corp 2009, 6, 579–585. [Google Scholar]
- Frank, L.D.; Sallis, J.F.; Saelens, B.E.; Leary, L.; Cain, K.; Conway, T.L.; Hess, P.M. The development of a walkability index: Application to the Neighborhood Quality of Life Study. Br. J. Sports Med. 2010, 44, 924–933. [Google Scholar] [CrossRef] [PubMed]
- Coombes, E.; Jones, A.P.; Hillsdon, M. The relationship of physical activity and overweight to objectively measured green space accessibility and use. Soc. Sci. Med. 2010, 70, 816–822. [Google Scholar] [CrossRef] [PubMed]
- Eminagaoglu, Z.; Yavuz, A. Factors Affecting the Planning and Designing of Urban Green Areas: The Case of Artvin. In Proceedings of the 3rd National Black Sea Forestry Congress, Artvin, Turkey, 20–22 May 2010; pp. 1536–1547. [Google Scholar]
- Schipperijn, J.; Ekholm, O.; Stigsdotter, U.K.; Toftager, M.; Bentsen, P.; Kamper-Jorgensen, F.; Randrup, T.B. Factors influencing the use of green space: Results from a Danish national representative survey. Landsc. Urban Plan. 2010, 95, 130–137. [Google Scholar] [CrossRef]
- Kelly, C.E.; Tight, M.R.; Hodgson, F.C.; Page, M.W. A comparison of three methods for assessing the walkability of the pedestrian environment. J. Transp. Geogr. 2011, 19, 1500–1508. [Google Scholar] [CrossRef]
- Gupta, K.; Kumar, P.; Pathan, S.K.; Sharma, K.P. Urban Neighborhood Green Index—A measure of green spaces in urban areas. Landsc. Urban Plan. 2012, 105, 325–335. [Google Scholar] [CrossRef]
- Moniruzzaman, M.; Páez, A. A model-based approach to select case sites for walkability audits. Health Place 2012, 18, 1323–1334. [Google Scholar] [CrossRef] [PubMed]
- Wey, W.M.; Chiu, Y.H. Assessing the walkability of pedestrian environment under the transit-oriented development. Habitat Int. 2013, 38, 106–118. [Google Scholar] [CrossRef]
- Altunkasa, M.F.; Berberoglu, S.; Uslu, C.; Duymus, H. The effectiveness of urban green spaces and socio-cultural facilities. TeMA J. Land Use Mobil. Environ. 2017, 10, 41–56. [Google Scholar] [CrossRef]
- Erden, T. Emergency Planning in Metropolitan Cities by GIS; Istanbul Technical University, Institute of Natural and Applied Sciences: Istanbul, Turkey, 2001. [Google Scholar]
- Gould, P.R. Spatial Diffusion, Resource Paper No.4; Education Resources Information Center (ERIC): Washington, DC, USA, 1969; 80p.
- Yin, H.; Xu, J. Measuring the Accessibility of Parks: A Case Study in Shanghai, China. In Proceedings of the 6th International Conference on Fuzzy Systems and Knowledge Discovery—Volume 1; FSKD’09; IEEE Press: Piscataway, NJ, USA, 2009; pp. 232–236. [Google Scholar]
- Ersoy, M. Urban Land Use Norms; Middle East Techical University: Ankara, Turkey, 1994. [Google Scholar]
- Harris, C.W.; Dines, N. Time-Saver Standards for Landscape Architecture: Design and Construction Data; McGraw-Hill: New York, NY, USA, 1998. [Google Scholar]
- Uzun, G. (Ed.) Landscape Construction; Cukurova University, Faculty of Agriculture: Adana, Turkey, 1989. [Google Scholar]
Figure 1.
Study area and distribution of urban green spaces (UGS) within the municipality.
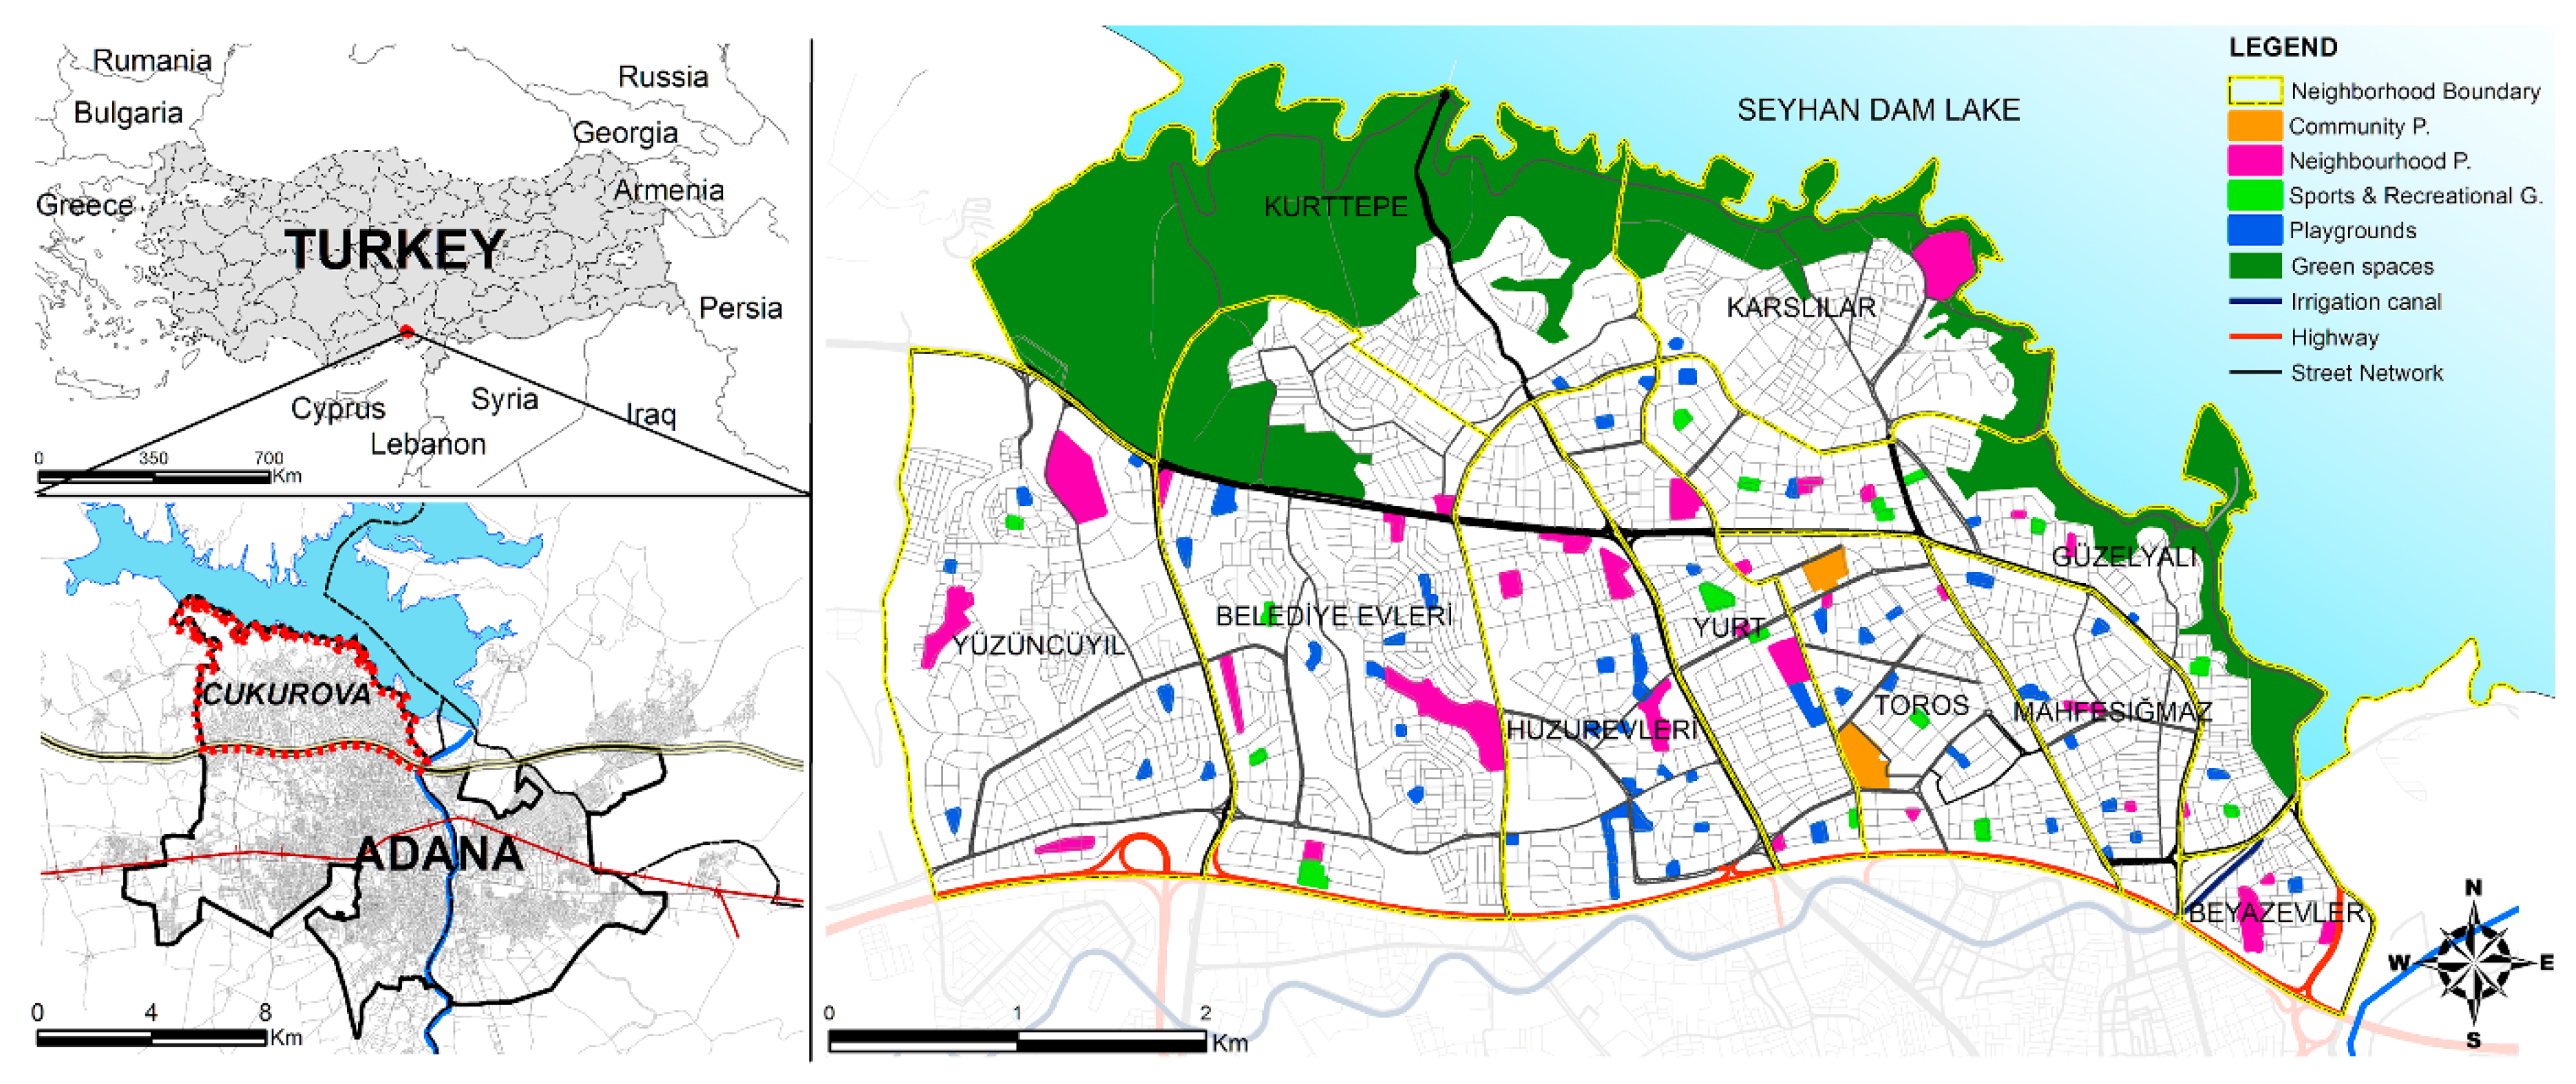
Figure 2.
Flowchart of the study’s methodology.
Figure 3.
An example of arc-nodes topology in the study area.
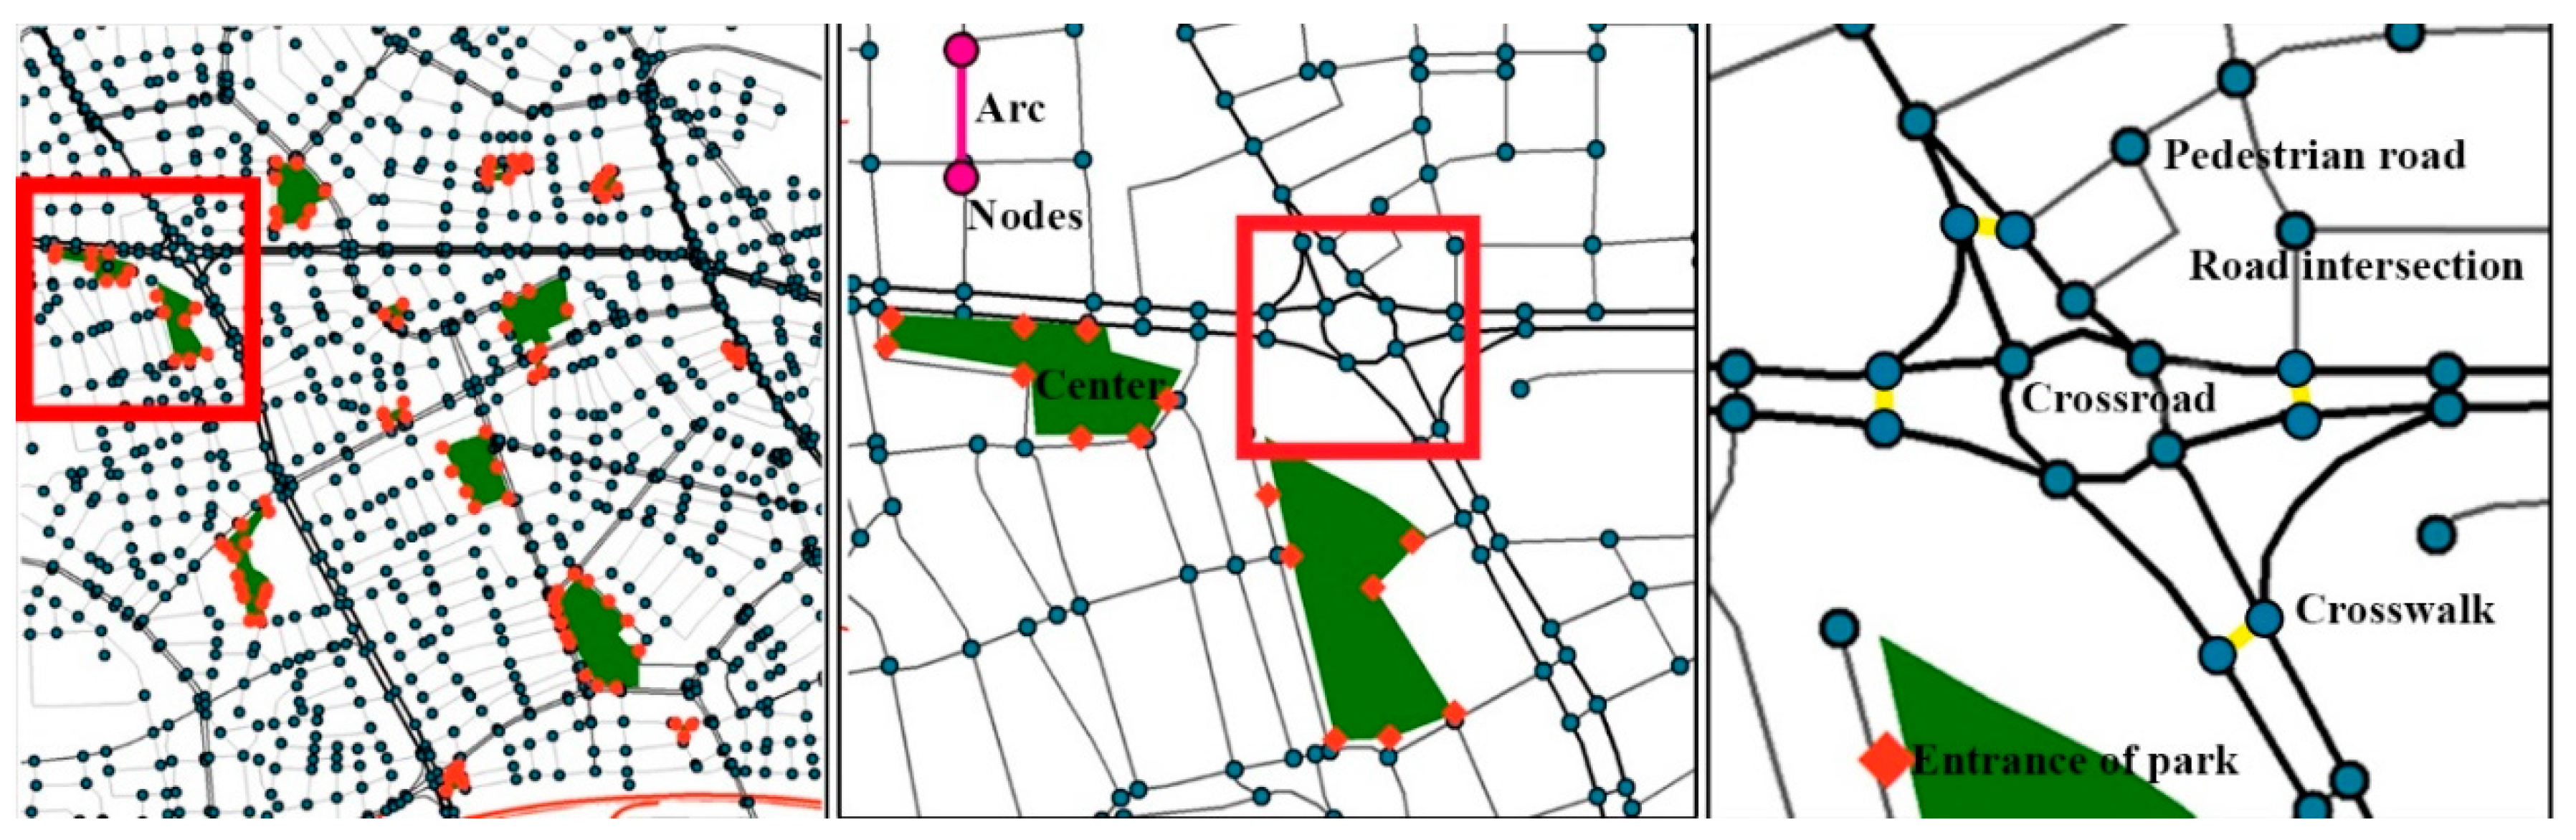
Figure 4.
The comparison of UGS’s service area and optimizing service area: (a) community parks; (b) neighborhood parks; (c) sports and recreation parks; (d) playgrounds.
Figure 4.
The comparison of UGS’s service area and optimizing service area: (a) community parks; (b) neighborhood parks; (c) sports and recreation parks; (d) playgrounds.
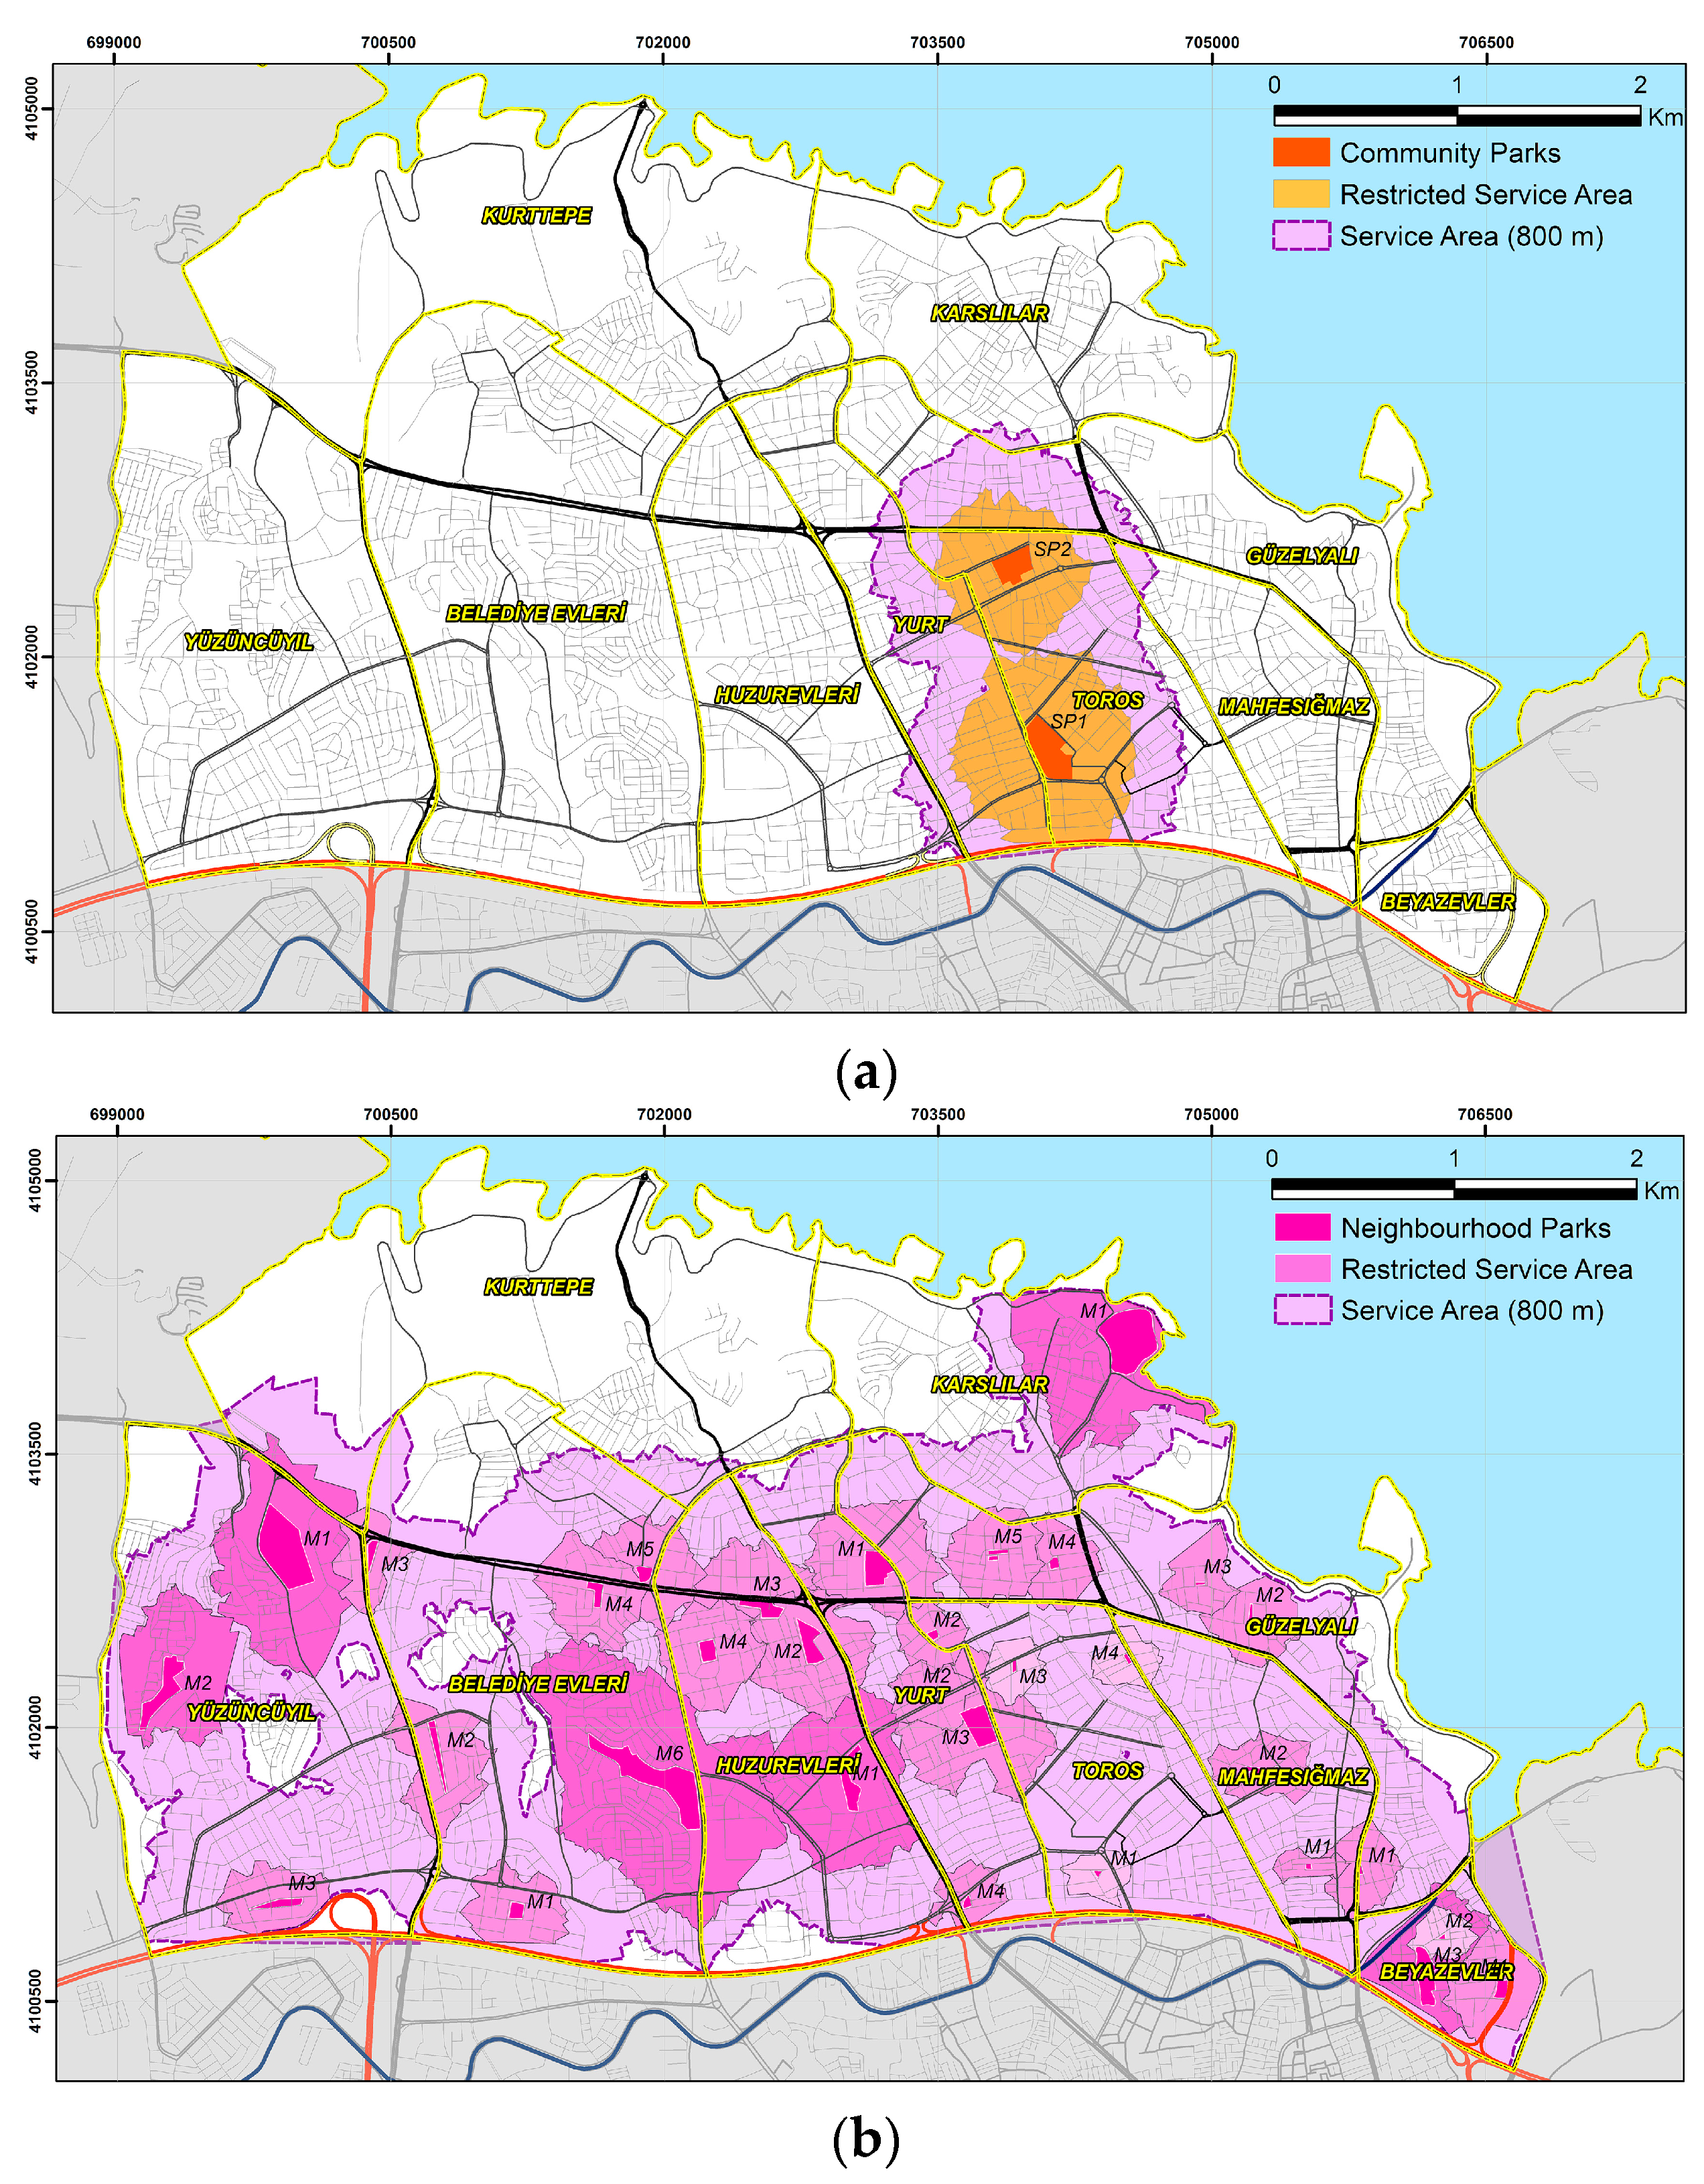
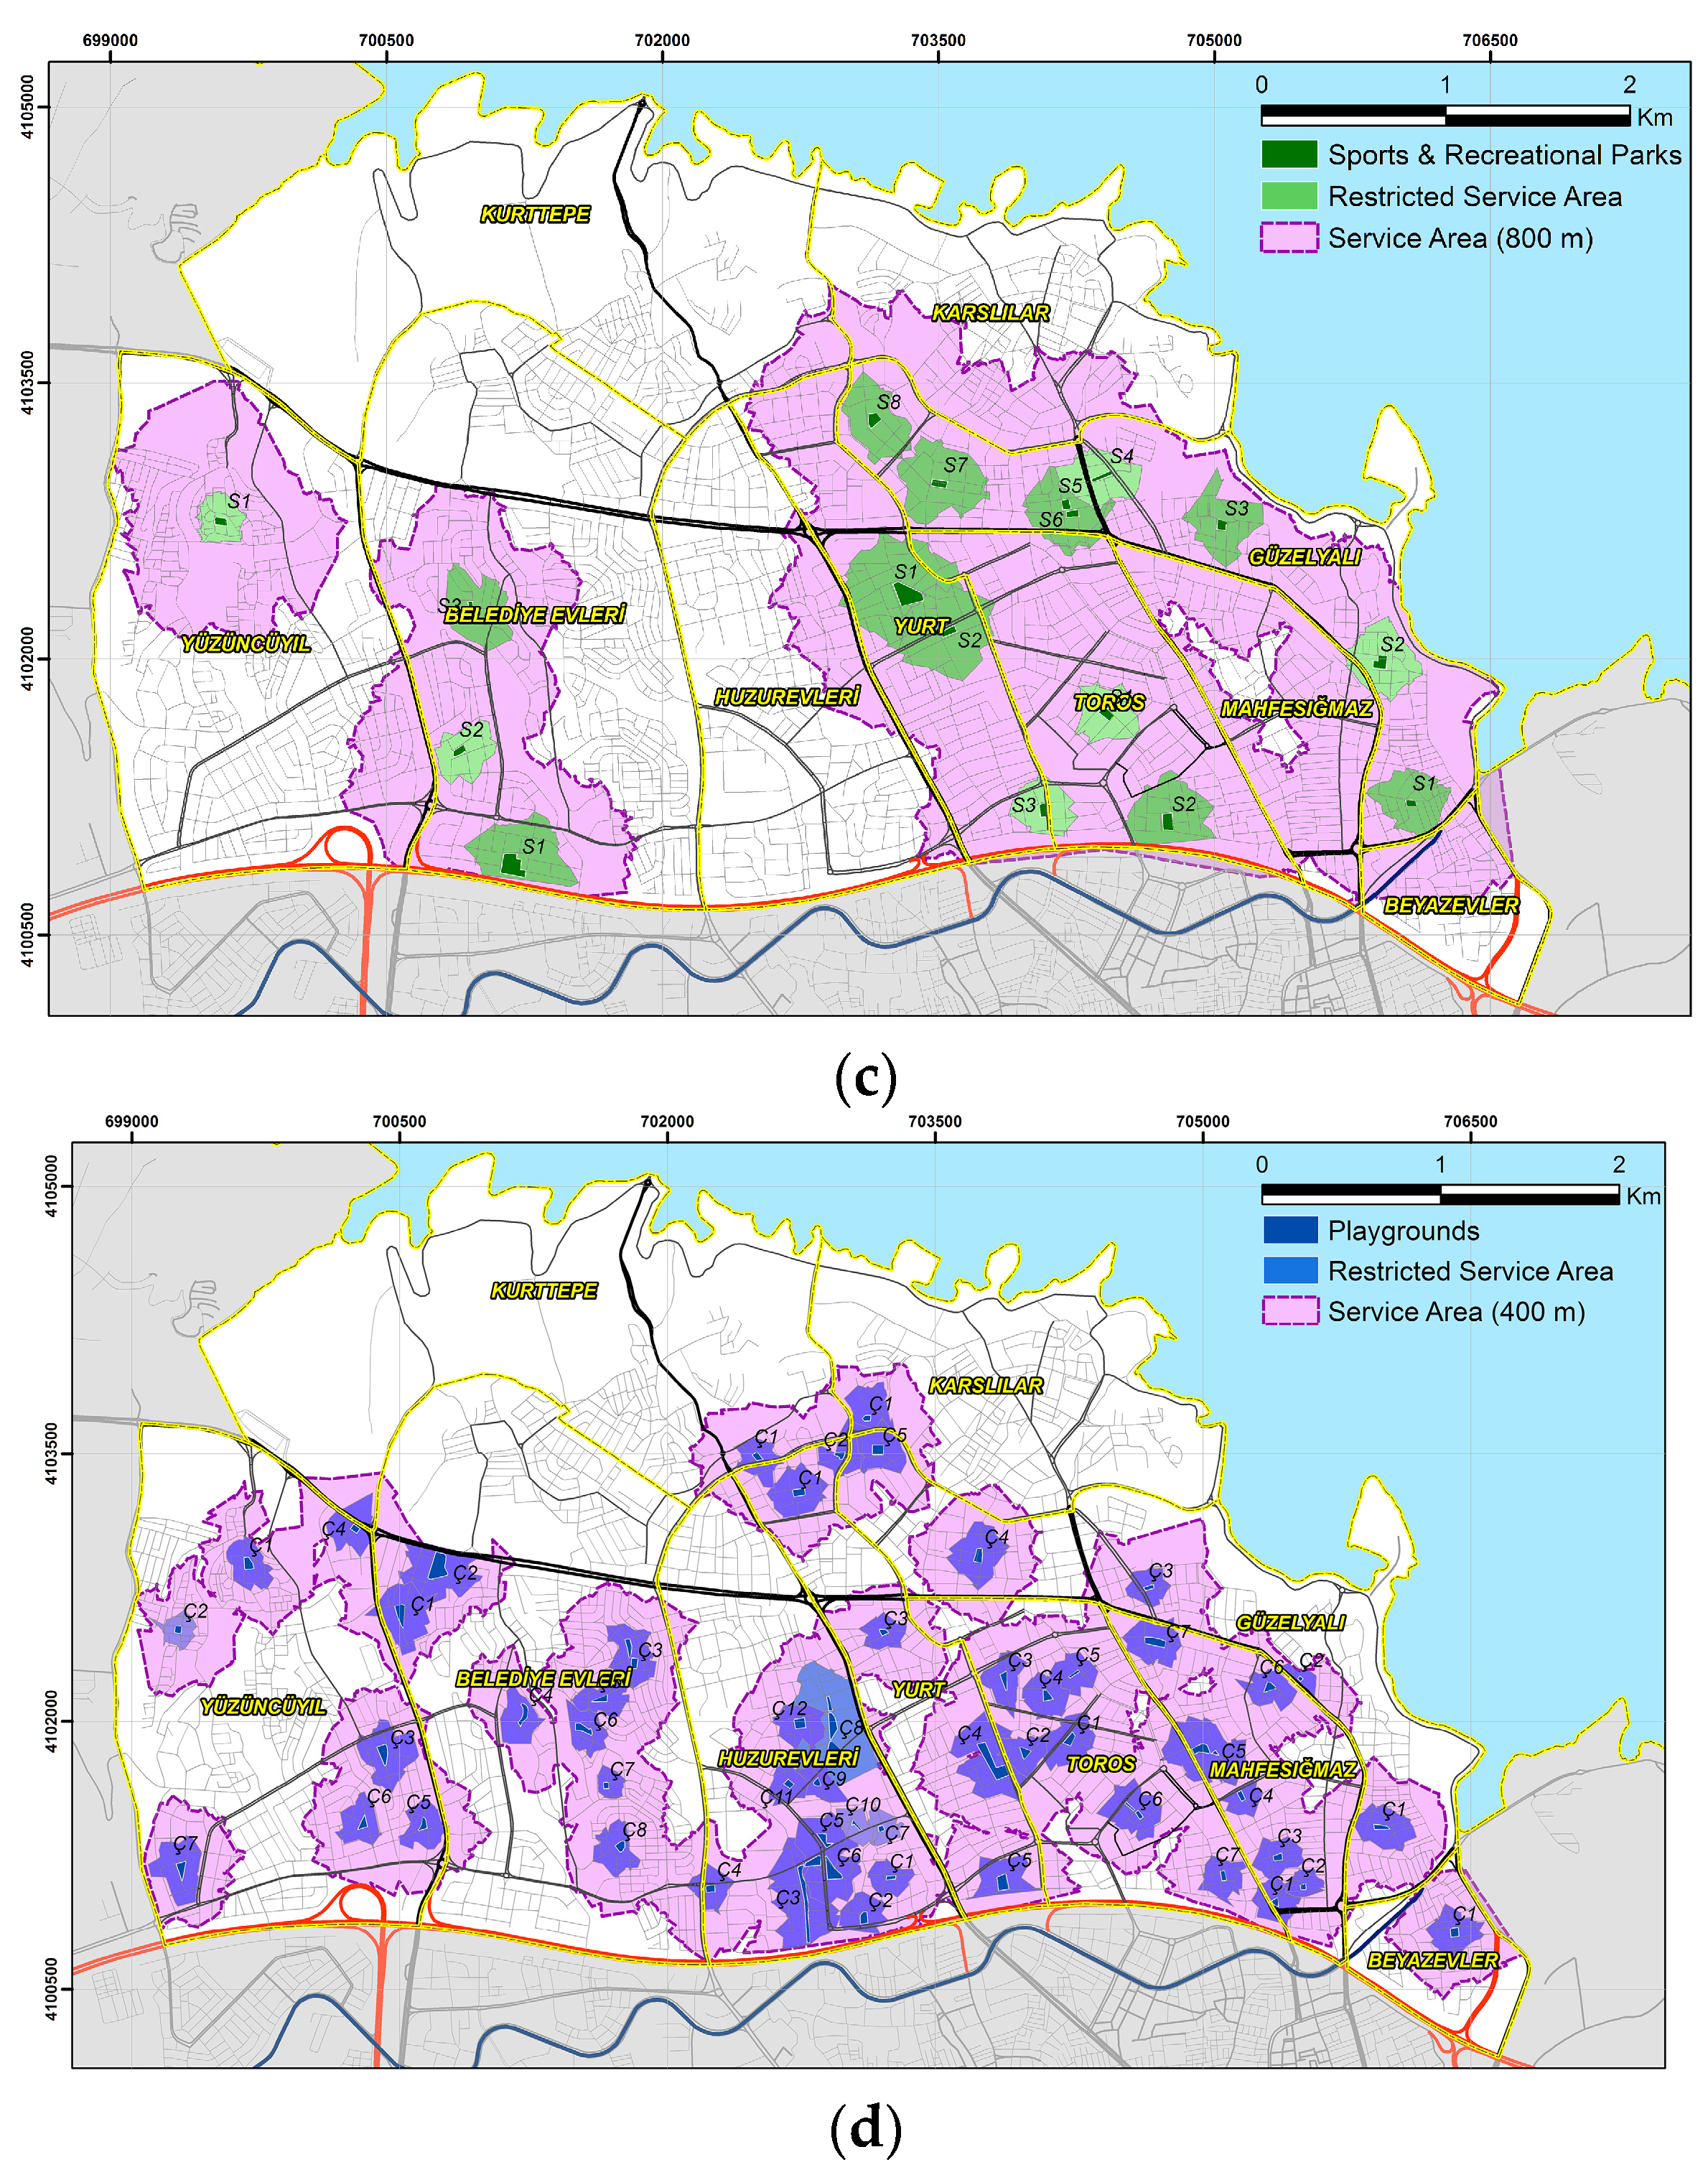
Figure 5.
UGS’s priority levels (a) community parks; (b) neighborhood parks; (c) sports and recreational parks; (d) playgrounds.
Figure 5.
UGS’s priority levels (a) community parks; (b) neighborhood parks; (c) sports and recreational parks; (d) playgrounds.


Figure 6.
Accessibility level of UGS in the Çukurova district.
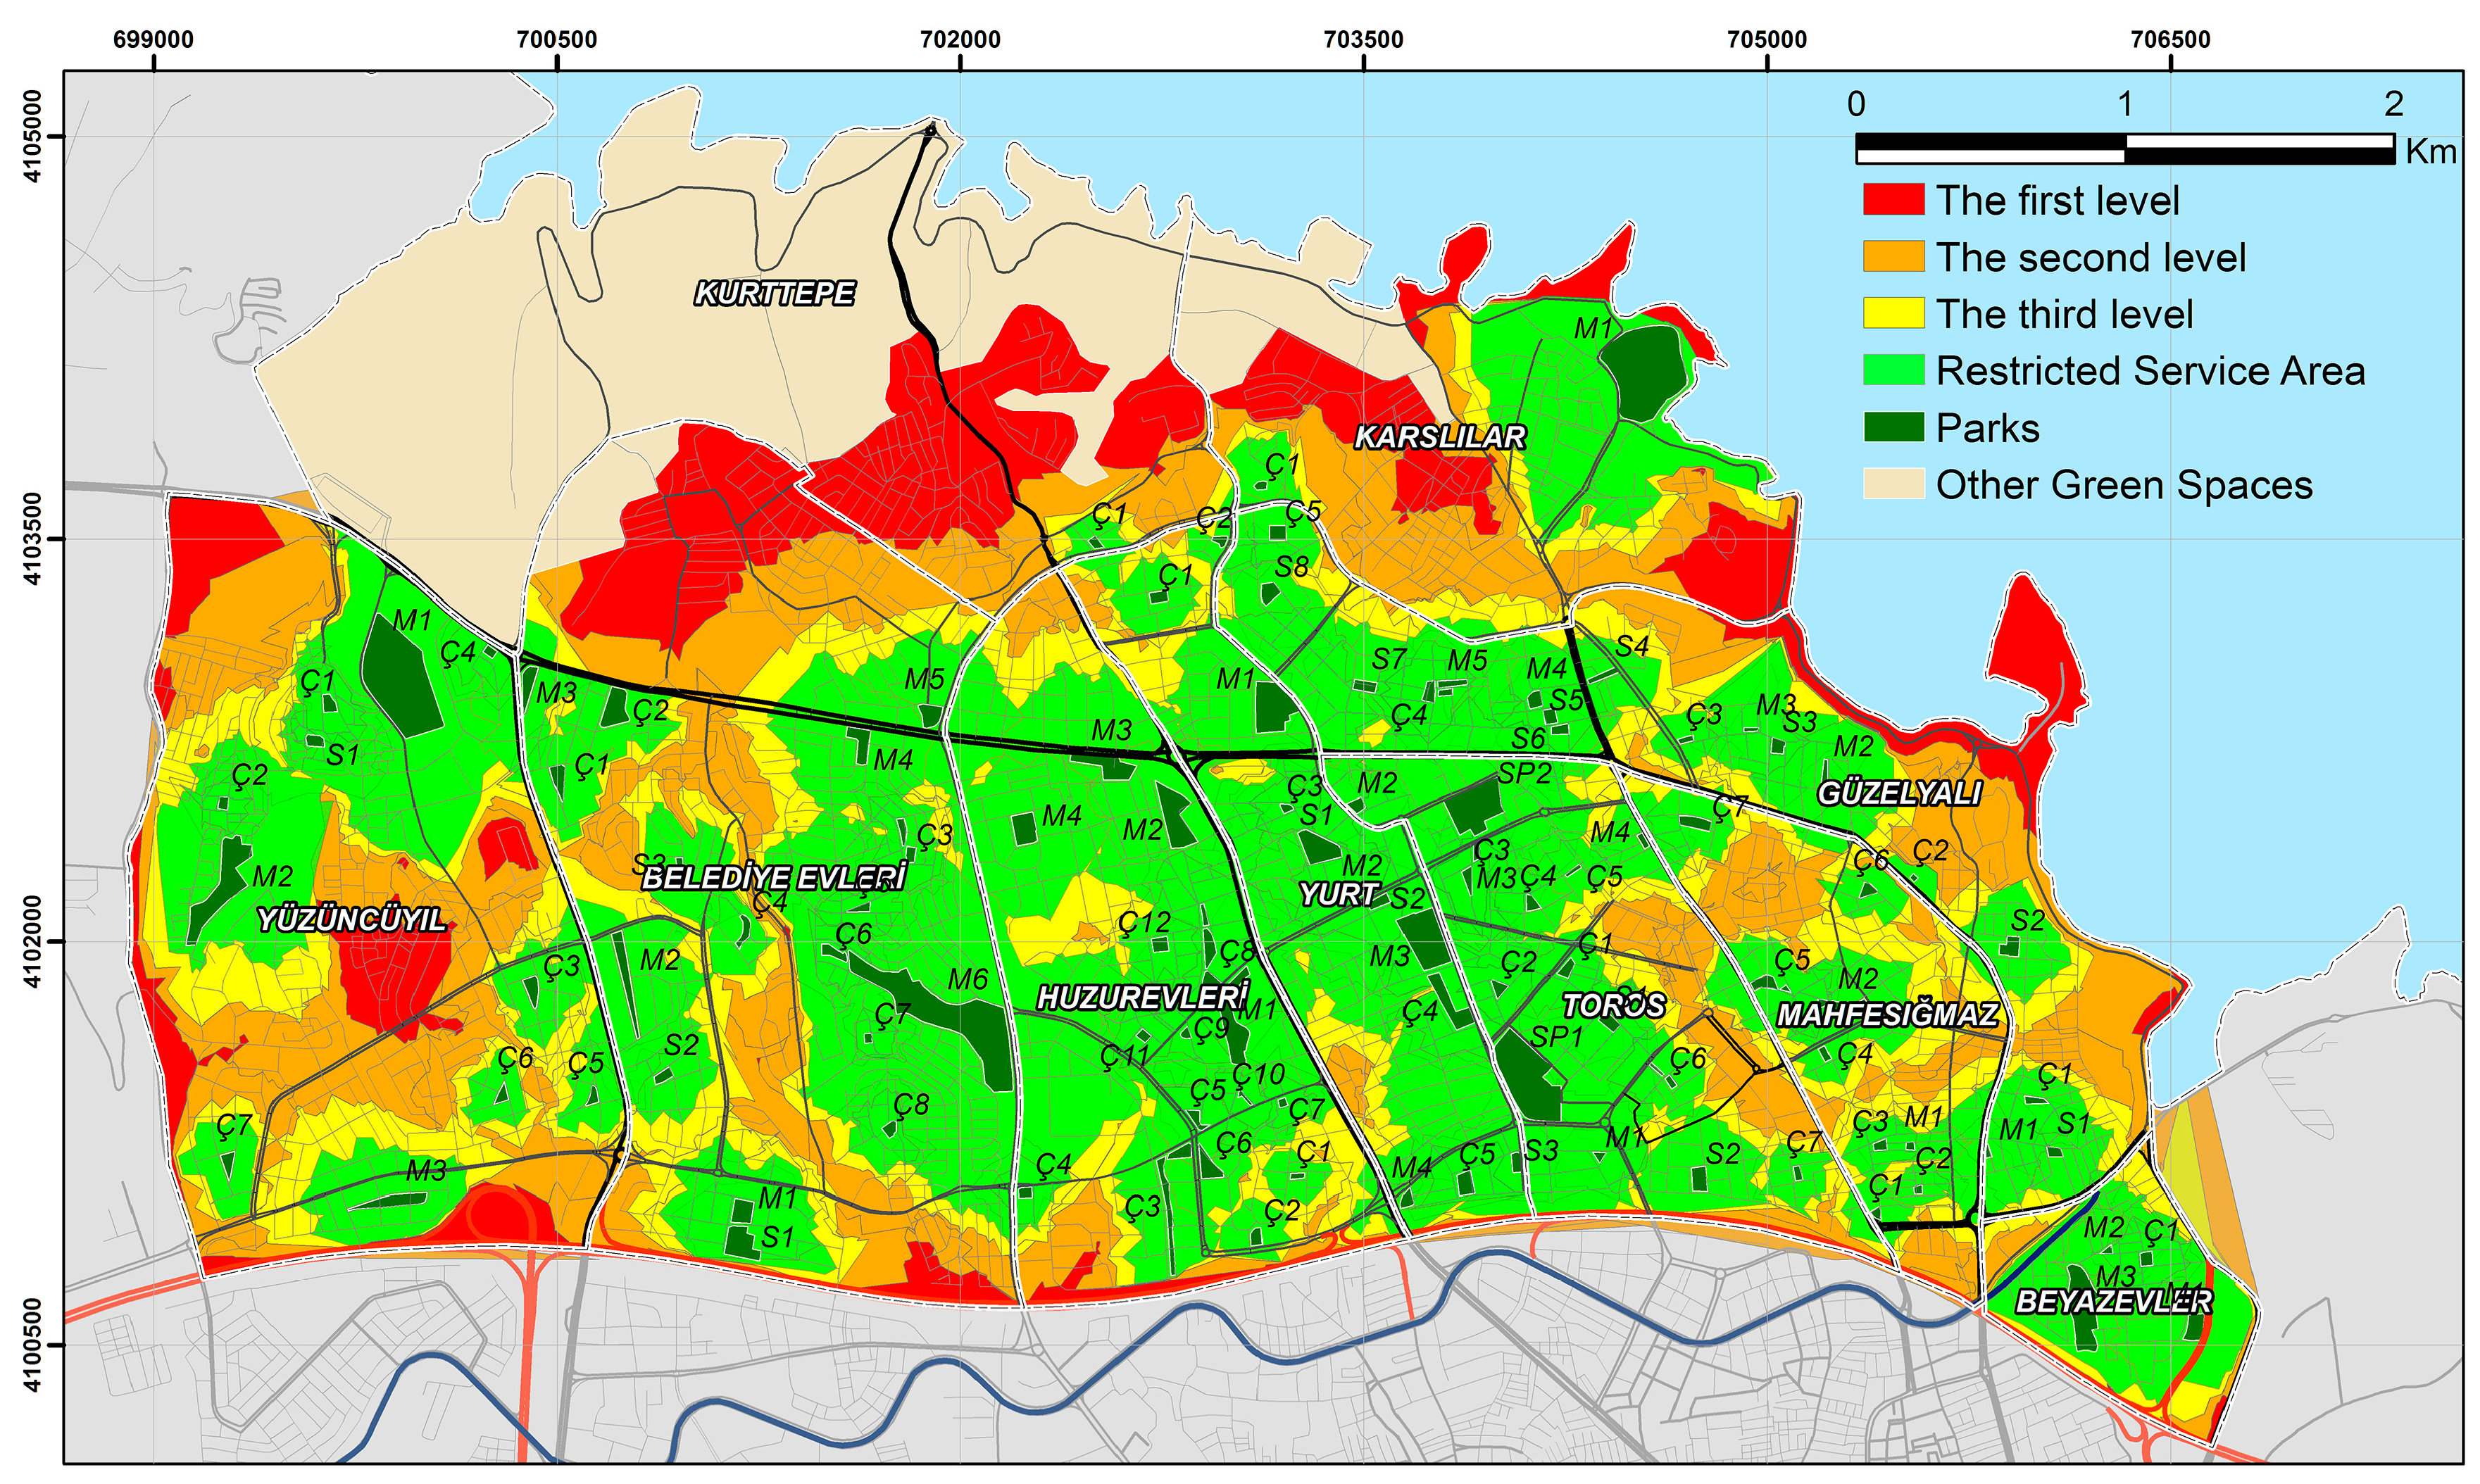
Table 1.
Properties of Çukurova District’s UGS (CP: Community park, NP: Neighborhood park, P: Playground, S: Sports and recreational area).
Table 1.
Properties of Çukurova District’s UGS (CP: Community park, NP: Neighborhood park, P: Playground, S: Sports and recreational area).
| ID | Neighbourhood | Neighbourhood Size | Total Area of UGS | The Number of Parks | Total UGS | Population | |||
|---|---|---|---|---|---|---|---|---|---|
| CP | NP | P | S | ||||||
| 1 | Toros | 205 Ha | 11 Ha | 2 | 4 | 7 | 2 | 15 | 61,804 |
| 2 | Huzurevleri | 133 Ha | 11 Ha | - | 4 | 12 | - | 16 | 56,826 |
| 3 | Belediye Evleri | 392 Ha | 17 Ha | - | 6 | 8 | 3 | 17 | 54,176 |
| 4 | Güzelyalı | 309 Ha | 4 Ha | - | 5 | 5 | 8 | 18 | 43,232 |
| 5 | Yurt | 161 Ha | 9 Ha | - | 4 | 5 | 3 | 12 | 42,526 |
| 6 | Mahfesığmaz | 278 Ha | 2 Ha | - | 2 | 7 | - | 9 | 33,965 |
| 7 | Yüzüncüyıl | 379 Ha | 14 Ha | - | 3 | 7 | 1 | 11 | 27,000 |
| 8 | Beyazevler | 65 Ha | 3 Ha | - | 3 | 1 | - | 4 | 9929 |
| 9 | Kurttepe | 435 Ha | 0.01 Ha | - | 0 | 1 | - | 1 | 5916 |
| 10 | Karslılar | 236 Ha | 8 Ha | - | 1 | 1 | - | 2 | 3785 |
| Total | 2593 Ha | 80 Ha | 2 | 32 | 54 | 17 | 105 | 339,159 | |
Table 2.
The criteria of previous studies about accessibility.
| Previous Studies | [36] | [37] | [38] | [39] | [28] | [40] | [41] | [42] | [43] | [44] | [45] | [46] | [47] | [48] | [49] | [50] | [51] | [52] | [53] | [34] | [24] | [54] | [55] | [56] | [57] |
|---|---|---|---|---|---|---|---|---|---|---|---|---|---|---|---|---|---|---|---|---|---|---|---|---|---|
| Criteria | |||||||||||||||||||||||||
| Area size | |||||||||||||||||||||||||
| Circulation and accessibility | |||||||||||||||||||||||||
| Driveway width | |||||||||||||||||||||||||
| Suitability for disable people | |||||||||||||||||||||||||
| Borders | |||||||||||||||||||||||||
| Maintenance of plants | |||||||||||||||||||||||||
| Maintenance of equipments | |||||||||||||||||||||||||
| Drainage systems | |||||||||||||||||||||||||
| Suitable plant selection for facilities | |||||||||||||||||||||||||
| Tree canopy | |||||||||||||||||||||||||
| Orientation and signaling effect with plants | |||||||||||||||||||||||||
| Visual control with plants | |||||||||||||||||||||||||
| The variety of play equipment | |||||||||||||||||||||||||
| Presence of sports area | |||||||||||||||||||||||||
| Fountain | |||||||||||||||||||||||||
| Lighting | |||||||||||||||||||||||||
| Crosswalk | |||||||||||||||||||||||||
| Signalization | |||||||||||||||||||||||||
| Sidewalk width | |||||||||||||||||||||||||
| Pedestrian lane slope | |||||||||||||||||||||||||
| Pedestrian traffic load | |||||||||||||||||||||||||
| Physical barriers to walking | |||||||||||||||||||||||||
| Sidewalk pavement | |||||||||||||||||||||||||
| Green zone between walkway and driveway | |||||||||||||||||||||||||
| Presence of other parks | |||||||||||||||||||||||||
| Presence of other areas | |||||||||||||||||||||||||
| Place with a landscapes | |||||||||||||||||||||||||
| Population density |
 Existing criteria in the cited study.
Table 3.
Weighted coefficient for each type of UGS.
| Main and Subgroups | Criteria | Urban Green Space | ||||||||
|---|---|---|---|---|---|---|---|---|---|---|
| CP | NP | S | P | |||||||
| Size of Park Area (m2) | 19.43 | 19.43 | 19.43 | 19.43 | ||||||
| Amenities of UGS | Park’ transportation network and security | Circulation and Accessibility | Orientation | 0.73 | 0.73 | 0.73 | 0.73 | |||
| Road width in the park | 0.69 | 0.69 | 0.69 | 0.69 | ||||||
| Suitable equipment for disable people | 0.83 | 0.83 | 0.83 | 0.83 | ||||||
| Ramps | 0.87 | 0.87 | 0.87 | 0.87 | ||||||
| Security | Suitable pavements for facilities | 1.18 | 1.18 | 1.18 | 1.18 | |||||
| Borders | 0.90 | 0.90 | 0.90 | 0.90 | ||||||
| Spatial safety of benches | 1.06 | 1.06 | 1.06 | 1.06 | ||||||
| Maintenance | Plants | 2.06 | 2.06 | 2.06 | 2.06 | |||||
| Equipment | 1.69 | 1.69 | 1.69 | 1.69 | ||||||
| Drainage systems | 1.68 | 1.68 | 1.68 | 1.68 | ||||||
| Plantation | Suitable plant selection for facilities | 1.89 | 1.89 | 1.89 | 1.89 | |||||
| Tree canopy | 1.44 | 1.44 | 1.44 | 1.44 | ||||||
| Orientation and signaling effect | 1.02 | 1.02 | 1.02 | 1.02 | ||||||
| Visual control | 0.98 | 0.98 | 0.98 | 0.98 | ||||||
| Wind control | 0.91 | 0.91 | 0.91 | 0.91 | ||||||
| Facilities | Playgrounds facilities | Size in the neighborhood/community park area (m2) | 0.23 | 0.26 | - | - | ||||
| Suitable material selection for children | 0.23 | 0.27 | - | 0.57 | ||||||
| Locating by climatic conditions | 0.19 | 0.22 | - | 0.48 | ||||||
| Relationships with other facilities | 0.19 | 0.23 | - | 0.48 | ||||||
| Ergonomic characteristic of play equipment | 0.17 | 0.20 | - | 0.44 | ||||||
| The variety of play equipment | 0.17 | 0.19 | - | 0.43 | ||||||
| Plantation | 0.21 | 0.25 | - | 0.52 | ||||||
| Sports facilities | Size in the neighborhood/community park area (m2) | 0.25 | 0.30 | - | - | |||||
| Accurate positioning | 0.21 | 0.25 | 0.69 | - | ||||||
| Plantation | 0.31 | 0.37 | 0.98 | - | ||||||
| Pavement condition | 0.23 | 0.27 | 0.74 | - | ||||||
| Connections with main traffic route | 0.22 | 0.25 | 0.69 | - | ||||||
| Water Feature (artificial lakes, ornamental pool, etc.) | 0.92 | 1.02 | 0.86 | 1.03 | ||||||
| Amphitheatre | 0.50 | - | - | - | ||||||
| Toilet | 0.89 | 0.82 | 0.95 | 0.95 | ||||||
| Equipment | Shelter or pavilion | Suitable materials for climate condition | 0.36 | 0.36 | 0.36 | 0.36 | ||||
| Locating by climatic conditions | 0.32 | 0.32 | 0.32 | 0.32 | ||||||
| Ergonomic characteristic | 0.36 | 0.36 | 0.36 | 0.36 | ||||||
| Benches or banks | Suitable materials for climatic condition | 0.48 | 0.48 | 0.48 | 0.48 | |||||
| Ergonomic characteristic | 0.46 | 0.46 | 0.46 | 0.46 | ||||||
| Trash bins | Suitable materials | 0.38 | 0.38 | 0.38 | 0.38 | |||||
| Ergonomic characteristic | 0.36 | 0.36 | 0.36 | 0.36 | ||||||
| Lighting | Street Lighting | 0.38 | 0.38 | 0.38 | 0.38 | |||||
| Suitability for use at night | 0.44 | 0.44 | 0.44 | 0.44 | ||||||
| Fountain | Own usage area | 0.27 | 0.27 | 0.27 | 0.27 | |||||
| Height | 0.25 | 0.25 | 0.25 | 0.25 | ||||||
| Board | 0.56 | 0.56 | 0.56 | 0.56 | ||||||
| Access and Connectivity | Sidewalk width | 10.04 | 10.04 | 10.04 | 10.04 | |||||
| Pedestrian facilities | Crosswalk | 1.87 | 1.87 | 1.87 | 1.87 | |||||
| Signalization | 1.35 | 1.35 | 1.35 | 1.35 | ||||||
| Street connectivity | 1.57 | 1.57 | 1.57 | 1.57 | ||||||
| Pedestrian lane slope | 1.43 | 1.43 | 1.43 | 1.43 | ||||||
| Pedestrian traffic load | 1.44 | 1.44 | 1.44 | 1.44 | ||||||
| Physical barriers to walking | 1.64 | 1.64 | 1.64 | 1.64 | ||||||
| Sidewalk pavement | 1.61 | 1.61 | 1.61 | 1.61 | ||||||
| Green zone between walkway and driveway | 1.80 | 1.80 | 1.80 | 1.80 | ||||||
| Attractiveness | Presence of other parks | 2.91 | 2.91 | 2.91 | 2.91 | |||||
| Commercial areas | 2.00 | 2.00 | 2.00 | 2.00 | ||||||
| Educational destination | 2.35 | 2.35 | 2.35 | 2.35 | ||||||
| Religious destination (Mosques, churches etc.) | 1.53 | 1.53 | 1.53 | 1.53 | ||||||
| Cultural destination (Cinema, theatre, library etc.) | 3.47 | 3.47 | 3.47 | 3.47 | ||||||
| Place with a landscapes | 4.64 | 4.64 | 4.64 | 4.64 | ||||||
| Population density | 13.49 | 13.49 | 13.49 | 13.49 | ||||||
CP = Community park; NP = Neighborhood park; S = Sports and recreational ground; P = Playground, (-) = Out of assessment.
Table 4.
UGS weighted scores and service areas.
| UGS | Main Weighted Score (Max. Score = 300) | Max. Weighted Score | Min. Weighted Score | Max. Service Area (m) | Min. Service Area (m) |
|---|---|---|---|---|---|
| Community Park (800 m) | 16,682 | 17,585 | 15,779 | 46,894 | 42,078 |
| Neighbourhood Park (800 m) | 12,109 | 21,468 | 6595 | 57,248 | 17,586 |
| Sports and Recreational Ground (800 m) | 8327 | 12,864 | 5304 | 34,317 | 14,144 |
| Playground (400 m) | 9837 | 16,064 | 5341 | 21,419 | 7121 |
Table 5.
The increased percentage values of the UGS weighted scores and optimum service areas.
| UGS | The Min. Increases of WS | The Main Increases of WS | The Max. Increases of WS | The Number of Parks | Total | |||||
|---|---|---|---|---|---|---|---|---|---|---|
| <50% | 50–40% | 40–30% | 30–20% | 20–10% | 10–0% | |||||
| Community Park | 13.35% | 13.56% | 13.77% | 0 | 0 | 0 | 0 | 2 | 0 | 2 |
| Neighbourhood Park | 11.21% | 33.45% | 49.18% | 0 | 9 | 15 | 5 | 3 | 0 | 32 |
| Sports and Recreational Ground | 15.76% | 36.23% | 54.19% | 1 | 5 | 8 | 2 | 1 | 0 | 17 |
| Playground | 15.07% | 32.53% | 55.34% | 1 | 4 | 32 | 16 | 1 | 0 | 54 |
| TOTAL | 2 | 18 | 55 | 23 | 7 | 0 | 105 | |||
Table 6.
Priority level of UGS.
| UGS | Parks Area (%) | Optimum Service Area (%) | 3rd Level (%) | 2nd Level (%) | 1st Level (%) |
|---|---|---|---|---|---|
| Community Park | 0.3 | 4.9 | 5.5 | 6.2 | 83.1 |
| Neighborhood Parks | 1.9 | 29.6 | 15.1 | 24.6 | 28.8 |
| Sports and Recreational Parks | 0.3 | 7.1 | 6.8 | 29.7 | 56.1 |
| Playground | 0.6 | 10.9 | 6.6 | 24.6 | 57.3 |
| Total service area | 3 | 41 | 14 | 19 | 24 |
© 2018 by the authors. Licensee MDPI, Basel, Switzerland. This article is an open access article distributed under the terms and conditions of the Creative Commons Attribution (CC BY) license (http://creativecommons.org/licenses/by/4.0/).
Share and Cite
MDPI and ACS Style
Unal, M.; Uslu, C. Evaluating and Optimizing Urban Green Spaces for Compact Urban Areas: Cukurova District in Adana, Turkey. ISPRS Int. J. Geo-Inf. 2018, 7, 70. https://doi.org/10.3390/ijgi7020070
AMA Style
Unal M, Uslu C. Evaluating and Optimizing Urban Green Spaces for Compact Urban Areas: Cukurova District in Adana, Turkey. ISPRS International Journal of Geo-Information. 2018; 7(2):70. https://doi.org/10.3390/ijgi7020070
Chicago/Turabian StyleUnal, Muge, and Cengiz Uslu. 2018. "Evaluating and Optimizing Urban Green Spaces for Compact Urban Areas: Cukurova District in Adana, Turkey" ISPRS International Journal of Geo-Information 7, no. 2: 70. https://doi.org/10.3390/ijgi7020070
Note that from the first issue of 2016, this journal uses article numbers instead of page numbers. See further details here.