1. Introduction
Land is the essential limited natural resource. It is an income source and, therefore, interesting to the individual and the state. Land has been increasingly intensively used and people’s relationship with the land is becoming more complex. To use land more efficiently and sustainably [
1], its use must be carefully and efficiently governed [
2,
3].
As the result of inappropriate land policy in Croatian territory, agricultural holdings are extremely fragmented [
4,
5]. This can be resolved using a land consolidation procedure, which is the agrarian-technical operation which aims to group and collect the segmented and fragmented holdings into one or more rounded whole in order to achieve a more rational agricultural production [
6,
7]. Land consolidation (LC) is a comprehensive procedure that requires careful planning in order to better utilise rural areas [
8,
9,
10]. Modern approaches moved its primary (single) purpose from agricultural sector into the environmental and recreational sectors, creating multi-purpose land consolidation—LC [
11]. Comprehensive LC [
8] includes re-allocation of parcels together with a broad range of other measures to promote rural development.
In Croatian territory, LC was carried out in the past, but for a long time there were no such projects [
6]. As the needs for LC are greater than the financial possibilities, the start of LC procedures on a national level requires preparatory activities to determine the priority areas; i.e., areas for which it is assumed that redistribution of land is most needed and there are certain prerequisites for successful agricultural production, together with the interest from people and the state.
The determination of priority areas can be accomplished by using various spatial and other factors and indicators [
12,
13,
14,
15,
16] from which suitability can be determined using different methodologies [
12,
17,
18]. The process of the determination of the mentioned indicators is automatized [
19,
20] using spatial analyses and connected procedures or assessed by interested parties using collaborative geodesign [
21]. Some of the results can also be used for the LC project’s mass property valuation [
22] or to measure LC participants’ satisfaction [
23] and consolidation effectiveness [
24]. However, finding the optimal solution must include some cost-benefit considerations and fit-to-purpose approach [
25]. Multi-criteria analyses are commonly used as a stakeholder/decision-maker tool for the selection of optimal solution scenario, using possibly conflicting indicators and measures [
26,
27] and a multi-objective optimization algorithm [
28]. Weighting of individual indicators has the greatest influence on the final solution and must be done with particular care. Various papers consider the use of multi-criteria analyses (MCA) in the preparation phase of different land consolidation or re-allocation projects, using different indicators [
29,
30,
31,
32,
33,
34,
35] and approaches [
36]. The mentioned methods could be used to identify optimal selection of administrative regions or to help make decision on parcel level [
31]. Some of the conclusions are that it is not possible to select one method as superior to the others and it is advisable to use more than one method [
37].
In this work, different MCAs (MSW, PROMETHEE I and II, and TOPSIS) using official land and other registers’ spatial datasets were used to determine priority areas through the determination of spatial units’ ranking according to a land consolidation suitability index. All the possibly conflicting criteria, and their influences, described using quantitative indicators were modelled for suitability ranking of the whole Croatian territory according to the chosen spatial unit. Different types of multi-criteria analyses, based on spatial data characteristics, have proven to be effective to help make decisions [
38,
39,
40,
41] and are used as a basis of decision-support systems in the processes of LC [
42] or other processes based on spatial data [
43]. In the following sections, the chosen methodology has been explained. It includes the review and selection of official land register datasets from which chosen indicators can be quantified and determined. The last section contains results, together with some concluding remarks.
2. Land Development on Croatian Territory
In the Croatian areas, the first consolidation of the feudal estates emerged in the late 17th century as simple land consolidation (“land arondation”). Feudal lords snatching land from the peasants and the lower nobility implemented this grouping: this continued into the 18th century. Karl VI prohibited this kind of enlargement of feudal arable land, which was followed by a series of similar interventions made by Empress Maria Theresa. An urbarium (comprehensive register of farms) was made for three counties in 1756 and by 1780 for an additional three counties. These registers regulated land distribution among individual peasants’ families [
6].
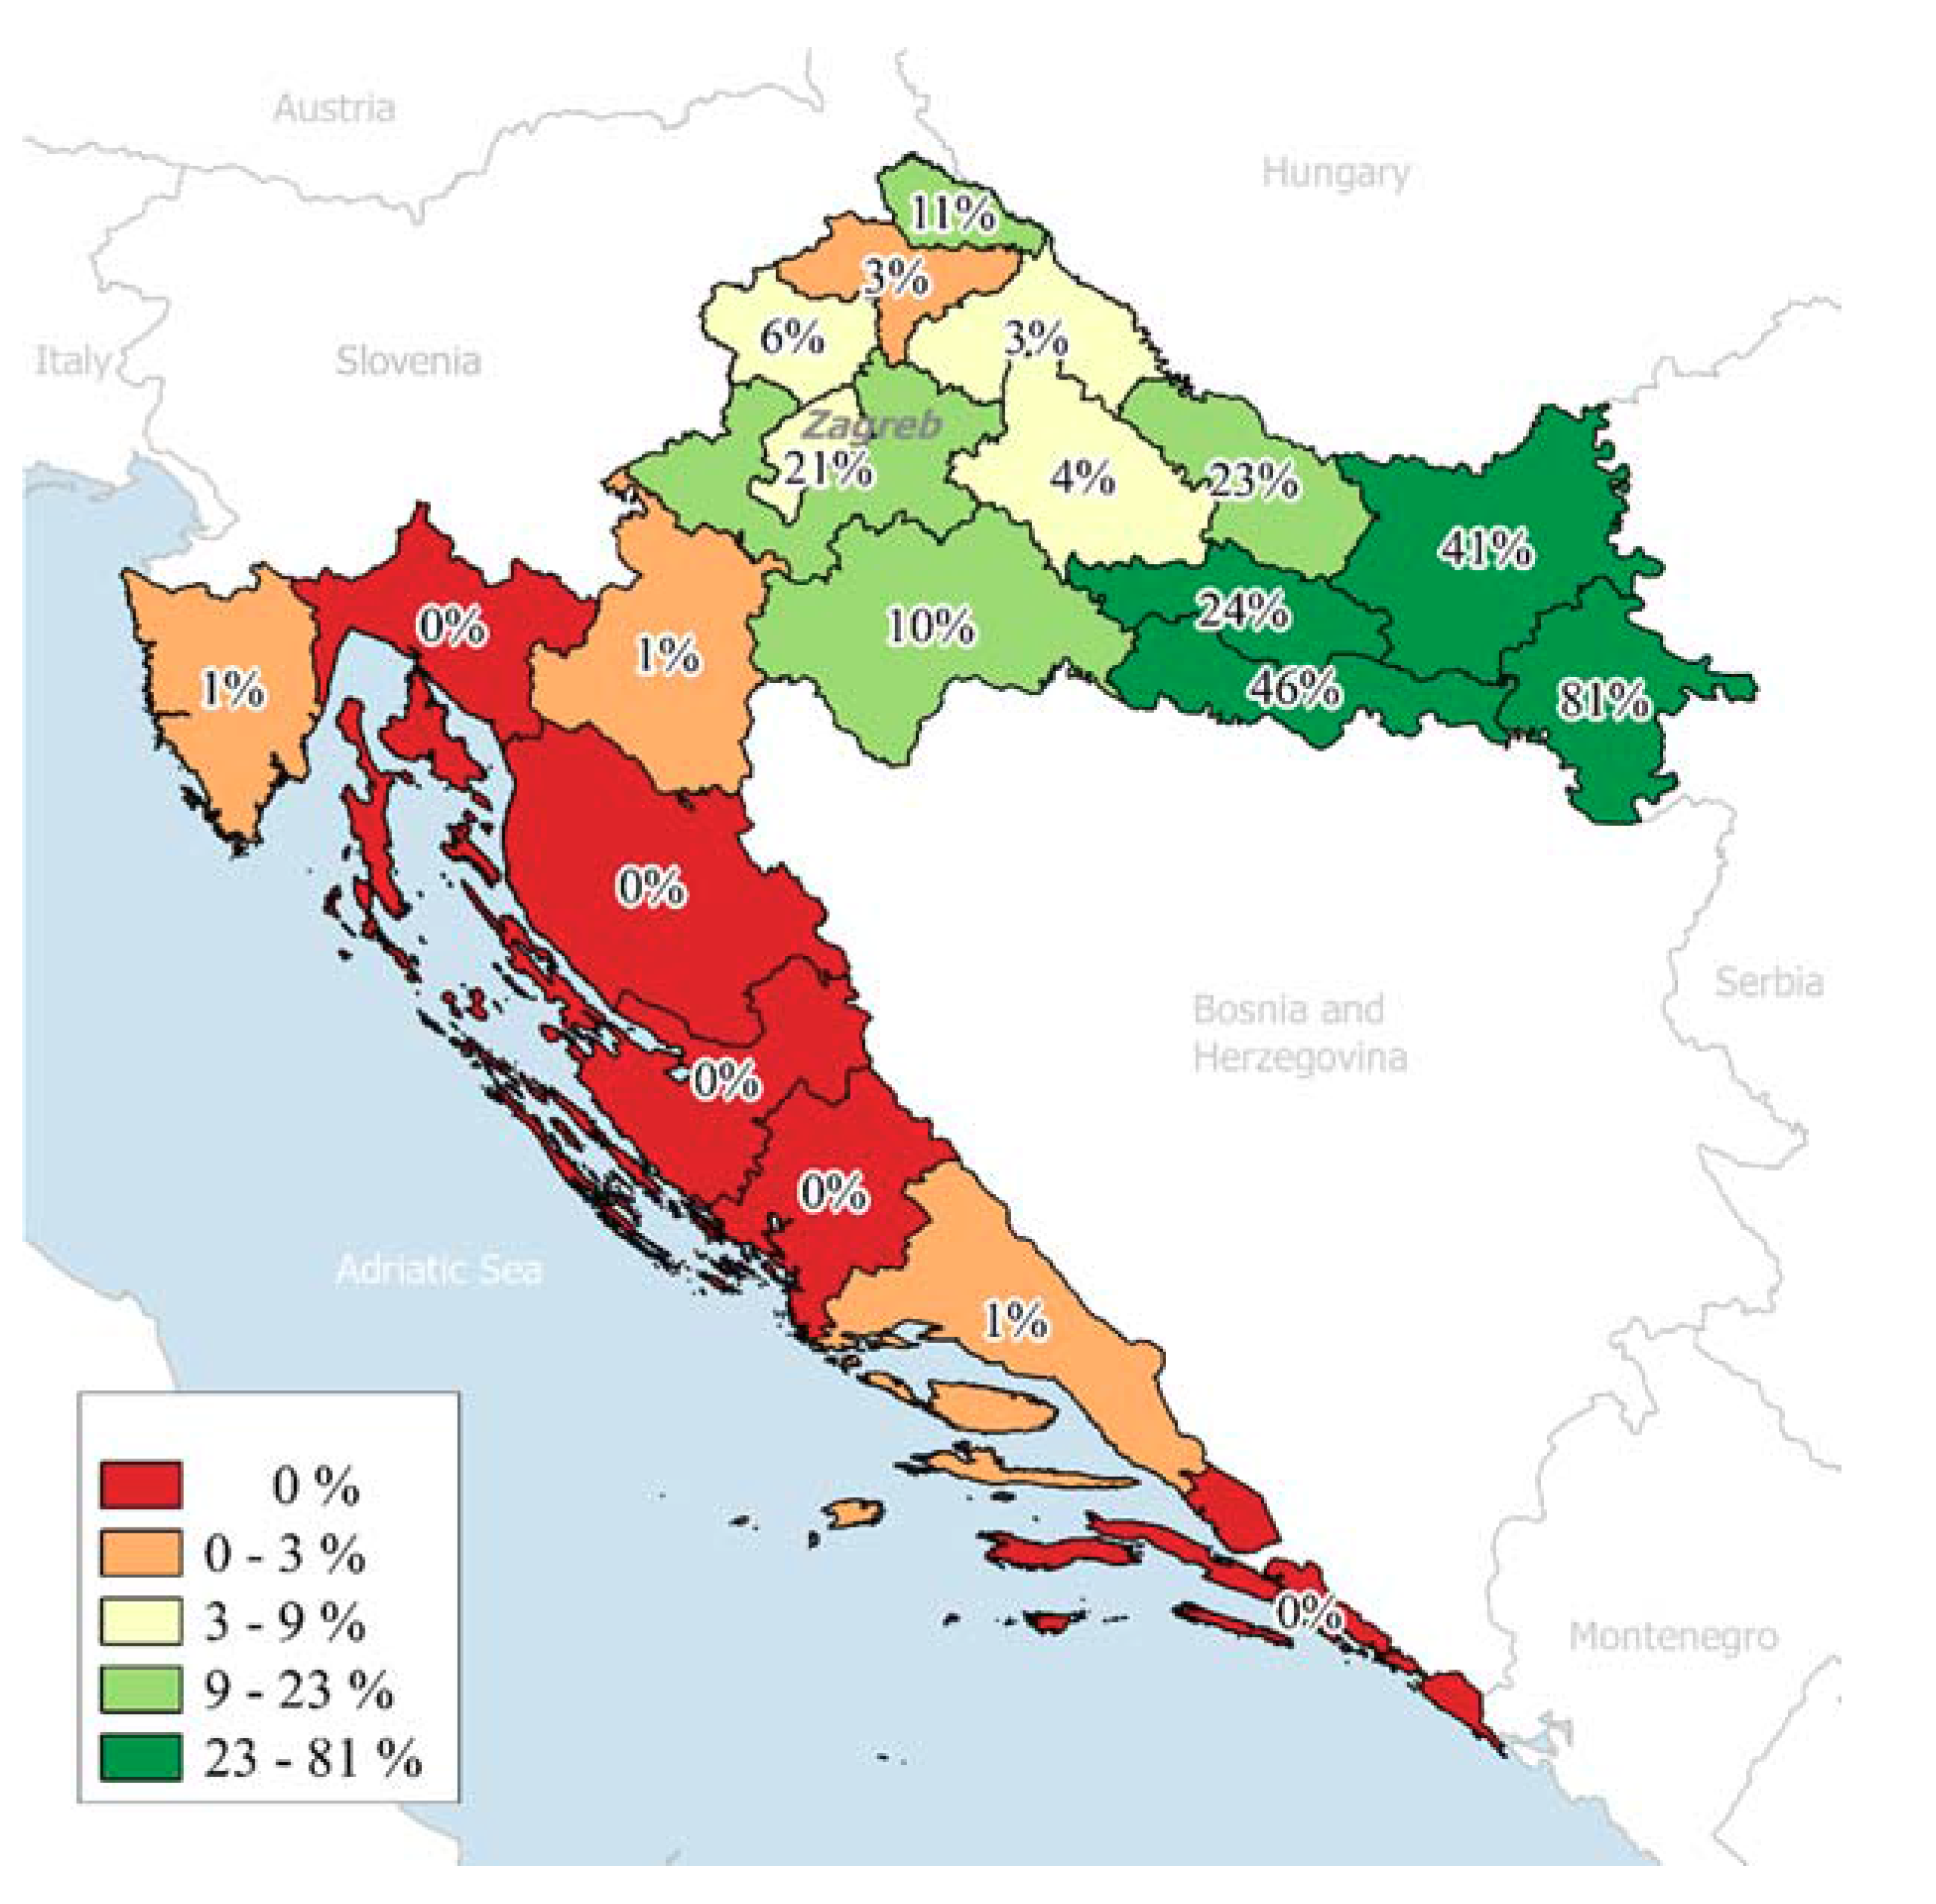
From 1956–1980, land consolidation was performed on more than 650,000 hectares in 420 consolidation boulders. Most of the land consolidation works (
Figure 1) refer to the area of Eastern Slavonija and Baranja (around 60% of the total).
Land consolidation was typically covering the whole cadastral municipality undeveloped area with the possibility of the inclusion of neighbouring municipalities’ parts. A land consolidation committee of 4 to 12 members was created as an advisory body. Half of the members were elected by the participants and the other half were nominated by the land consolidation authorities, from the ranks of small, medium, and large landowners. A professional expert conducted land valuation as a land capability evaluation.
3. Problem Definition
The basic problem and the reason why it is necessary to rank and determine priority areas is the fact that the needs for LC are greater than the financial possibilities. The use of MCA can be of great help to decision makers—DM in the process of priorities definition. However, a choice of indicators can greatly determine the ranking results: therefore, they need to be carefully selected and determined in a way to present the real state.
Ranking of spatial units was based on official, currently-available land and other connected registers. Datasets were analysed to check whether they could be used in automatized processes of indicators determination. The aim of this analysis is to identify available official registers’ datasets and to suggest which would be most suitable for the determination of measures and indicators.
3.1. Available Data Sources
Analysis identified the following necessary data sources:
Register of Spatial Units (Croatian abbrev: RPJ);
Real Property Registration and Cadastre Joint Information System (JIS);
System for Registration of Agricultural Parcels (LPIS, Croatian abbrev: ARKOD);
Physical Planning Information System (Croatian abbrev: ISPU); and
Information system for the disposal of state agricultural land.
3.2. Current Situation of Identified LAS Datasets
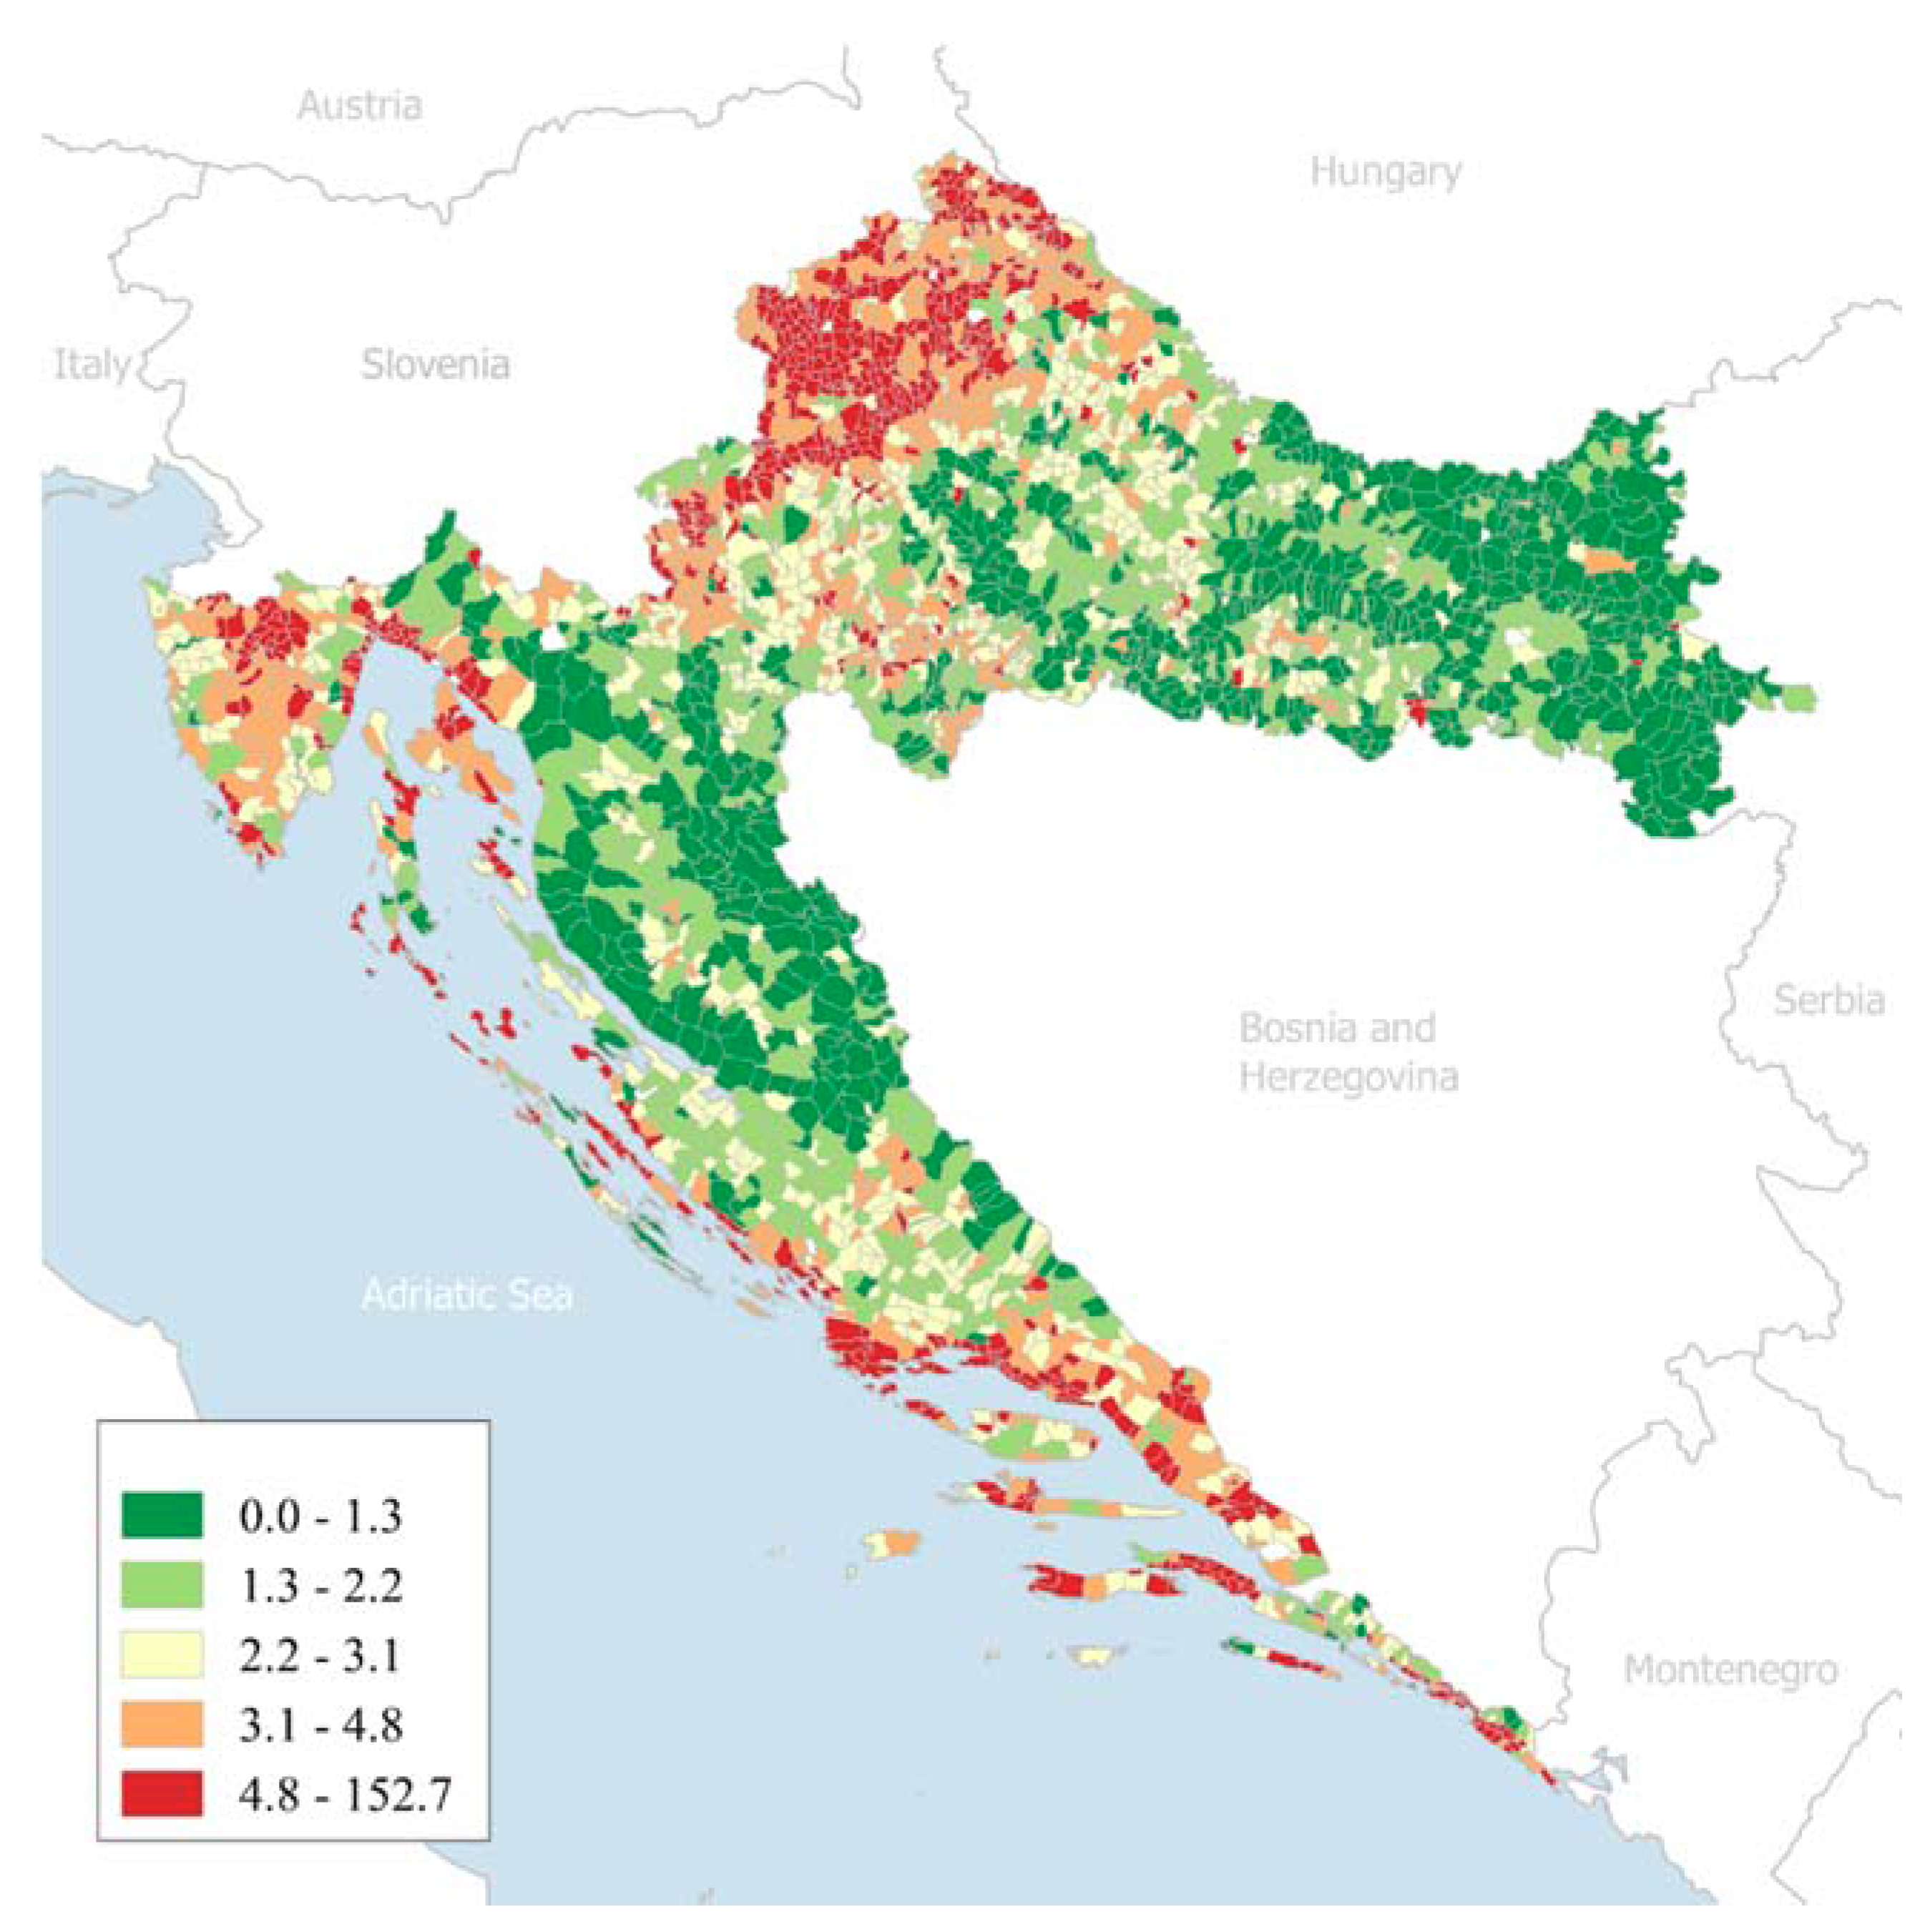
Croatia has approximately 14 million cadastral parcels and the total land area is 56,594 km
2. Cadastral parcels are heavily fragmented (
Figure 2). From the figure it is visible that average number of land parcels per hectare is relatively high. The number of land parcels per hectare analysis was made using cadastral municipality as base unit, so each polygon represents one cadastral municipality. Additionally, many of these parcels’ records and ownership relations do not correspond to the situation on the field. Land consolidation is impossible to plan and to implement without a good, up-to-date land administration system and other spatial registers’ data.
3.2.1. Register of Spatial Units (Croatian Abbrev: RPJ)
The register of Spatial Units contains various types: administrative units, cadastral units, statistical units, etc. For each unit type, there is a registered boundary and some connected attributed data.
This dataset was used for the purposes of spatial data aggregation, according to the chosen spatial unit. Some of the necessary indicators were referenced to local self-government units (Eurostat: LAU-2), but most of them are aggregated based on boundaries of cadastral municipality units.
3.2.2. Real Property Registration and Cadastre Joint Information System (JIS)
The total agricultural land is registered in the cadastre. However, many years of a lack of maintenance, together with inappropriate classification, makes the use of this data questionable.
The Real Property Registration and Cadastre Joint Information System (JIS) is a unified database and application for keeping and maintaining the Land Book and cadastral data. Jurisdiction over JIS is divided between two institutions (the State Geodetic Administration and the Ministry of Justice) through a steering committee that includes members from both institutions.
At the time ranking was made, an available cadastral dataset included the total of 14,140,533 land parcels, divided into 3370 cadastral municipalities. Although JIS currently contains the complete dataset for the whole territory of the Republic of Croatia, at the time ranking was made, not all the data was technically accessible. Due to the technical inability to access all the cadastral parcels together, with relation to persons (landholder/owner), this dataset could not be used in the determination of statistical landholdings/ownership fragmentation indicators.
3.2.3. System for Registration of Agricultural Parcels (LPIS, Croatian Abbrev: ARKOD)
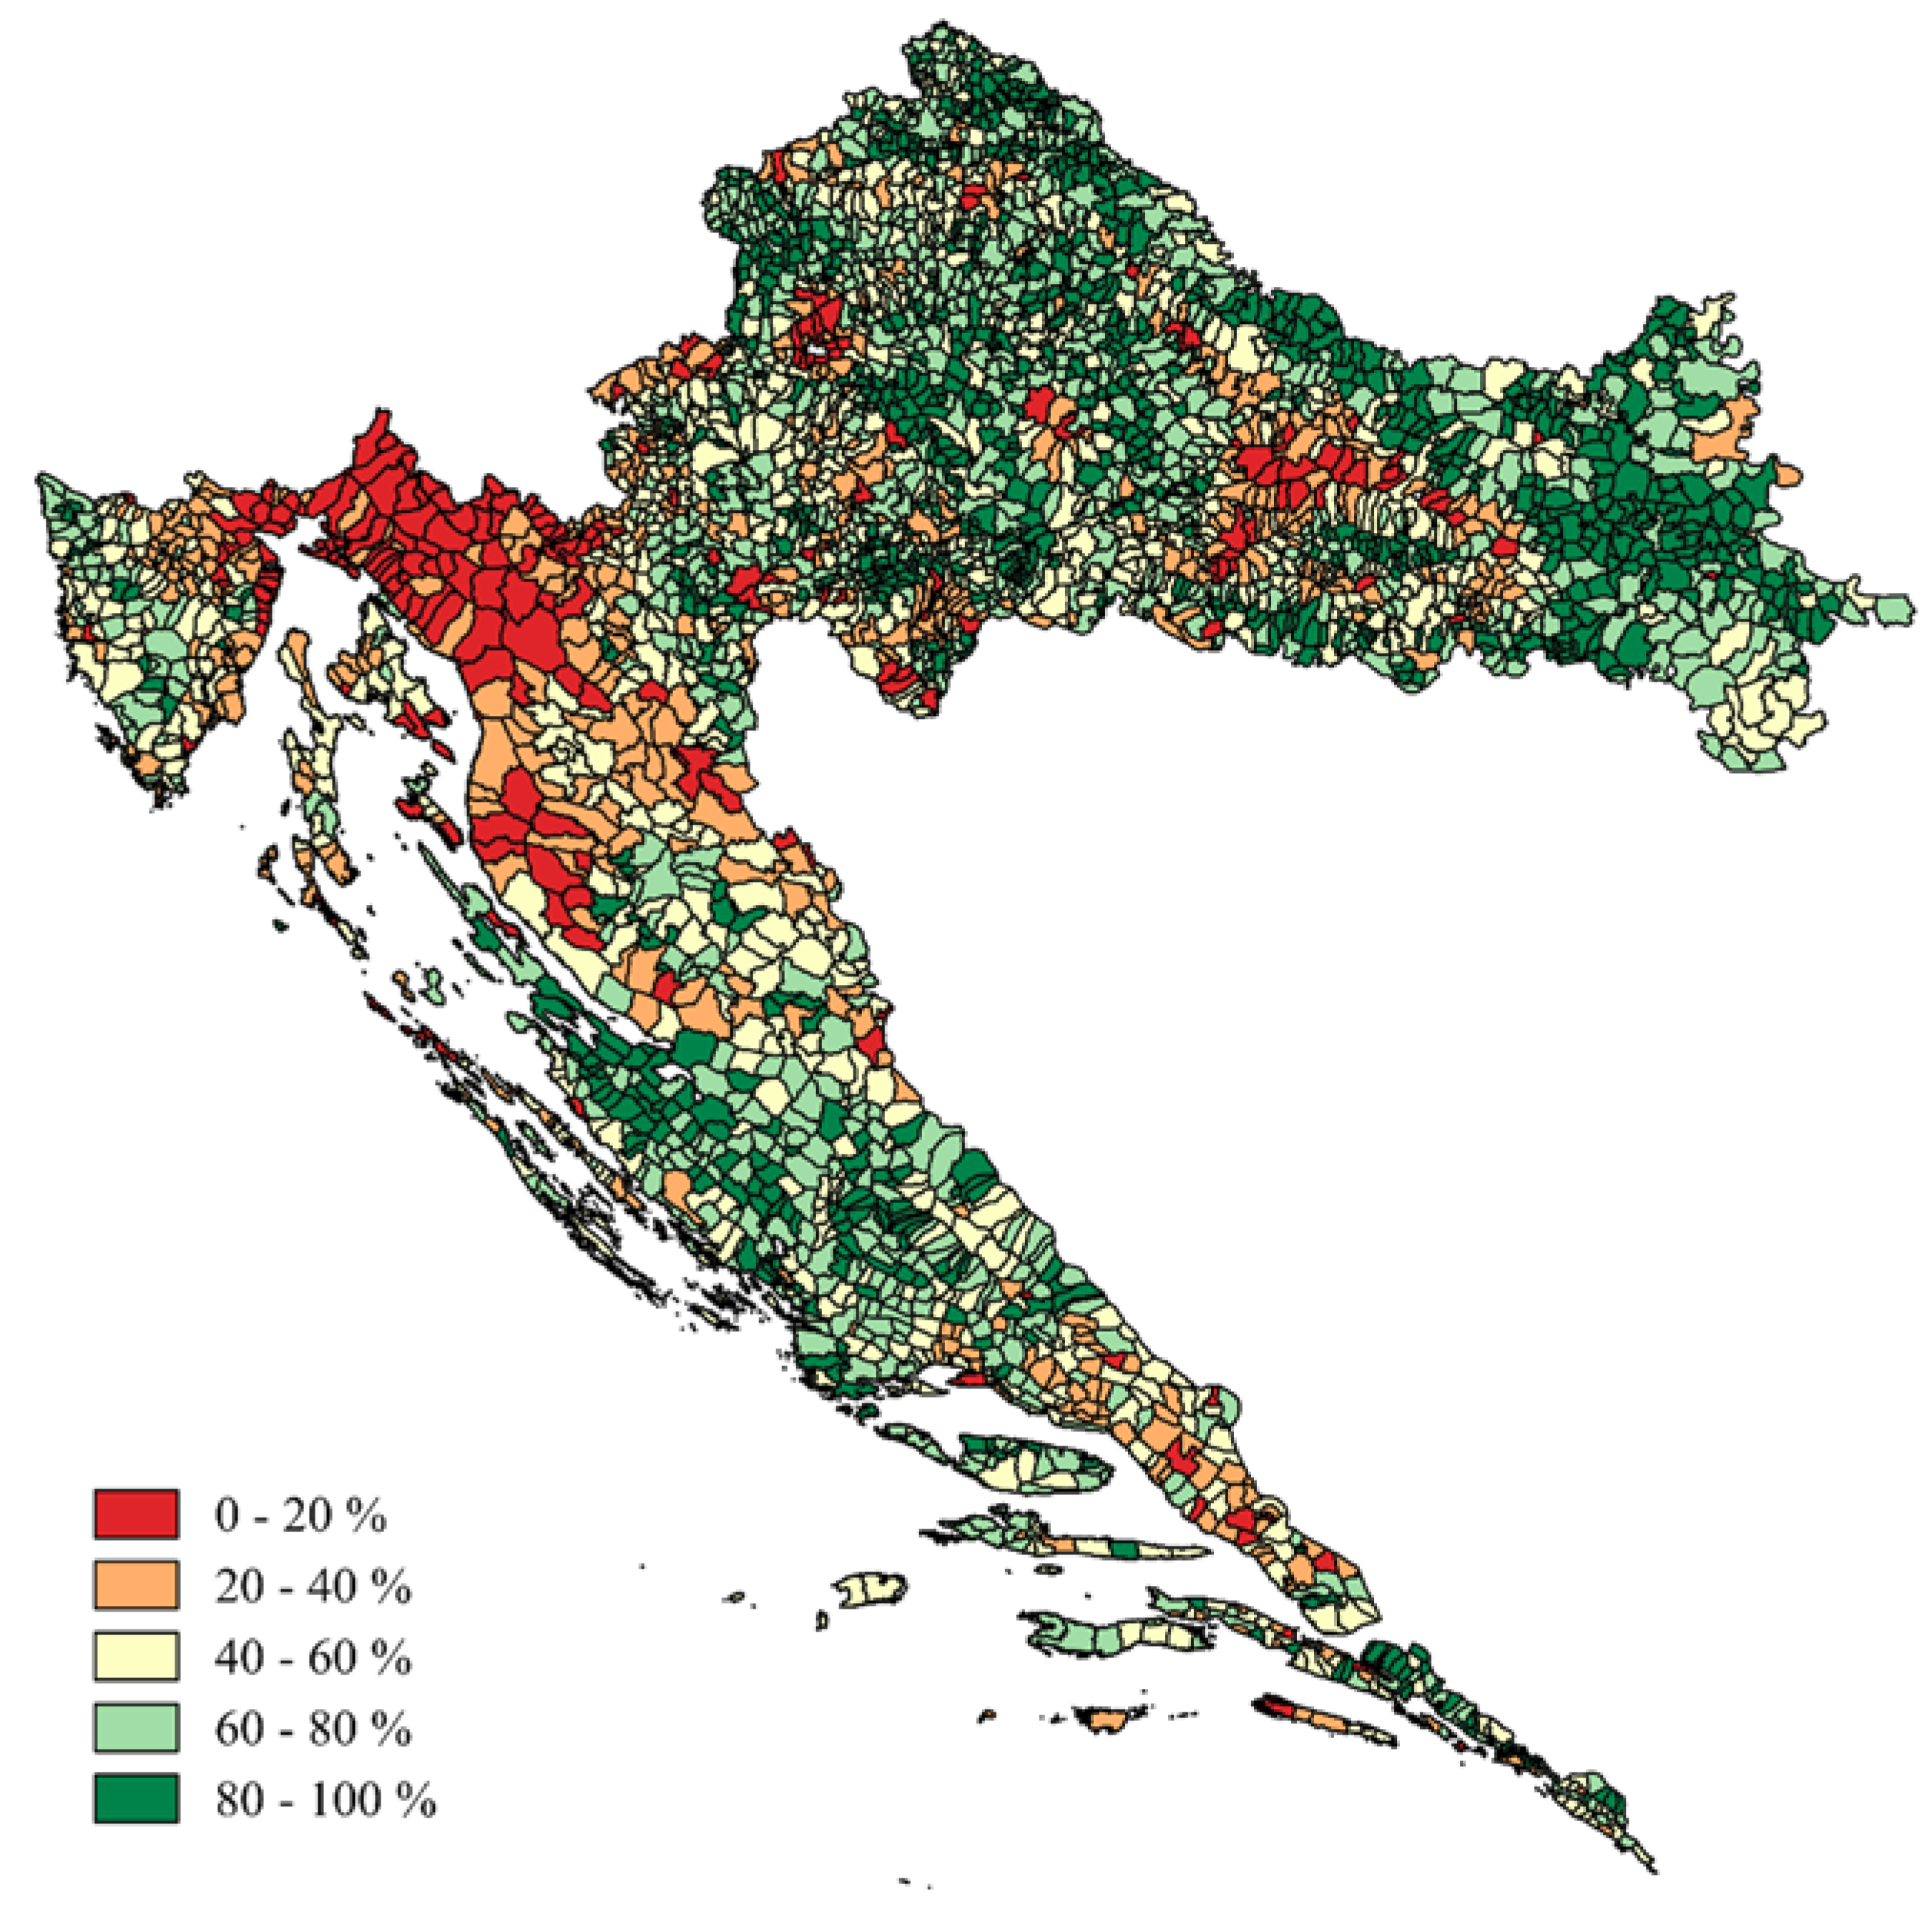
ARKOD (LPIS) is the national system of agricultural parcels’ identification, which registers the agricultural use of land in the Republic of Croatia. Its purpose is to enable farmers to apply for subsidies in agriculture, as well as their more transparent use. Agricultural parcels registered in ARKOD represent the most reliable data on active agricultural land in Croatia. According to the Corine Land Cover project (CLC) data from the year 2012, Croatia has a total of 56% agricultural land (31,907 km
2) (
Figure 3). Of that total, only 33% of agricultural land is currently active (LPIS—ARKOD, 2015: 10,679 km
2).
3.2.4. Physical Planning Information System
The Physical Planning Information System (Croatian abbrev: ISPU) stores and administers spatial information related to physical planning. It keeps information on the intended land use, conditions and limitations of the use of space, infrastructure, and programmes for the protection of the space. The system is maintained by local self-government. Its main purpose is to support the planning process and protection of space and to monitor the implementation of physical planning documents. However, the land use data (needed for the separation of agricultural land from other areas) is still mostly stored in a graphic raster form, which makes it unsuitable for automatic classification of spatial units. That is why these data were not used in ranking.
3.2.5. Information System for the Disposal of State Agricultural Land
The information system for the disposal of state agricultural land is maintained by the Agricultural Land Agency. The agency’s main goal is to ensure efficient management and use of agricultural land as a valuable national resource. The information system is managed as a spatial database that contains data on all state-owned agricultural land: cadastral parcel identification, cadastral parcel borders, cadastral parcel area, lease contract data, and other attributes.
4. Materials: Indicators and Units Selection
To quantitatively determine LC suitability, it is necessary to choose and define criteria and indicators together with spatial units to which the particular indicators values are related. Chosen indicators had to be determined for all spatial units using official datasets described in
Section 3.2.
A prerequisite of the rural areas and agricultural land development is a rational approach to the ranking of the priority areas for the implementation of land consolidation. Priority areas can be ranked according to many factors. A transparent and rational method, together with the previously-known criteria, will help avoid doubt in the impartial ranking of priority areas.
4.1. Selection of Evaluation Units
Based on the analysis of identified data sources, a cadastral municipality was selected as the basic ranking spatial unit. The reason is that cadastral municipality is the basic unit of Croatian cadastral system, started with the main purpose of agricultural production taxation and includes the settlement and the associated land. In the Register of Spatial Units, the following is stored as a polygon with its associated attributes: unique ID (KO_MB), cadastral municipality name, and links to other administrative units.
4.2. Selection and Determination of Indicators
There are numerous indicators and measures that can be used to determine the LC suitability of different cadastral municipalities (CM). The analysis of possible data sources (
Section 3.2) identified reliable sources of information suitable for the determination of indicators (
Table 1). The analysis was based on our previous research [
44,
45] and has covered availability, completeness, and whether the registered data are up-to-date.
How each indicator would be valued and weighed was determined. Depending on the nature of each indicator, determination of their values can be a relatively simple task, but sometimes it can also involve a complex, time-consuming spatial analysis. The most challenging indicator to determine was the agricultural holdings fragmentation index (Indicator 4), which evaluates the average value of the form (compactness) of agricultural holdings in each cadastral municipality. The analysis calculates this index as the average value (the median was used) of each holding fragmentation index, which is calculated as a ratio of minimum polygon area covering all the agricultural parcels of one holding in one cadastral municipality, divided by the total area of the holding’s agricultural parcels. The value of this indicator is different from indicator 7, which only take into consideration the number of agricultural holdings in one Cadastral municipality.
Indicator 3 was determined using regulation on valuation of agricultural land used in sale procedures of the state land, but any other parcel shape fragmentation index could be used to assess parcel shape [
46]. The used index was calculated as an average of land parcels’ individual shape indexes calculated as:
, where K is the land parcel compactness index, P is the perimeter, and S is the surface area.
Current Croatian land policy includes a rural development policy as an integral part of the EU’s Common Agricultural Policy (CAP). Within its framework, rural development plans (RDP) are the guiding policy to support the development of agricultural competitiveness, together with the sustainable management of natural resources and balanced territorial development (EC/COM, 2010). Based on this demand, multi-criteria analysis included one indicator—the regional development index (RDI) (
Table 1, Indicator No. 6)—calculated by the Ministry of Regional development and EU funds. This index is used to prepare a decision on the classification of local (LAU2) and regional self-government units (NUTS3), accordingly, to development level. The development index is a composite indicator calculated as a weighted average of several socio-economic indicators [
38]. The current version dates from 2013.
Indicators can value the suitability for the use of LC concerning some aspects of physical or other characteristics of land parcels and landholdings, or can be added as a decision-maker’s (DM) preference request. Indicators 5, 6, and 7 are added as possible DM preferences concerning the share of state-owned land, the number of agricultural holdings, or areas with low RDI values.
5. Methods
To solve the problem defined above, detailed analysis of the land and other official spatial data registers was needed. All available datasets were analysed to check their completeness on the state level and to check whether they can be used in the automatized processes of indicator determination [
26]. The aim of this analysis is to identify the available official registers’ datasets and to suggest which one would be the most suitable for a reliable determination of measures and indicators.
All indicators were used as MCA criteria. As the determined indicators included different dimensions and distributions, all values— “a” were range-scaled using data normalisation to interval [0,1]:
A smaller value of normalised indicator values indicates a lower suitability/worse result and higher value means that the spatial unit to which it relates has a higher suitability for (greater benefit from) LC.
Using spatial and other analyses of the data from official data sources mentioned in
Section 4.2, indicator values were determined for all CMs. In this dataset, different MCAs were performed to check their applicability and differences.
Methods used were the weighted sum model (WSM), the best known and simplest MCA method, PROMETHEE (Preference Ranking Organisation Method for Enrichment Evaluation), and TOPSIS (Technique for Order of Preference by Similarity to Ideal Solution). The PROMETHEE method has application in decision-making and has been used as a method for LC ranking. PROMETHEE I (partial ranking) and II (complete ranking) were used to rank CMs. In addition, the TOPSIS method was used to check the results given by the other two methods. The TOPSIS method is based on the concept that the chosen alternative should have the shortest geometric distance from the positive ideal solution and the longest geometric distance from the negative ideal solution.
Land consolidation suitability index (LCSI) was calculated using all the above-mentioned methods. As there are no known influences of indicator values that could be used to set the weights; weights were determined according to expert advice or equal weights (EW) were used for all the indicators’ values. Assignment of an AHP decision matrix using the expert system, which involves collaboration of various profession experts, was carried out by discussion of the participants of the research project [
47]. The Analytic Hierarchy Process (AHP) was used to determine the decision matrix using a pairwise priority comparison, from which indicators’ weights were calculated (
Table 2). The consistency ratio was 2.1%.
5.1. Weighted Sum Model (WSM)
WSM calculated LCSI was calculated using the equation:
where LCSI is the index value used to rank the CMs, a is the value of the indicators (1–7),
w is the weight of each indicator, and
n is the total number of indices.
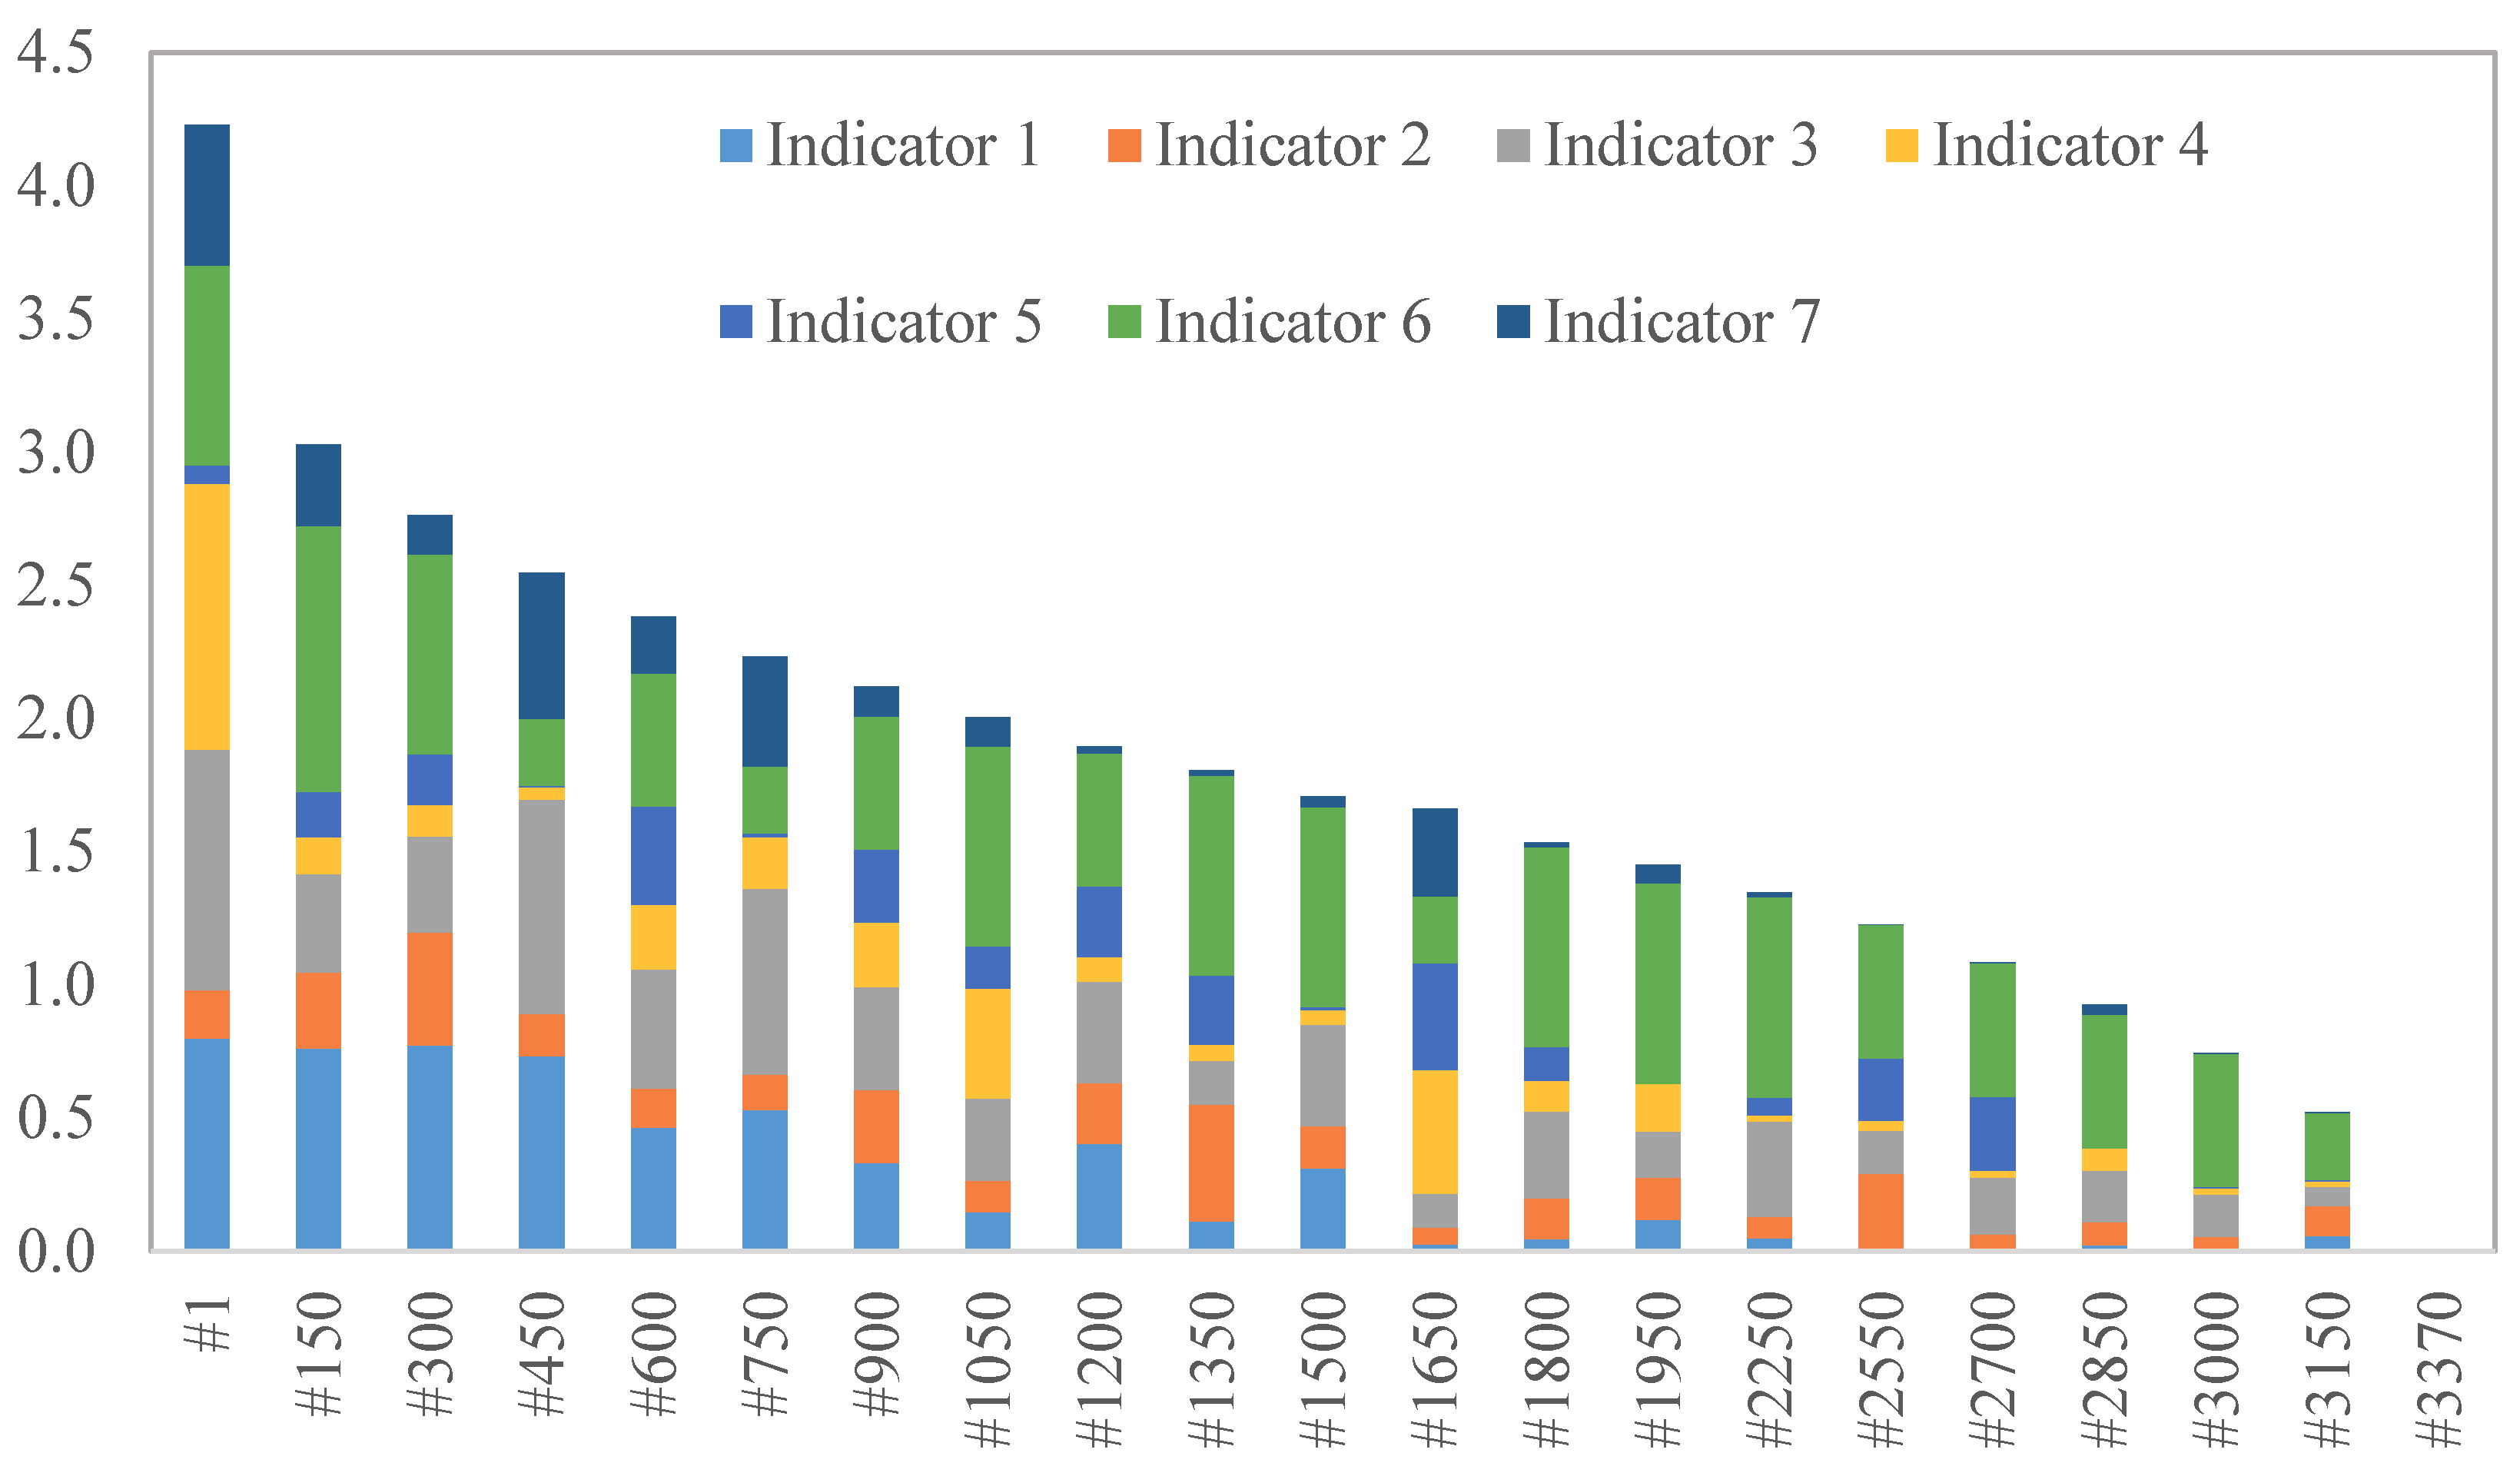
WSM was used to calculate LCSI, using all indicators and equal weights (WSM-EW) and using AHP weights. Complete ranking is obtained by ordering the CMs according to decreasing values of LCSI (
Figure 4). Due to too many spatial units ranked (3770), the whole ranking would not be possible to display in a figure. That is why the x-axis shows 20 chosen spatial units indicator values, from the best ranked (#1) to the worst ranked spatial unit (#3370) in rank steps of 150.
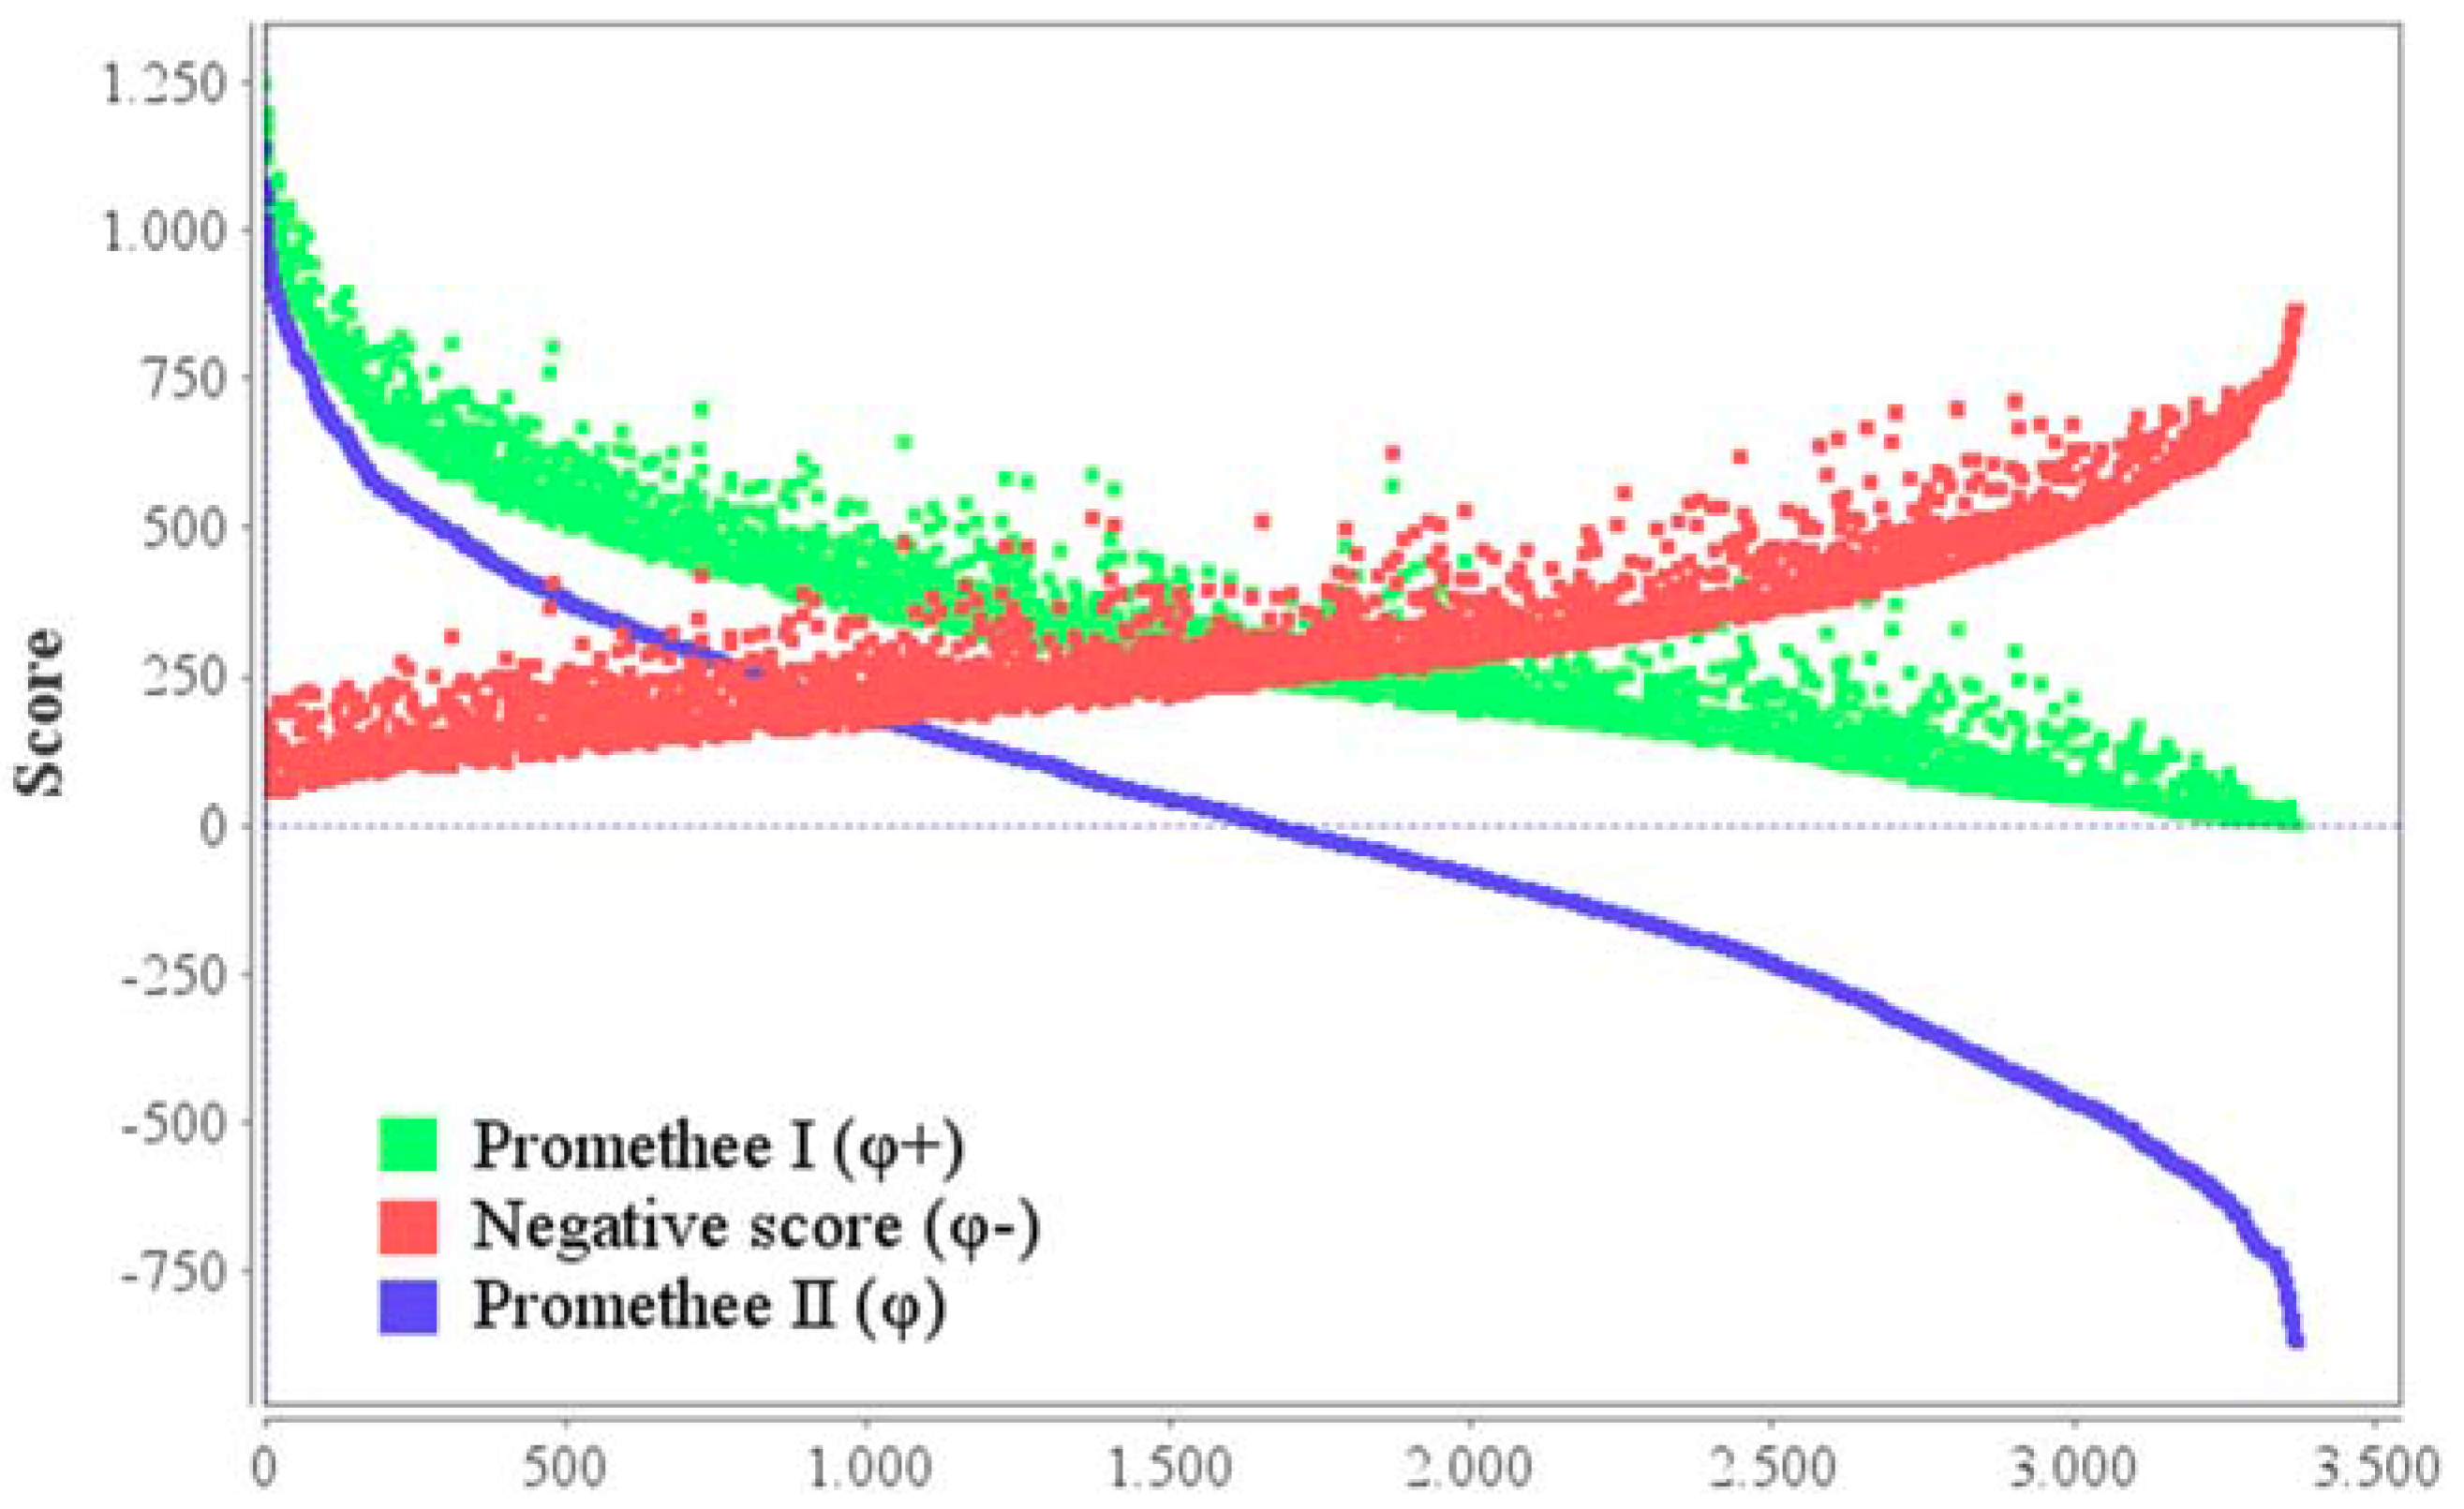
5.2. Preference Ranking Organisation Method for Enrichment Evaluation (PROMETHEE)
The PROMETHEE method considers the outranking flows for evaluation of alternatives, built on a pair-wise comparison. The outranking flows are named positive and negative flows—higher values of positive flow and lower values of negative flow represent better alternatives.
PROMETHEE I and II methods were used to calculate LCSI using the positive (PROMETHEE I), negative and net preference score (PROMETHEE II):
where a
i and b
i are potential alternatives (CM), A is a group of all the alternatives (a, b ∈ A), and Π(a, b) is a multi-criteria global preference index, defined accordingly to all of the criteria—indicators using assigned weights (
w)—representing the intensity preference of a over b:
For all alternatives—CMs, according to associated indicators, positive outranking, negative outranking, and net outranking score (
Figure 5) have been calculated. The x-axis represents rankings, meaning smaller ranking number marks the better alternatives. The positive direction of y-axis represents PROMETHEE score of alternatives. The positive flow—PROMETHEE I is shown in green, negative flow is shown in red and net score—PROMETHEE II rankings are shown in blue. Ordering the CMs according to decreasing values of net preference score was used to assign final PROMETHEE II ranking. Ordering by decreasing values of positive flow was used to assign partial PROMETHEE I ranking. Examples of high-ranked, low-ranked, and mid-ranked CMs are shown in
Table 3.
5.3. Technique for Order of Preference by Similarity to the Ideal Solution (TOPSIS)
The TOPSIS method consists of the construction of a normalised decision matrix, determination of ideal (most desirable) and negative ideal solutions (less desirable), and the calculation of the distance from each alternative to positive and negative ideal solutions. The following equation was used to calculate the distance to the ideal point:
where
wij are the weights,
xij is standardized criteria value,
x+j is the ideal value,
x−j is the anti-ideal (negative ideal) value, and
p is a parameter (
p = 2 was used in the calculation).
Based on these distances from ideal and negative ideal point, final rankings are determined based on alternatives with higher
si values:
For all alternatives, according to the associated indicators, distances from the ideal and anti-ideal solutions were calculated to assign final TOPSIS score (
Table 3). Ordering the CMs according to decreasing values of TOPSIS score was used to assign the final ranking.
The example shows the indicators and rankings for the best-ranked (CM ID: 302775, Belica), mid-ranked (CM ID: 317616, Bijela Stijena), and low-ranked alternative (CM ID: 335266, Črnomerec). Alternatives were chosen using the PROMETHEE II methodology, and for each alternative there is an associated TOPSIS score. From the example provided, it can be observed that scoring corresponds to indicator values.
6. Results and Discussion
Based on all calculated indicator values, using the chosen MCA, it is possible to determine the value of the land consolidation suitability index (LCSI) for each spatial unit (CM). The value of this index gives an indexed measure of the impact of all included indicators. A higher value of LCSI means that the related CM is more suitable for agricultural land consolidation (
Table 4). CMs were sorted according to their LCSI value in descending order to determine the ranks for each MCA.
Using the associated indicators, LCSI were calculated using the following MCAs:
Weighted sum model values, using equal weights for all indicators (WSM-EW);
Weighted sum model, using AHP assigned weights (WSM-AHP);
PROMETHEE I, partial ranking and PROMETHEE II ranking; and
TOPSIS.
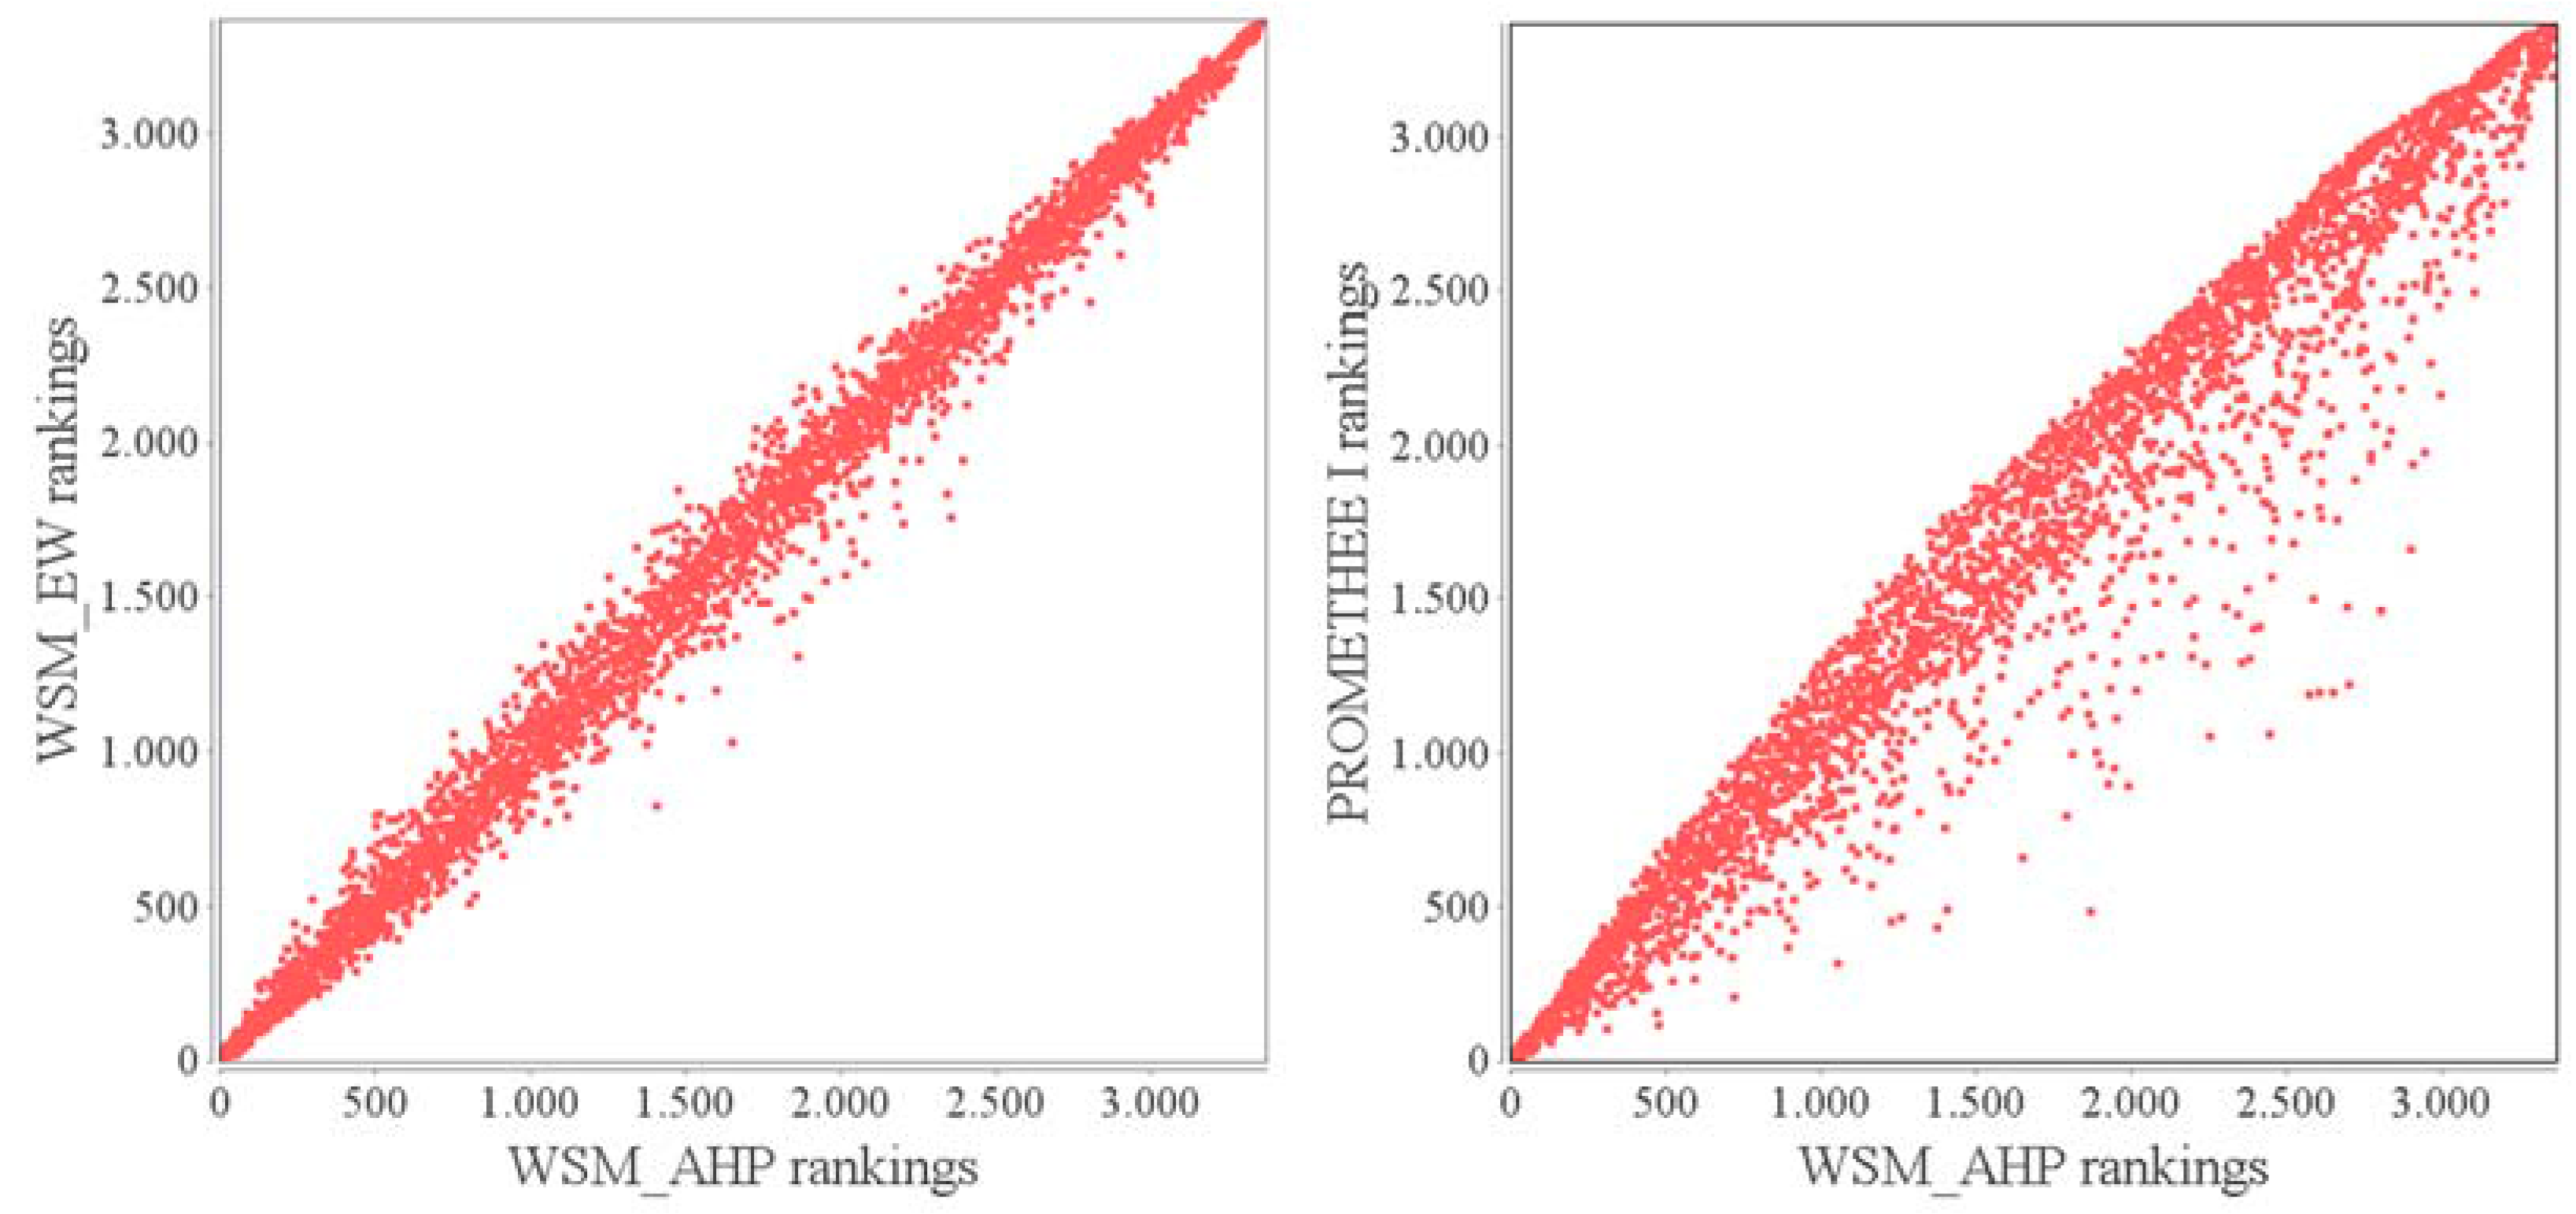
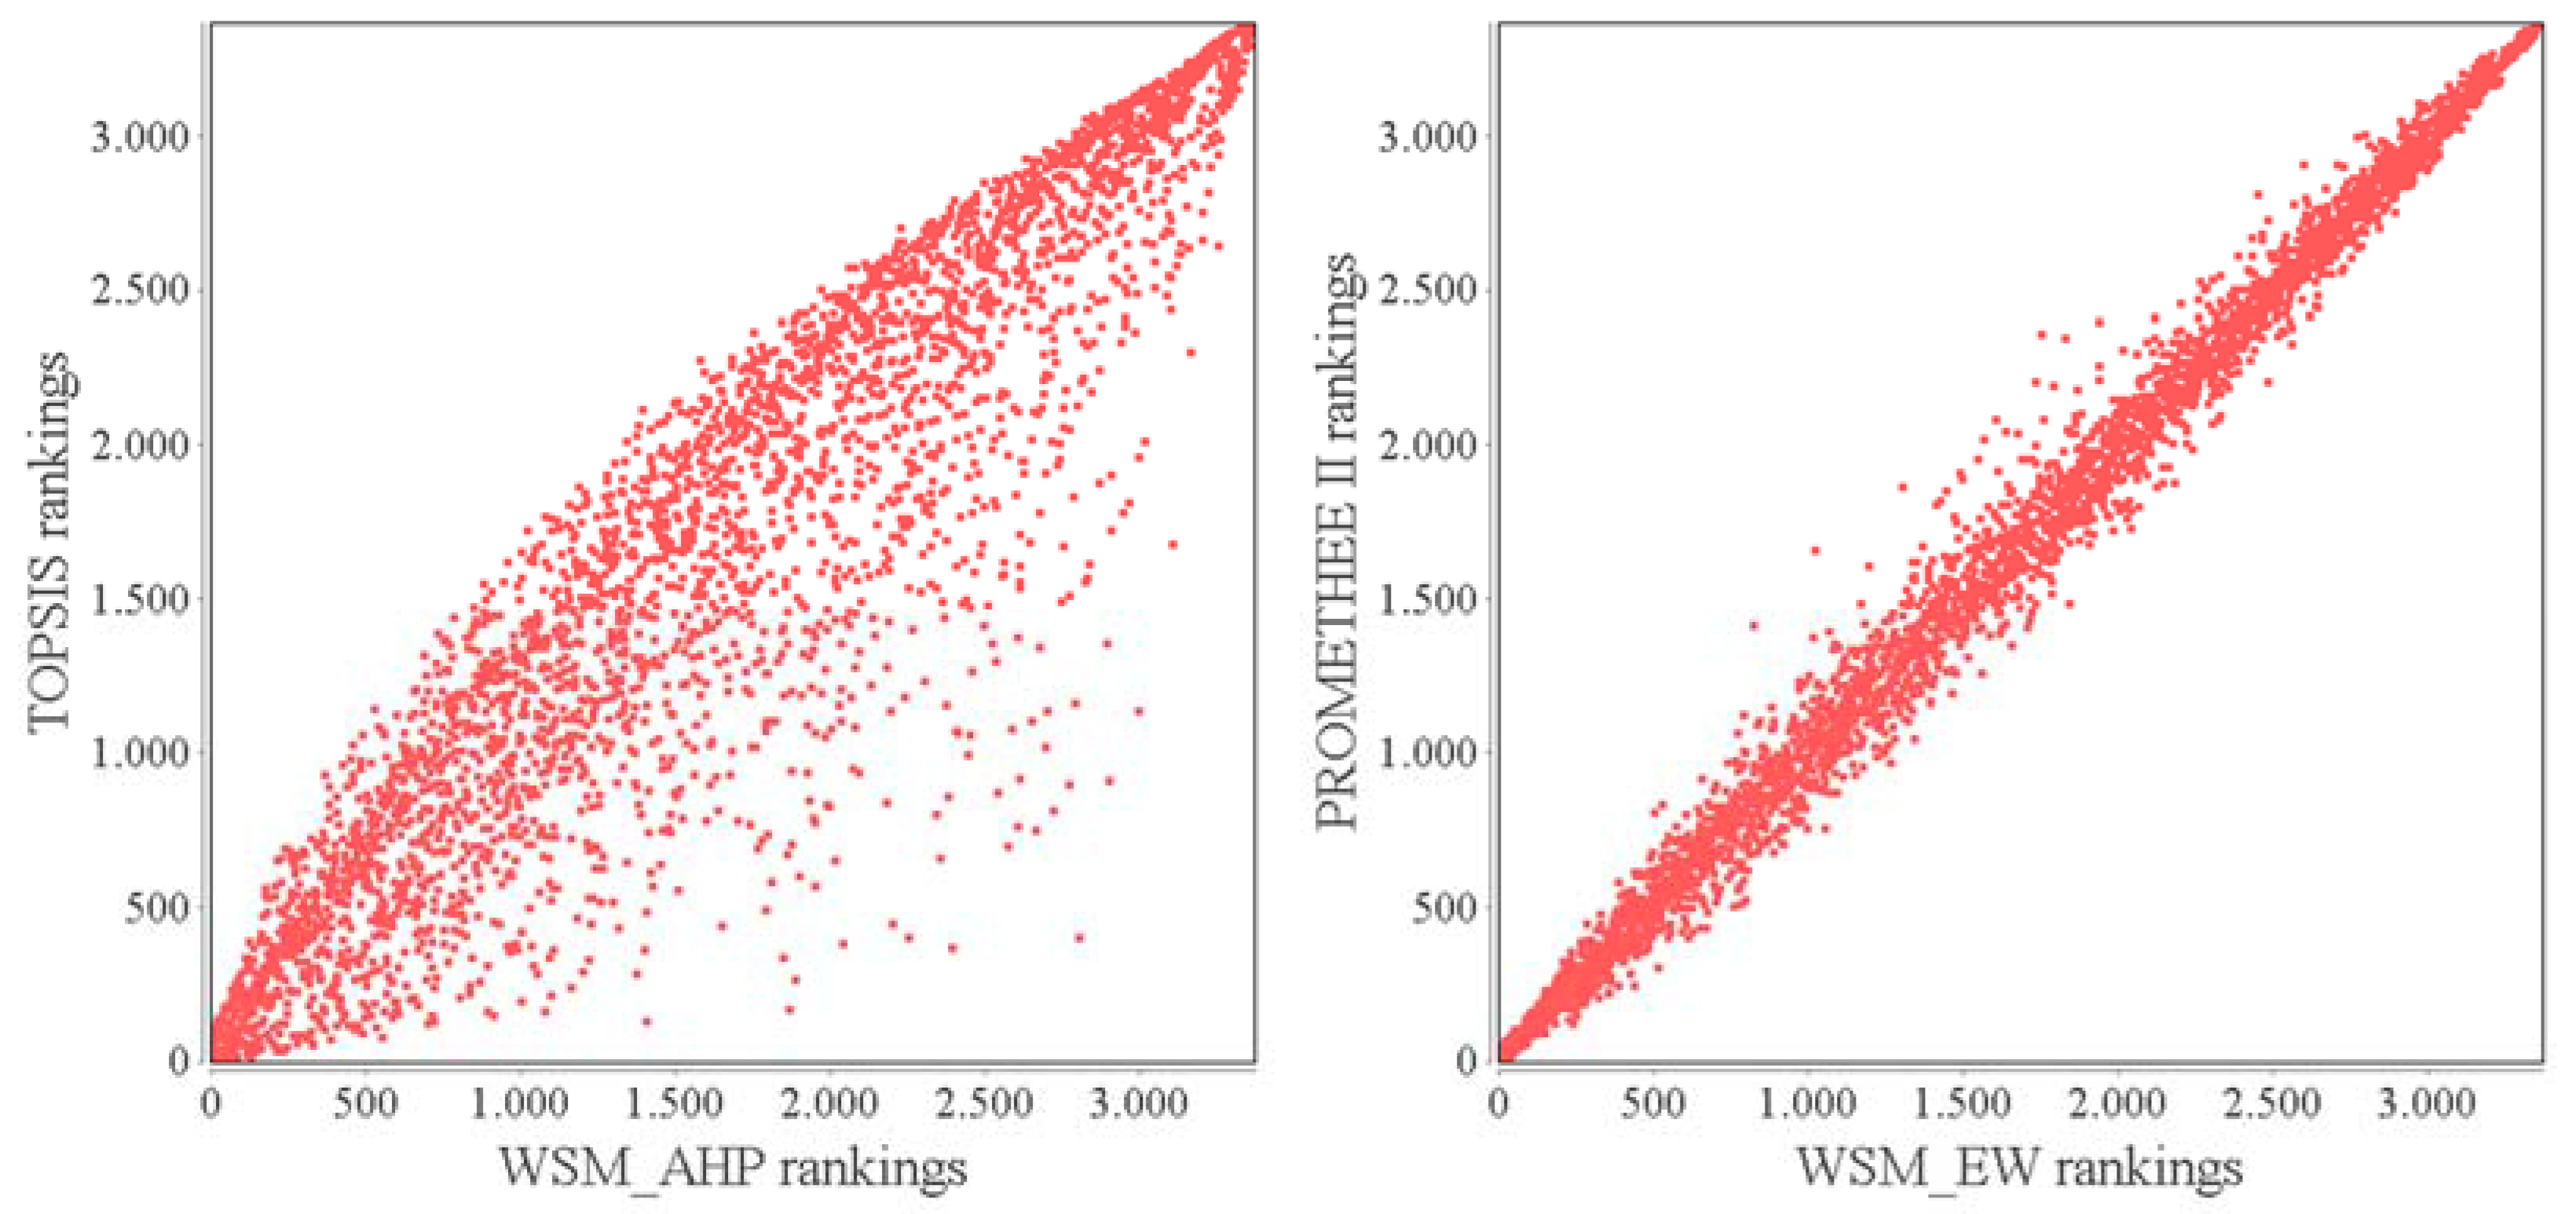
Manual visual and data inspection was used to check the determined results. This showed that the proposed ranking results are satisfactory and that they reflect the actual situation. Differences between LCSI values determined by different MCA methods are relatively small and it can, therefore, be concluded that any of the used MCAs can be used for CM ranking. However, it is necessary to carefully select weight values because ranking results are strongly determined by a pairwise comparison of selected criteria, formulated into indicator weights. Scatterplots of different combinations of weights and MCA (
Figure 6) show that there are minor differences between values of PROMETHEE and WSM. Differences are slightly larger when comparing WSM and TOPSIS, but the results are still comparable.
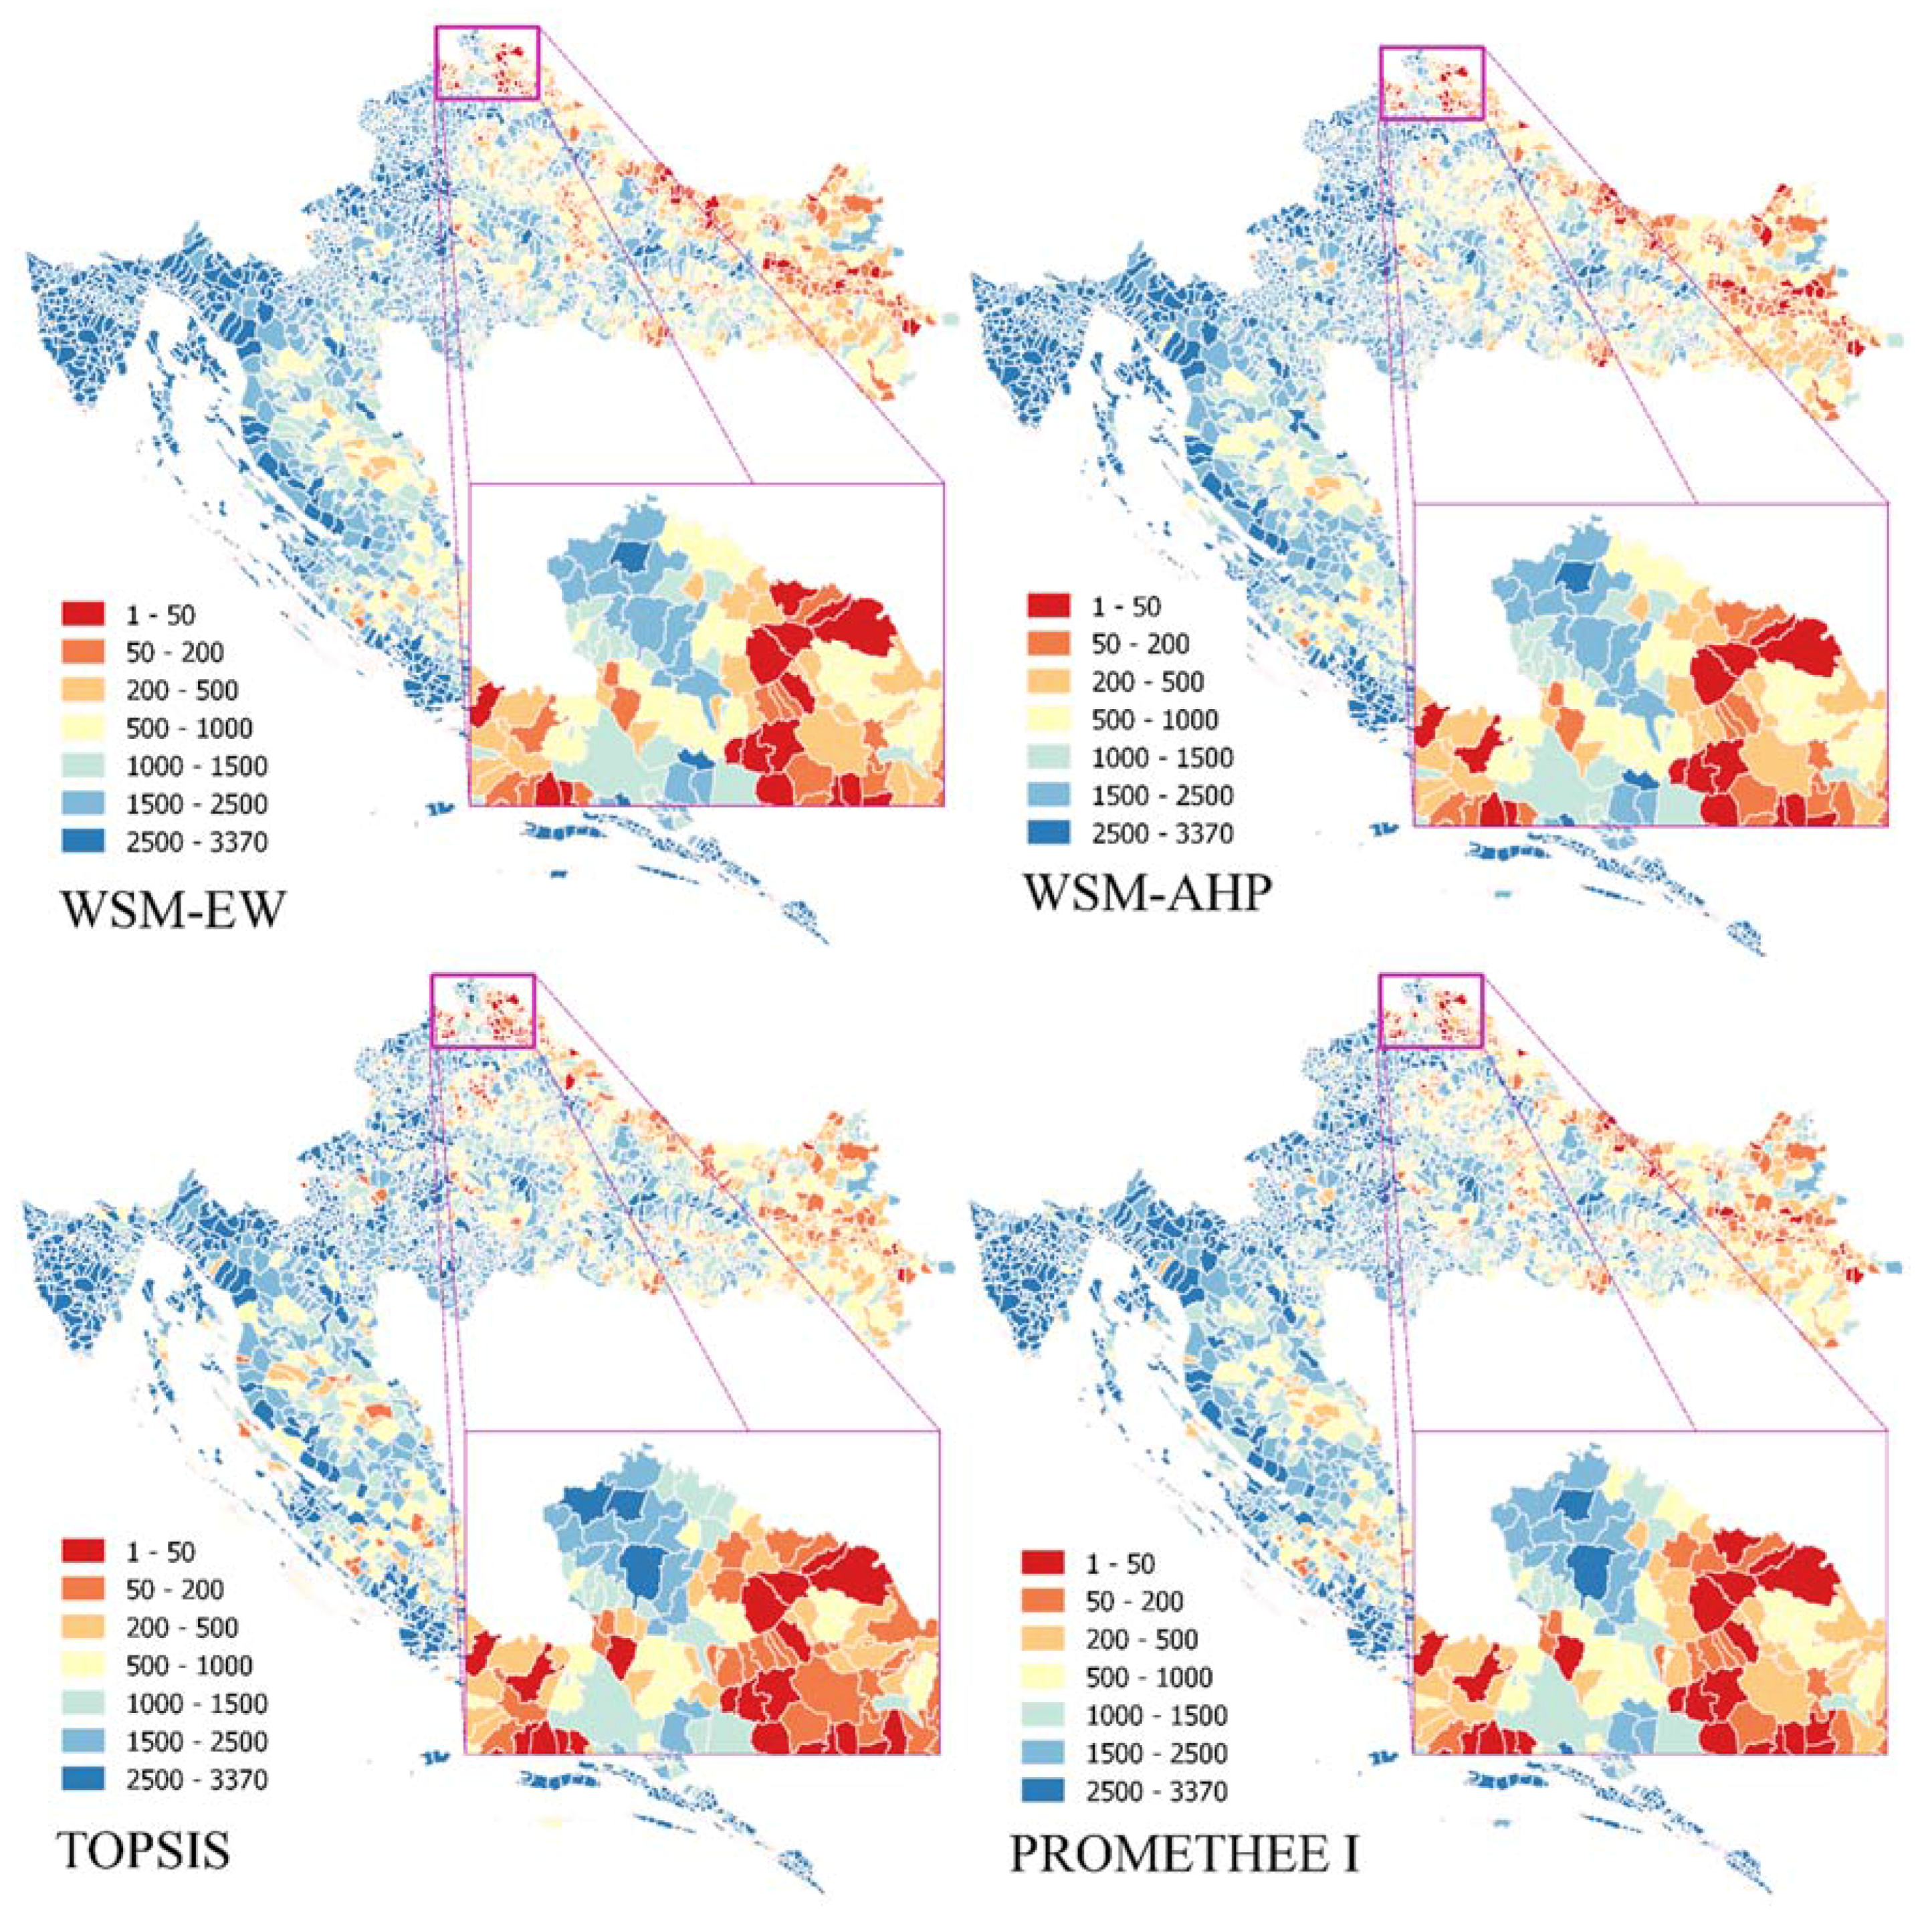
To perform a more detailed check of the determined LCSI, using different MCA methods, thematic maps have been made (
Figure 7). The same colour scale was used to show CM ranks: the higher rank means that the related CM is more suitable for LC. The total rankings were divided into 7 classes for which colour scales were used. Better alternatives (higher ranked) are shown in red tones and lower ranked alternatives are shown in blue tones. Results showed that most of the CMs in highest rankings class—rankings 1–50 (red colour in the figure)—are located in Međimurska, Varaždinska, and Koprivnica-Križevci counties, and only a few highly-ranked CM are located in Eastern Slavonija.
Visual and data inspection of high- and low-ranked CMs showed that LCSI values reflect the actual values of used indicators and that, although rankings have been made using different MCAs, the results are comparable and there are no major differences. An explanation of highly-ranked CMs located in Međimurska, Varaždinska, and Koprivnica-Križevci counties lies in a high percentage of agricultural land together with relatively irregular and small-sized land parcels. Although it is expected to have a similar situation in Eastern Slavonija because of the high percentage of agricultural land, only a few highly-ranked CMs are located there. This is because in the period from 1956 to 1980, most of the LC was conducted there, making land parcels larger and more regular in shape. Low-ranking results are mainly connected to relatively low percentages of agricultural land (CMs which are mainly situated near or in urban areas) and a relatively small number of agricultural holdings.
To analyse the differences between the used methods, mean ranking differences and their relative standard deviations were calculated for all methods (
Table 5). The smallest differences are between WSM-AHP and WSM-EW (SD = 2.0%). The largest differences (SD = 7.8%) are between PROMETHEE II and TOPSIS, WSM-AHP, and TOPSIS, and between WSM-AHP and PROMETHEE II. If we observe the distribution of these differences, the smallest differences are between the WSM-AHP and PROMETHEE II methods—all ranking differences are smaller than 10%. The greatest differences are between TOPSIS and WSM-AHP methods—71.1% of the differences are smaller than 10% and 28.6% of differences are in within the range of 10 to 50%.
From the conducted analysis, it is possible to recommend WSM as the most appropriate method for the Croatian context. The WSM is the simplest method and the easiest to implement, but gives results somewhat comparable to more complicated methods—PROMETHEE II and TOPSIS—which are more suitable for ranking problems because they consider the distances from the anti-ideal solution. In general, there are countless numbers of solutions achievable by optimizing/compromising of all used indicators (criteria) amongst different CMs and by using different methods. However, any of the proposed rankings can be used to shortlist and distinguish possible LC candidates, for which detailed costs/benefits and other analyses can be made.
6.1. Limitations
The reliability of the results depends, in the first place, on the reliability of the official data used for indicator valuation. As explained in
Section 4.2, some of the required official datasets were missing and had to be replaced with other available data.
Instead of using a cadastral dataset, ARKOD (LPIS) land parcels were used. This means that only active agricultural land was considered. However, even if cadastral data were available, another requirement would be missing—physical planning documentation—which is still not available in the format required for the automatic calculation of indicator values. Physical zone planning is needed to accurately mark and subsequently develop the rural areas. Using ARKOD (LPIS) land parcels could also possibly lead to false analysis because there are very large state-owned parcels registered in ARKOD (LPIS) as pasture land, thus changing the average parcel size in the corresponding CM. Those parcels are relatively easy to identify and they were removed from the calculation in the process of the indicators’ data normalization.
This paper proposes the ranking of currently available indicators as a rough choice for potential LC candidates, assuming the additional indicators are difficult or impossible to determine using automated valuation of official datasets. The indicators that need to be determined manually to assess the costs and benefits from LC on some areas include; interests for land consolidation (questionnaire), possible infrastructure improvements (design of road and canal network), landscape features (landscape projects), and other technical and non-technical indicators. To evaluate those indicators, manual design and collection of data for each LC project is needed. However, the proposed ranking procedure would reduce such costs since it would have to be prepared only for the small number of areas which are generally suitable for land consolidation.
6.2. Further Research
As LC suitability analyses were used to evaluate the whole Croatian territory using indicators calculated based on currently-available official datasets, it is appropriate to further research different combinations of preference functions, different base spatial units (if LC is conducted on more than one, or only on the part of cadastral municipality), and requirements which would allow inclusion of other official datasets.
Although indicators are specific, it could be assumed that the proposed approach could be used as a tool to identify possible LC areas in other countries facing similar LC allocation or priority dilemmas. Determined rankings and LCSI values can be used to assist decision-makers in the development of land consolidation programmes. Together with the help of local self-government and the community, it is possible to collect some additional non-technical indicators (e.g., interests for land consolidation, possible infrastructure improvements), which could be further used to make a sustainable and effective agricultural land consolidation programme. We can assume that inclusion of some additional indicators would improve the overall reliability of the determined ranking model, but it is necessary to consider its costs and benefits.
7. Conclusions
Agricultural land consolidation, as a part of rural development programme, needs to be both efficiently and carefully planned to maximize its benefits. The start of LC on a national level requires preparatory activities to determine areas where land redistribution is most needed. This paper proposes the use of official land and other register data to make coarse selections of LC areas using MCA. MCA is commonly used as a stakeholder/decision-maker tool for the selection of optimal solution scenarios, using possibly-conflicting indicators and measures. The main benefit of using the proposed approach is the effectiveness and the increase of information-based decision-making in rural development programmes.
The selection and calculation of the used suitability indicators were strongly conditioned by the availability of the required data. Cadastral and physical planning datasets were not available in a form suitable for automatic data processing. In total, 7 indicators were used to determine land consolidation suitability, these were: share of agricultural land, average size and shape of agricultural parcel, number of agricultural holdings and their fragmentation index, share of state owned agricultural land, and regional development index. The set of available data was sufficient to give a relatively usable priority-ranking list. The proposed ranking included quantitative analysis of available indicators as the measure of suitability for LC.
All the MCA methods used identified Međimurska, Varaždinska, and Koprivnica-Križevci counties as the counties with the most of highly ranked alternatives. Only a few highly-ranked CM are located in Eastern Slavonija. This is expected because in the period from 1956 to 1980, most of the LC were conducted there, making land parcels larger and more regular in shape. Low ranking results are mainly connected to a relatively low percentage of agricultural land or relatively small number of agricultural holdings.
As expected, the ranking result was more dependent on indicator weights than the choice of MCA: all used MCA methods provided comparable and reliable results. In this context, we propose using the simplest method, WSM, as its results are comparable to those of more complicated ranking methods. Therefore, we recommend that decision-makers review and approve indicators’ weighting (preferences), as this is a crucial part which could potentially lead to false perceptions.


