Technical Note

HidroMap: A New Tool for Irrigation Monitoring and Management Using Free Satellite Imagery

by
Laura Piedelobo
1,
Damián Ortega-Terol
1,
Susana Del Pozo
1,
David Hernández-López
2,
Rocío Ballesteros
1,
Miguel A. Moreno
3,
José-Luis Molina
1 and
Diego González-Aguilera
1,*
1
Department of Cartographic and Land Engineering, University of Salamanca, Hornos Caleros 50, 05003 Ávila, Spain
2
Institute for Regional Development (IDR), University of Castilla-La Mancha, Campus Universitario s/n, 02071 Albacete, Spain
3
Regional Centre of Water Research (CREA), University of Castilla-La Mancha, Carretera de las Peñas km 3200, 02071 Albacete, Spain
*
Author to whom correspondence should be addressed.
ISPRS Int. J. Geo-Inf. 2018, 7(6), 220; https://doi.org/10.3390/ijgi7060220
Submission received: 7 May 2018 / Revised: 31 May 2018 / Accepted: 12 June 2018 / Published: 15 June 2018
(This article belongs to the Special Issue Free and Open Source Tools for Geospatial Analysis and Mapping)

Abstract

:
Proper control and planning of water resource use, especially in those catchments with large surface, climatic variability and intensive irrigation activity, is essential for a sustainable water management. Decision support systems based on useful tools involving main stakeholders and hydrological planning offices of the river basins play a key role. The free availability of Earth observation products with high temporal resolution, such as the European Sentinel-2B, has allowed us to combine remote sensing with cadastral and agronomic data. This paper introduces HidroMap to the scientific community, an open source tool as a geographic information system (GIS) organized in two different modules, desktop-GIS and web-GIS, with complementary functions and based on PostgreSQL/PostGIS database. Through an effective methodology HidroMap allows monitoring irrigation activity, managing unregulated irrigation, and optimizing available fluvial surveillance resources using satellite imagery. This is possible thanks to the automatic download, processing and storage of satellite products within field data provided by the River Surveillance Agency (RSA) and the Hydrological Planning Office (HPO). The tool was successfully validated in Duero Hydrographic Basin along the 2017 summer irrigation period. In conclusion, HidroMap comprised an important support tool for water management tasks and decision making tackled by Duero Hydrographic Confederation which can be adapted to any additional need and transferred to other river basin organizations.

1. Introduction

Water plays a key role in all natural ecosystems. It is the essential resource for the survival of all living organisms. Irrigation farming consumes around 70% of the total annual withdrawal of fresh water [1], which contributes to increasing agricultural productivity, mainly in unproductive arid lands [2,3]. However, irregular water uses and climate change effects involves the overexploitation of a large number of aquifers and the degradation of water quality sources [4]. This unsustainable water balance and the variability of water world cycles turn water to an increasingly scarce and limited resource [5,6,7]. Therefore, in order to stop and reverse this process, it is essential to adopt several measures focused on controlling runoff water and groundwater uses in the framework of farming irrigation [8,9]. Many studies and projects were conducted to assess and control agricultural irrigation activity [10,11,12]. For example, many efforts have been made by Irrigation Advisory Services involving not only important water conservation achievements, but also irrigation water management improvements [13]. This research work presents HidroMap, a new tool to monitor water uses in agriculture almost in near-real-time. This tool was developed to support Hydrological Planning Offices (HPOs) as a decision support tool including all actors involved in water management and water policy-makers at field level.
Within this framework, several political actions, such as European Water Framework Directive (EWFD; 2000/60/EC), encourage sustainable use of this resource and ensure the conservation of biodiversity. Spanish Ministry of Agriculture, Food and Environment have made significant efforts to improve water management through developing national plans and actions related to water quality, use and conservation following the guidelines of EWFD. Efforts made by the Spanish HPOs are also remarkable since they involve different hydrological plans for the different national basins. These actions represent a challenge for society. It is essential to develop a quality set of data that allows to monitor irrigation activity. In addition, a proper information management system that allows the geospatial integration of all data is crucial for preventive actions to be successful.
Aerial and satellital remote sensing have been recognized as excellent tools to acquire a large amount of spatial information [14]. This is due to their capability to cover large areas and so monitor crop biophysical parameters and control crop water uses along growing seasons [15,16,17]. In this regard, relevant changes related to the policy of National Aeronautics and Space Administration (NASA) and European Space Agency (ESA) have allowed open access to georeferenced Landsat and Sentinel images in near real time [18,19]. Images from Landsat-8 and Sentinel-2 satellites have been used in this research as they offer a high spatial and temporal resolution, thanks to the recent launch of Sentinel-2B in March 2017.
Regarding data integration in geospatial environments, several decision support systems based on web-GIS technologies have been developed with different aims [20,21,22]. However, most of these applications are not open source and they are only available for private uses [23]. Focusing on remote sensing applied to agronomic studies, there are previous experiences in crop assessment development. For example, Pleiades, based on satellite imagery, allows transferring crop water requirements over the growing season to final users [24]. In the southeast of Spain, different geospatial applications have been also used in this regard; for example, the SPIDER software that initially used Landsat-5 imagery and now a combination of Landsat-8 and Sentinel-2A to estimate water requirements based on normalized difference vegetation index (NDVI) [18,25,26].
Improving the management and monitoring of water uses not only requires farmers respect the legal framework and water consumption limits, but also developing tools that provide accurate information to water users and managers [27]. This research work was mainly focused on developing a multifunctional and open source tool. Thus, HidroMap allows us to: (i) automatically detect, prioritize, quantify and manage illegal irrigation as well as to generate maps and other supporting material for surveillance and inspection tasks; and (ii) monitor the agricultural irrigation activity in near real time through multitemporal satellite data. With these aims, PostgreSQL/PostGIS database [28] and standard Open Geospatial Consortium (OGC) services (both open-source) were created. HidroMap can be considered a very useful tool for the HPOs as it has been validated as a decision support system to control the irrigation activity, especially in large areas with high water demand. In brief, this open source tool offers a shared GIS environment for stakeholders, water policy makers and water managers.
In order to describe the functionalities offered by HidroMap, the technical note was organized as follows: after the introduction, Section 2 describes the study area where the tool was validated, Section 3 describes in detail all data requirements and the methodology proposed, Section 4 shows the tool as well as its main results, and finally, Section 5 summarizes all conclusions derived after testing the tool in the Duero River Basin during the 2017 summer irrigation campaign.

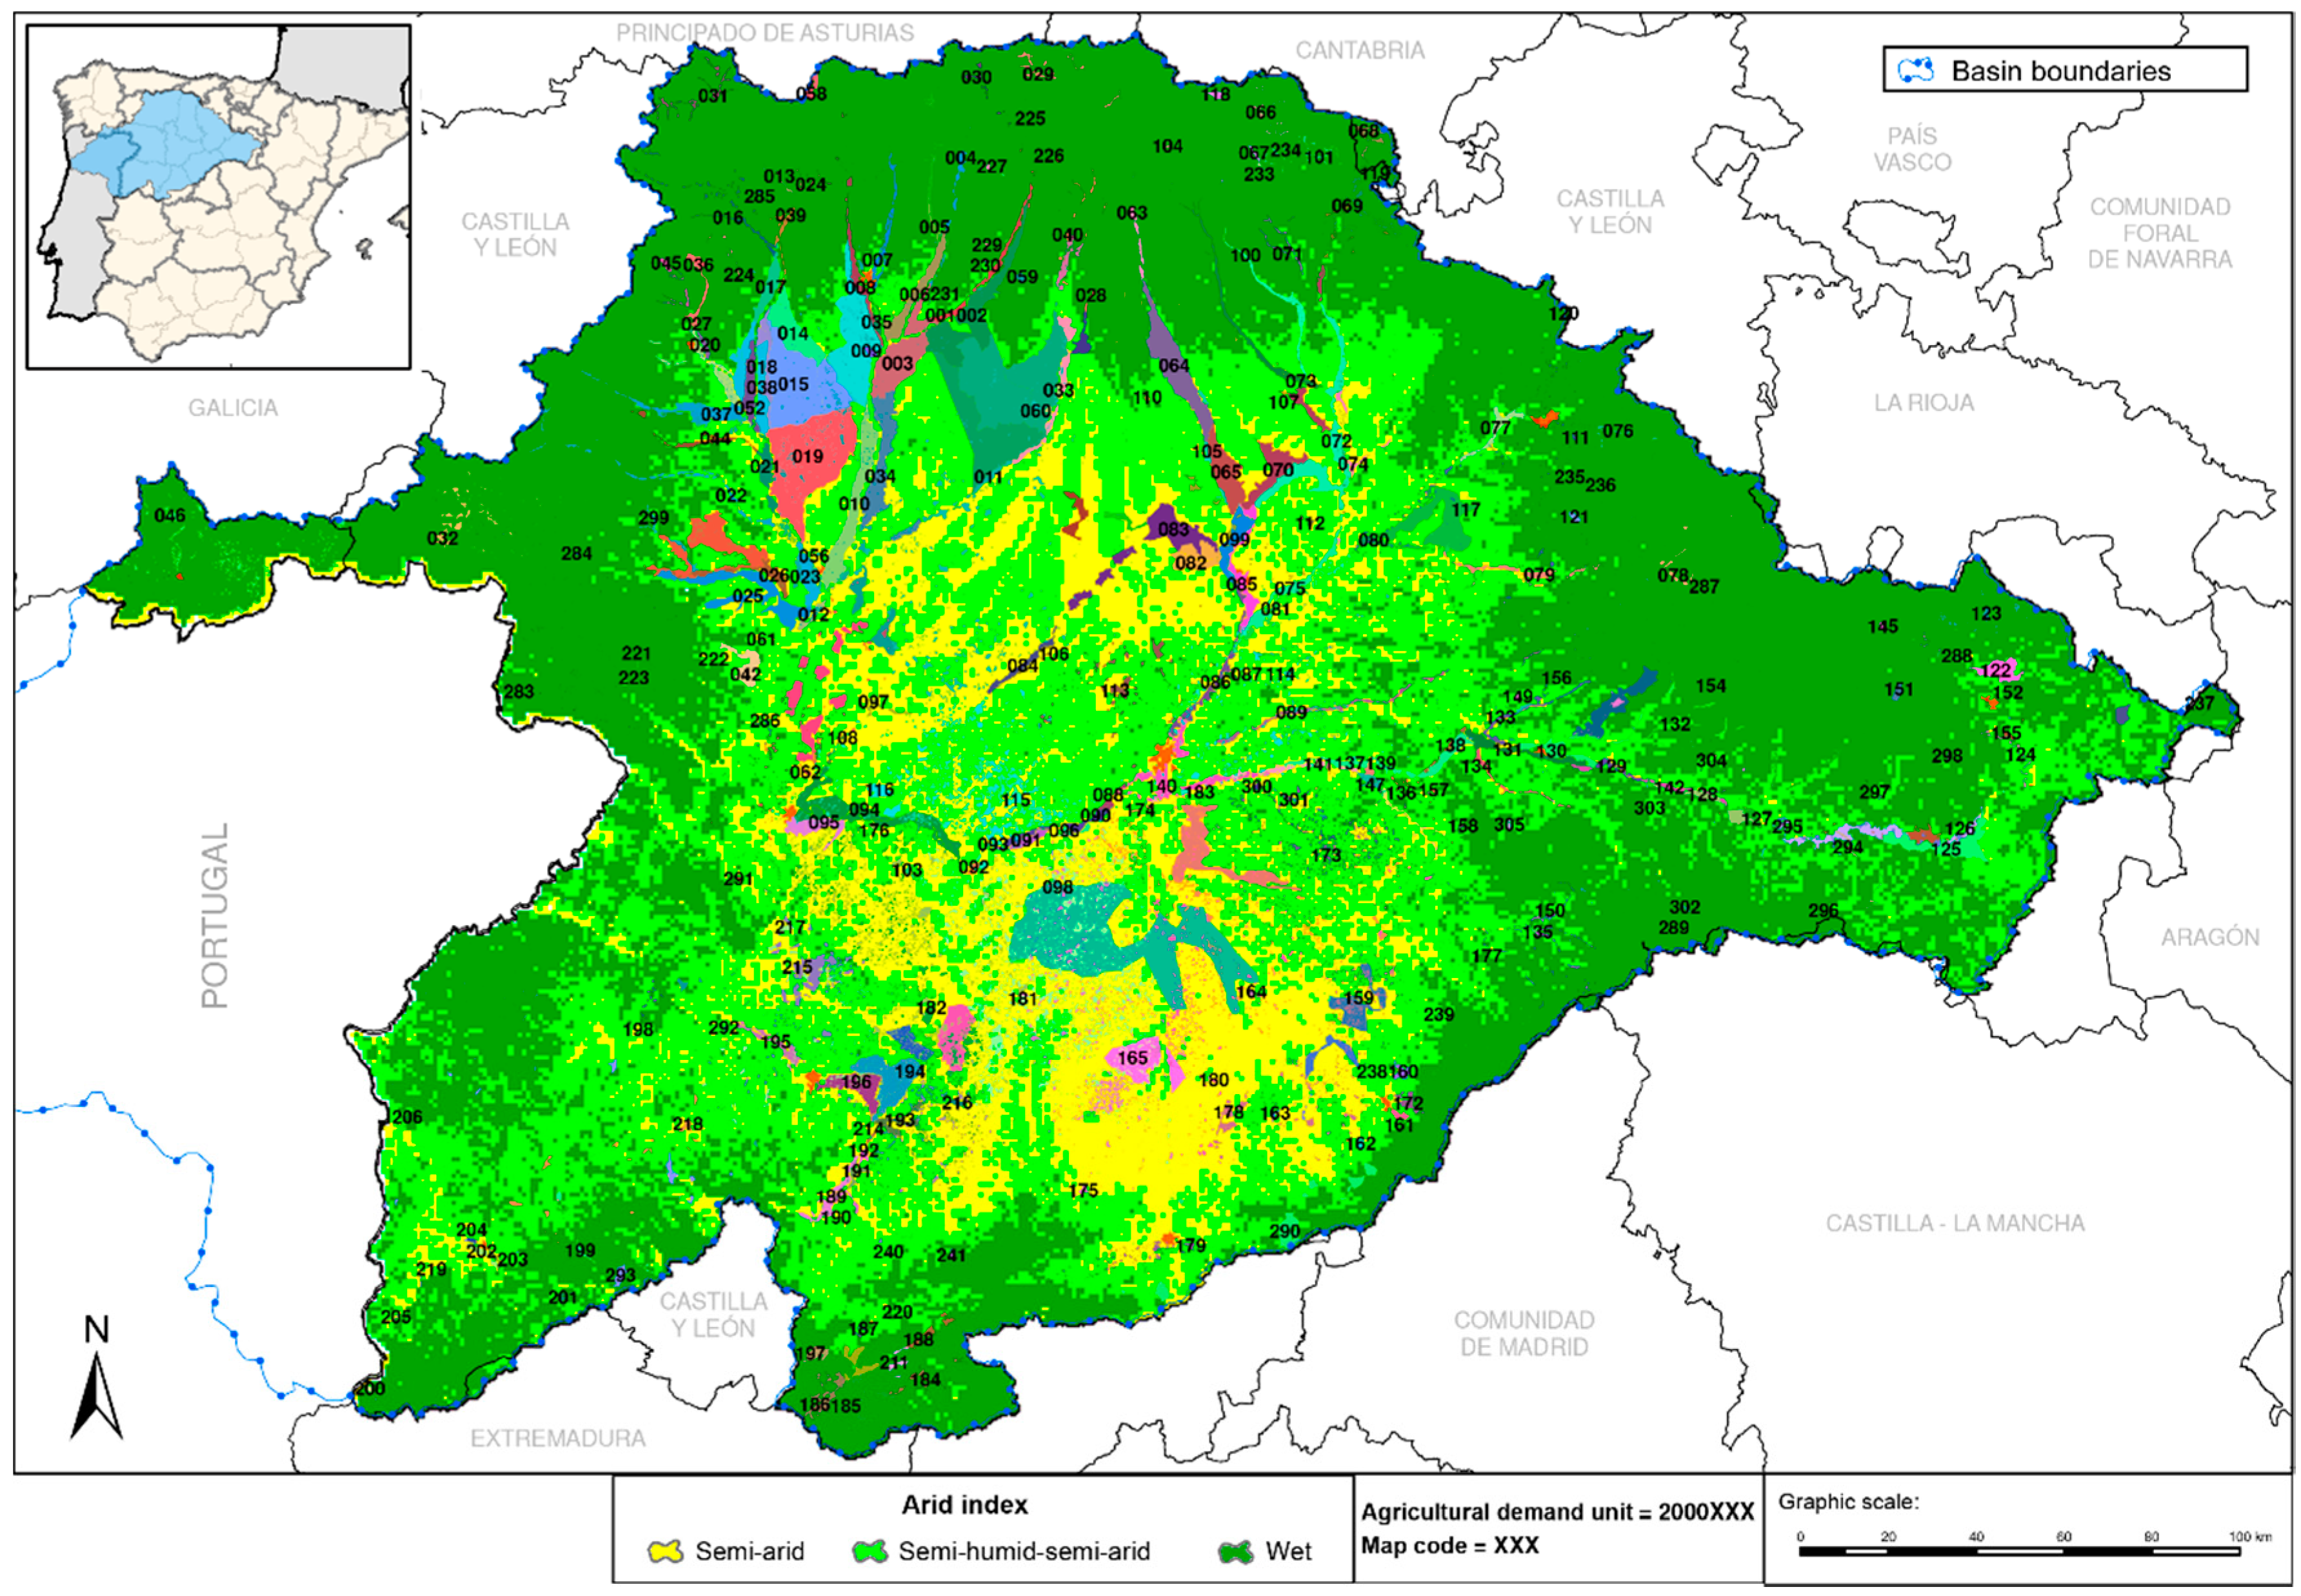
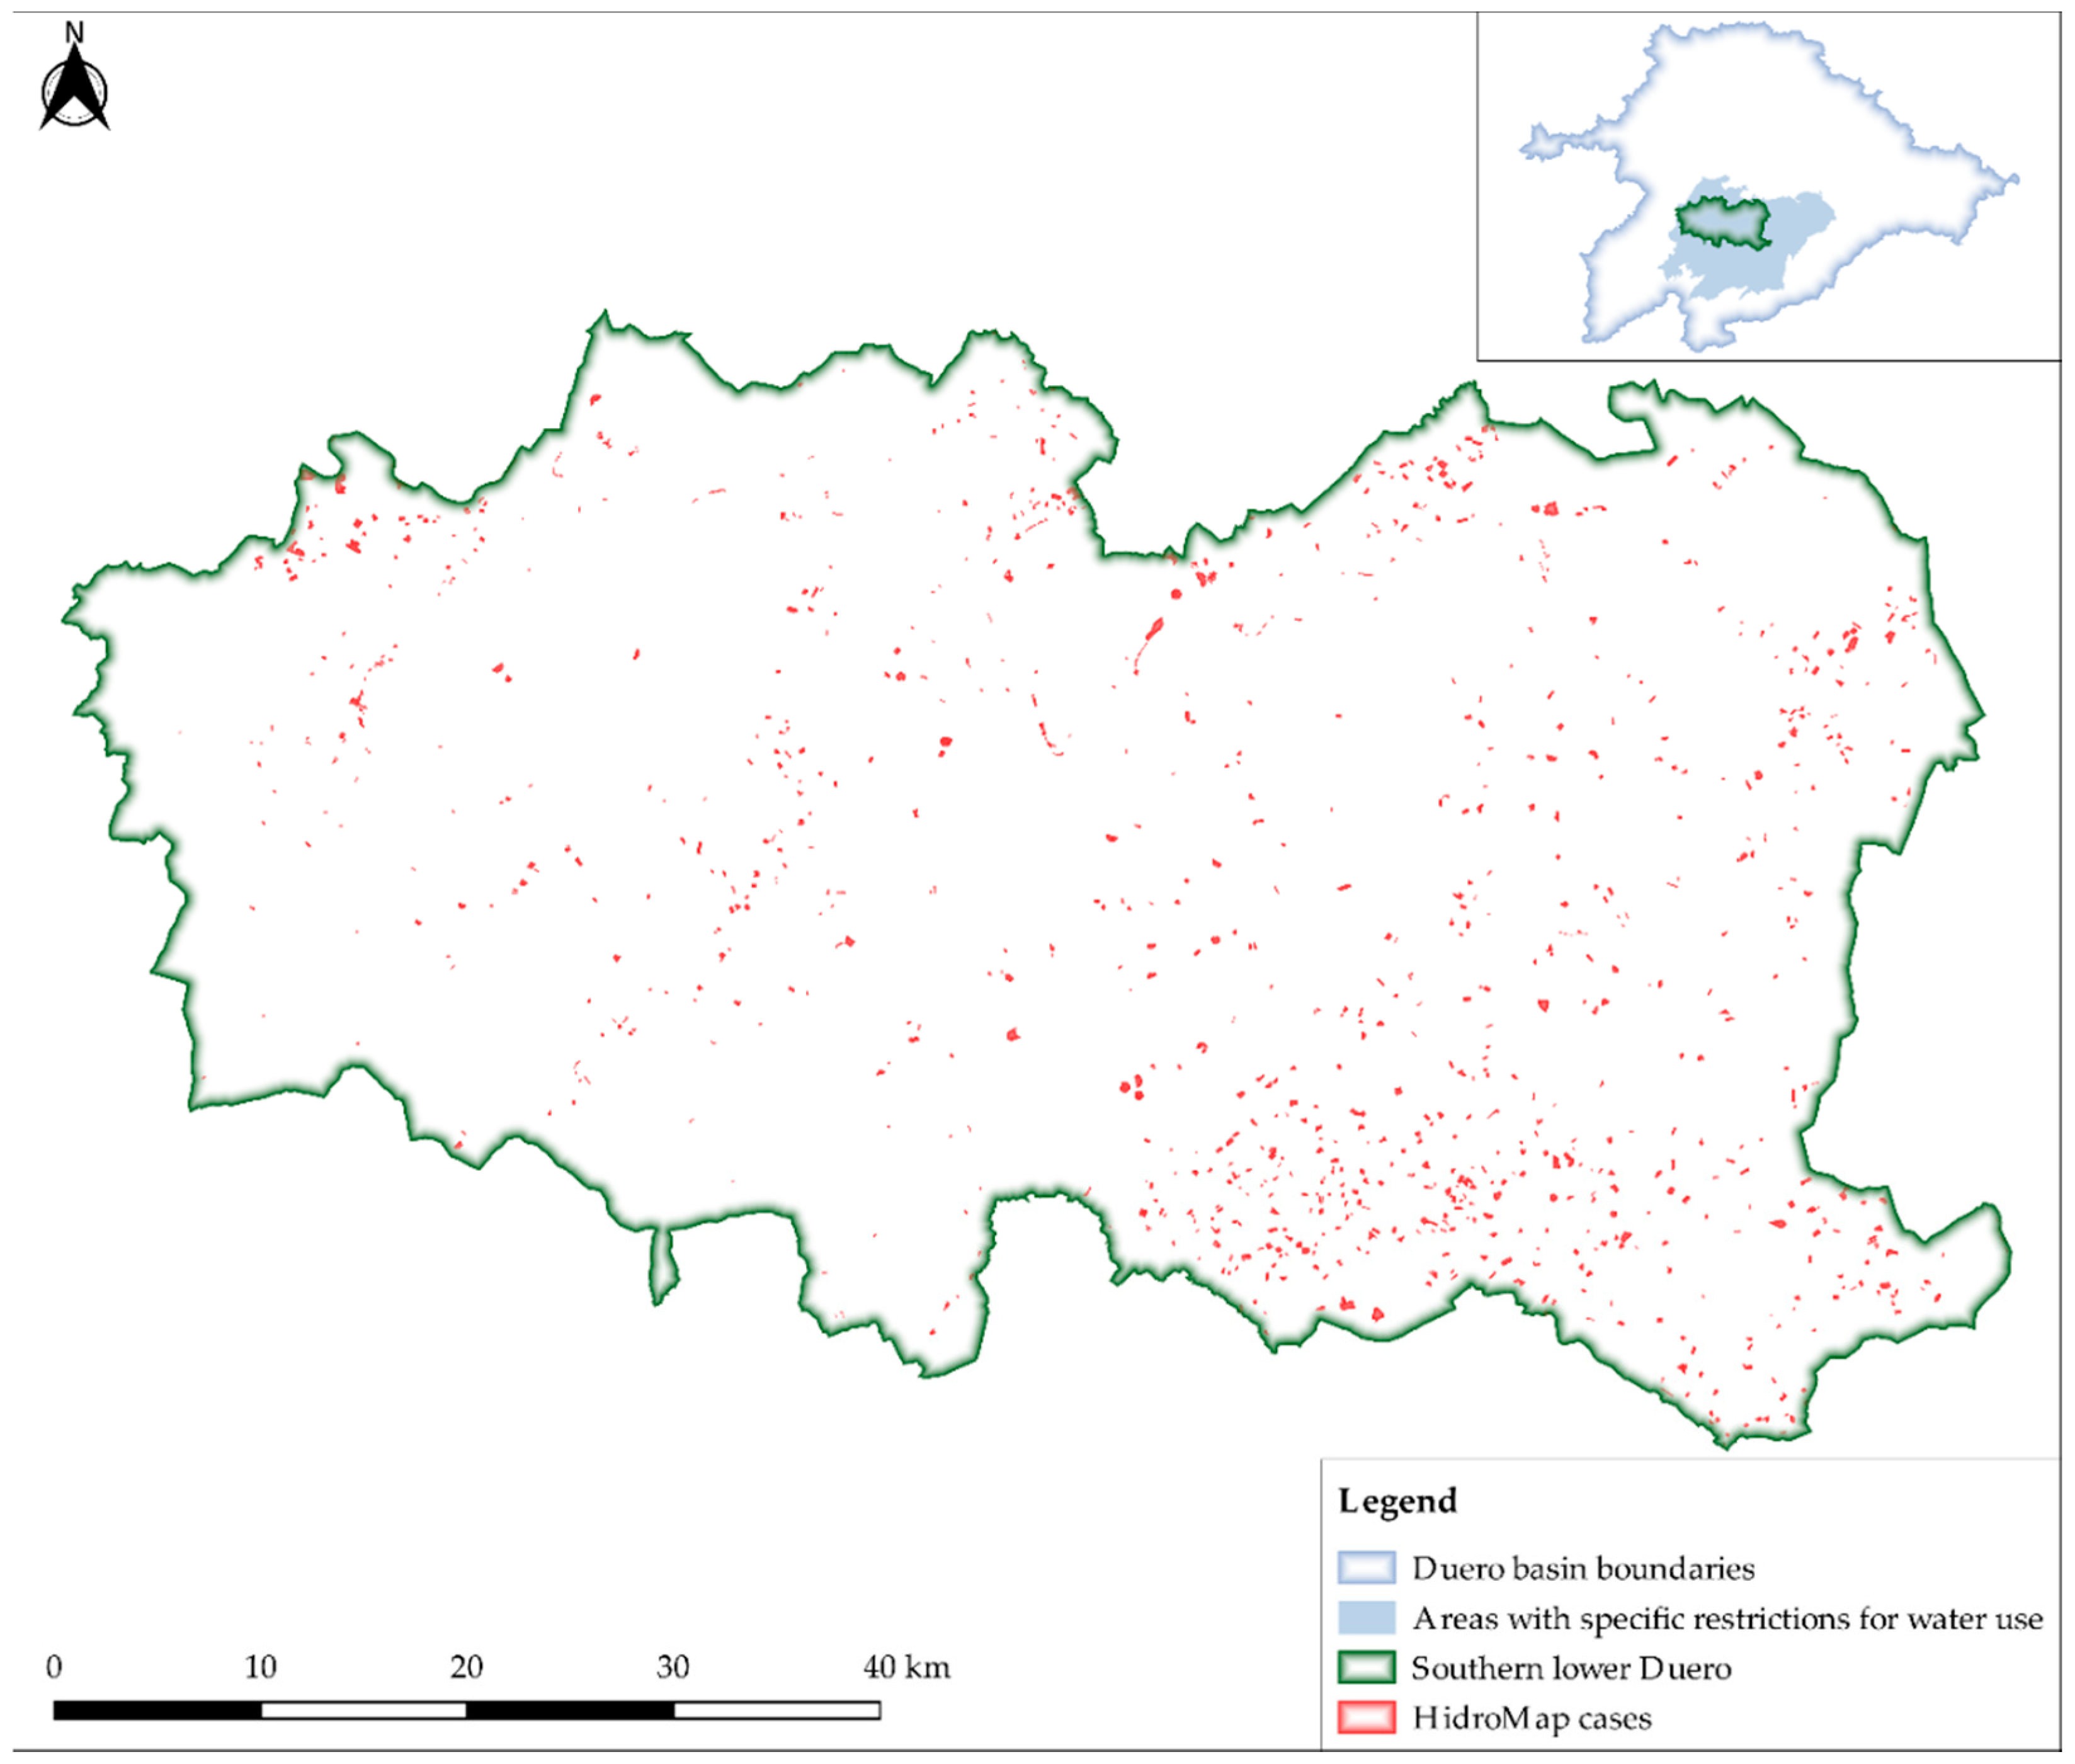
2. Study Area: The Duero River Basin

The study area selected for testing, evaluating and validating HidroMap was the part of the Duero Hydrographic Basin belonging to Spain (Figure 1). This area covers 78,859 km2 including 488,491 ha of declared irrigation crops [29,30].
The Duero basin has a continental climate and according to the UNESCO’s climate classification (1979), it is divided into 3 regions: a wet area located on the edges of the basin, a semi-arid zone in the center, and a semi-humid-semi-arid area placed between the two previous ones (Figure 1). The pluviometric regime is characterized by an average annual rainfall of 612 mm/year with high spatial and seasonal variability involving different ecosystems with high biological value. The average rainfall is 350–500 mm/year, 500–700 mm/year and 1400–2000 mm/year respectively in each climate region. Similarly, large temperature differences could be also found depending on the climate area, from an average of less than 6 °C, oscillating between 8 °C and 13 °C, and above 17 °C, being 10.7 °C the average of the whole basin. That is why it represents a handicap for managing and monitoring water sources and crops [31,32]. The hydrological year of 2016–2017, defined from 1 October 2016 to 30 September 2017, was classified as an extremely dry year by the National Hydrological Plan [30]. It was during this year that HidroMap was tested and validateed. It is important to highlight that this hydroclimatic variability involves a high vulnerability to environmental problems related to agricultural productivity, aquifer recharge, fires and soil degradation [33]. This is mainly due to the water deficit in summer, a pronounced irregularity in the rainfall regime (both temporally and spatially) and a noteworthy frequency of dry periods without appreciable rainfall. This hydrological variability takes place mainly in the Southern part of the basin [34,35,36]. In this context, it is important to develop a tool for sustainable water planning since the agriculture sector generates more than 80% of the water demand [32].
Therefore, testing and validating HidroMap in this area is a challenge, not only due to the large area covered by the basin but also due to its agroclimatic and hydrological variability. HidroMap was tested on the whole irrigated area of the basin, but also in those irrigated areas without irrigation rights (from here “cases”).

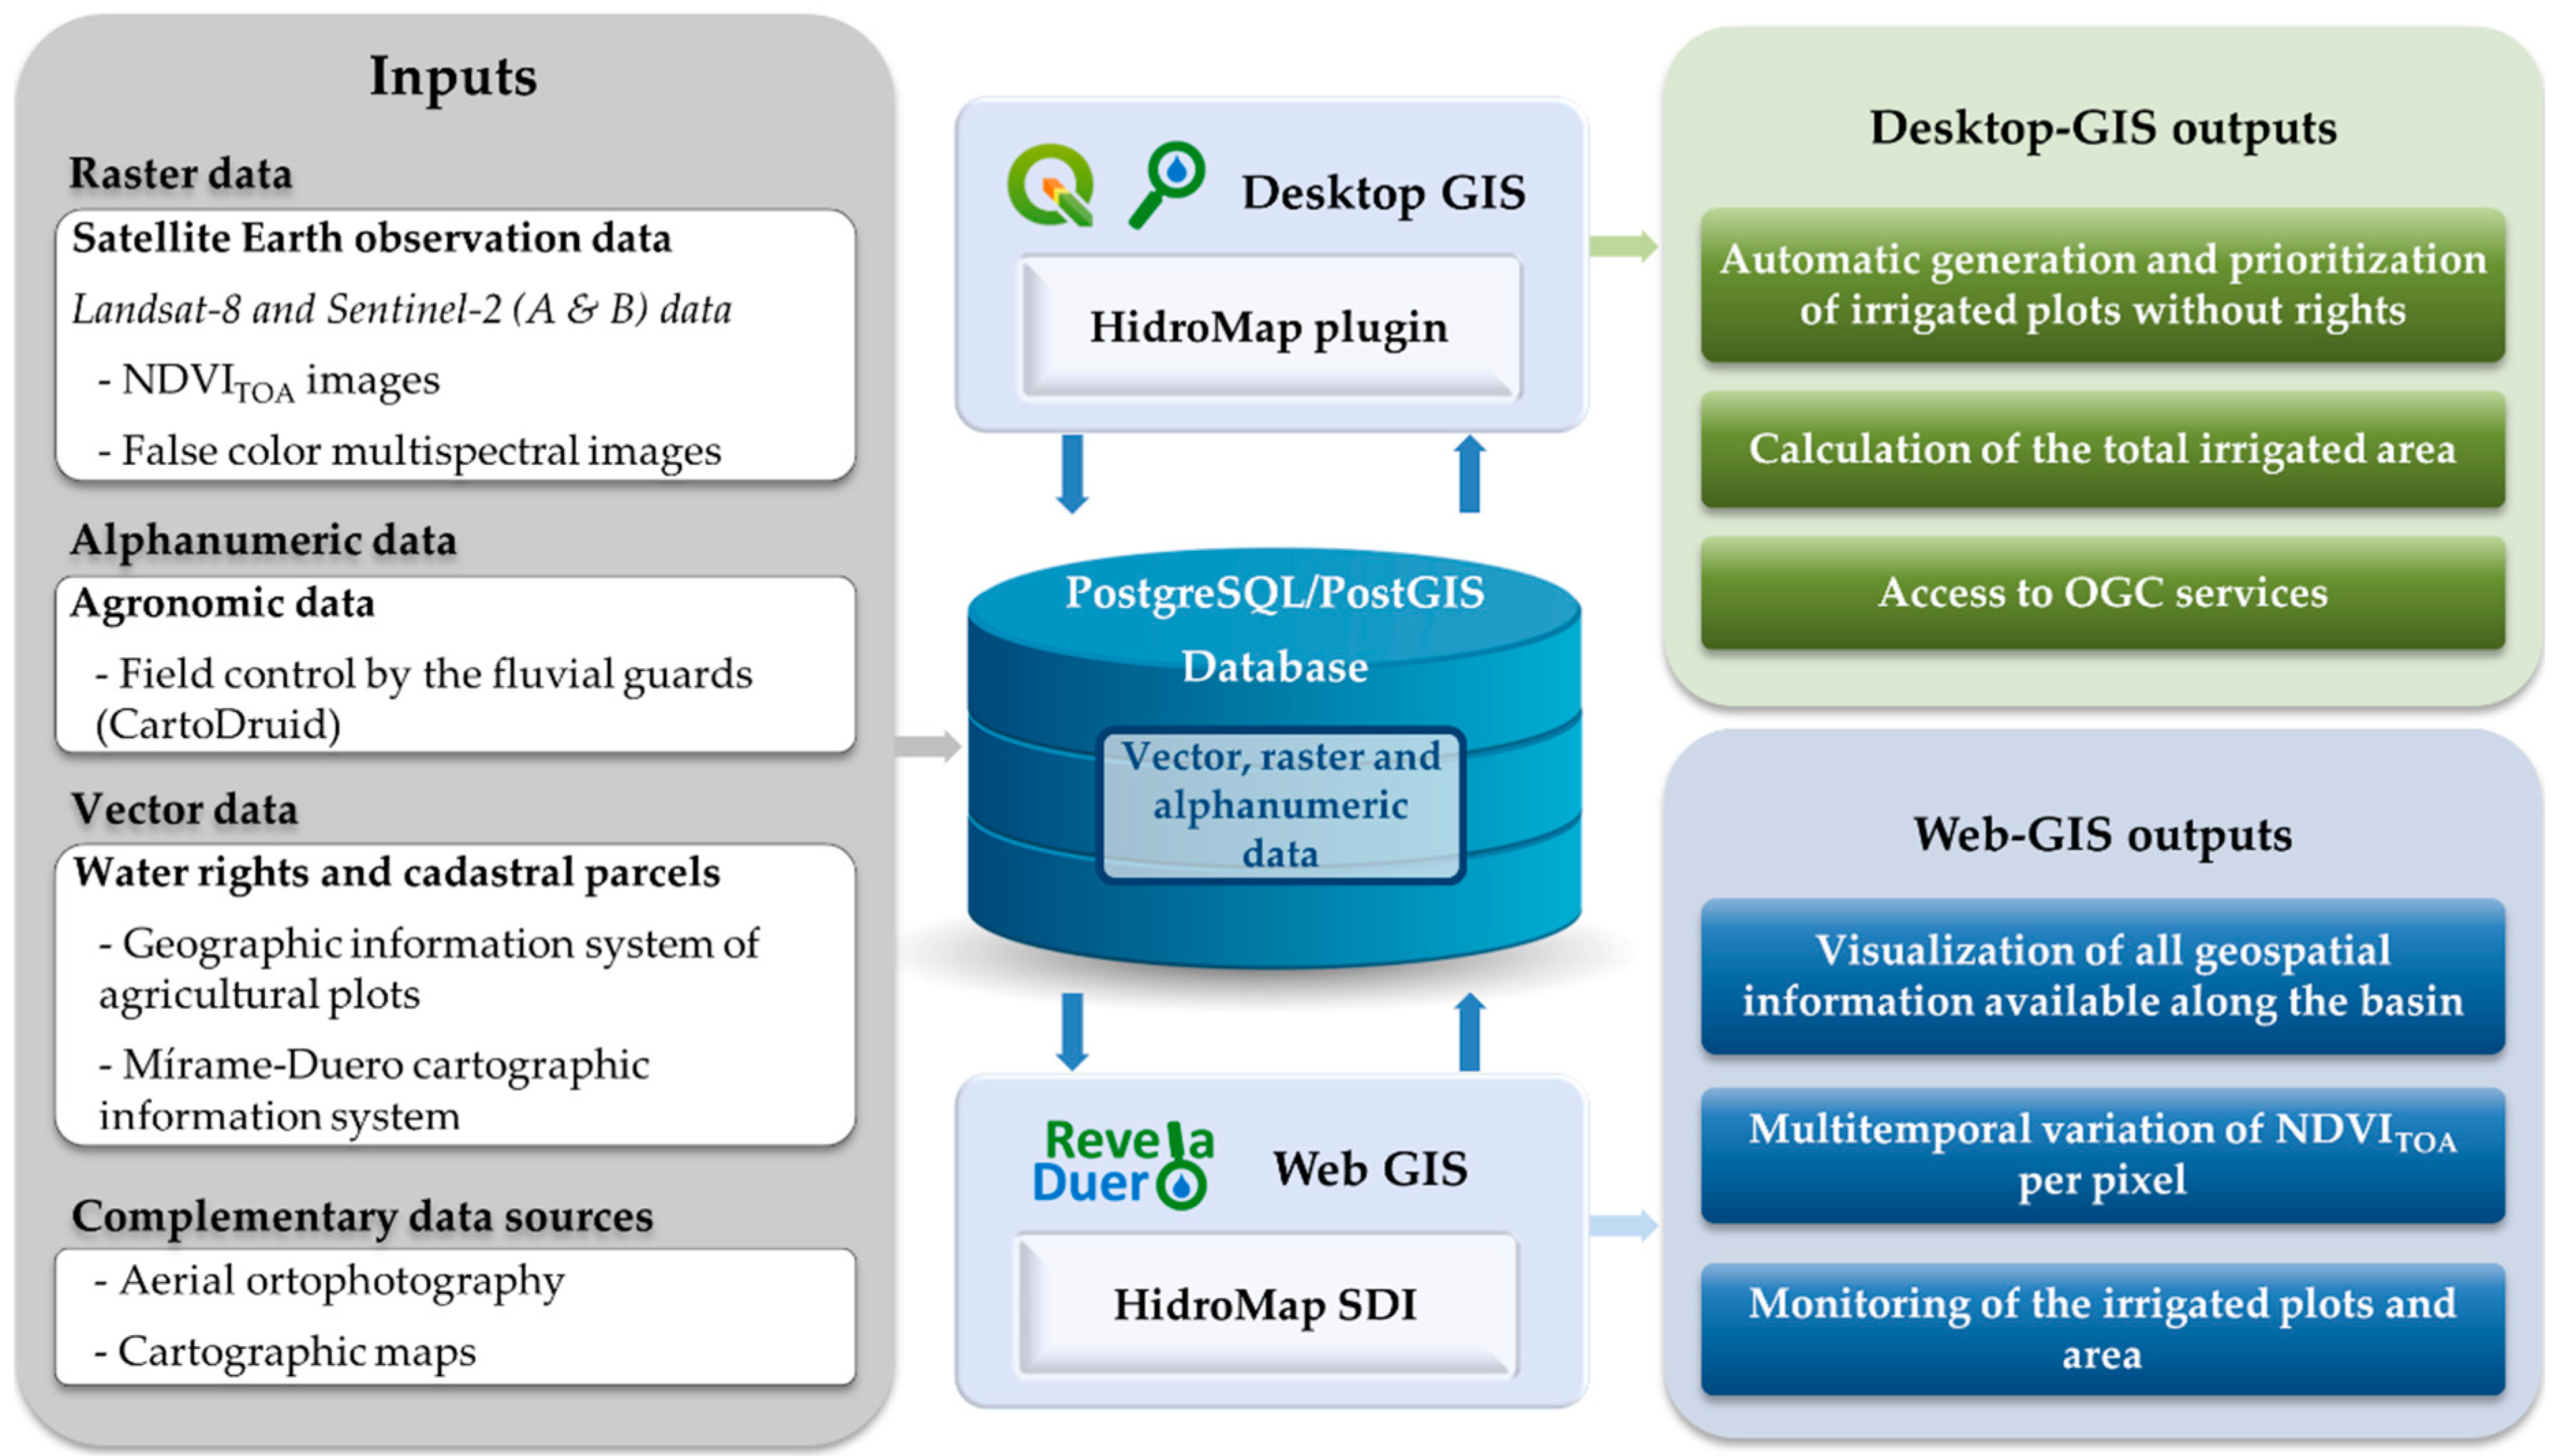
3. Materials and Methods

3.1. Data Description

HidroMap requires different kind of inputs, that is, raster, vector and alphanumeric, to be managed by a shared desktop-GIS and web-GIS environment. Mainly, the tool combines data from: satellite platforms, field agronomic inspections, cadastre and information about irrigation rights, among others.

3.1.1. Satellite Earth Observation Data

Landsat-8 (L8), fom the United States Geological Survey (USGS), and Sentinel-2 (S2), from the European Space Agency (ESA), were chosen as satellite image data sources to analyse the agricultural lands. An area of 170 × 185 km and 100 × 100 km was covered by every L8 and S2 scene respectively. Thus, 11 scenes from L8 (Path/Row: 200/31, 201/30, 201/31, 201/32, 202/30, 202/31, 202/32, 203/30, 203/31, 203/32 and 204/31) and 18 granules (belonging to orbits 37, 94 and 137) from S2 were required. S2 products were a compilation of elementary granules of fixed size along with a single orbit. A granule was the minimum indivisible portion of a product (containing all possible spatial brands). For Level 1C and Level 2A products, the granules, were 10,000 km2 ortho-images in ETRS89 UTM zone 30 N projection. With respect to the degree of data processing, Level 1T images were used from L8 and Level 1C from S2, both projected at EPSG 25830 (ETRS89 UTM zone 30 N). The spatial reference system was established by the Duero HPO since any official cartography product must be georeferenced under this coordinate reference system (CRS) in Spain [37].
This satellite data was downloaded and preprocessed automatically, as explained in the following point 3.2.1, under the CRS and time zone mentioned above, being the Duero HPO who selected the date range of interest for the analysis.
Since NDVI is the most widely used vegetation index to remotely monitor large areas and assess agricultural irrigation activity [38], it was integrated into HidroMap desktop tool. NDVI has been used to perform crop classification in many areas around the world with high accuracy in the discrimination between different types of crops with values of overall accuracy that could reach up to 90% [39]. After identifying irrigated plots, the final user should analyse the multitemporal variation of the NDVI through the Web-GIS module to determine the type of crop established and make decisions in this regard. In this study values of NDVI at the top of the atmosphere (NDVITOA) instead of at the bottom of the atmosphere (NDVIBOA) were analysed to avoid atmospheric corrections optimizing processing times as both indexes indicate, in a relative way, the health/vigour of vegetation. Both indexes, whether or not corrected for atmospheric effect, are ratios between the reflectivity values in the near infrared (NIR) and the red wavelenghths of th spectrum (1).
NDVI TOA = ρ NIR ρ RED ρ NIR + ρ RED ,
Being ρ NIR and ρ RED the TOA reflectivities at the near infrared and red wavelengths corrected from solar angle.
In addition of NDVITOA images, false color images were created to visualize irrigated crops and water areas. The combination of bands for the false color imagery which represented crop areas were 6/5/4 for L8 and 11/8/4 for S2 (Table 1). For visualizing water areas, 7/5/3 and 12/8/3 band combination was used for L8 and S2 respectively. Table 1 detailed the main characteristics of the bands selected for each satellite platform.

3.1.2. Agronomic Data

Field inspections were performed to detect irrigated plots, validate the results obtained by HidroMap but also to calibrate the model to ensure accuracy results. These inspections also allowed to collect info regarding crops. This task was performed by the River Surveillance Agency (RSA), which belongs to river basin authority. Through a customized CartoDruid application [41], the RSA collected agronomic data the type of crop inspected, its phenological stage (emergence, jointing, heading, soft dough and ripe) and the irrigation system used.
All this data was stored in a SpatialLite database [42] through the CartoDruid app. The incorporation of this data into the HidroMap system was automatic since an analogous model to the one implemented in the PostgreSQL/PostGIS database was designed with that aim. Therefore, HidroMap desktop-GIS environment allowed an automatic generation of reports including agronomic information and cartographic maps to assist the RSA inspections during the 2017 irrigation campaing.
Regarding roles, only HPO users currently have autority to view and either change or add any relevant agronomic data.

3.1.3. Water Rights for Irrigation

The Duero Hydrographic Confederation had its own web-GIS system, named Mírame-Duero [43]. It included, among many other products, vector reference layers with information about water rights for irrigation. This information was constantly updated. HidroMap used not only the most recent and current copy of that information but also the most recent available satellite data to perform the analysis.

3.1.4. Cadastral Parcel Information

The Geographic Information System of Spanish Agricultural Plots (SIGPAC) [44] allowed us to identify all declared plots for cultivation and their cadastral information. This information was necessary to identify and register all irrigated plots, with or without rights for irrigation, within the same GIS environment. Thus, SIGPAC (Geographic Information System of Spanish Agricultural Plots) was considered as a reference cartographic information for the digitization of the HidroMap cases.

3.1.5. Complementary Data Sources

There were many other complementary data sources that helped interpret, locate and visualize results. Especially, several vector layers with information about the basin demarcation, urban centers, and divisions of the basin to be inspected by the RSA, areas with particular irrigation features and areas with specific limitations were used. In addition, the most recent orthophotos from the National Plan for Aerial Orthophotography (PNOA) [45], offered by the Spanish Geographic Institute, were used as a cartographic base for visualizing and printing reports.

3.2. Methodology

A proper methodology was required to process all data in an efficient and accurate manner (Figure 2). HidroMap engine is a PostgreSQL/PostGIS database and the methodology implemented (Supplementary Materials) converges in a dual GIS environment with the goal of: (i) managing all required information to perform the analyses; and (ii) visualizing and monitoring results in this regard.

3.2.1. Data Acquisition and Pre-Processing

The first step of the methodology is the acquisition and pre-processing of all the data required to be analysed together. Three processes are involved:
1. Automatic download and preprocessing of Earth observation images
A specific script was developed to report the available Earth observation data along the basin regarding the temporal resolution of each platform (L8 and S2). This script also allows to pre-process raw downloaded images to obtain (i) NDVITOA images and (ii) false color images to highlight crop and water areas for both platforms. NDVITOA ranges from −1 to 1 (see Equation (1)), being values close to 1 those that correspond to dense and healthy vegetation. This behaviour is due to the radiation absorption/reflection by the photosynthetic pigments of plants at the different spectral ranges. Less dense vegetation areas are described by close to zero NDVITOA values, and negative values occur when free water surfaces and clouds are represented. These NDVITOA images are the basis of both HidroMap modules, desktop-GIS and web-GIS, thanks to which agricultural plots with a high probability of being irrigated can be detected and analysed.
Both USGS and ESA provide services for querying and downloading L8 Level 1T and S2 Level 1C products. In both cases, these services could be used through application programming interfaces (API), so the developed approach made use of these interfaces.
First, a query is made in order to obtain the list of L8 Level 1T and S2 Level 1C available products for both the area of interest and the time range. This time range includes the 20 days prior to the exact date of the query. For the S2 products, the query is made to the “Copernicus Data Hub” using the OpenSearch protocol [46]. As for L8 products, the query is made to the USGS search and download service [47].
Afterwards, the following actions were automatically carried out to obtain the pre-processed products and publish them in the web-GIS tool viewer:
  • Download S2 Level 1C and L8 Level 1T products using the previously provided URLs by the query.
  • Registration of downloaded products in the system catalog.
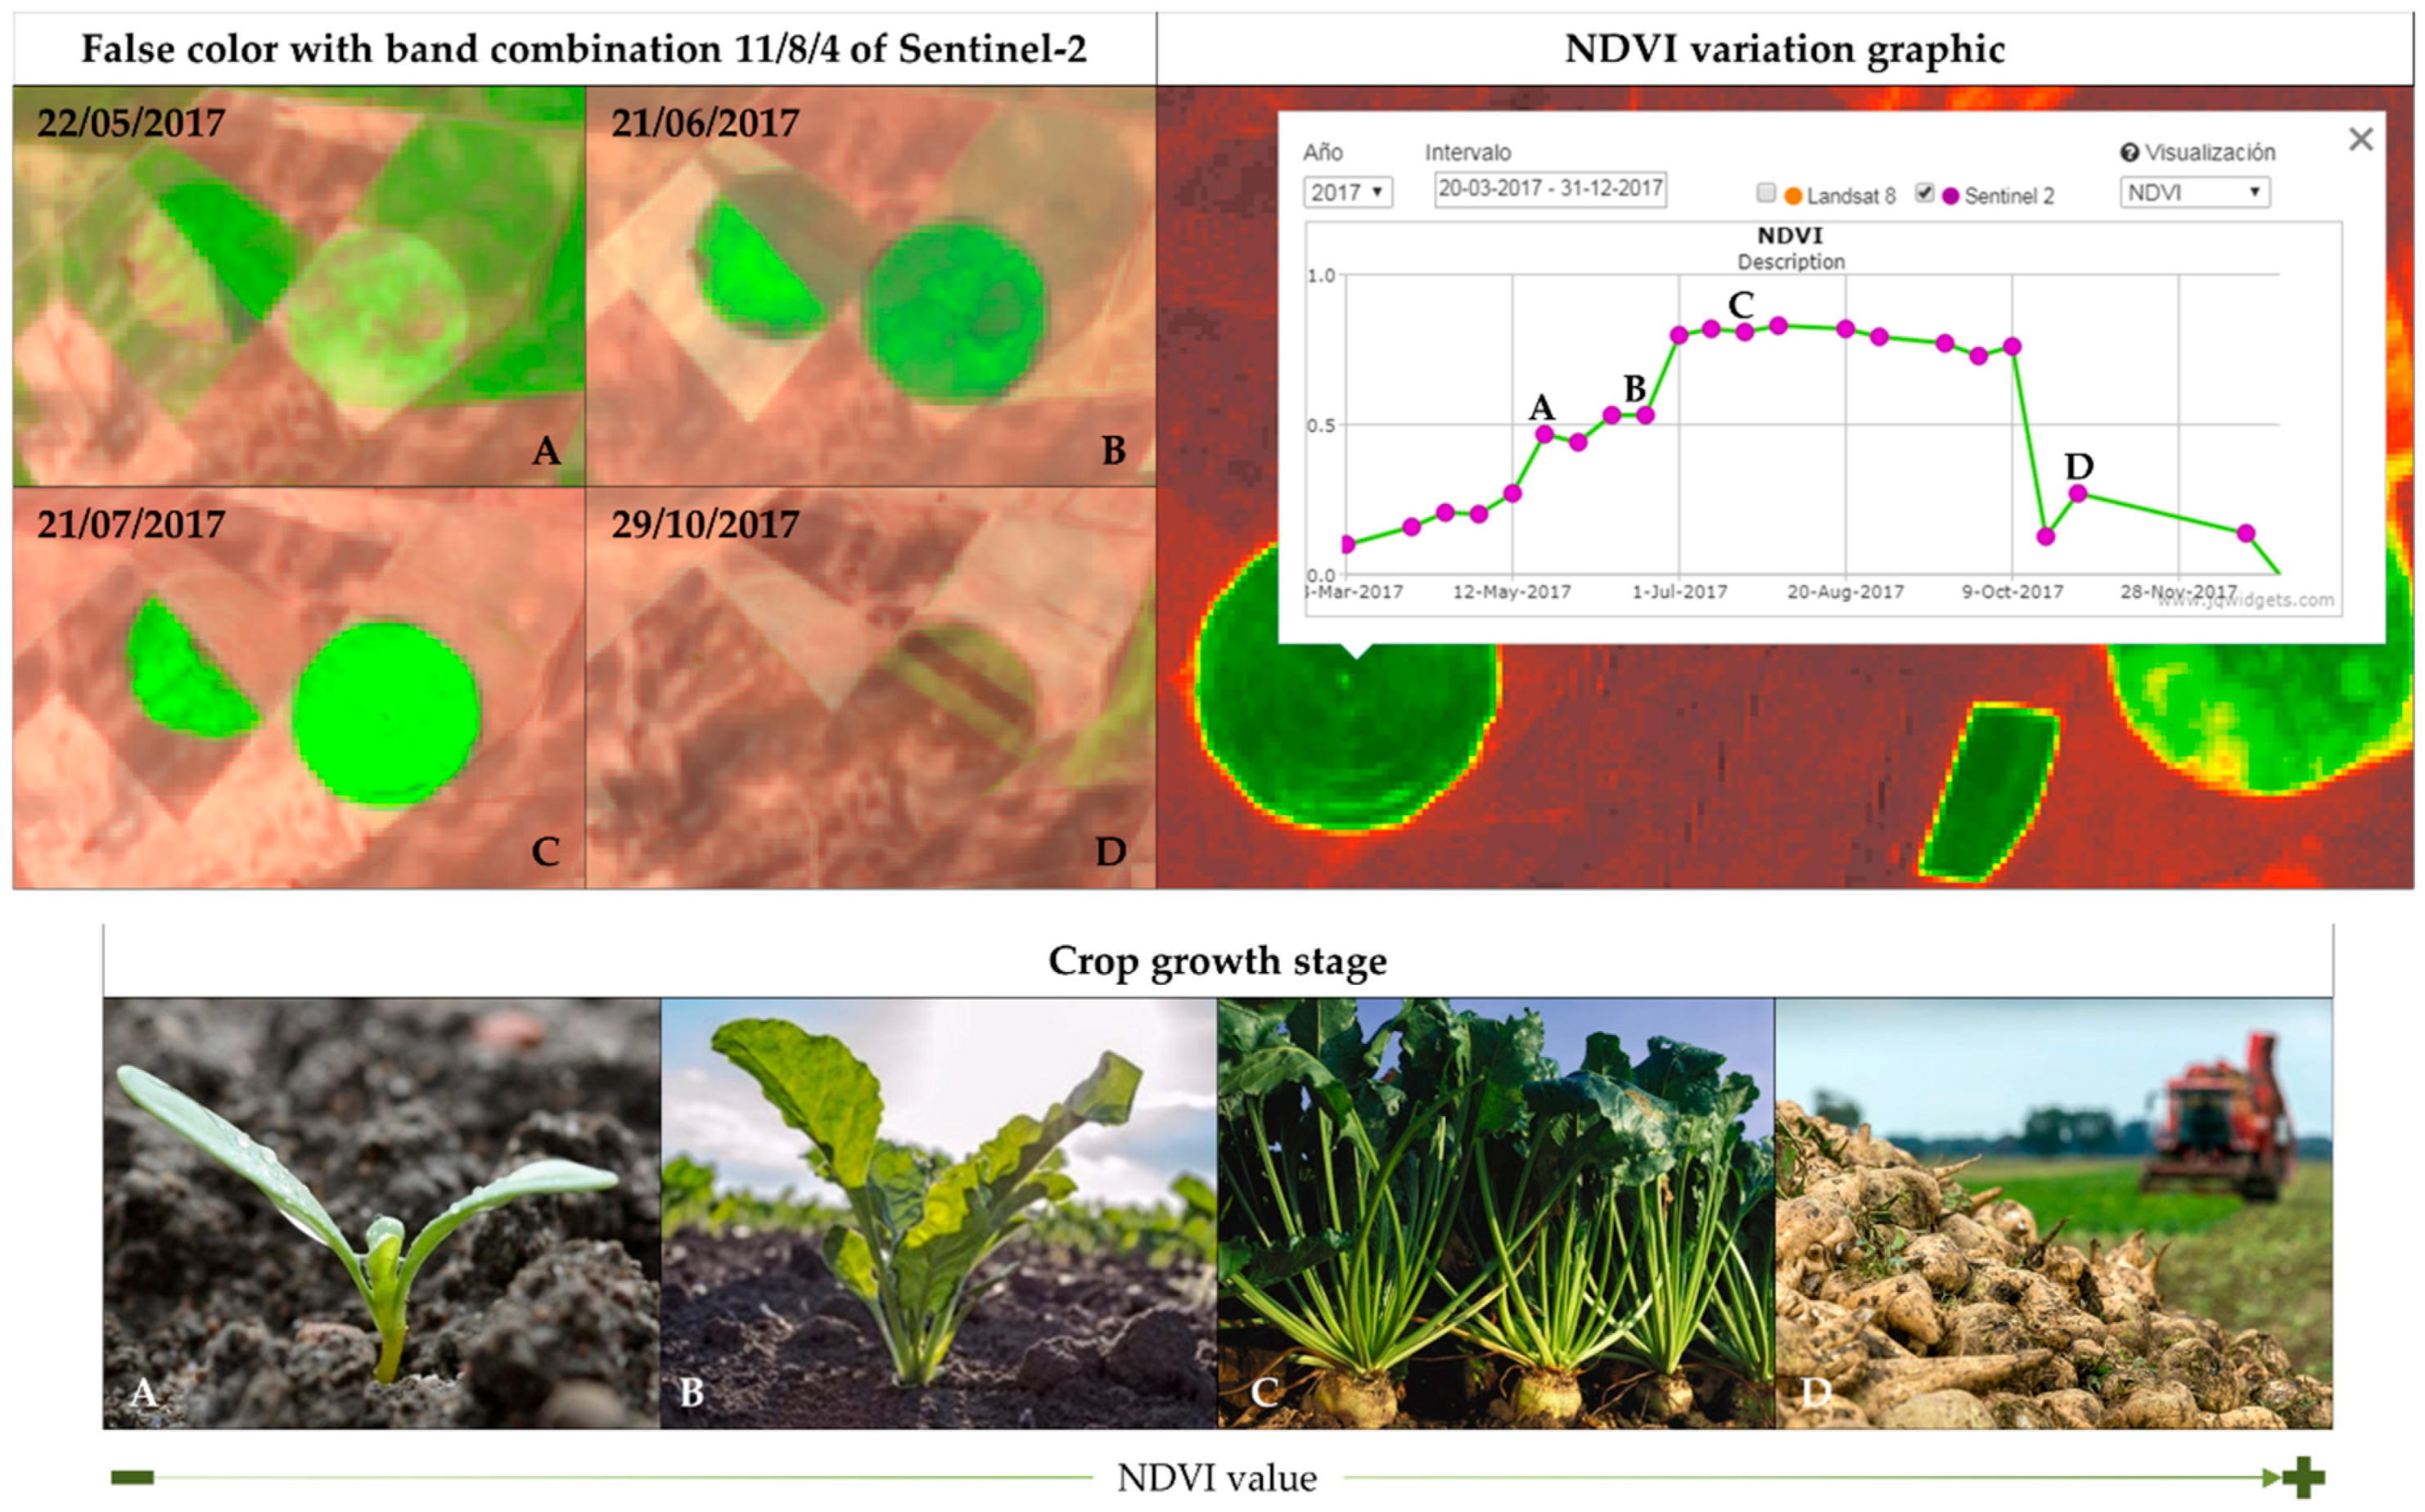
  • Calculation of RGB (Red, Green and Blue) false colour images through the combination of the specific bands for each sensor: 6/5/4 and 7/5/3 for L8, 11/8/4 and 12/8/3 for S2, for highlighting crops and water areas respectively.
  • Calculation of NDVITOA images (1).
  • Registration of the previous pre-processed products in the system catalog.
  • Publication of the pre-processed products in the web-GIS tool viewer through the map server (geoserver).
2. Division of SIGPAC information by municipalities
The SIGPAC information originally consisted of more than 11 million agricultural plots within the 9 provinces of the study area. Thus, a hierarchical structuring of this information was required and performed. A division of the municipalities was made by creating a PostgreSQL scheme with 2067 spatial tables, deleting the original information and hence avoiding data duplications and overlapping. This process guaranteed both an optimal management and visualization of the cadastral divisions and the geospatial intersection of layers.
3. Integration of all initial information in the PostgreSQL/PostGIS spatial database
All inputs required the design of an adequate spatial database. Specifically, a PostgreSQL alphanumeric database with a PostGIS spatial extension was designed to optimize users’ management and transfer all the information between both tool modules as thick and thin clients. The design also included the management of user accounts and roles, controlling the access to the resources depending on the user in each case, personnel from the HPO or RSA. Desktop-GIS and web-GIS modules consumed and stored information in this database

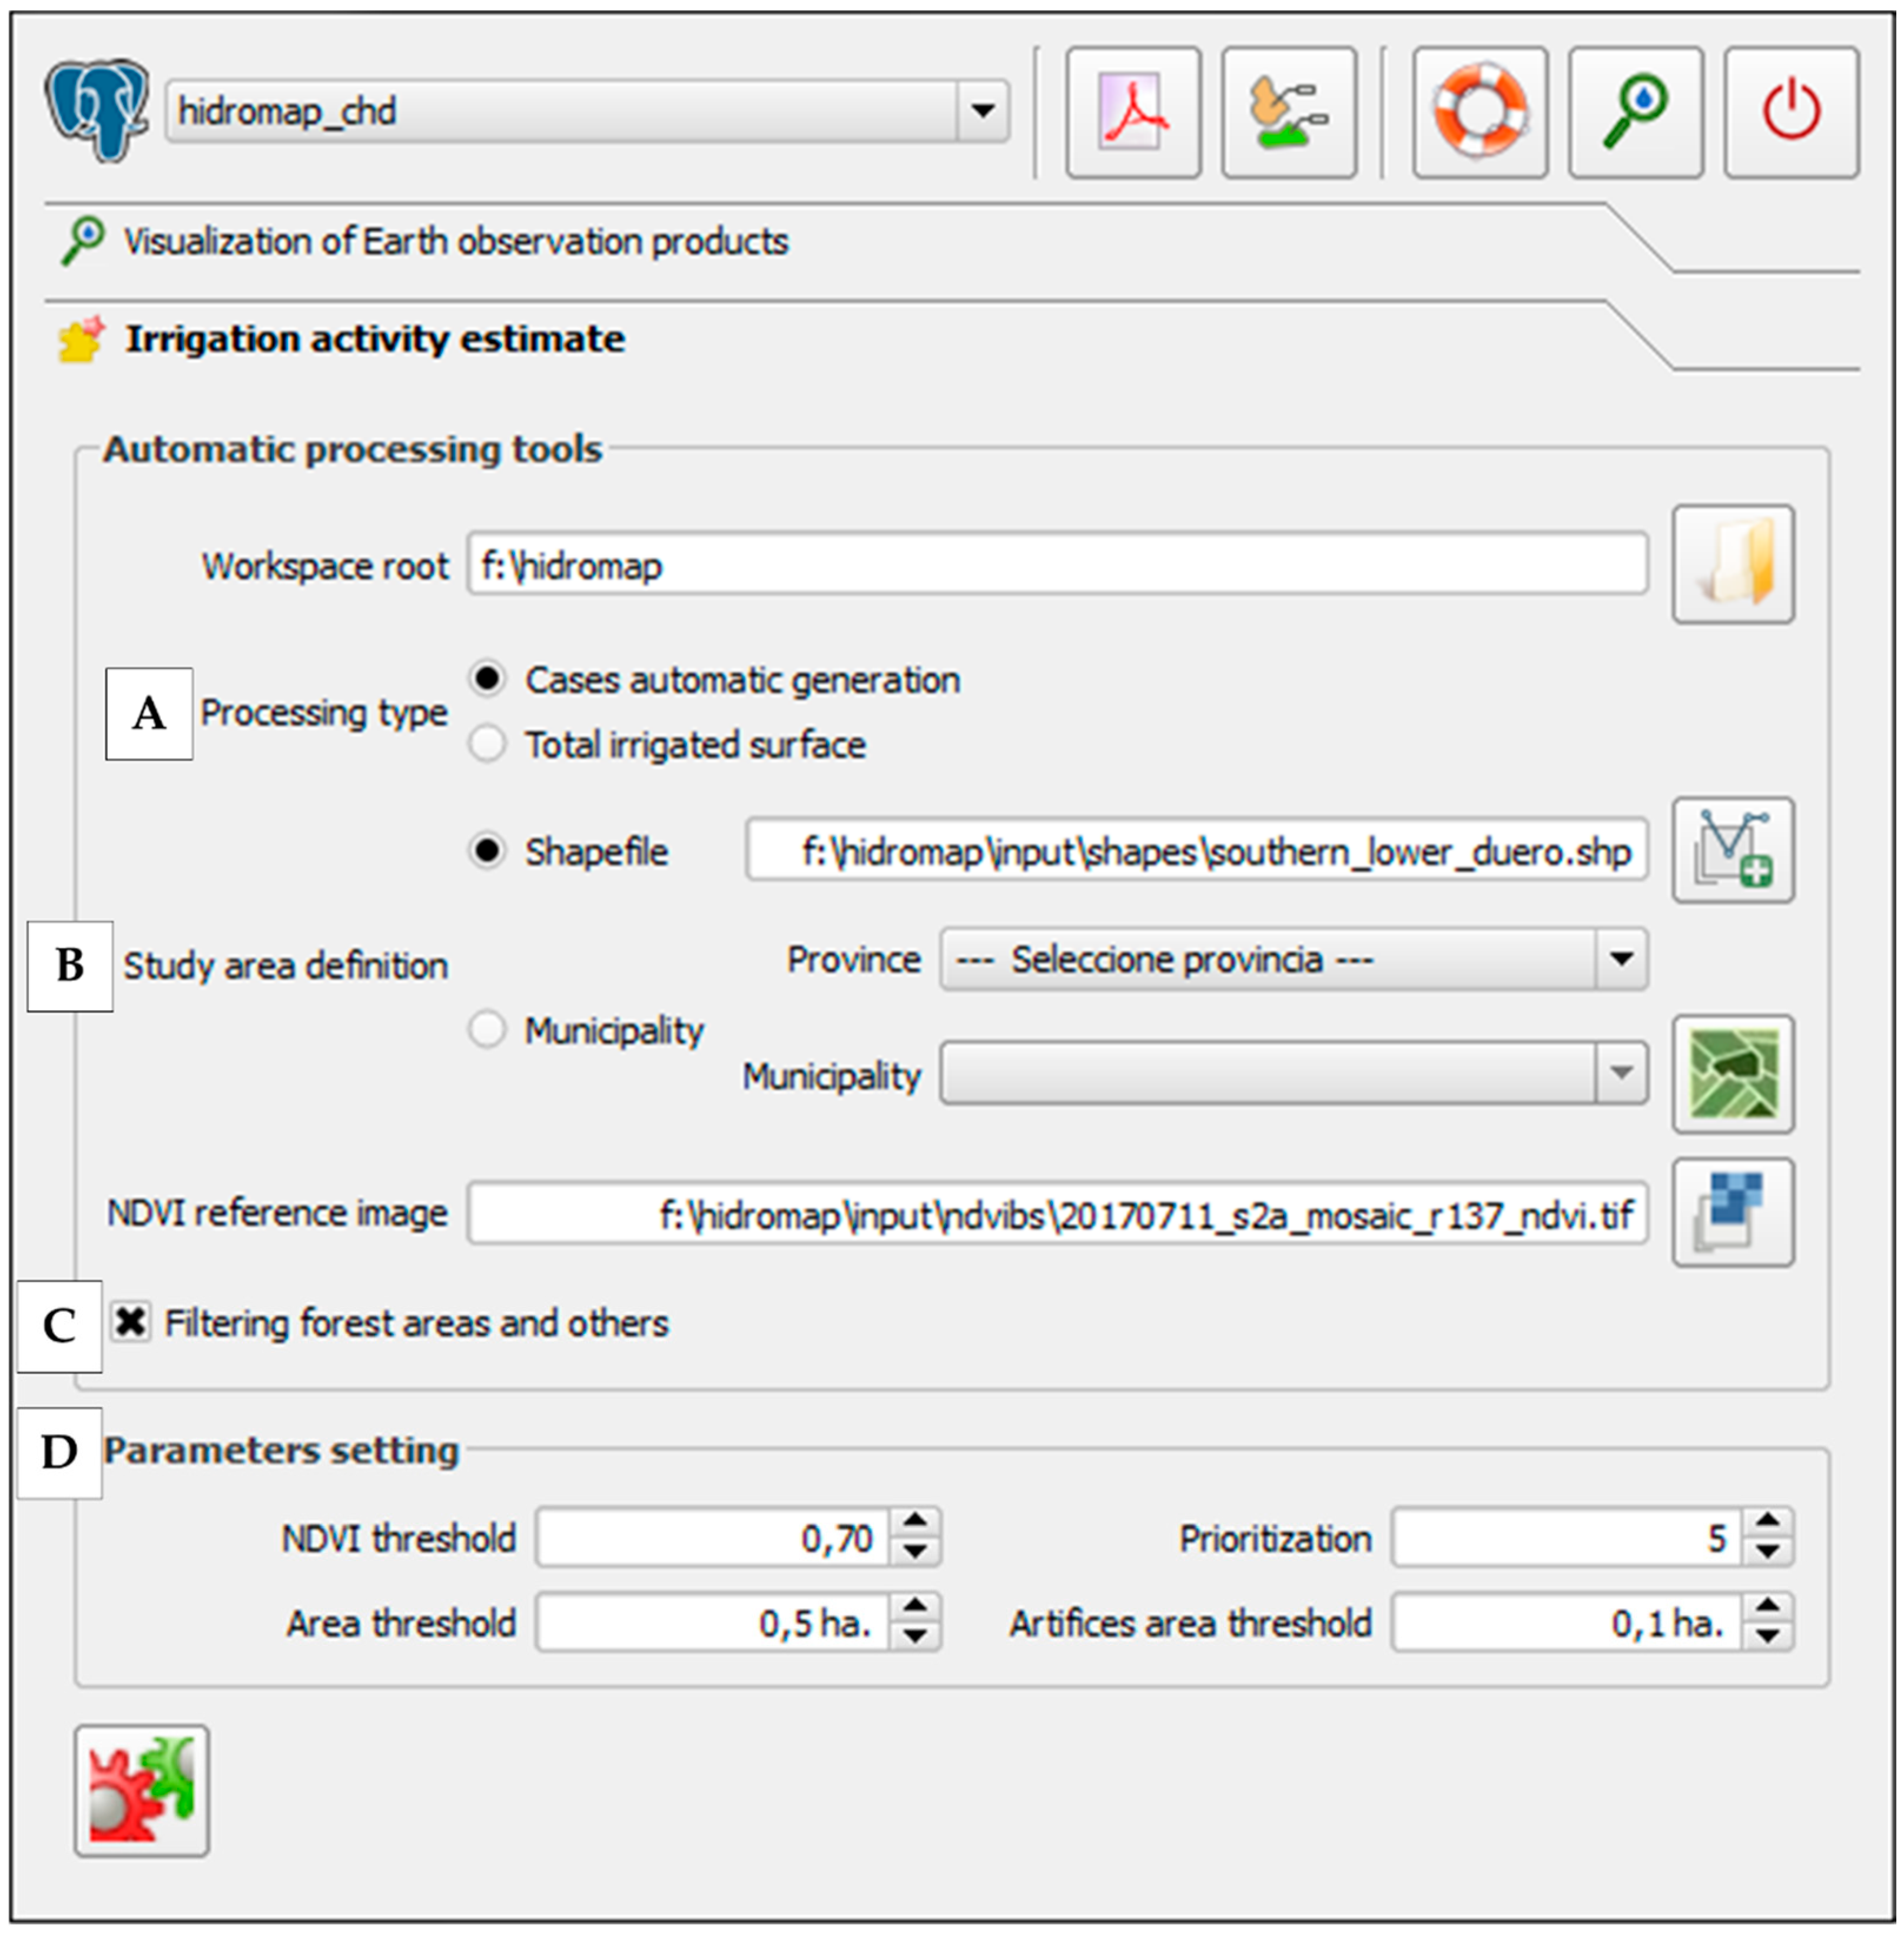
3.2.2. Desktop-GIS Module

The main functionality of the HidroMap desktop-GIS environment was to support HPO managing the irrigation activity from a quantitative point of view. In addition, it facilitated communication between HPO and RSA. The tool was developed with Python programming language for QGIS (PyQGIS).
Specifically, it allowed us to automatically perform three different processes through an intuitive user interface (Figure 3): (i) detecting those agricultural plots with non-regulated irrigation activity; (ii) prioritizing them based on different parameters; and (iii) estimating the total irrigated area and agricultural plots involved for an area of interest. Thanks to the prioritization, it was possible to detect the most relevant cases by establishing more or less restrictive criteria based on different parameters, prevailing the larger areas. Apart from these three main functionalities, it also allowed:
  • To access and manage the PostgreSQL/PostGIS database with permission for such purpose by users.
  • To visualize products derived from Earth observation data for different dates.
  • To automatically generate reports, maps and support material.
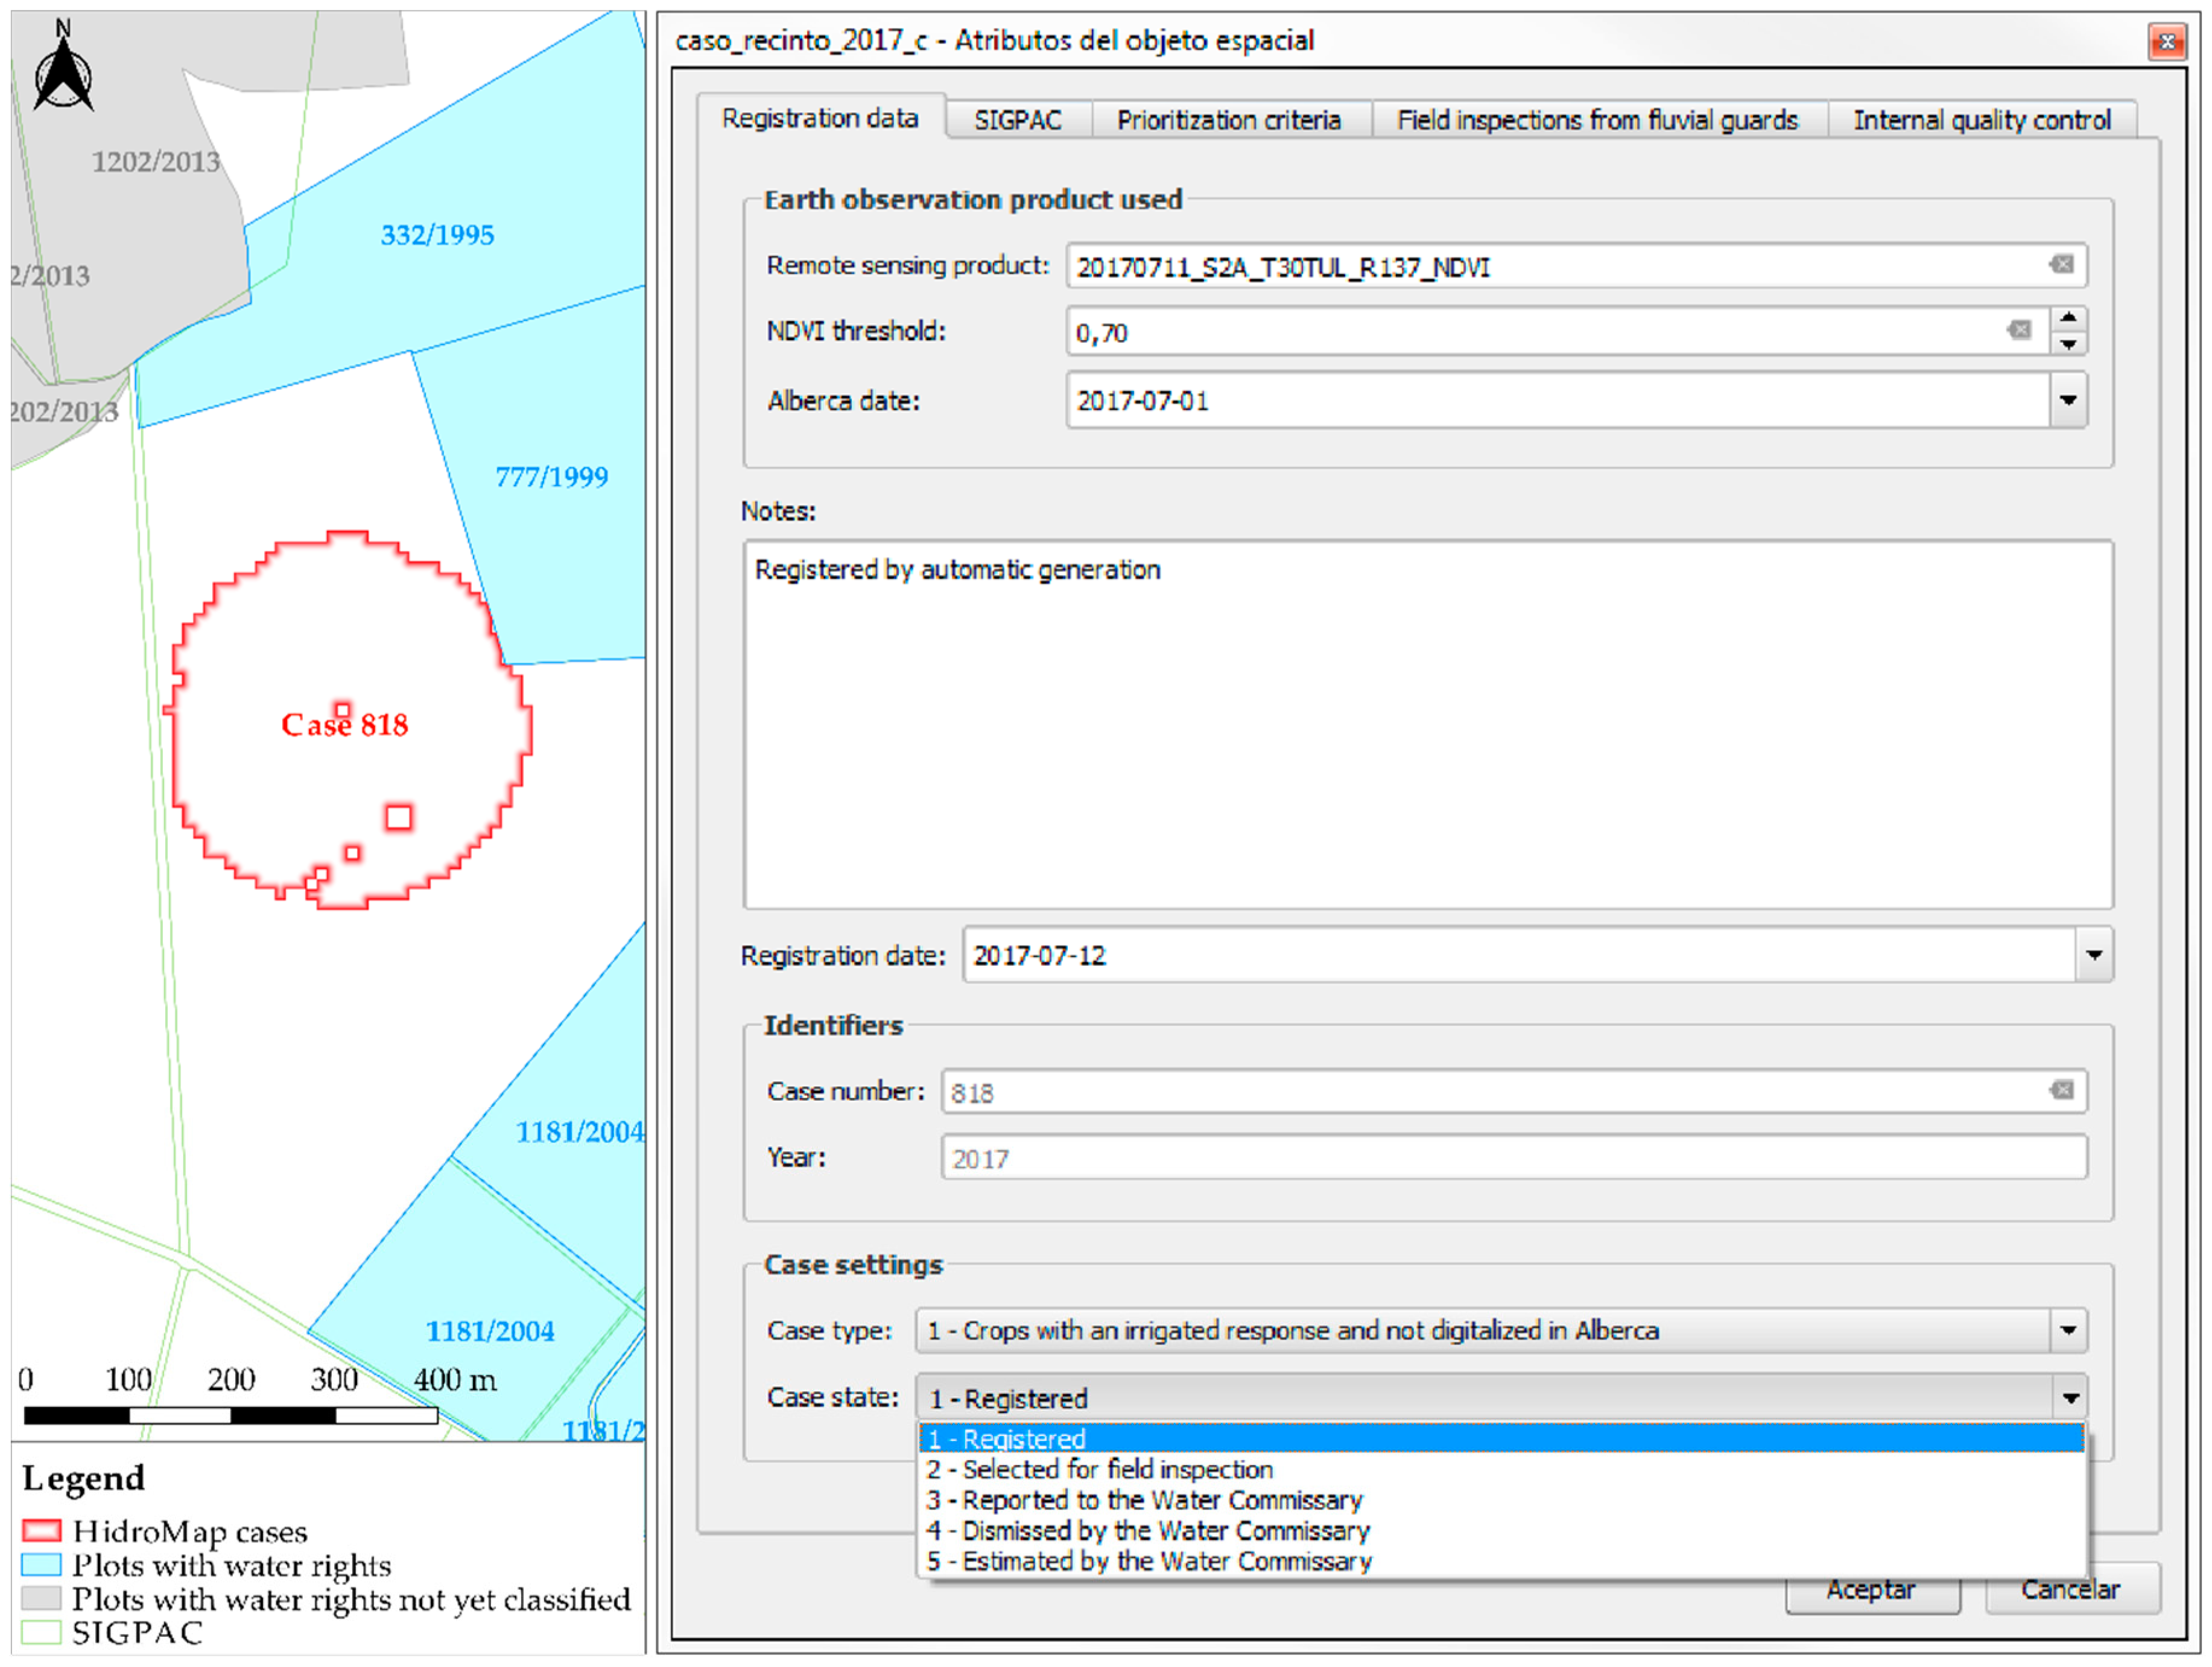
  • To incorporate information about cases and relevant data from field inspections in the database through forms designed for that purpose.
  • To consult and visualize results from different dates to carry out temporary controls.
The algorithms implemented in this tool module took advantage of all the available geo-processing tools in QGIS (gdal and the System for Automated Geoscientific Analyses, SAGA) since they allow effective spatial intersections between several layers as well as different calculation operations. Figure 4 shows the inputs required, processes implemented and the outputs of the HidroMap desktop-GIS module. A specific area of interest defined by a shapefile or by establishing a municipality from the database was part of the inputs required together with the NDVITOA image of the date of interest.
First, the total irrigated surface and number of plots involved could be obtained. The next step is the SAGA spatial difference algorithm, intersecting initial results with several layers provided by the Duero Hydrographic Basin. Moreover, this process was enhanced in order to take out all the invalid and incorrect geometries generated per intersection. After the geometric validation, a final shapefile with all cases is generated. These cases hold all the information about SIGPAC cartography and fluvial guard sectors involved and the hierarchization according to the established priority. Outputs from every sub-process may be added to QGIS map canvas with a settled style so the user was able to analyse all of them.
The three main functionalities offered by the HidroMap desktop-GIS environment are described hereafter:
1. Detecting those agricultural plots with non-regulated irrigation activity
As already mentioned, thanks to the algorithm implemented in this module, it was possible to detect, with a single mouse click, the non-regulated irrigation activity that was being carried out in a specific area of interest (defined by the user) and for a given date. In addition, thanks to the availability of cadastral information integrated into the database, it was possible to extract all this information for each individual agricultural plot and observe temporal evolution of irrigation activity. This process can be performed for each NDVITOA image, free of clouds and every 5 days (thanks to the temporal resolution offered by the Sentinel-2B platform).
The tool allowed final users from HPO, who were previously formed in this matter, to define the NDVITOA and the minimum surface area (ha) as thresholds, determining if a plot can be identified as a case or not. However, by default, 0.7 was established as the NDVITOA threshold and 0.5 ha as a minimum surface. In addition, the tool allowed filtering those SIGPAC plots whose use was assigned as forestry or non-agricultural lands.
All cases detected were stored in a vector layer with the following linked information per case: province and municipality belonging, SIGPAC identification, geographical coordinates, surface (ha), defined NDVITOA threshold, date of generation, NDVITOA image identification, satellite sensor and the priority of the case within all those detected (Figure 5). HPO users can finally consult and either change or add any additional data.
2. Prioritization of cases
Regarding the prioritization of cases, HidroMap desktop-GIS module allowed to hierarchize all cases detected according to different criteria. For those cases detected during summer irrigation period in 2017, the Duero Hydrographic Confederation established the severity of cases based on the total irrigated area (cases type A) and the distance to the nearest regulated well (cases type B). In addition, agricultural plots with both a concession lower than 7000 m3/ha/year and a surface larger than 9 ha were also classified as cases to be investigated with more priority (Article 54.2 of the Spanish National Water Law; cases type C).
Thanks to the tool versatility, it was possible to detect the most severe cases for different areas of interest, that is, the entire basin, a municipality, a river or any other area defined by a shapefile. HidroMap also stored the story of all detected cases. Then recurrence of illegal irrigation controlling can be performed. The number of cases to be prioritized (set as 5 by default) was adaptive and may be defined by the user.
3. Estimating total irrigated area and agricultural plots involved in an area of interest during a period of time
It was possible to estimate the irrigation activity that was being carried out in a specific area of interest and for a given range of dates. It did not require crossing results with layers about irrigation rights or SIGPAC information controlling temporal patterns of irrigation activity in an area of interest. The estimation result was displayed in a pop-up window.
The interface not only allowed to select the area and period of interest but also adapting the irrigation activity indicator, the NDVITOA threshold.

3.2.3. Web-GIS Module

The HidroMap web-GIS environment supports RSA tasks by visually monitoring in near-real-time not only the irrigation activity but also type of crops and crop growth. It was implemented through Open Geospatial Consortium (OGC) services and all the information produced by the desktop-GIS module was stored in the database. Both WMS (Web Map Service) and WCS (Web Coverage Service) services were implemented so derived products from both satellite platforms (RGB false colour images and NDVITOA images) could be visualized from the desktop and web-GIS tools. WMS temporal dimension (WMS-T) was also consumed so the user could request the specific date range of interest for which the products will be displayed.
As shown in Figure 6, the user could quickly visualize all available Earth Observation products (NDVITOA and false colour images for L8, S2 or both) for any area of the basin fettered by the bounding box of the viewer and the period of time selected on the timeline provided. Also, the user could see a multi-temporal evolution of the NDVITOA of different crops through a graph just by clicking a pixel. In addition, some cartographic layers such as the plots with irrigation rights and declared crops to the Common Agricultural Policy (CAP) [48] can be displayed in order to analyse different information sources. In this way, this tool module contained very useful information and served as a consulting and complementary environment to the desktop-GIS module.
Specifically, the web-GIS tool was developed with the aim of being used by agronomic specialists of the river basin organization. Since variations of NDVITOA values through time were related to the different phenological stages [38,39,49,50,51], they were analysed (as later shown in Figure 9) and used as support to the decision-making process. Thus, experts can determine with high accuracy the type of crop grown in each plot. In this way, resources of the river surveillance service could be optimized, avoiding late field inspections of already harvested crops.

4. Results

The main results derived from the use of HidroMap in the Duero Hydrographic Basin in 2017 summer irrigation period (June–September) are presented, detailing results derived from the use of desktop-GIS tool for managing irrigation activity and from the use of the web-GIS environment for visualization, interpretation and multi-temporal crop monitoring.

4.1. Derived Products from the Desktop-GIS Environment

Selected thresholds were: 0.7 for NDVITOA value and 0.5 ha as minimum plot area to detect. 4097 cases were detected, 1110 of them located in an area with limited irrigation activity due to drought. The total irrigated surface without water concession was 7120 ha. The largest case occupied 39.26 ha and the largest distance to the nearest regulated well was 4.7 km. Finally, the largest plot that infringed the Article 54.2 of the Spanish National Water Law had 3.49 ha.
The prioritization of those cases was established by the HPO and consisted of detecting the 10 most severe cases in terms of surface and the 4 most severe cases per municipality involving two of lager surface, one of longer distance to the nearest regulated well and one of larger surface that did not fulfil the article 54.2 of the National Water Law. Once hierarchized, the cases were printed and distributed according to the river surveillance agency to carry out the subsequent inspections. The largest number of cases detected was located in the province of Ávila. Regarding the 10 most flagrant cases at basin level, 4 were located in Valladolid, 3 in Salamanca, 2 in Ávila and 1 in Zamora.
Figure 7 shows those cases detected in the Southern-lower Duero agrarian area (province of Valladolid) corresponding to the area of greatest irrigation restrictions of the entire Duero basin due to drought and overexploitation of the aquifers. These cases were obtained with Sentinel-2 NDVITOA images on 11 July 2017.
Regarding field inspections, 320 of the 4097 cases detected were examined during August and September by the Duero RSA. They were intended to control illegal irrigations and simultaneously validate HidroMap. They were scarce, but they revealed the main limitations and errors derived from the automated system implemented in HidroMap.
The main errors found in the field inspections of 2017 were: 9.4% due to late inspections (already harvested crops) and 18.7% caused by false positives (non-irrigated sunflowers).
To avoid the first incidence, it was recommended to carry out a continuous follow-up of the inspections to guarantee that they were carried out regularly and prioritizing the date in which the cases were generated.
Regarding the second error, it was verified that the defined parameters (mainly the NDVITOA threshold) were not suitable because some rainfed crops were classified as irrigated crops (false positives). This error was a direct consequence of providing maximum automation to the process. It should be highlighted that the sunflower crop has an almost identical spectral response under irrigation and rainfed conditions so non-irrigated sunflower crops are commonly confused with other irrigated summer crops [49,50]. To avoid such errors, an examination of the cases generated prior to their delivery to the RSA office was recommended. This process can be carried out by agronomists or by any user thanks to the crop phenological information offered by the HidroMap web-GIS environment.
Finally, regarding total irrigated area estimation, an analysis was performed in the province of León, including an area of special interest for the Duero River Basin Organization due to its extension and water demand for the agricultural activity. This area was known as Payuelos and it had a total surface of 37,000 ha where 62% was irrigated (23,000 ha). This area corresponded around the 80% to spring irrigation and 20% to summer irrigation according to the National Hydrological Plan [32,43].
Total irrigated area estimation using HidroMap for the range of dates between the end of June and August 2017 was 4824 ha of summer irrigated crops (Figure 8, Table 2). This value was a bit higher than the mentioned above due to some HidroMap cases detected in this area. In addition, according to the informative notes from water users, assigned allocations in operation were 4800 m3/ha. Therefore, water consumption values of 23.25 hm3 could be estimated during the summer period considering summer crops detected, which represented around 20% of the total demand during the hydrological year 2016/2017 according to the annual inform [30].

4.2. Derived Products from the Web-GIS Environment

It was possible to quickly visualize and optimally monitor the agricultural plots with positive irrigation response for the entire basin thanks to the available Earth observation data set. Especially, spectral responses of those crops detected by the desktop-GIS tool can be analysed here.
All this information was significant for the Duero HPO as its personnel can perform multi-temporal controls, in near-real-time, for lands under irrigation and crops grown in each agricultural plot. Multi-temporal analysis of crops (comparison of different NDVITOA profiles) allowed agronomic specialists to control the irrigation activity, quickly verifying the type and phenological stage of each crop. Therefore, the web-GIS module allowed, among other things, to control the veracity of the declarations made by farmers to CAP in 2017. This process was complemented by the RSA field inspections. A continuous monitoring of the agricultural plots by means of this tool can minimize, by a high percentage, the late inspections in which the crop could already be harvested.
Figure 9 illustrates the detection of a sugar beet crop using HidroMap web-GIS tool, which showed a distinctive spectral signature with an especially long vegetated period in comparison to other summer crops, normally harvested in September (as previously shown in Figure 6) [51].

5. Conclusions

This paper presents HidroMap, a powerful and versatile open source tool with great interest and utility for the HPOs and RSAs for water resources planning and control. The tool offers a combined GIS solution: a desktop-GIS plugin that allowed carrying out tasks of management, control and surveillance of irrigated areas and illegal irrigation; and a web-GIS system that allowed carrying out quickly inspections and irrigated area monitoring, as well as visualizing crops and phenological patterns in a simple and intuitive way.
HPO was the manager and main user of the HidroMap while RSA was the validator and betta tester of its results. In addition, RSA personnel have the important task of providing feedback about agronomic data in order to improve the tool’s algorithm. Therefore, desktop-GIS module mainly supported HPO tasks of detecting and controlling water resources while the web-GIS helped RSA so inspections were made in a reliable and accurate way. All this results in a greater and better communication between the personnel involved, and therefore better water control and planning.
From a conceptual and application point of view, HidroMap achieved a fourfold objective:
• Immediate and automatic detection of incidents
The free disposition of the Earth observation data used, the script developed for downloading and processing the mentioned data as well as the desktop-GIS tool for the automatic detection of cases and estimation of the irrigated surface, allowed obtaining results by a single-Mouse-click on an area of interest defined by users. This tool, available for the River Inspection Office (RIO), allowed to inspect possible incidents in near real time.
• Management of illegal irrigation
Combining information about plots with water rights for irrigation (assigned by the Duero HPO) with the results provided by the developed tool allowed to detect anomalies related to possible unregulated irrigations and agricultural plots with water rights that were not irrigated. A proper quality control of these cases based on field inspections by the RIO provided feedback for the developed methodology.
• Optimization of resources of the RIO
It was possible to adapt the results obtained to the requirements of RIO by defining more or less restrictive input criteria. For example, increasing NDVITOA and surface thresholds, determining the priority of plots based on the importance in those areas with higher irrigation demands. In addition, the web-GIS environment allowed real-time visualization of NDVITOA patterns for each crop. This can be considered very useful since analysing NDVITOA patterns allow an accurate monitoring of crop growth and development behaviour, involving the improvement of irrigation schedules and farm operation management plans.
• Temporal monitoring of the irrigated area
Web-GIS environment also allowed monitoring irrigated plots patterns for the whole basin in a flexible way. This tool will allow to: (i) identify almost in real time those irrigated crops without irrigation rights and/or those not declared by farmers to CAP and (ii) optimize field inspections, minimizing late visits; all through a friendly interface.
The dual GIS environment offered by HidroMap was an important challenge for any river basin organization for management and planning of available water resources. In addition, it can be adapted to any type of further requirement.

Future Developments

As future developments, both tools will be improved every year, especially by taking challenges from RSA’s feedback in order to merge information coming from field inspections and satellite imagery. An increase and optimisation of field inspections in both their material and human resources, as well as a reduction of its randomization, will provide very valuable information to calibrate HidroMap desktop-GIS tool so its outputs have a greater reliability.
  • In-depth analysis of the corresponding NDVI value for each crop and growing period in order to detect the current crop in each field and rigorously deduce its phenological stage and irrigation needs. Increasing field inspections will be required in order to ensure reliable results.
  • Cross-validation of “false positives” in order to both minimize them and increase the tool operability. Again, field inspections must be increased.
  • Increasing the use of the web-GIS module to support crops irrigation management by a deeper analysis of NDVI patterns and continuously monitoring the growth stage of each crop.

Supplementary Materials

Developed tool is available online at https://github.com/TIDOP/hidromap.

Author Contributions

Conceptualization, D.O.-T. and D.G.-A.; Methodology, D.O.-T., D.H.-L., R.B. and M.A.M.; Software, D.O.-T. and D.H.-L.; Validation, L.P. and S.d.P.; Formal Analysis, L.P., S.d.P. and D.O.-T.; Investigation, L.P., D.O.-T., S.d.P., D.H.-L., R.B., M.A.M. and J.-L.M.; Resources, D.O.-T., D.H.-L. and D.G.-A.; Data Curation, L.P., D.O.-T., S.d.P., D.H.-L., R.B. and M.A.M.; Writing-Original Draft Preparation, L.P., S.d.P., J.-L.M. and D.G.-A.; Writing-Review & Editing, L.P. and S.d.P.; Visualization, D.G.-A.; Supervision, D.G.-A.; Project Administration, D.G.-A.; Funding Acquisition, D.G.-A.

Acknowledgments

This research has been supported by the Duero Hydrographic Confederation. Therefore, authors want to thank Javier Fernandez Pereira for his help in achieving the goals of this project. Authors also want to thank the Ministry of Education, Culture, and Sport for providing a FPU (Training of University Teachers) grant to the corresponding author of this paper.

Conflicts of Interest

The authors declare no conflict of interest.

References

  1. Fischer, G.; Tubiello, F.N.; van Velthuizen, H.; Wiberg, D.A. Climate change impacts on irrigation water requirements: Effects of mitigation, 1990–2080. Technol. Forecast. Soc. 2007, 74, 1083–1107. [Google Scholar] [CrossRef] [Green Version]
  2. Tilman, D.; Cassman, K.G.; Matson, P.A.; Naylor, R.; Polasky, S. Agricultural sustainability, and intensive production practices. Nature 2002, 418, 671–677. [Google Scholar] [CrossRef] [PubMed]
  3. Castaño, S.; Sanz, D.; Gómez-Alday, J.J. Methodology for Quantifying Groundwater Abstractions for Agriculture via Remote Sensing and GIS. Water Resour. Manag. 2010, 24, 795–814. [Google Scholar] [CrossRef]
  4. Molina, J.L.; Pulido Velázquez, D.; García-Arostegui, J.; Pulido-Velázquez, M. Dynamic Bayesian Networks as a Decision Support Tool for Assessing Climate Change impacts on highly stressed groundwater systems. J. Hydrol. 2013, 479, 113–129. [Google Scholar] [CrossRef]
  5. Forouzani, M.; Karami, E. Agricultural water poverty index and sustainability. Agron. Sustain. Dev. 2011, 31, 415–431. [Google Scholar] [CrossRef]
  6. Food and Agriculture Organization of the United Nations (FAO). Building a Common Vision for Sustainable Food and Agriculture–Principles and Approaches; Food and Agriculture Organization of the United Nations: Rome, Italy, 2014; ISBN 978-92-5-108471-7. [Google Scholar]
  7. Peragón, J.M.; Delgado, A.; Rodríguez Díaz, J.A.; Pérez-Latorre, F.J. A GIS-based decision tool for reducing salinization risks in olive orchards. Agric. Water Manag. 2016, 166, 33–41. [Google Scholar] [CrossRef]
  8. Venot, J.P.; Molle, F. Groundwater Depletion in the Jordan Highlands: Can Pricing Policies Regulate Irrigation Water Use? Water Resour. Manag. 2008, 22, 1925–1941. [Google Scholar] [CrossRef]
  9. Milly, P.C.D.; Betancourt, J.; Falkenmark, M.; Hirsch, R.M.; Kundzewicz, Z.W.; Lettenmaier, D.P.; Stouffer, R.J. Stationarity is dead: Whither water management? Science 2008, 319, 573–574. [Google Scholar] [CrossRef] [PubMed]
  10. Oikonomidis, D.; Dimogianni, S.; Kazakis, N.; Voudouris, K. A GIS/Remote Sensing-based methodology for groundwater potentiality assessment in Tirnavos area, Greece. J. Hydrol. 2015, 525, 197–208. [Google Scholar] [CrossRef]
  11. Neji, H.B.B.; Turki, S.Y. GIS-based multicriteria decision analysis for the delimitation of an agricultural perimeter irrigated with treated wastewater. Agric. Water Manag. 2015, 162, 78–86. [Google Scholar] [CrossRef]
  12. AbdelRahman, M.A.E.; Natarajan, A.; Hegde, R. Assessment of land suitability and capability by integrating remote sensing and GIS for agriculture in Chamarajanagar district, Karnataka, India. Egypt. J. Remote Sens. Space Sci. 2016, 19, 125–141. [Google Scholar] [CrossRef]
  13. Ortega, J.F.; De Juan, J.A.; Tarjuelo, J.M. Improving Water Management: The Irrigation Advisory Service of Castilla-La Mancha (Spain). Agric. Water Manag. 2005, 77, 37–58. [Google Scholar] [CrossRef]
  14. Herrero-Huerta, M.; Felipe-García, B.; Belmar-Lizarán, S.; Hernández-López, D.; Rodríguez-Gonzálvez, P.; González-Aguilera, D. Dense Canopy Height Model from a low-cost photogrammetric platform and LiDAR data. Trees 2016, 30, 1287–1301. [Google Scholar] [CrossRef]
  15. Calera Belmonte, A.; Jochum, A.M.; Cuesta García, A.; Montoro Rodríguez, A.; López Fuster, P. Irrigation management from space: Towards user-friendly products. Irrig. Drain. 2005, 19, 337–353. [Google Scholar] [CrossRef]
  16. Mulla, D.J. Twenty five years of remote sensing in precision agriculture: Key advances and remaining knowledge gaps. Biosyst. Eng. 2013, 114, 358–371. [Google Scholar] [CrossRef]
  17. Skakun, S.; Kussul, N.; Shelestov, A.Y.; Lavreniuk, M.; Kussul, O. Efficiency assessment of multitemporal C-band Radarsat-2 intensity and Landsat-8 surface reflectance satellite imagery for crop classification in Ukraine. IEEE J. Sel. Top. Appl. Earth Obs. Remote Sens. 2016, 9, 3712–3719. [Google Scholar] [CrossRef]
  18. Calera, A.; Campos, I.; Osann, A.; D’Urso, G.; Menenti, M. Remote Sensing for Crop Water Management: From ET Modelling to Services for the End Users. Sensors 2017, 17, 1104. [Google Scholar] [CrossRef] [PubMed]
  19. Li, J.; Roy, D.P. A Global Analysis of Sentinel-2A, Sentinel-2B and Landsat-8 Data Revisit Intervals and Implications for Terrestrial Monitoring. Remote Sens. 2017, 9, 902. [Google Scholar] [CrossRef]
  20. Gkatzoflias, D.; Mellios, G.; Samaras, Z. Development of a web GIS application for emissions inventory spatial allocation based on open source software tools. Comput. Geosci. 2013, 52, 21–33. [Google Scholar] [CrossRef]
  21. Kalabokidis, K.; Athanasis, N.; Gagliardi, F.; Karayiannis, F.; Palaiologou, P.; Parastatidis, S.; Vasilakos, C. Virtual Fire: A web-based GIS platform for forest fire control. Ecol. Inform. 2013, 16, 62–69. [Google Scholar] [CrossRef]
  22. Dissanayake, D.M.S.L.B. Web GIS-Based Spatial Data Infrastructure (SDI) System for Forestry Management in Sri Lanka. In Proceedings of the International Forestry and Environment Symposium, Wayikkal, Sri Lanka, 16–17 October 2015; Department of Forestry and Environmental Science, University of Sri Jayewardenepura: Colombo, Sri Lanka, 2015; Volume 20. [Google Scholar]
  23. Nawaz, M.; Sattar, F. GIS Freeware and Geoscience Education in Low Resource Settings. Online J. Distance Educ. e-Learn. 2016, 4, 35–38. [Google Scholar]
  24. Pleiades-HR (High-Resolution Optical Imaging Constellation of CNES). Available online: https://earth.esa.int/web/eoportal/satellite-missions/p/pleiades (accessed on 25 May 2018).
  25. Calera, A. Remote Sensing for Crop Water Management. Agrocienc. Urug. Spec. Issue 2015, 19, 77. [Google Scholar]
  26. Campos, I.; Balbontín, C.; González-Piqueras, J.; González-Dugo, M.P.; Neale, C.M.U.; Calera, A. Combining water balance model with evapotranspiration measurements to estimate total available water soil water in irrigated and rain-fed vineyards. Agric. Water Manag. 2016, 165, 141–152. [Google Scholar] [CrossRef]
  27. Food and Agriculture Organization of the United Nations (FAO). The State of the World’s Land and Water Resources for Food and Agriculture (SOLAW)—Managing Systems at Risk; Food and Agriculture Organization of the United Nations: Rome, Italy; Earthscan: London, UK, 2011; ISBN 978-92-5-106614-0. [Google Scholar]
  28. PostgreSQL/PostGIS. Available online: https://postgis.net/ (accessed on 1 February 2018).
  29. Ministry of Environment. Real Decreto 125/2007, de 2 de Febrero, Por El Que Se Fija El Ámbito Territorial de las Demarcaciones Hidrográficas; Boletín Oficial del Estado N. 30: Madrid, Spain, 2007; pp. 5118–5120.
  30. Herrero Lizano, J. Informe de Seguimiento del Plan Hidrológico de la Parte Española de la Demarcación Hidrográfica del Duero. Año 2017; Confederación Hidrográfica del Duero: Valladolid, España, 2017; pp. 45 and Annexes. [Google Scholar]
  31. Agroclimatic Atlas of Castilla y León. ITACyL and AEMET. 2013. Available online: http://atlas.itacyl.es (accessed on 1 February 2018).
  32. Fernández Pereira, J.; Rodríguez Arroyo, J.; del Barrio, V.; Ramos, M.A.; Castrillón, M.; Vaquerizo, E.; Trujillo, H.; Hernández, V.; Gómez, S.; Seisdedos, P.; et al. Plan Hidrológico de la Parte Española de la Demarcación Hidrográfica del Duero 2015–2021; Confederación Hidrográfica del Duero: Valladolid, Spain, 2015; pp. 486 and Annexes. [Google Scholar]
  33. Ceballos, A.; Martinez Fernandez, J.; Luengo Ugidos, M.A. Analysis of rainfall trends and dry periods on a pluviometric gradient representative of Mediterranean climate in the Duero Basin, Spain. J. Arid Environ. 2004, 58, 215–233. [Google Scholar] [CrossRef]
  34. Molina, J.L.; Zazo, S.; Rodríguez-Gonzálvez, P.; González-Aguilera, D. Innovative Analysis of Runoff Temporal Behavior through Bayesian Networks. Water 2016, 8, 484. [Google Scholar] [CrossRef]
  35. Molina, J.L.; Zazo, S. Causal Reasoning for the Analysis of Rivers Runoff Temporal Behavior. Water Resour. Manag. 2017, 31, 4669–4681. [Google Scholar] [CrossRef]
  36. Molina, J.L.; Zazo, S. Assessment of Temporally Conditioned Runoff Fractions in Unregulated Rivers. J. Hydrol. Eng. 2018, 23, 04018015. [Google Scholar] [CrossRef]
  37. Ministry of the Presidency. Real Decreto 1071/2007, de 27 de Julio, Por el Que Se Regula el Sistema Geodésico de Referencia Oficial en España; Boletín Oficial del Estado N. 207: Madrid, Spain, 2007; pp. 35986–35989.
  38. Rouse, J.W.; Haas, R.H.; Schell, J.A.; Deering, D.W. Monitoring vegetation systems in the Great Plains with ERTS. In Proceedings of the 3rd Earth Resources Technology Satellite-1 Symposium, NASA SP-351, Washington, DC, USA, 1 January 1974; Volume 1, pp. 309–317. [Google Scholar]
  39. Lu, D.; Weng, Q. A survey of image classification methods and techniques for improving classification performance. Int. J. Remote Sens. 2007, 28, 823–870. [Google Scholar] [CrossRef] [Green Version]
  40. Sentinel-2 Mission Details. Available online: https://earth.esa.int/web/guest/missions/esa-operational-eo-missions/sentinel-2 (accessed on 25 May 2018).
  41. CartoDruid. Available online: http://cartodroid.es/en/ (accessed on 15 February 2018).
  42. SpatialLite Database. Available online: http://www.gaia-gis.it/gaia-sins/ (accessed on 27 May 2018).
  43. Mírame IDE Duero. Available online: http://www.mirame.chduero.es/DMADuero_09/index.faces (accessed on 1 February 2018).
  44. Geographic Information System for Agricultural Plots. Available online: http://www.mapama.gob.es/es/agricultura/temas/sistema-de-informacion-geografica-de-parcelas-agricolas-sigpac-/ (accessed on 15 February 2018).
  45. National Plan for Aerial Orthophotography. Available online: http://pnoa.ign.es/ (accessed on 21 February 2018).
  46. OpenSearch Protocol. Available online: http://www.opensearch.org/Home (accessed on 27 May 2018).
  47. USGS Search and Download Service. Available online: https://ers.cr.usgs.gov (accessed on 27 May 2018).
  48. Common Agricultural Policy. Available online: https://pac.jcyl.es/web/jcyl/PAC/es/Plantilla100/1284146916532/_/_/_ (accessed on 25 May 2018).[Green Version]
  49. Odenweller, J.B.; Johnson, K.I. Crop Identification Using Landsat Temporal-Spectral Profiles. Remote Sens. Environ. 1984, 14, 39–54. [Google Scholar] [CrossRef]
  50. Peña-Barragán, J.M.; Ngugi, M.K.; Plant, R.E.; Six, J. Object-based crop identification using multiple vegetation indices, textural features, and crop phenology. Remote Sens. Environ. 2011, 115, 1301–1316. [Google Scholar] [CrossRef]
  51. Siachalou, S.; Mallinis, G.; Tsakiri-Strati, M. A Hidden Markov Models Approach for Crop Classification: Linking Crop Phenology to Time Series of Multi-Sensor Remote Sensing Data. Remote Sens. 2015, 7, 3633–3650. [Google Scholar] [CrossRef] [Green Version]
Figure 1. Duero Hydrographic Basin. Arid areas and agricultural demands (Source: Spanish National Hydrological Plan 2015–2021).
Ijgi 07 00220 g001
Figure 2. Flowchart of the HidroMap tool functionalities and main engines: PostgreSQL/PostGIS database, desktop-GIS, and web-GIS modules.
Ijgi 07 00220 g002
Figure 3. HidroMap desktop-GIS module interface. (A) Processing type; (B) Study area definition; (C) Filtering forest areas and others; and (D) Parameters setting.
Ijgi 07 00220 g003
Figure 4. Main flowchart of the proposed methodology for estimating agricultural plots with non-regulated irrigation activity and irrigated surface and plots involved in an area of interest (yellow background: inputs; blue background: flux or process; green background: outputs).
Ijgi 07 00220 g004
Figure 5. Crops resulted from spatial intersections of an irrigated normalized difference vegetation index (NDVI) response and layers with information of the existence of irrigation concession, SIGPAC parceling and river inspection sectors. Detection and definition of HidroMap cases and temporally monitoring of the information stored in forms.
Ijgi 07 00220 g005
Figure 6. Screenshot of the web-GIS module. (A) web-GIS viewer; (B) Several layers to visualize, i.e. S2 and L8 grids, 2017 crop classification (source: Agrarian Technological Institute of Castilla y León, ITACYL), crop declarations to the Common Agricultural Policy (CAP) and field inspections; (C) Usual NDVI variation graphic for an irrigated summer crop: user could choose to visualize NDVI values from L8, S2 or both satellite platforms; (D) Timeline and images availability depending on the area shown by the viewer; (E) Selection of derived products to visualize: RGB (Red, Green and Blue) false colour and NDVI images from both L8 and S2.
Ijgi 07 00220 g006
Figure 7. HidroMap cases in the Southern-lower Duero agrarian area in 2017. Plots detected with irrigation activity for an NDVITOA threshold of 0.70, a minimum area of 0.5 ha and filtering forest surfaces.
Ijgi 07 00220 g007
Figure 8. Comparison between the estimation of the irrigated area offered by HidroMap and extension declared for that purpose by the water users of Payuelos for the summer of 2017.
Ijgi 07 00220 g008
Figure 9. False color images from Sentinel-2 (combination of bands 11, 8 and 4) and a graph of the variation of NDVITOA values for different dates. This graph represents the growing season profile, including phenological stages, of a sugar beet crop.
Ijgi 07 00220 g009
Table 1. Main characteristics of satellites and band set used by HidroMap.
Landsat-8Sentinel-2 (A & B)
Sensor:Operational Land Imager (OLI)Multispectral Instrument (MSI)
The spatial resolution of the bands used:30 m10 m 1, 20 m 2
Temporal resolution:16 days5 days 3
Radiometric resolution:12 bits12 bits
Band set used:Band 3 (Green: 0.525–0.600 µm)
Band 4 (Red: 0.630–0.680 µm)
Band 5 (Near Infrared: 0.845–0.885 µm)
Band 6 (SWIR1: 1.560–1.660 µm)
Band 7 (SWIR2: 2.100–2.300 µm)
Band 3 (Green: 0.560 µm)
Band 4 (Red: 0.665 µm)
Band 8 (Near Infrared: 0.842 µm)
Band 11 (SWIR1: 1.610 µm)
Band 12 (SWIR2: 2.190 µm)
1 Visible and Near Infrared, 2 Short-wave Infrared (SWIR), 3 5 days due to Sentinel-2B images availability (launched in March 2017) [40], 10 days before.
Table 2. Irrigated area estimation results in Payuelos during the summer irrigation period (León, Spain).
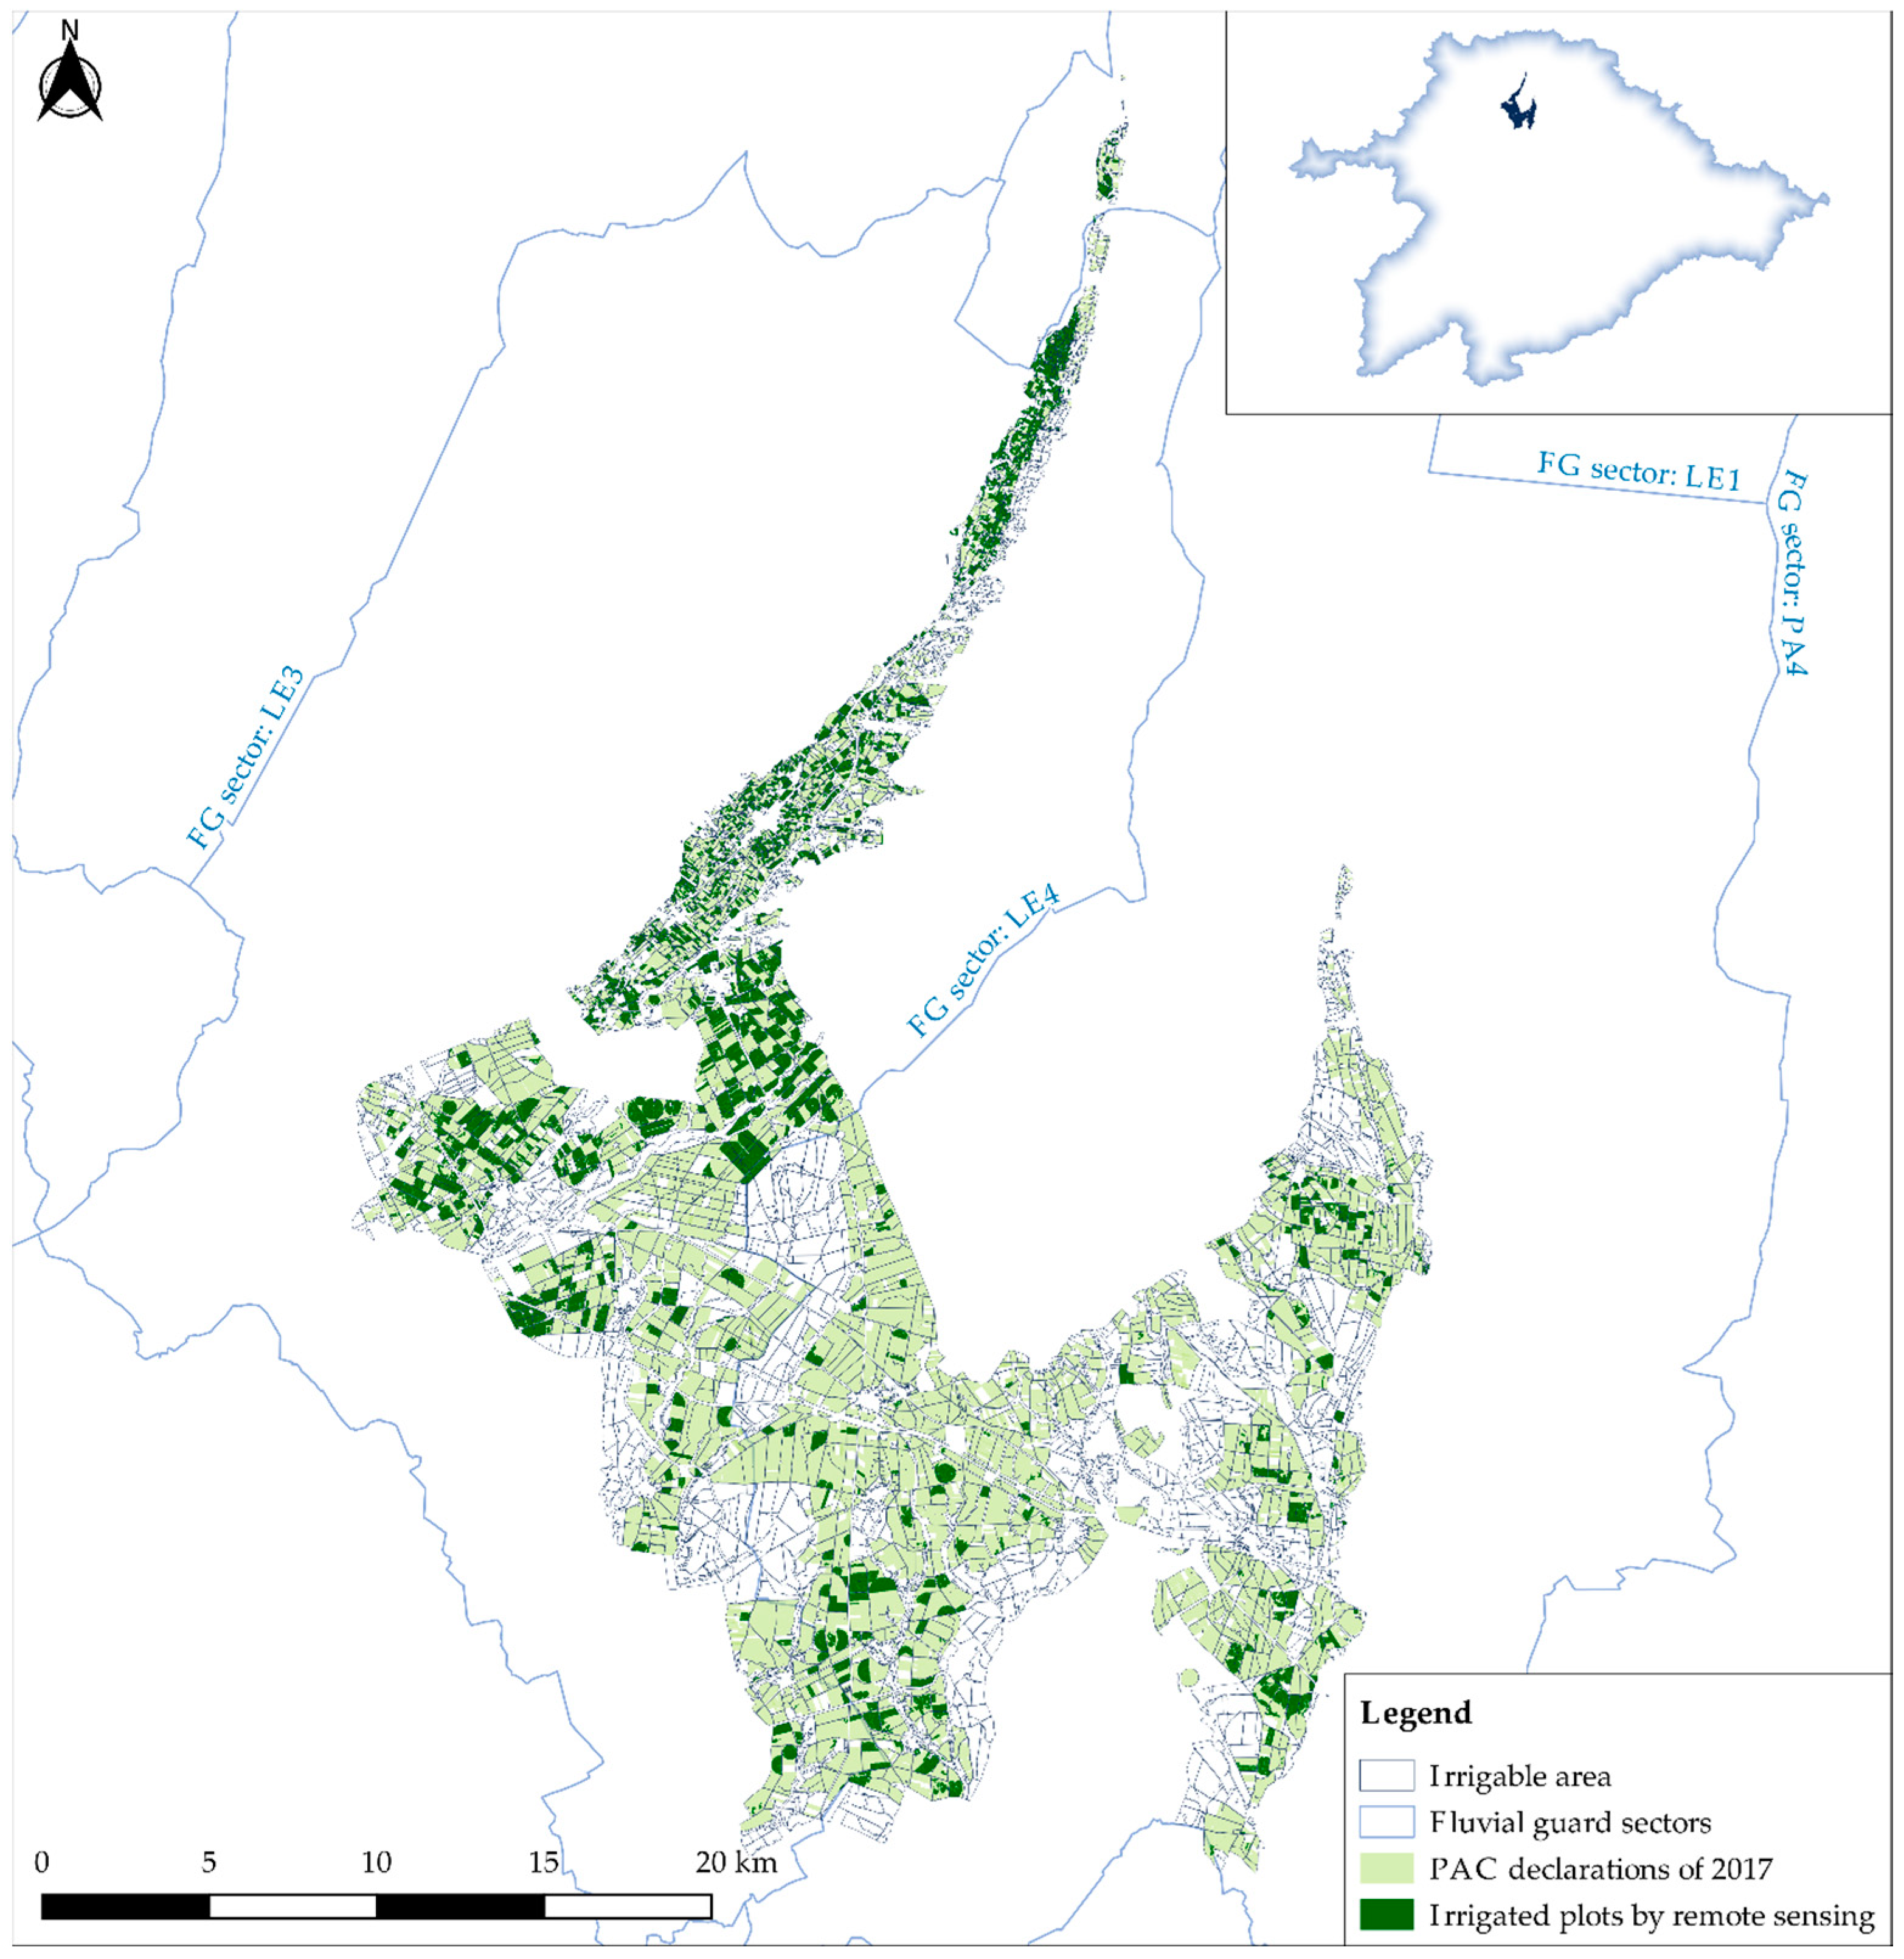
Analysis of the Irrigated Area in Payuelos (León, Spain)
Total extension36,990.57 ha
Extension declared for irrigation activity23,005.68 ha
Extension for spring and summer irrigation assigned in the HP15 120,334 ha
Extension declared for spring and summer during the hydrological year 2016/201718,468 ha
Summer irrigation extension estimate by HidroMap4824.10 ha
1 Spanish National Hydrological Plan 2015–2021.

