Automated Orthorectification of VHR Satellite Images by SIFT-Based RPC Refinement


1
Graduate School of Science Engineering and Technology, Istanbul Technical University, ITU Ayazaga Campus, Sariyer 34469, Istanbul, Turkey
2
Geomatics Engineering Department, Civil Engineering Faculty, Istanbul Technical University, ITU Ayazaga Campus, Sariyer 34469, Istanbul, Turkey
*
Author to whom correspondence should be addressed.
ISPRS Int. J. Geo-Inf. 2018, 7(6), 229; https://doi.org/10.3390/ijgi7060229
Submission received: 28 April 2018
/
Revised: 6 June 2018
/
Accepted: 18 June 2018
/
Published: 20 June 2018
Abstract
:Raw remotely sensed images contain geometric distortions and cannot be used directly for map-based applications, accurate locational information extraction or geospatial data integration. A geometric correction process must be conducted to minimize the errors related to distortions and achieve the desired location accuracy before further analysis. A considerable number of images might be needed when working over large areas or in temporal domains in which manual geometric correction requires more labor and time. To overcome these problems, new algorithms have been developed to make the geometric correction process autonomous. The Scale Invariant Feature Transform (SIFT) algorithm is an image matching algorithm used in remote sensing applications that has received attention in recent years. In this study, the effects of the incidence angle, surface topography and land cover (LC) characteristics on SIFT-based automated orthorectification were investigated at three different study sites with different topographic conditions and LC characteristics using Pleiades very high resolution (VHR) images acquired at different incidence angles. The results showed that the location accuracy of the orthorectified images increased with lower incidence angle images. More importantly, the topographic characteristics had no observable impacts on the location accuracy of SIFT-based automated orthorectification, and the results showed that Ground Control Points (GCPs) are mainly concentrated in the “Forest” and “Semi Natural Area” LC classes. A multi-thread code was designed to reduce the automated processing time, and the results showed that the process performed 7 to 16 times faster using an automated approach. Analyses performed on various spectral modes of multispectral data showed that the arithmetic data derived from pan-sharpened multispectral images can be used in automated SIFT-based RPC orthorectification.
1. Introduction
Developments in satellite and space technologies have evolved rapidly, and new satellites with high-resolution sensors have steadily been launched to provide a variety of geospatial information for disciplines ranging from engineering to defense. These developments enable users to adopt very high-resolution satellite images for large-scale applications, such as mapping urban areas, transportation network development, the identification of parcel-based agricultural boundaries for precision agriculture and the production of reliable geospatial information for homeland security [1,2,3,4].
Remotely sensed images exhibit internal and external geometric distortions as they represent the three-dimensional surface of the Earth in a two-dimensional satellite image with the additional effects of the Earth’s rotation and curvature, surface topography, sensor geometry/motion and instability of the platform [5,6]. Geometric correction is a crucial pre-processing step used in remote sensing to accurately compare and/or fuse multi-sensor, multi-spectral and multi-temporal images, integrate related satellite images with other spatial data in a GIS environment, conduct accurate linear and areal measurements of targets from satellite images and produce thematically and geometrically accurate land cover/use maps using 2D/3D empirical models or by applying physical models [7,8,9,10].
Empirical models can be used if the parameters of the data acquisition system are unavailable or if 3D physical models are absent. The Rational Polynomial Coefficients (RPC) model is a widely used empirical model that uses coefficients for geometric correction that are primarily provided by new generation, very high resolution (VHR) satellite images, enabling users to easily perform geometric correction processes. The RPC model defines the relationship between the satellite image and the Earth’s surface as well as physical models with rational polynomials [5,9,11].
Geometric correction employed using the RPC model eliminates some of the errors, but there are still biases and random errors. RPC refinement methods with Ground Control Points (GCP) and a Digital Elevation Model (DEM) improve the spatial accuracy and minimize geometric distortions and can be considered better geometric correction options than the RPC model alone [9,11,12,13].
The GCPs used in RPC refinement method are usually measured manually from highly accurate reference data in conventional methods. However, remote sensing operators conduct this manual process, and thus, the accuracy of the process and the time required are directly affected by the operator’s experience and skill.
With the availability of various sensors with different resolutions, access to satellite images has become easier, and the number and size of images, especially for VHR sensors, have also increased [14]. This process triggers the development of automatic methods for geometric correction to save time and cost. When the time cost and the errors related to manual processing are considered, image matching methods can be the best option for obtaining GCPs and overcoming these disadvantages [15,16].
In image matching methods, a reference image with high spatial accuracy and the source image requiring geometric correction are matched to find common points in both images that can be used as GCPs after an outlier removal process with a series of filtering operations [16].
As it is possible to decrease the number of errors related to manual processing and complete the geometric correction process quickly due to improvements in image matching algorithms and developments in computer hardware, the utilization of image matching algorithms has recently increased in remote sensing applications [17]. Algorithms developed for image matching and used in remote sensing applications include Harris [18,19], Template Matching [19], Speeded Up Robust Features [20,21] and Scale Invariant Feature Transform (SIFT) [22].
Yu et al. performed automatic geometric correction on high- and medium-resolution satellite images using SIFT for pre-registration and Harris- and Wavelet Pyramids-Based Cross Matching for fine registration and obtained RMSEs of 1.55 and 0.82 pixels for the high- and medium-resolution images, respectively [23]. Hasan et al. applied SIFT neighborhood matching and random sample consensus (RANSAC) algorithms for automatic registration and showed that neighborhood matching generated more matching feature points [24]. Sedaghat et al. implemented Uniform-Robust SIFT (UR-SIFT) and compared the results with those of the original SIFT in terms of the number of matching points, the number of correct matching points, the distribution quality and RMSE using different image channels, including panchromatic and multispectral channels, and asserted that UR-SIFT provided more correct matches than the original SIFT [25]. Huo et al. applied the multi-level SIFT algorithm to Quickbird images and aerial photographs using a parallel architecture approach and analyzed the results based on the correct matching ratio for the autonomous method and the processing time for the parallel architecture approach. The multi-level method generated more correct matches, and the parallel approach completed the operation eight times faster [22]. Long et al. combined the matched points of SIFT with least squares matching (LSM) refinement for more accurate results and conducted research with the use of prior geometric information and image tiling to make the image matching process more efficient and robust. The proposed method showed notable improvement in the RMSE of matched points with the use of LSM [26].
Previous studies have reported several challenges that the SIFT-based matching process faces: large image size, multi-source images, limited matching points, large percentage of mismatches, clouds in the image and an overlapping area ratio [26,27,28].
These studies also confirm that SIFT-based image matching can be used for GCP production to replace manual approaches and make the registration process faster and more reliable. Although there have been several studies that have compared and applied SIFT-based image matching algorithms for automatic GCP selection, there has not been extensive research analyzing the effects of the incidence angle, surface topography and land cover (LC) characteristics on automatic image registration methods. Additionally, to our knowledge, the use of the SIFT algorithm to provide information for the polynomial equation-based RPC refinement procedures has not been evaluated. The main aim of this research was to fill this gap by analyzing the impacts of the incidence angle, surface topography, LC characteristic parameters and spectral information on image matching and GCP quality. Moreover, this study integrated SIFT-based GCP selection and an RPC refinement approach to perform orthorectification.
In this research, an automated orthorectification process was designed, and a SIFT image matching algorithm [29] was selected for the image matching steps of the process. The algorithm was selected due to its reported performance in evaluations conducted in image matching and remote sensing studies [23,24,30,31]. Pleiades VHR images acquired with low and high incidence angles from three different regions in Turkey with different topographic and land cover characteristics were used in this research. The orthorectification process was performed using RPC data, DEM data and GCPs derived by image matching of the input and reference images using the automated SIFT algorithm. An accuracy assessment was performed in terms of the Root Mean Square Errors (RMSE) of the GCPs obtained from the image matching results and Independent Check Points (ICP) measured from geometrically corrected images. The process was applied for different bands of pan-sharpened images, arithmetic data derived from bands of pan-sharpened images and panchromatic images to investigate the effects of spectral characteristics on image matching and GCP selection. Lastly, a multi-thread approach was developed to speed up the SIFT algorithm and handle many images simultaneously, minimizing the time cost of the manual method.
The main aim of this study was to evaluate the impacts of the incidence angle, topography, land cover and spectral characteristics on the automatic production of GCPs using SIFT to perform RPC refinement, determine how these parameters affect the results in terms of location accuracy after orthorectification, and evaluate how much the designed multi-thread approach accelerates the geometric correction process.
2. Study Area and Data
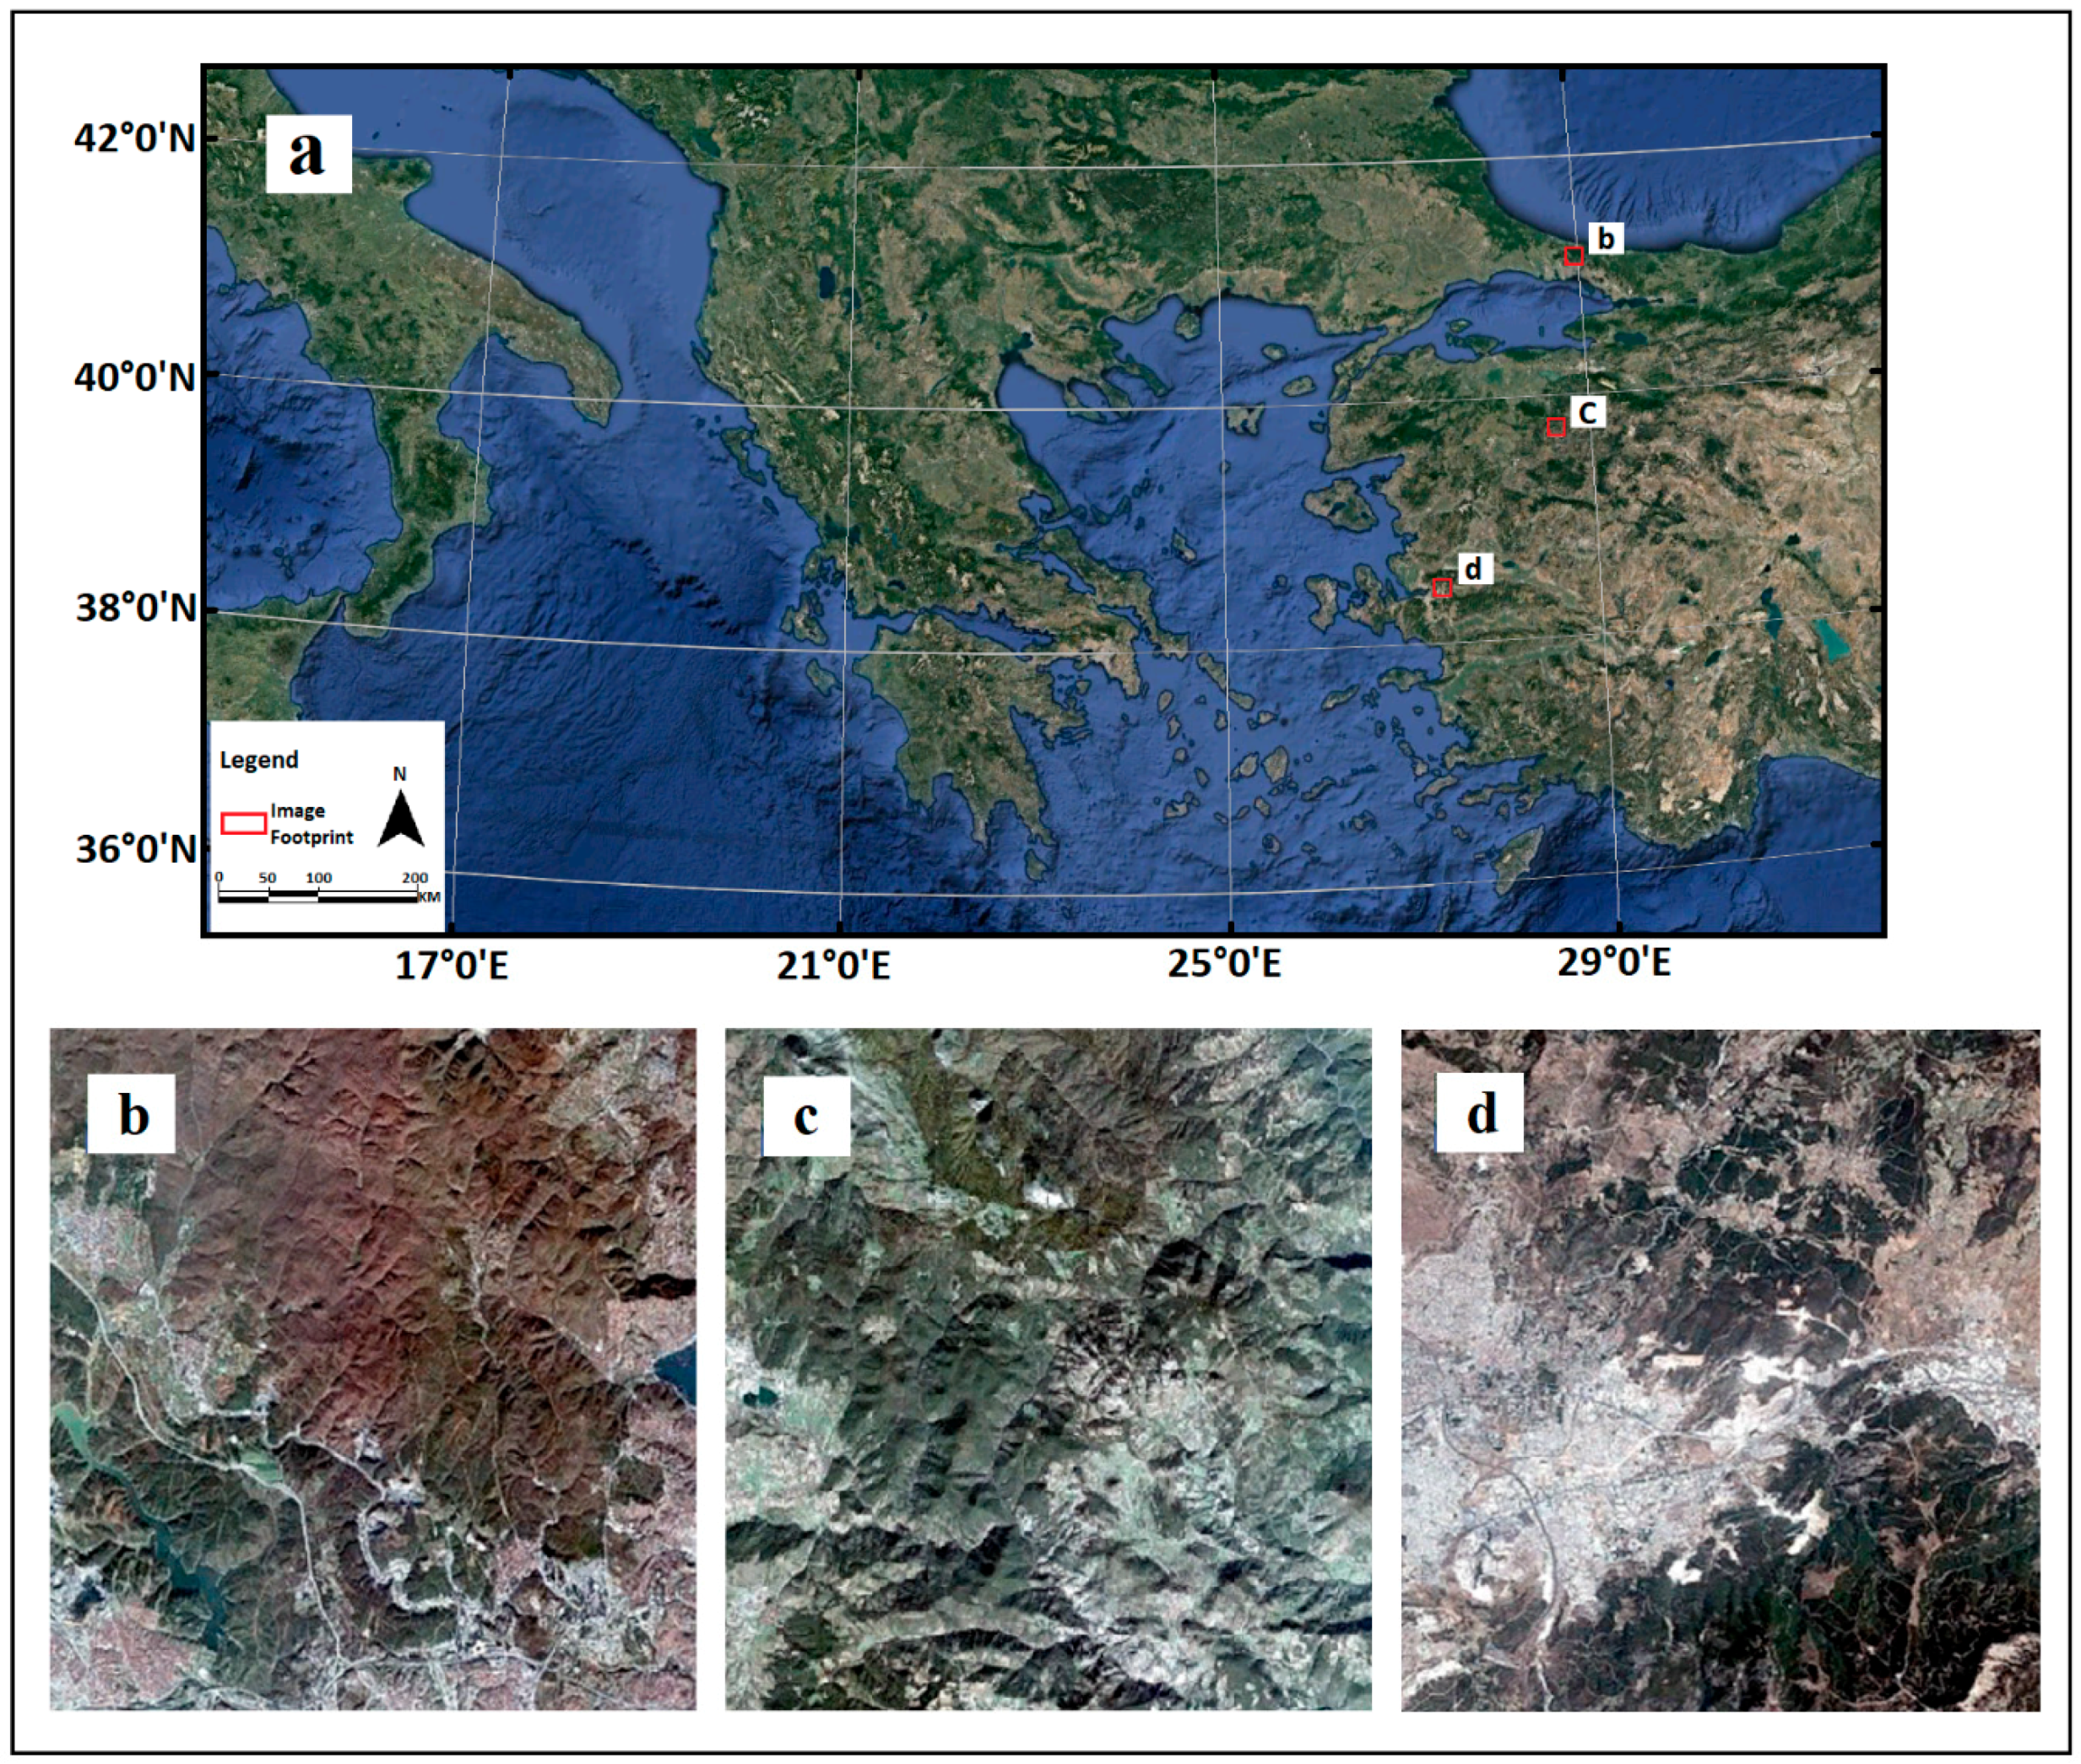
VHR satellite images of three different regions in Turkey—Istanbul, Bursa and Izmir—were acquired by Pleiades 1A and 1B satellites. The selected study areas are in the Marmara and Aegean regions of Turkey (Figure 1). These regions represent different topographical conditions with different elevation and slope ranges and different LC characteristics suitable for the methodological research design. Three images with different incidence angles were selected per study region to analyze the impacts of varying incidence angle values on the geometric correction procedure. Table 1 summarizes the incidence angles and data collection dates of the Pleiades 1A and 1B images. The Pleiades 1A satellite was launched on 16 December 2011, and the Pleiades 1B satellite was launched on 2 December 2012. These twin satellites have the same spatial and spectral resolution. The spatial resolution of the panchromatic image product is 0.5 m, and the spatial resolution of the multi-spectral image product comprising the red, green, blue and near infrared channels is 2 m [32]. Images with a very low incidence angle (close to NADIR) were selected as the reference data for each region for further comparison.
The Advanced Spaceborne Thermal Emission and Reflectance Radiometer Global Digital Elevation Model (ASTER GDEM) was used as the DEM data for the orthorectification procedure throughout the study. The ASTER GDEM was produced from stereoscopic images acquired by the ASTER instrument onboard the Terra satellite and it covers 99% of the Earth’s surface with a 30-m spatial resolution [33].
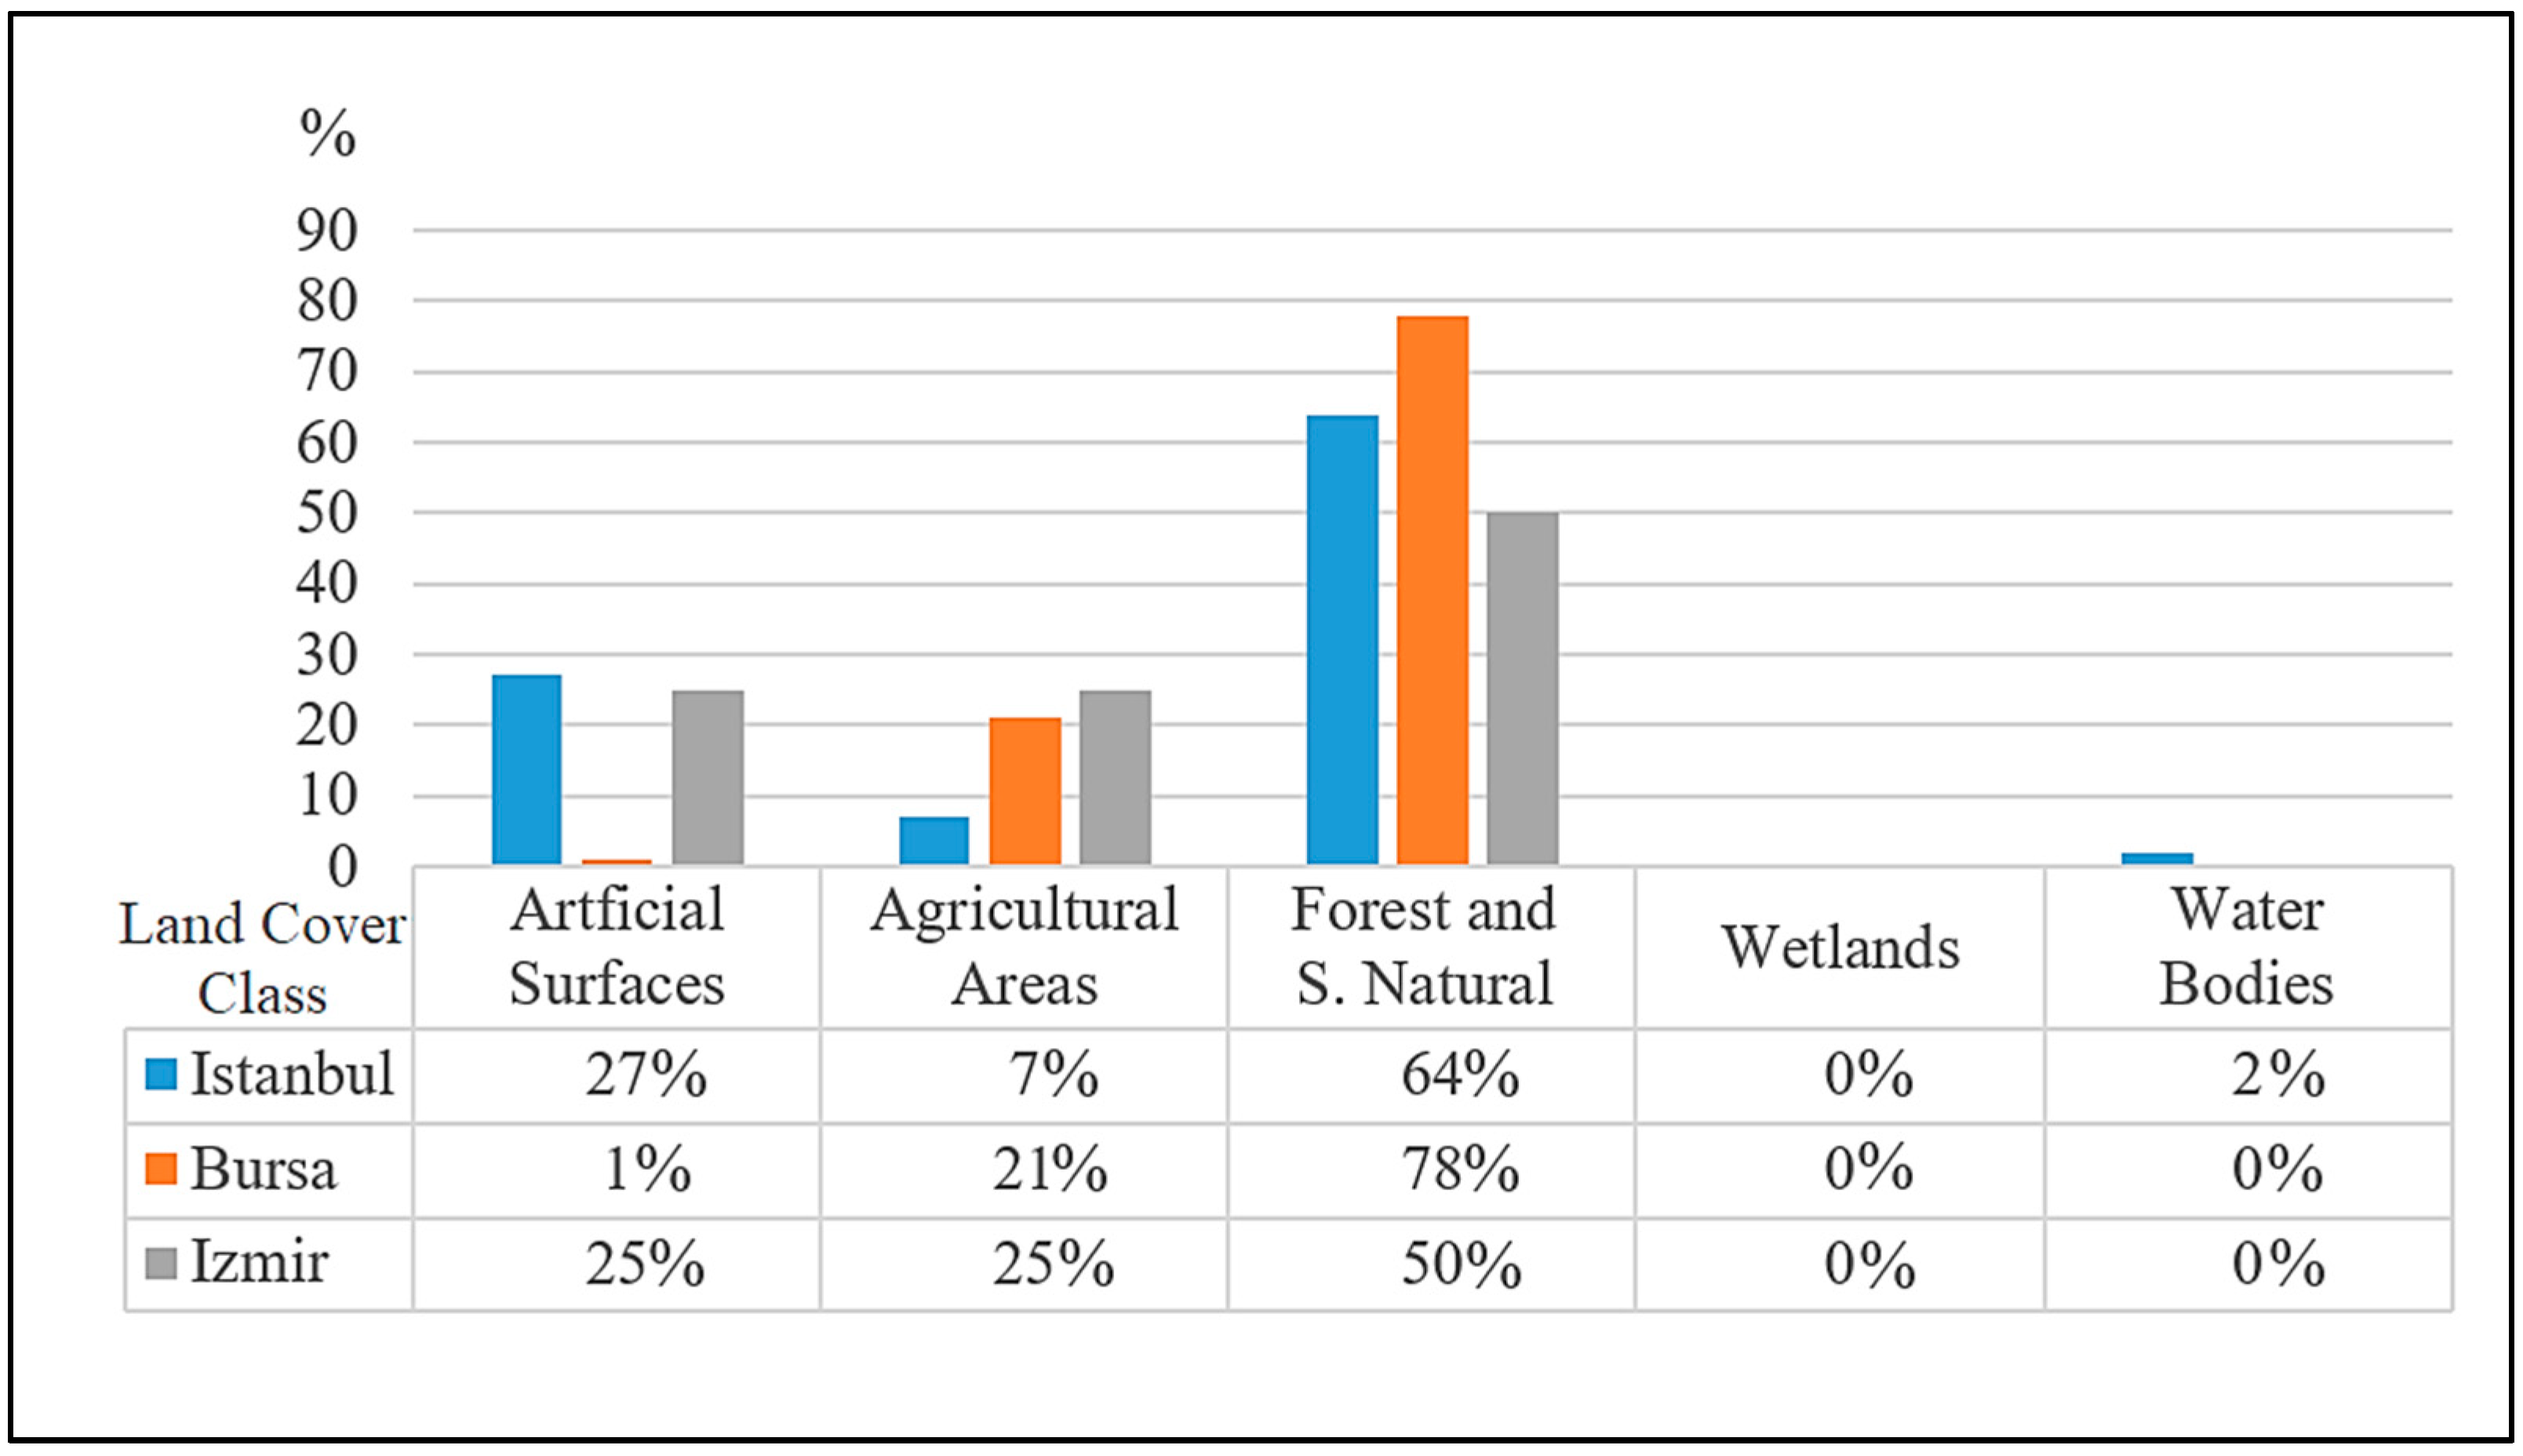
The topographic characteristics of the study regions were extracted from the ASTER GDEM using slope analysis, and the LC information was retrieved from the Coordination of Information on the Environment (CORINE) dataset, which provides up-to-date land cover/land use (LCLU) information. The CORINE Project was started in 1985 by the European Union to manage various environmental issues [34]. In this study, first level LC classes, namely, Artificial Surfaces, Agricultural Areas, Forest and Semi-Natural Areas, Wetlands and Water Bodies, were used to determine the surface characteristics of the study regions.
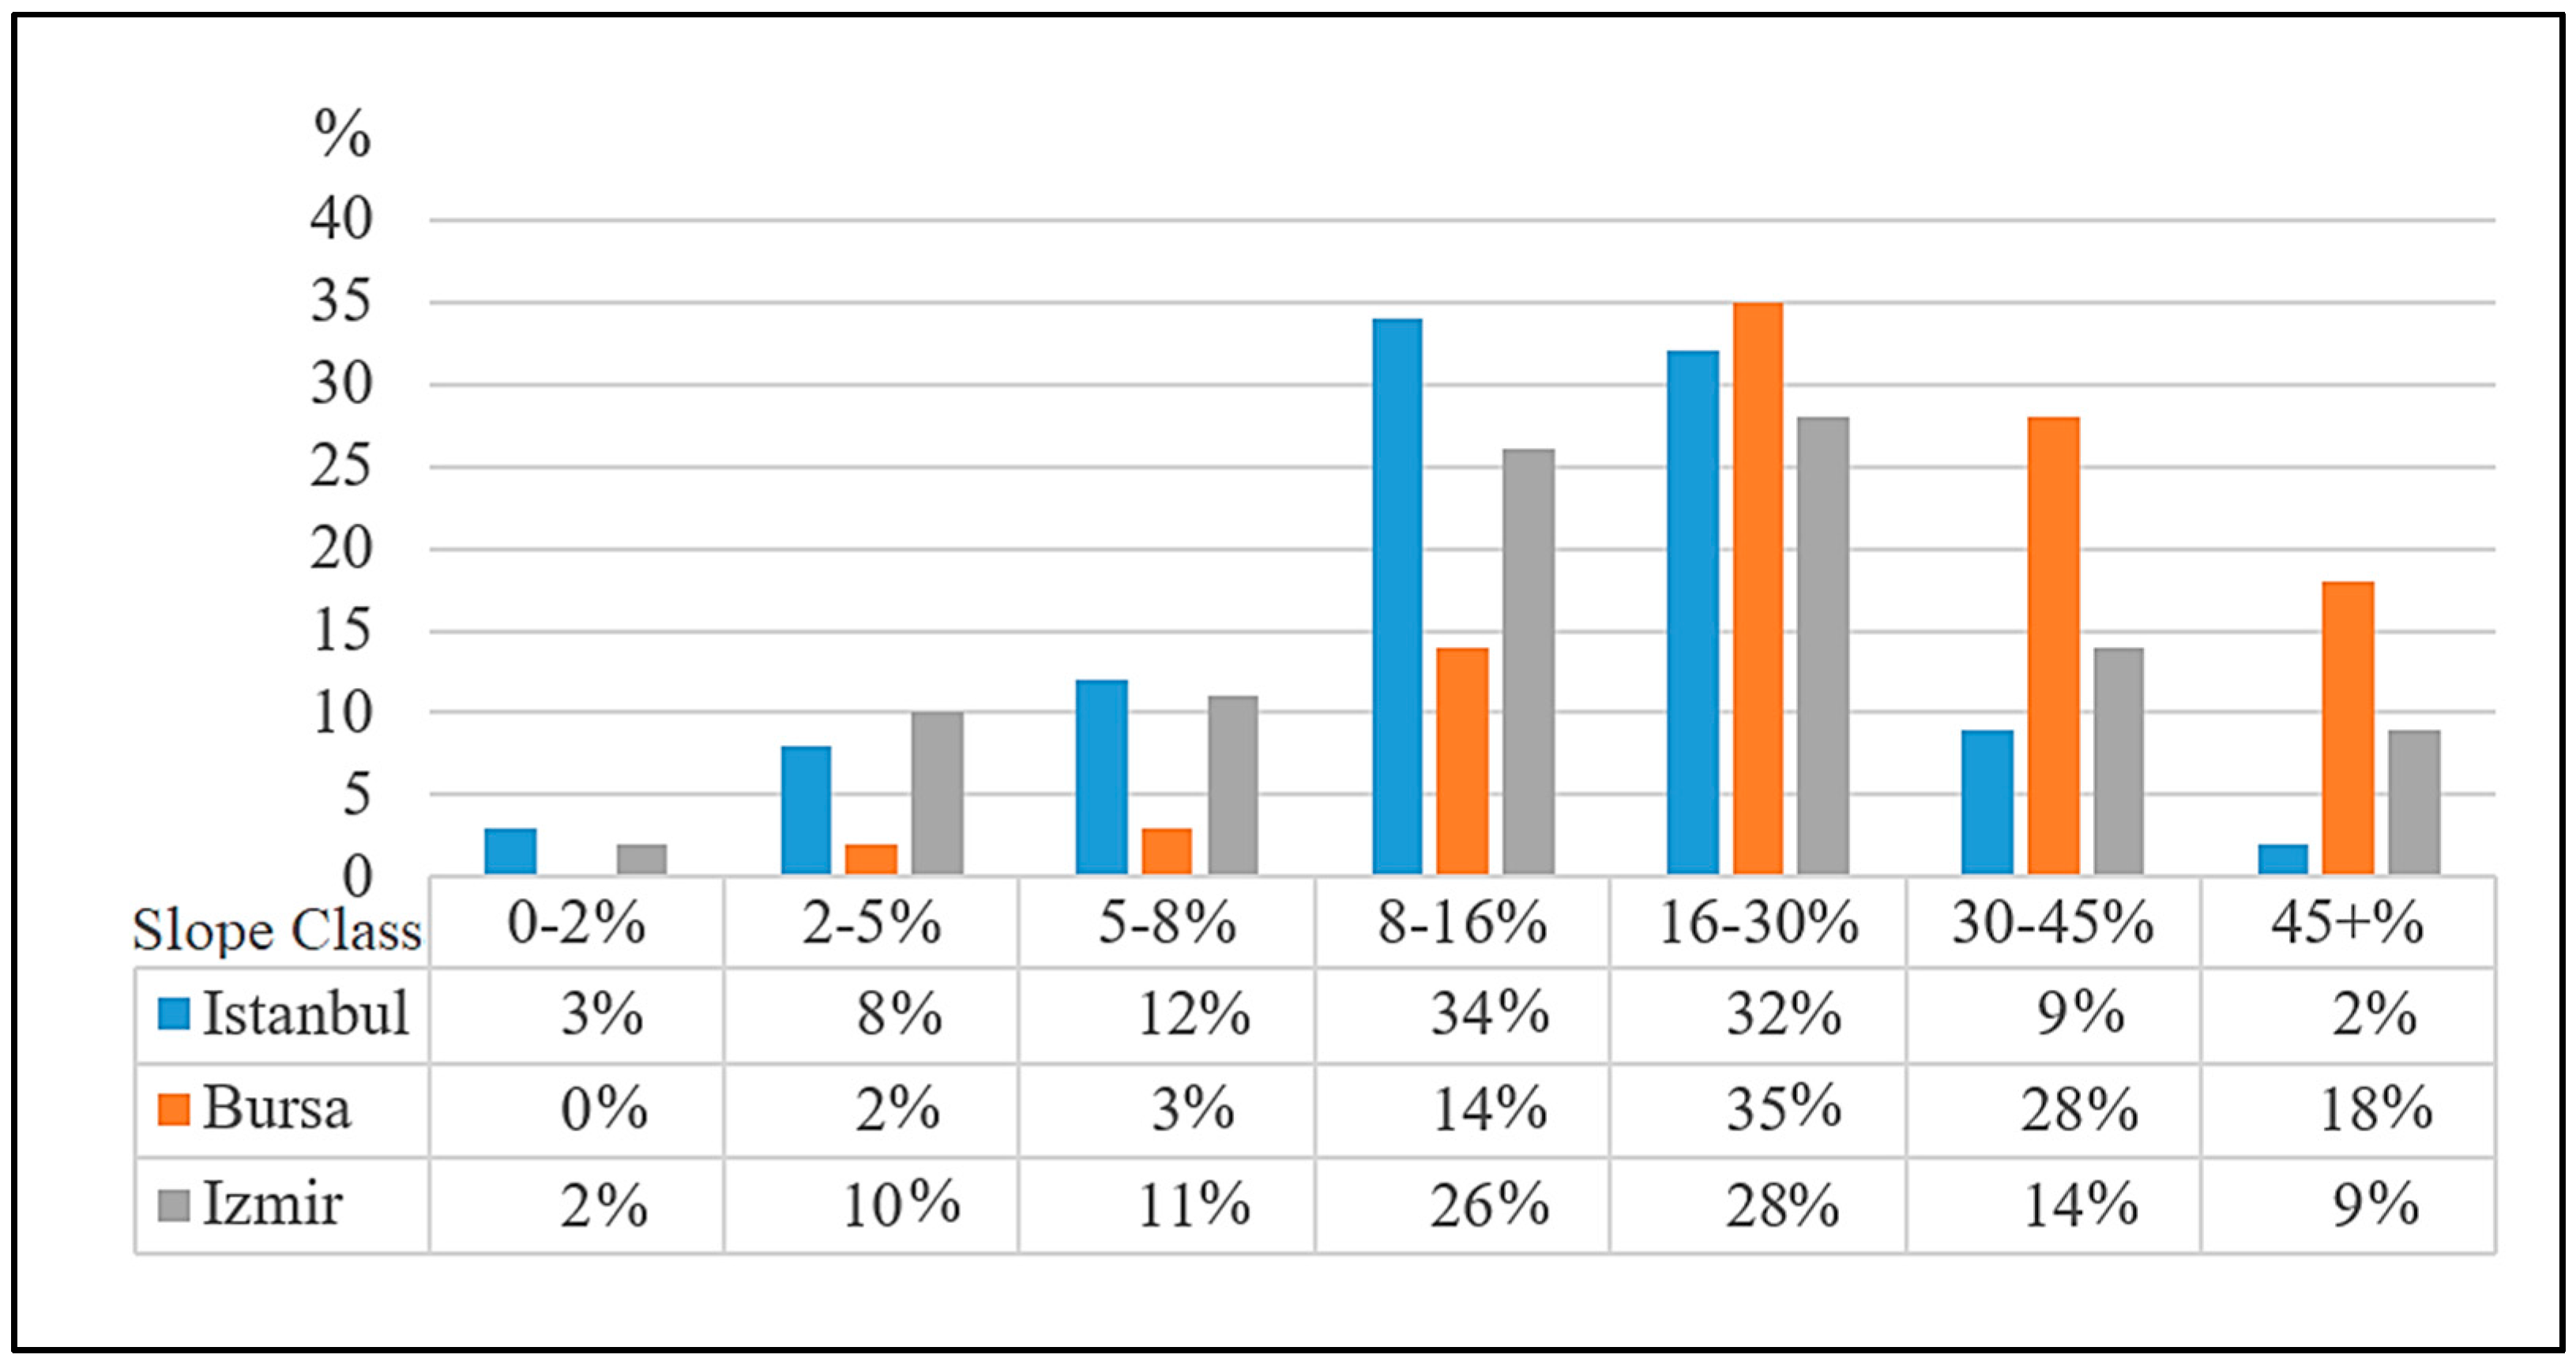
The topographic and LC characteristics of the study areas are shown in Figure 2 and Figure 3. These figures represent the percent of area covered by different slope and LC classes for each study region. As shown in Figure 2, most of the Istanbul region has a slope of 5–30%, whereas the Bursa region has steeper terrain, with most slopes greater than 16%. The Izmir region has balanced slope characteristics, including significant areas of all slope classes, concentrated at 8–16%.
Figure 3 summarizes the general LC characteristics of the three study sites. “Artificial Surfaces” and “Forests and Semi-Natural Lands” are the predominant LC classes in the Istanbul region. “Agricultural Areas” and Forests and Semi-Natural Lands” classes are predominant in the Bursa region, whereas the Izmir region comprises a mixture of the “Artificial Surfaces”, “Agricultural Areas” and “Forests and Semi-Natural Lands” classes. These analyses provided an initial demonstration of the suitability of the study areas for the evaluation of the topographic conditions and LC characteristics.
3. Methodology
The reference images close to the NADIR viewing angle were geometrically corrected with an RMSE of ±1.2 m using GCPs obtained from 30 cm resolution aerial orthophotos that was provided by the General Commander of Mapping (Harita Genel Komutanlığı—HGK). Aerial orthophotos are distributed as a web map service (WMS); thus, manual orthorectification was the only option for the preparation of the reference images. After manual orthorectification of the reference images, an automated SIFT-based orthorectification process was conducted for low- and high-incidence angle datasets for each study region. Because most of the VHR image analysis concerned pan-sharpened images, evaluation of the performance of the SIFT-based autonomous orthorectification method on directly retrieved single-channel data or data generated using arithmetic operations from the pan-sharpened images was critical. Thus, panchromatic data and the R, G, B and NIR channels of the pan-sharpened data and data produced using the band arithmetic function with the equations RGB/3 and RGBN/4 were prepared. Automated SIFT-based orthorectification was performed for these seven datasets using their corresponding data types from the reference orthoimage to analyze the impact of spectral information on the SIFT algorithm and propose the best alternative. The results were evaluated using the RMSE of the independent check points (ICP) measured for each region.
3.1. Geometric Correction (Orthorectification)
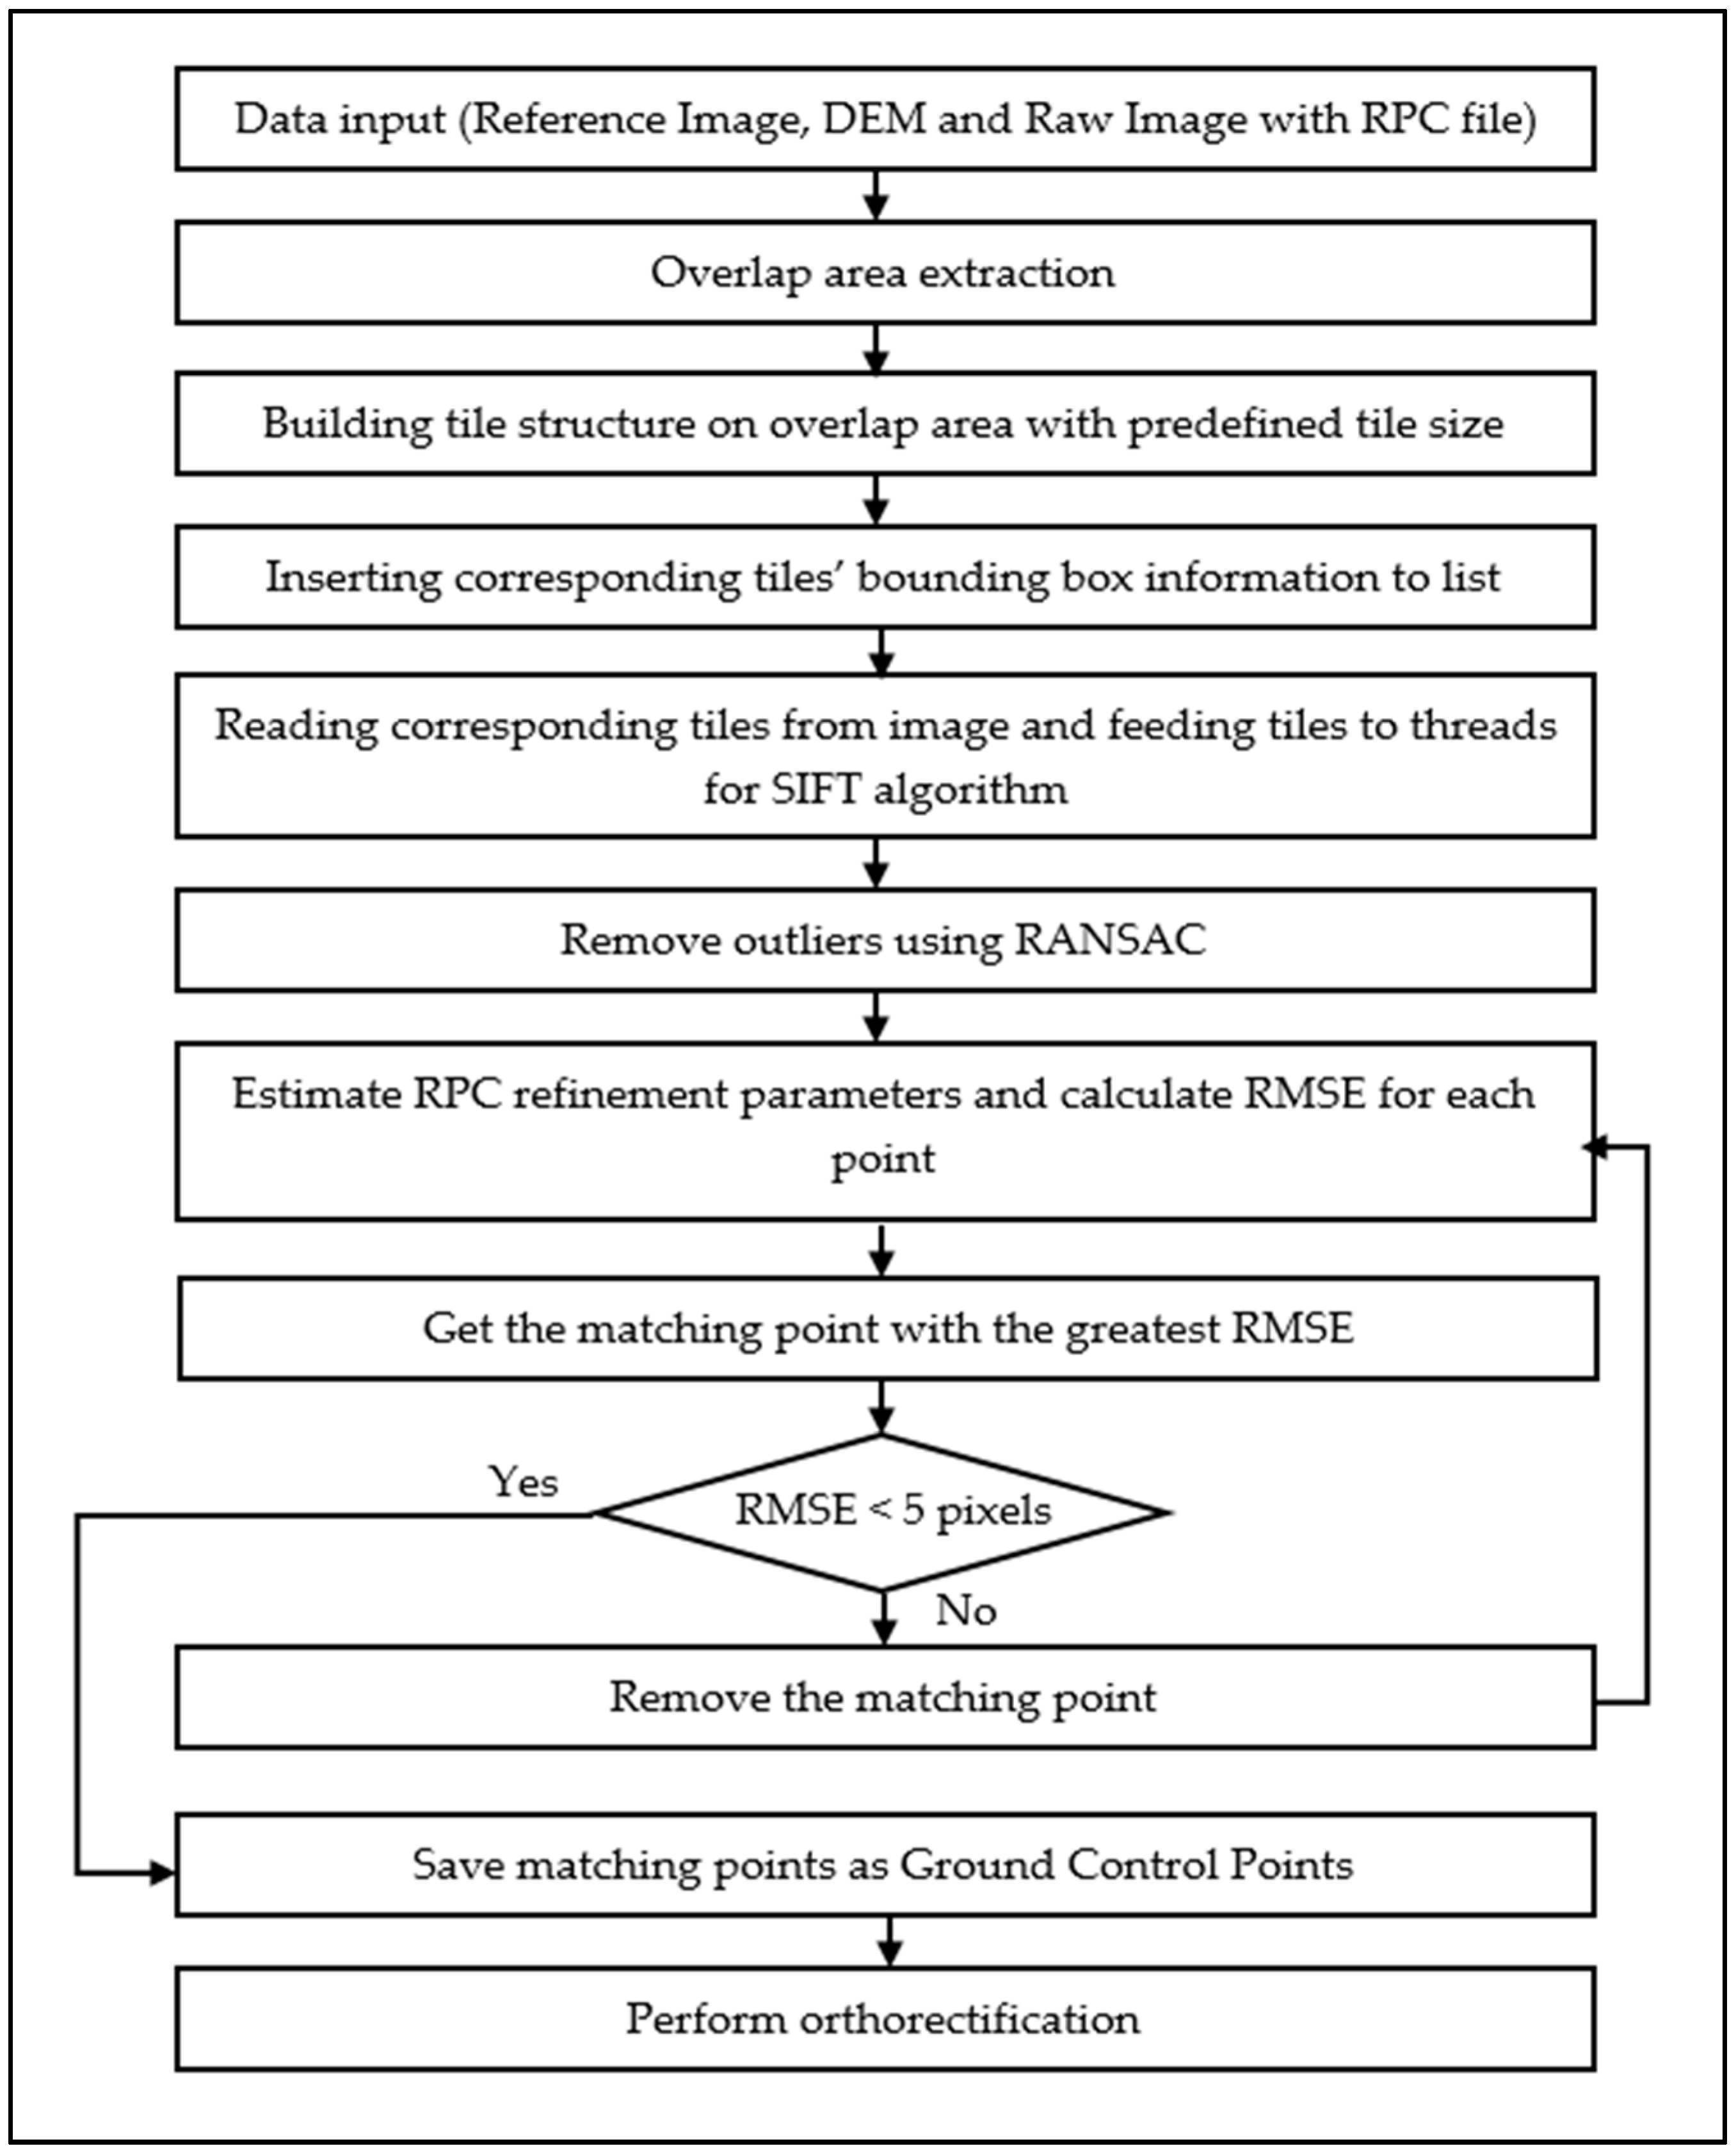
The RPC model is an empirical model that defines the relationship between the image space and the object space with rational polynomials [35]. The coefficients of the RPC model are estimated using the physical parameters of the platform and delivered to the end user of the satellite image. The RPC refinement model, which improves the accuracy of the RPC model, was selected as the geometric correction model in this study. Figure 4 shows a simplified flowchart of the process.
As shown in Figure 4, the raw satellite image, RPC file, DEM and orthorectified reference image were the process inputs. The overlapping area of the reference and the raw image was calculated, and tiles with predefined raster dimensions from two images in the overlapping area were produced. Then, spatially matching tile pairs were sent to an available CPU thread to conduct SIFT-based image matching with a multi-thread processing approach. The initial outlier removal operation with RANSAC was conducted for each tile pair after the image matching process, and the inlier matching points were saved as GCP candidates. After all tiles had been processed, the resultant GCP candidates were combined and used as inputs to the RPC refinement process. In the next step, the horizontal coordinates of GCP candidates derived from RPC refinement and their corresponding horizontal coordinates from the reference data were used to calculate the RMSE of each candidate. The GCP candidate with highest RMSE was determined and if its RMSE value was greater than 5 pixels, this candidate was considered to be outlier and removed from the dataset. Refinement procedure is performed again as coefficients of the function and RMSE of the remaining points will change after the point removal. This secondary outlier removal procedure is applied iteratively until RMSE value is lower than 5 pixels for all candidates. After removing all outliers, the remaining GCPs were used in the orthorectification process with RPC refinement. The relationships between the image coordinates of the GCPs and the corresponding coordinates from the reference images were modeled with polynomial equations, and the coefficients derived from these equations were used to refine the RPC-based orthorectification.
The two most important components of the whole process chain were the derivation of the refinement function and the SIFT-based image matching which are explained in Section 3.1.1 and Section 3.1.2, respectively.
3.1.1. RPC Refinement
Regarding the sensors and terrain relief, random errors and biases occur in the results after geometric correction using the RPC model [9]. The accuracy of the results obtained using the RPC model can be improved and the remaining errors and biases can be eliminated using a refinement function and GCPs. The refinement function is given in Equations (1) and (2) [36].
where Linei(j) and Samplei(j) represent the image coordinates of the GCPs, Δp(j) and Δr(j) are the functions of differences between the coordinates calculated using RPC and the exact coordinates (measured from reference image) and p(j)(Φk, λk, hk) and r(j)(Φk, λk, hk) represent the rational functions constructed with coefficients from the metadata.
Linei(j) = Δp(j) + p(j)(Φk, λk, hk) + εLi
Samplei(j) = Δr(j) + r(j)(Φk, λk, hk) + εSi
The functions of the difference, which are the essential equations used to refine the entire image, are shown in Equations (3) and (4) [36].
where a0, aS, aL, ..., b0, bL, bS, ... are the adjustment parameters for an image and Line and Sample are the image coordinates of a GCP.
Δp = a0 +aS · Sample + aL · Line + aSL · Sample
· Line + aL2 · Line2 + aS2 · Sample2 + …
· Line + aL2 · Line2 + aS2 · Sample2 + …
Δr = b0 +bS · Sample + bL · Line + bSL · Sample
· Line + bL2 · Line2 + bS2 · Sample2 + …
· Line + bL2 · Line2 + bS2 · Sample2 + …
These functions can be defined as either first- or higher-order polynomials. The unknowns of these functions are estimated using Least Square Adjustment (LSA) with enough GCPs to solve the equation, and the solved functions are used to refine the RPC results for all pixels in the image. In this research, the first- and second-order polynomial functions were evaluated using the RMSEs of the GCPs they produced (Table 2). The second-order polynomial functions had smaller RMSEs and were used to determine the shift and rotation coefficients of correction for the PRC model (refinement process).
3.1.2. SIFT Algorithm
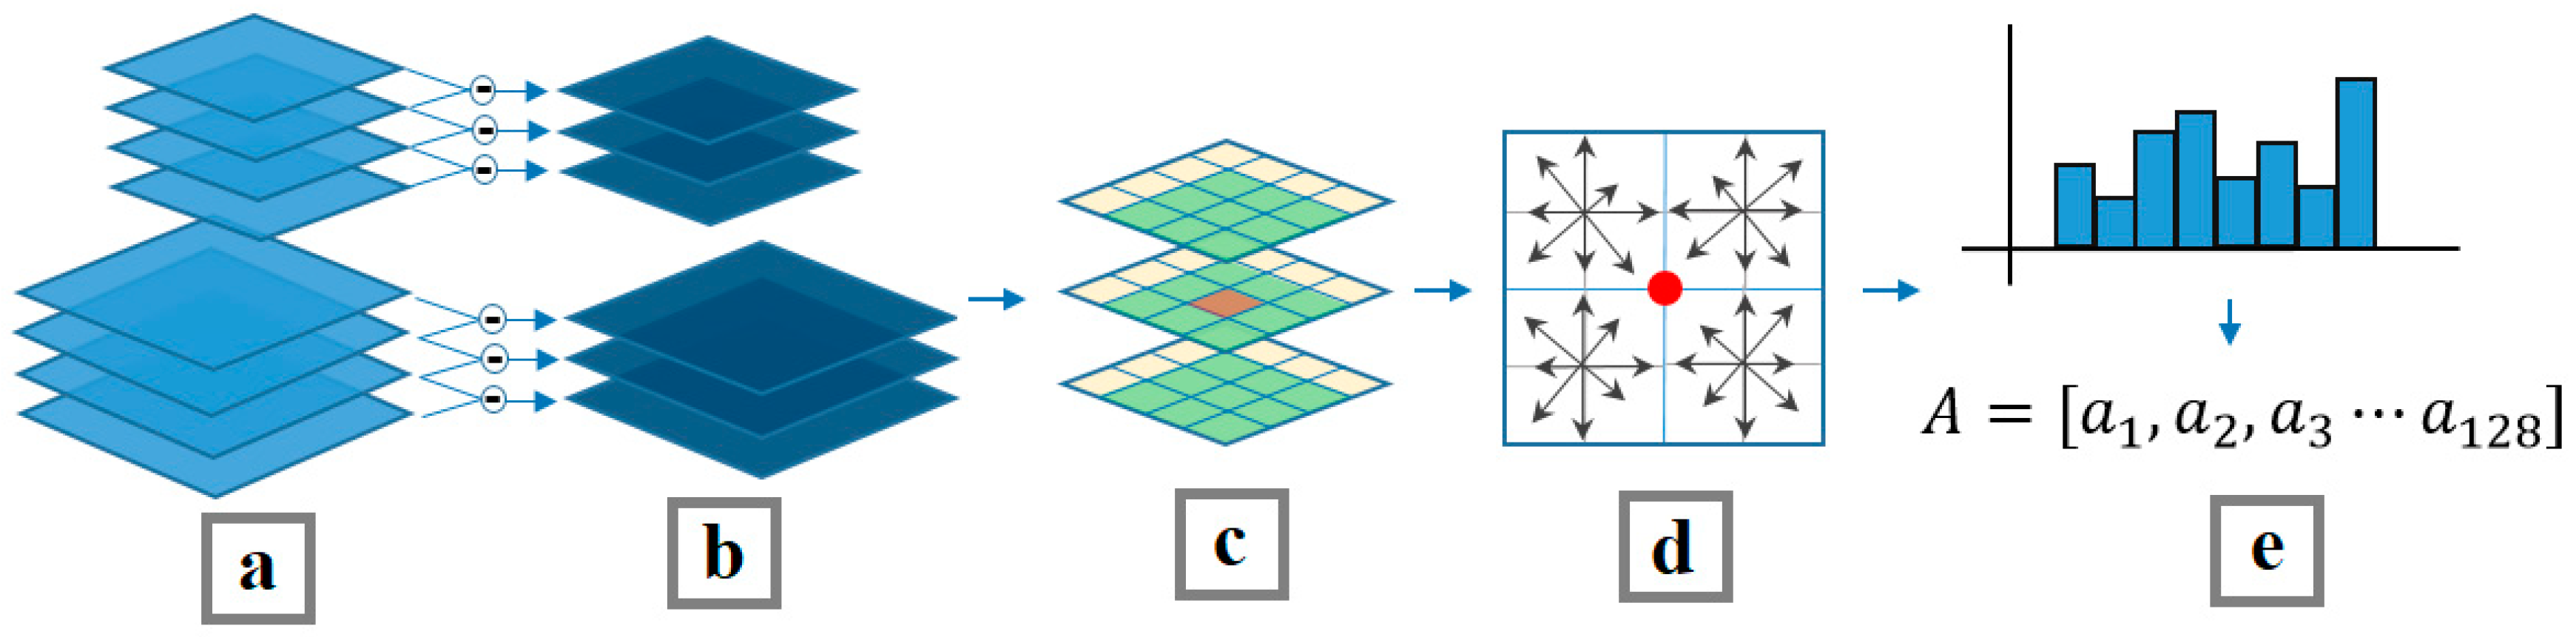
The SIFT image-matching algorithm was developed by David Lowe et al. and has been used in several studies. The aim of SIFT is the extraction of features that are invariant to image rotation and scale. The rotation invariance is ensured using the gradient orientations and magnitudes of the pixels around the key points, and the scale invariance is ensured using the scale space approach. The steps of the algorithm are scale space production, difference of Gaussian (DOG), finding local maximum and minimum, eliminating bad points, assigning orientation to key points and feature transformation [25,37,38,39,40].
The SIFT algorithm first generates the scale space images by convolving the input images using Gaussian Convolution (Figure 5a), and attains the differences between Gaussian images by subtracting adjacent images (Figure 5b). Local maximum and minimum points are then detected by comparing neighbor pixels with the target pixels in the current and adjacent DOG images. Local maximum and minimums are saved as key points (Figure 5c). The key points, which lie on the edges and have low contrast, are eliminated. In the next step, gradient orientations and magnitudes of the neighbor pixels around the key points are calculated using Equations (5) and (6) (Figure 5d). Histograms of gradient orientations are then created according to gradient magnitudes (Figure 5e). Finally, a 128 dimensional vector is computed and assigned to related key points for further matching processes. Finally, the matching process is carried out via a distance comparison between two key point datasets. Key points, which satisfy predefined threshold values for the distance comparison process, are saved as matching points. Figure 5 illustrates the steps of SIFT feature extraction.
where m(x,y) is the magnitude of the gradient, θ(x,y) is the orientation of the gradient and L(x,y) is the intensity value for the image coordinates, x and y.
4. Results and Discussion
This study proposed a fully automated process chain to improve the location accuracy of orthorectification with the use of GCPs produced by SIFT-based image matching. GCPs were used to determine the RPC refinement function coefficients. The effects of the incidence angle, topography, land cover and spectral characteristics on the proposed method were tested by applying the method on low and high incidence angle images and at three regions where LC and topographic characteristics were significantly different. Additionally, the performance of the multi-thread code design was evaluated by comparing the processing time with respect to single thread processing.
Several aspects of the results of the research outputs were evaluated. As a first evaluation step, the location accuracy of the resulting image sets of each study region were determined with Independent Check Points (ICP) whose 2D coordinates were collected from reference images. In this evaluation step, an accuracy assessment was performed using the RMSE metrics. This evaluation step provided valuable quantitative information about the effects of the incidence angle and the performances of different image bands in SIFT-based orthorectification.
In a second evaluation step, the images were orthorectified using the original RPC and DEM data only, and the location accuracy values of these images was measured in terms of RMSE using the same ICPs as in the first evaluation step. The resulting RMSE values were compared with the RMSE values from the first evaluation to measure the efficiency of the proposed method compared to that of RPC-based orthorectification.
As a third evaluation step, the GCPs produced using the SIFT algorithm were analyzed with the slope and CORINE LC maps to understand the relationship between the GCPs, topography and LC types. The distribution of GCPs over slope groups and LC classes provided information to aid in the understanding of the effects of topography (slope) and LC on GCP characteristics, which are direct indicators of the performance of the proposed method.
The last step of the evaluation was performed by conducting the entire process chain in single thread and multi-thread environments and comparing the processing times.
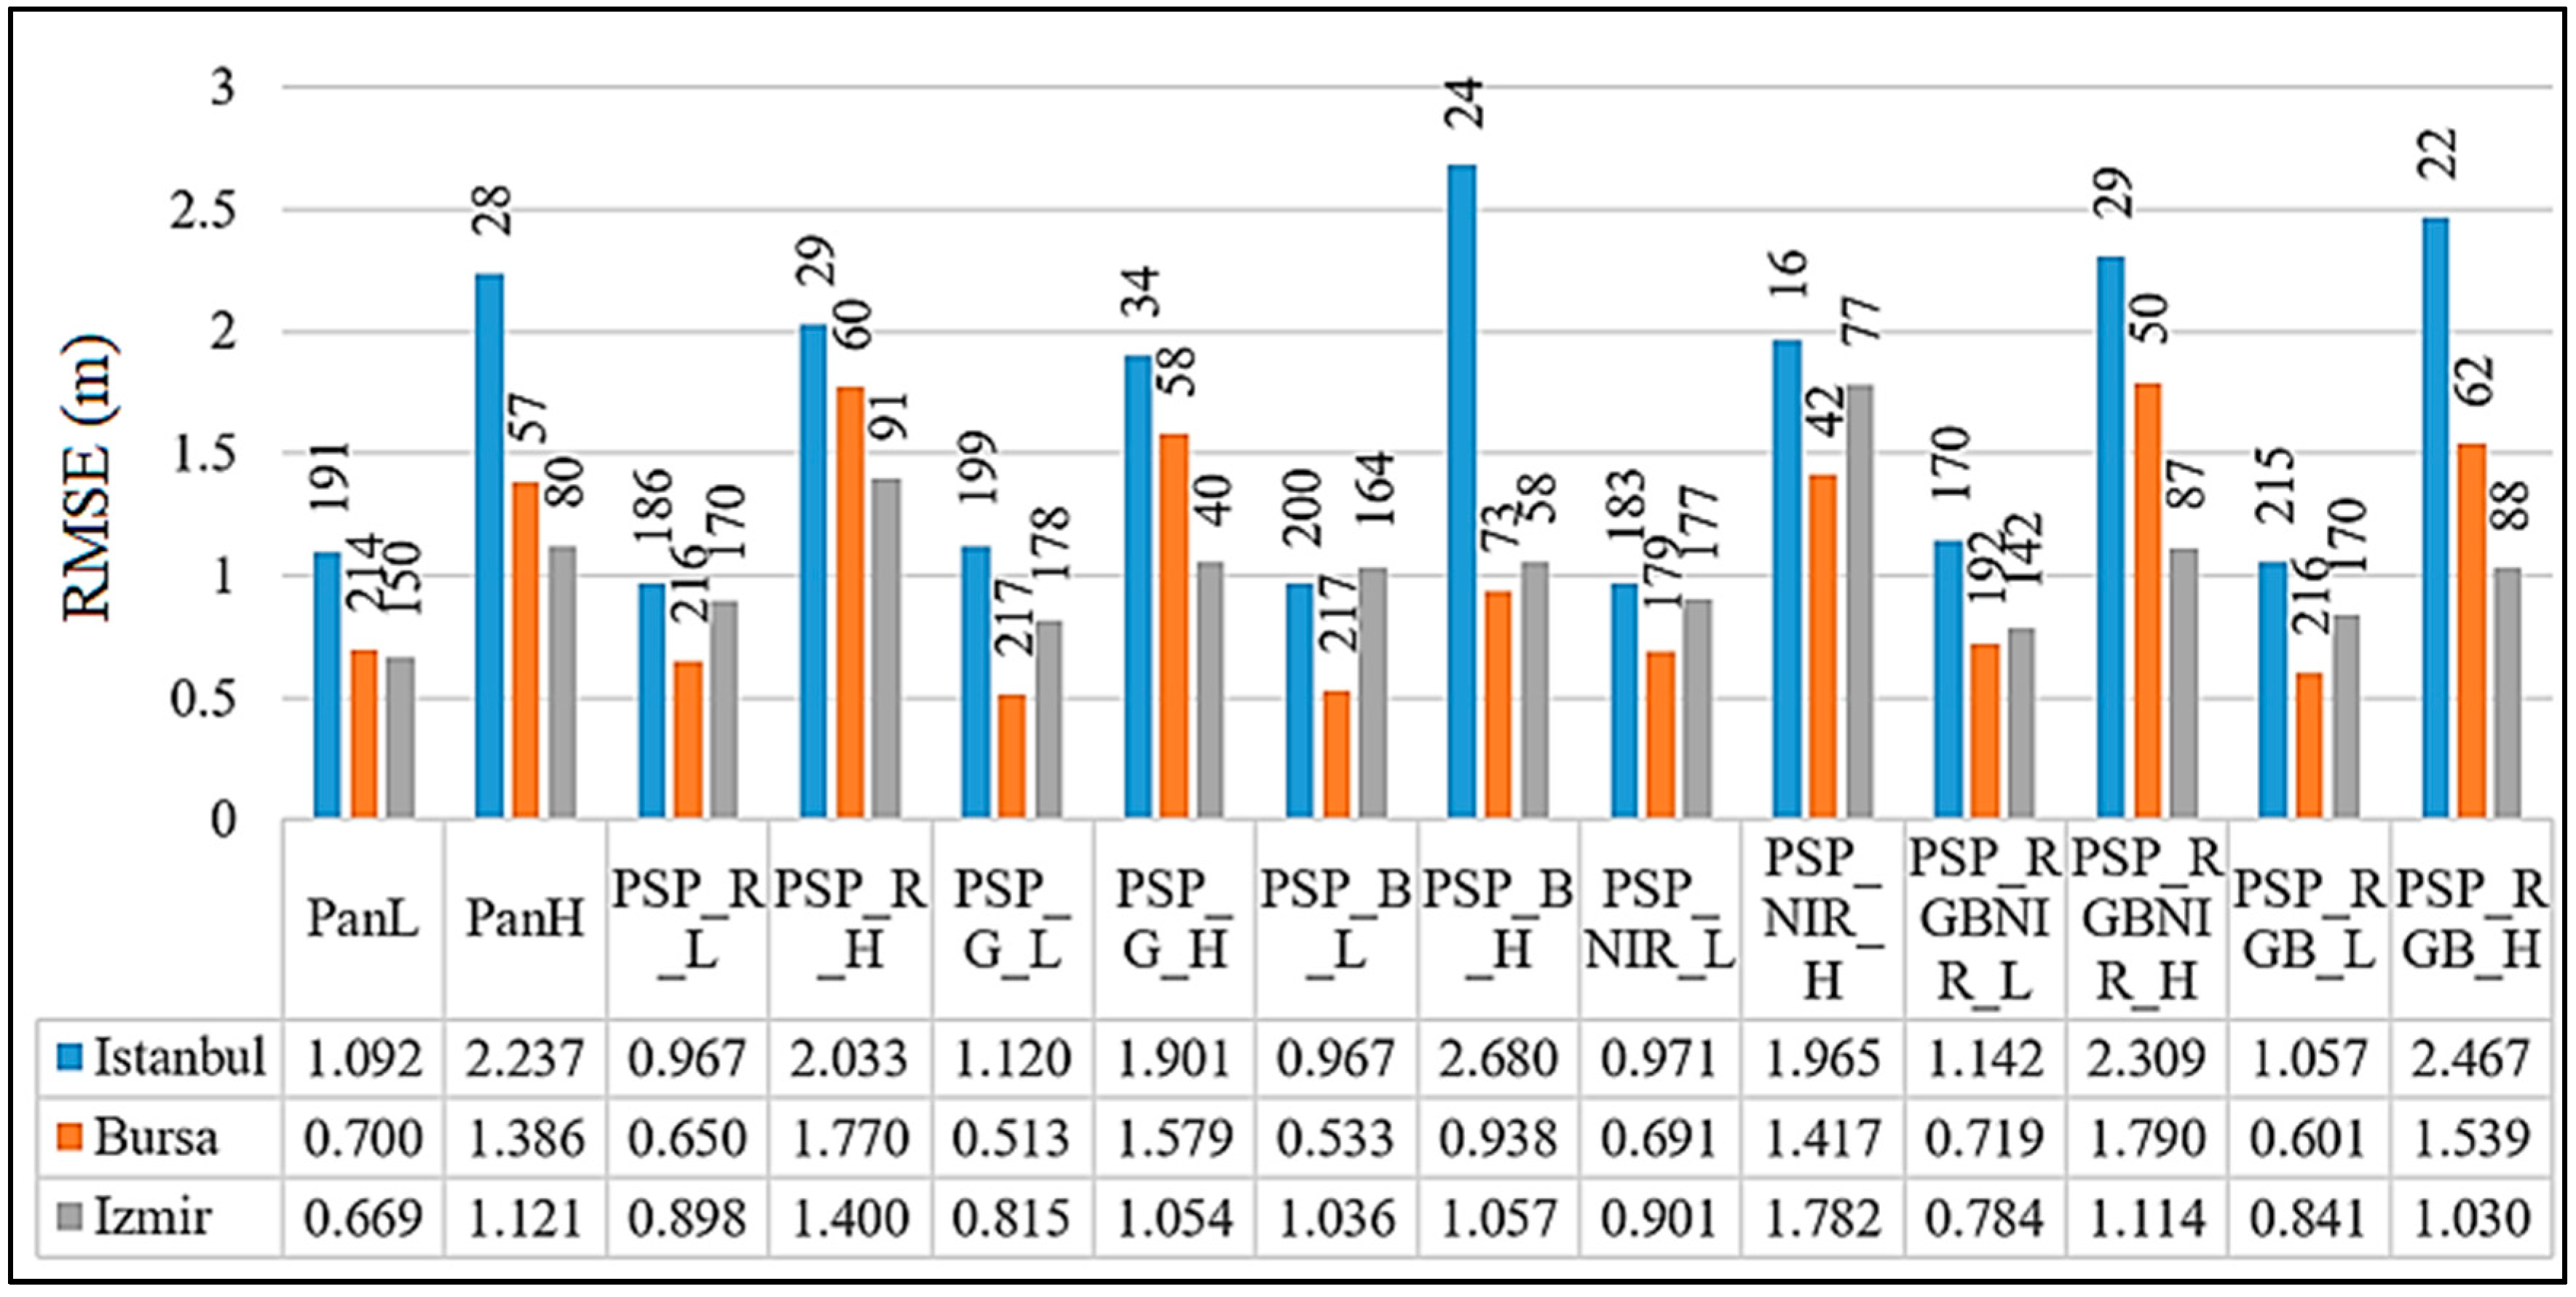
Detailed results of the first evaluation step are shown in Figure 6. The numbers above the bars in the graph indicate the matching points generated by the SIFT algorithm for that specific test. Panchromatic (PAN), pan-sharpened red (PSP_R), pan-sharpened green (PSP_G), pan-sharpened blue (PSP_B), pan-sharpened NIR (PSP_NIR), a pan-sharpened RGBNIR (PSP_RGBNIR) combination and a pan-sharpened RGB (PSP_RGB) combination of both low (L) and high (H) incidence angle data were created and used as inputs for the SIFT algorithm to analyze the impacts of spectral characteristics on image matching.
The results of this research showed that the automated orthorectification of images with low incidence angles provided better accuracy than high incidence angle images for all three test regions in terms of the RMSE calculated using 10 randomly distributed ICPs. In Figure 6, similar RMSEs were obtained for seven different spectral band configurations for the images with low incidence angles for each study area. The results from images with high incidence angles indicated anomalies in the blue channel for the Istanbul region, the red channel and the RGBNIR/4 arithmetic data for the Bursa region and the near infrared channel for the Izmir region. These anomalies probably occurred due to seasonal variation, as the difference in acquisition dates between the high incidence angle images and the reference images was comparatively greater. The results obtained from different datasets showed that the arithmetic data produced using pan-sharpened multi-band images can be used for automated orthorectification processes. The results also showed that a geometric accuracy of ±1 m can be achieved with the developed automated orthorectification algorithm using SIFT on low incidence angle satellite images. At this point, it is important to note that the geometric accuracy mentioned here represents the relative locational agreement with the reference data and was measured by precisely but manually selected ICPs. Thus, the accuracy metric also includes the errors related to the orthorectification of the reference data and the selection of ICPs.
Moreover, the SIFT algorithm generated more GCPs in images with low incidence angles than high incidence angles. The lowest incidence angle provided the best locational accuracy in the Bursa region, whereas the highest incidence angle provided the worst geometric accuracy in the low incidence angle dataset in the Istanbul region. In the high incidence angle dataset, the Istanbul region provided the worst geometric accuracy with the highest incidence angle, whereas lower incidence angles resulted in better accuracy in the Bursa and Izmir regions. The results of the analysis of the relationship between the geometric accuracy and the incidence angle show that these two parameters are highly correlated. Figure A1 presents the distribution of the validated GCPs and ICPs for the high and low incidence angle images of the three test regions. The GCPs were derived from SIFT matching and outlier removal processes belonging to the arithmetic mean of RGB channels.
In addition, the results showed that the secondary outlier removal process introduced in this research is an important step, which determines the most accurate GCP set for use in the orthorectification process. Although the RANSAC algorithm that was applied inside the SIFT process eliminated the false matches, the resulting matching points (GCP candidates) still included some points with lower locational match quality. After the proposed outlier process, 3% to 25% of the matching points were removed as outliers. The high incidence angle image of the Istanbul region faced an exceptional removal rate of around 40%. Moreover, the number of outlier points increased with high incidence angle images in general. Table A1 presents the statistical results and matching ratios after the secondary outlier removal process in all test conditions.
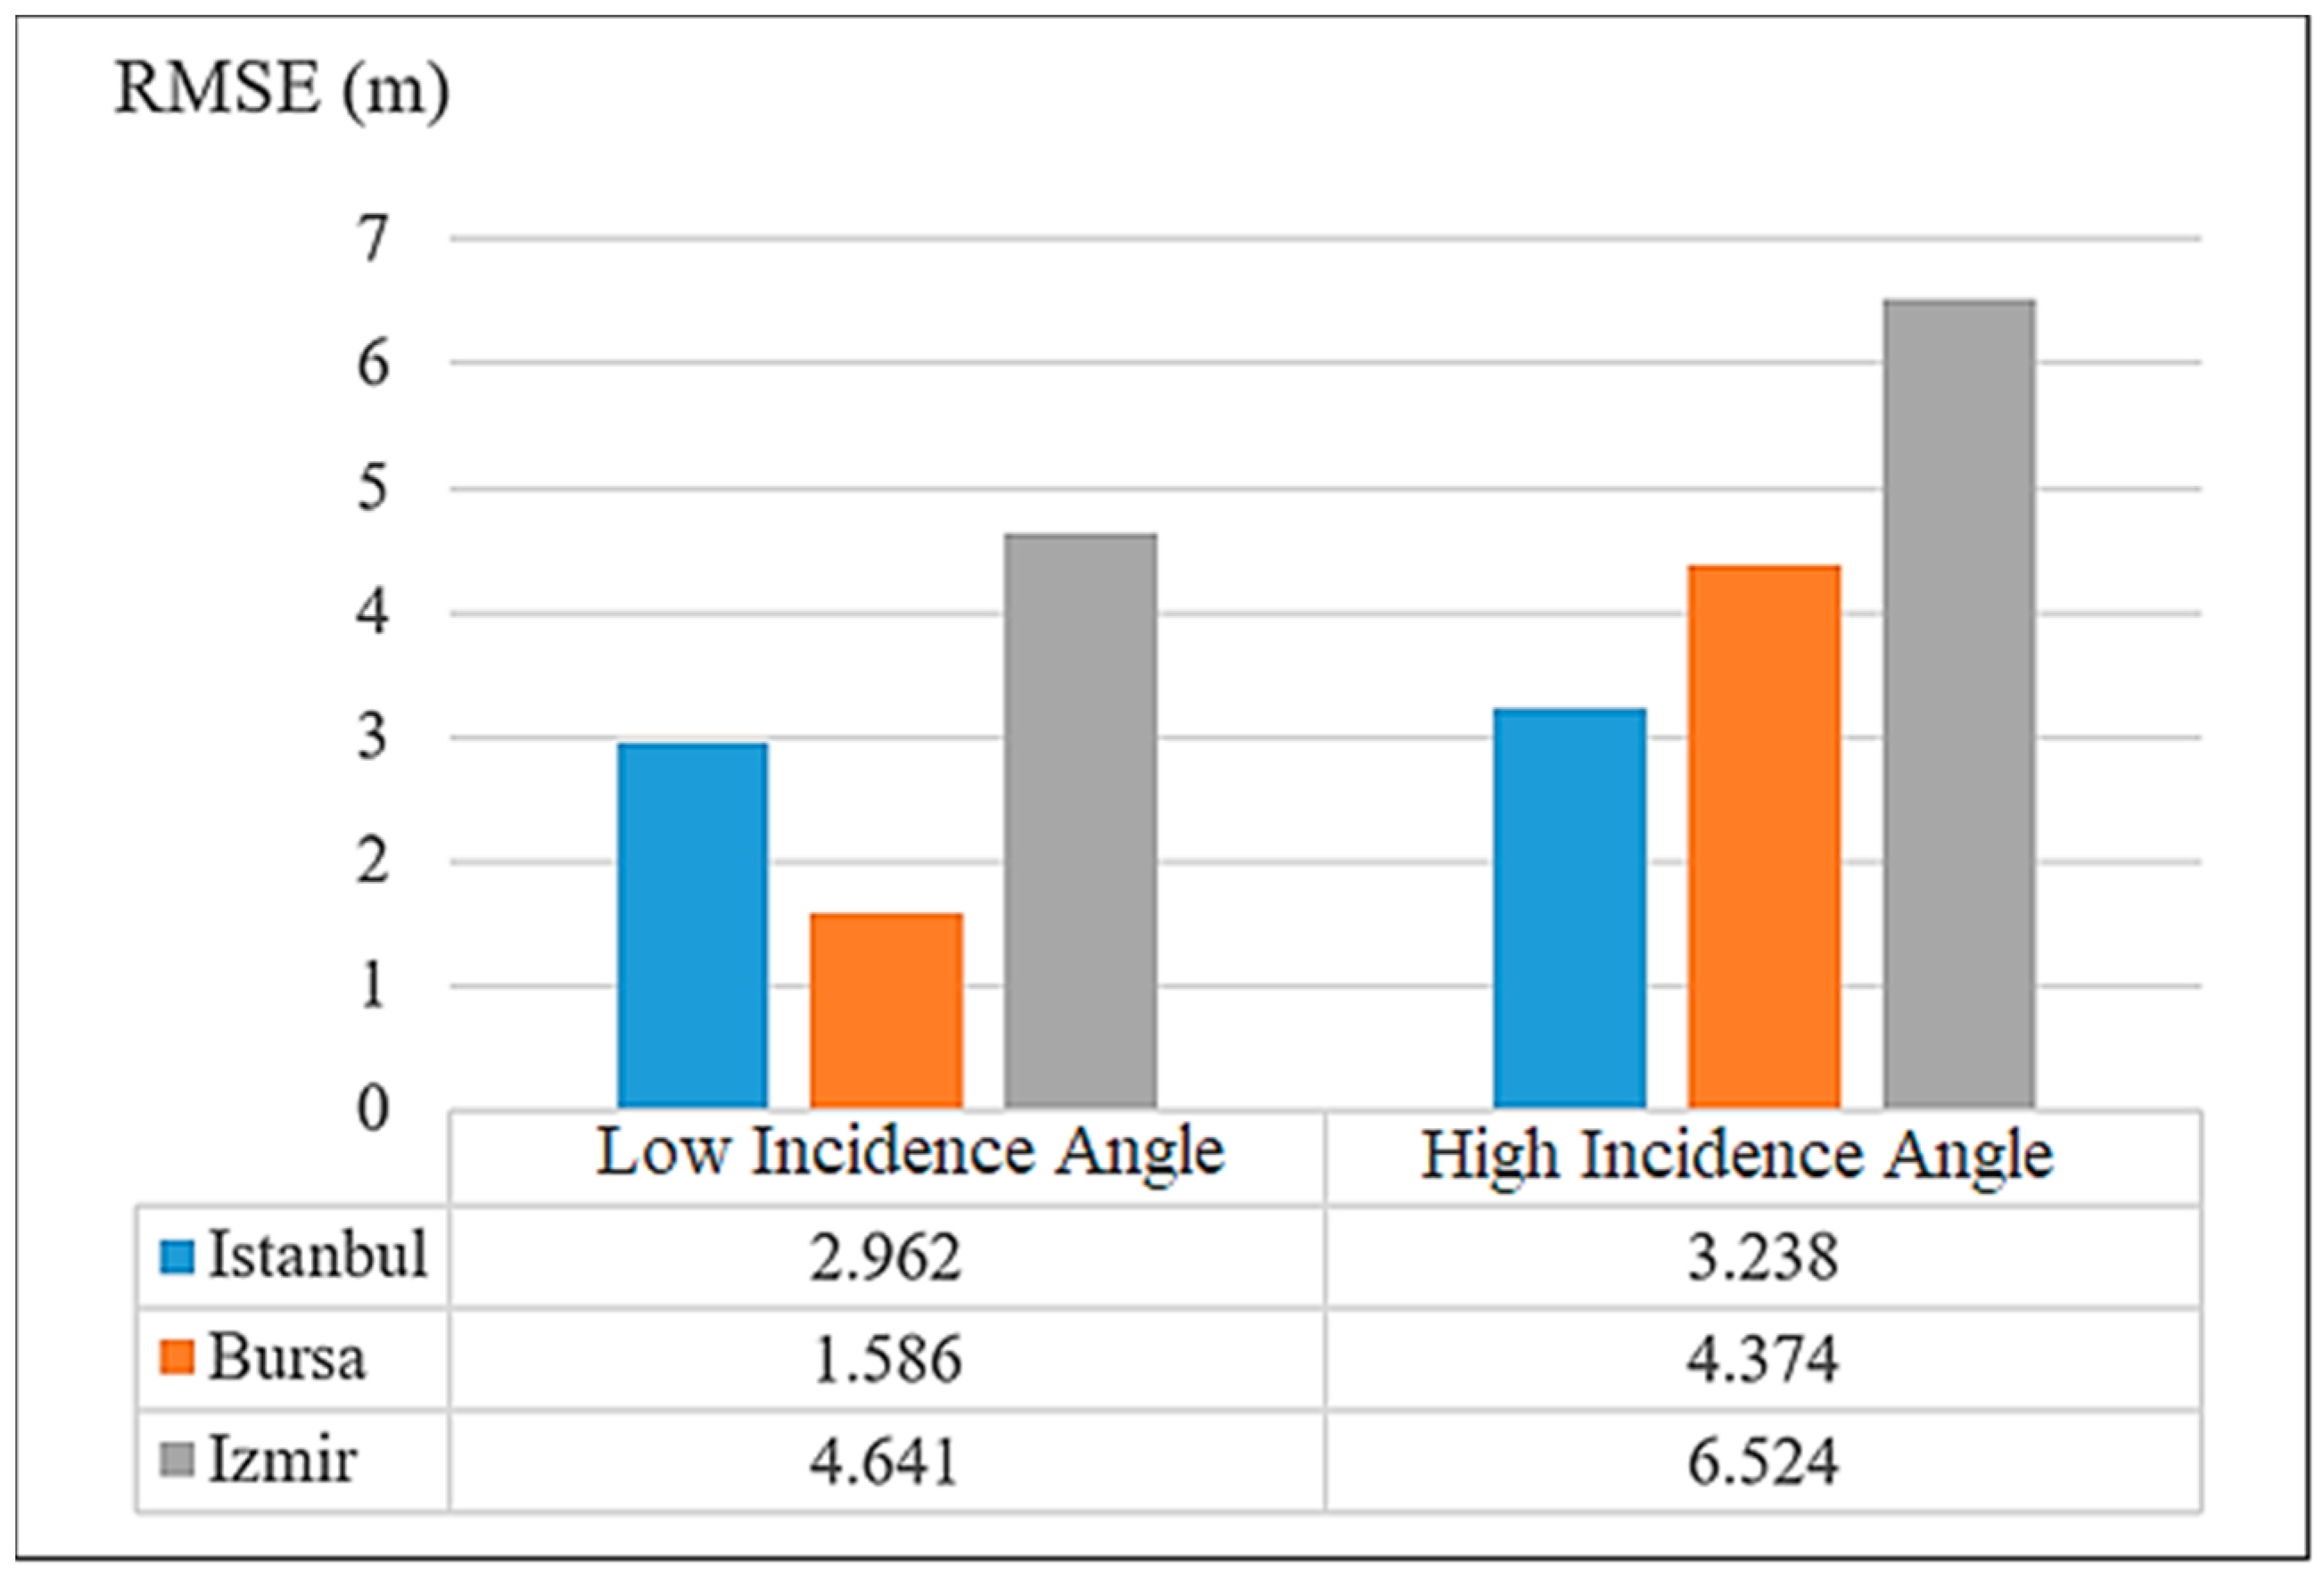
For the second evaluation procedure, the RMSE values were obtained using the images that were orthorectified by original RPC model, and the results are shown in Figure 7. Better locational accuracy values were obtained for satellite images with low acquisition angles.
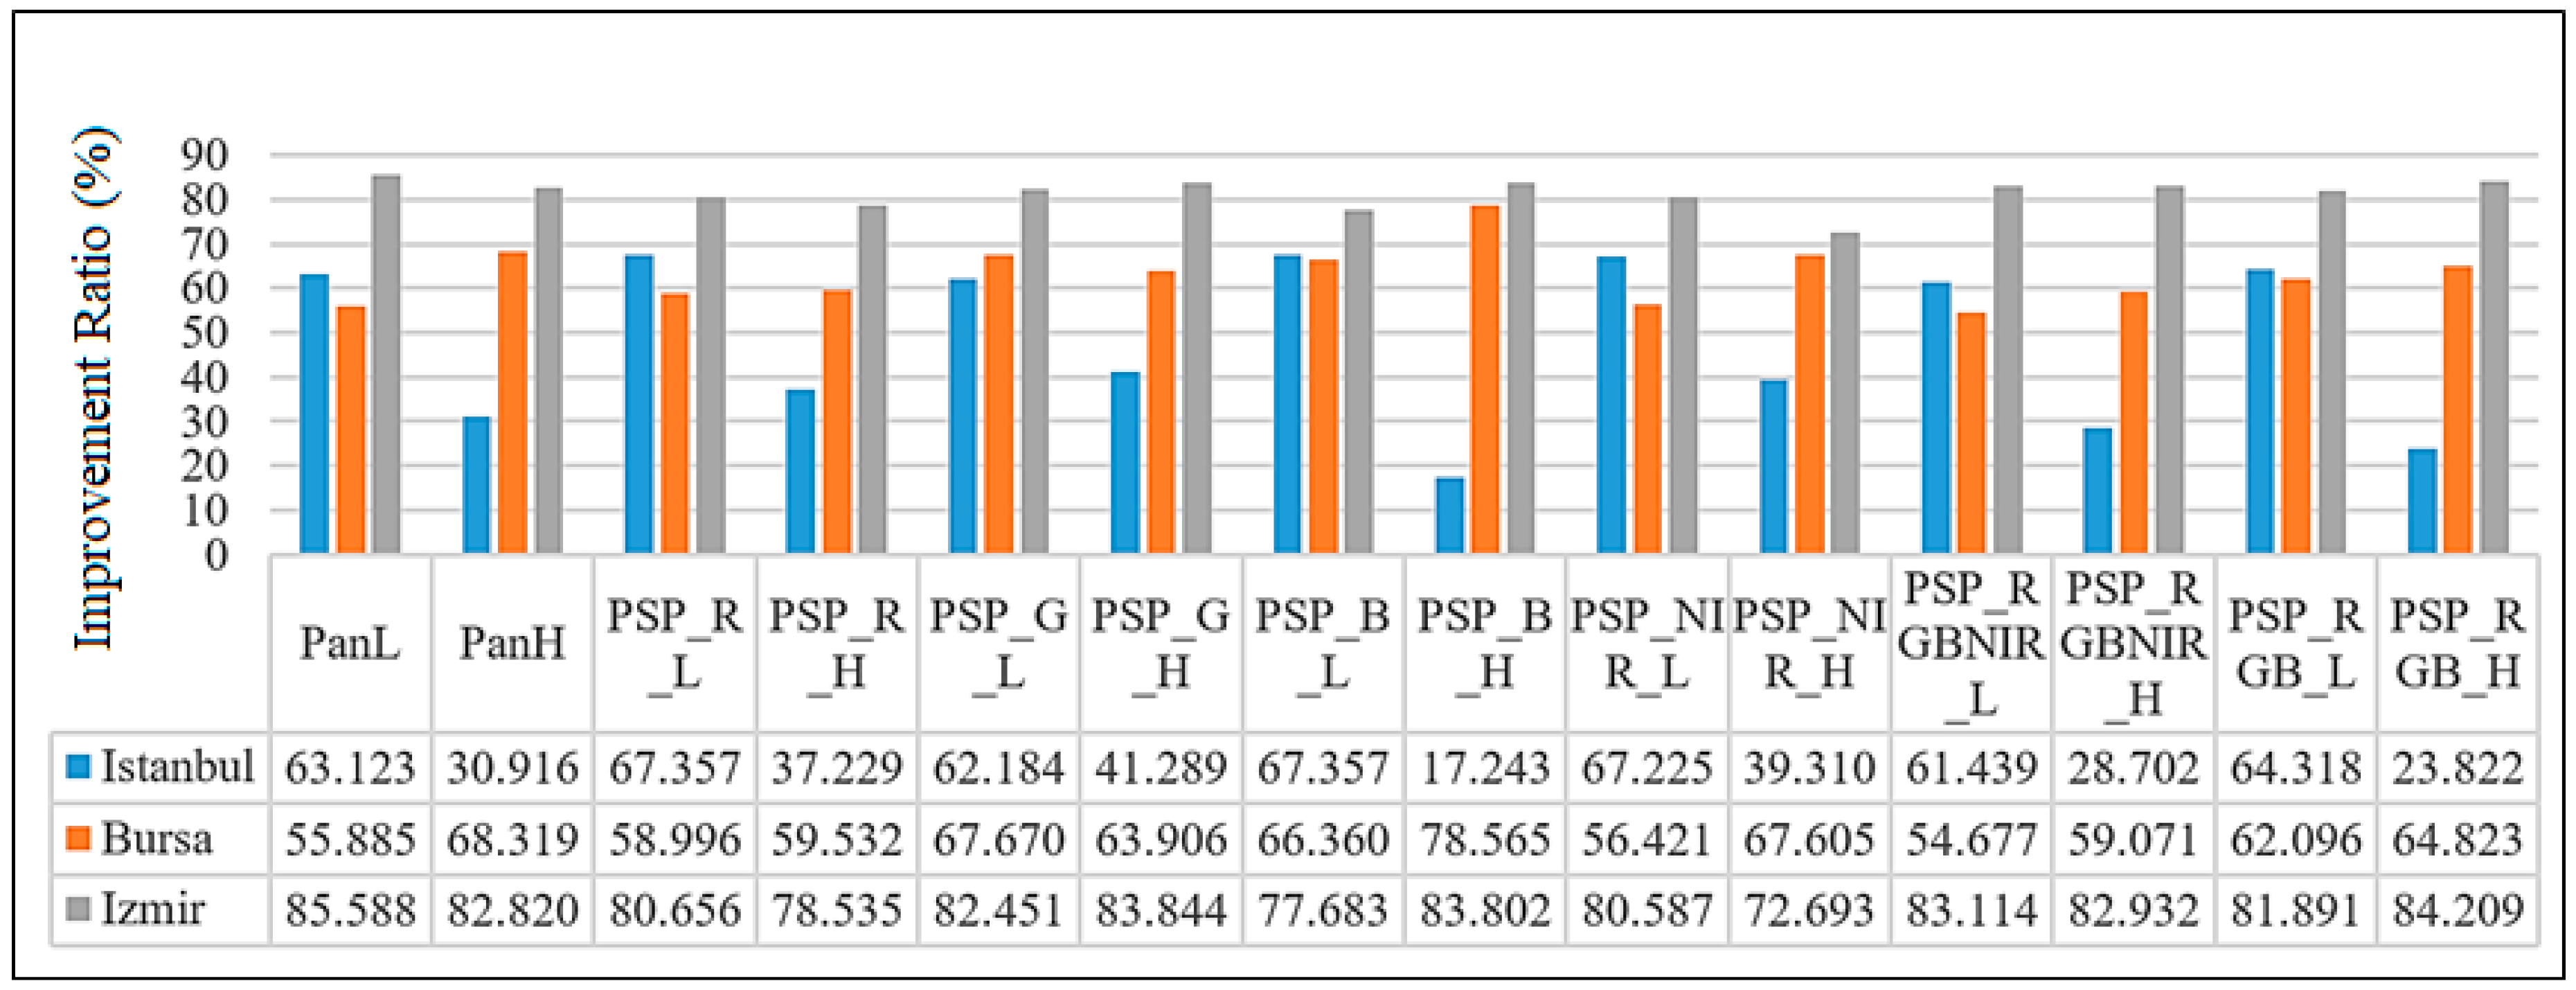
The difference between the RMSEs of low and high incidence angle images was higher for the Bursa and Izmir regions. A comparative analysis was conducted by calculating the improvement ratio of the proposed SIFT-based RPC refinement method over the original RPC results (Figure 8). The comparison showed that the proposed model improved the spatial accuracy the most in the Izmir region, with improvement ratios of over 80% (85% for panchromatic—low incidence angle data).
The effects of the surface topography and land use/land cover parameters on the proposed method were also analyzed to fulfill the third evaluation step. Slope maps were produced from ASTER GDEM, and an analysis was conducted using seven predefined slope classes from these maps and the GCPs for each slope class. The number of GCPs and their RMSEs for each class are shown in Table 3.
According to Figure 2 and Table 3, the distribution of the GCPs was in proportion with the area covered by the related slope groups. More GCPs were generated in slope groups that covered larger areas. Significantly, the RMSE results were similar and did not indicate a relationship with the slope groups. The reason behind this phenomenon can be related to the DEM data that was used in both the orthorectification of the reference dataset and the automated procedure which lead to similar performances and error characteristics, reducing the topographic effects and distortions in the vertical plane. This result indicates a need for further analysis with different DEM data in order to quantify the effects of the DEM quality in the automated orthorectification process, especially for hilly and mountainous areas. On the other hand, our analysis on the three regions with different topographic conditions indicated that SIFT algorithm was not affected by the topographic conditions while producing 2D GCPs by image matching, but the absolute horizontal location accuracy of these points may have been dependent on the used DEM data.
To evaluate the effects of the LC type on the SIFT algorithm and orthorectification process, CORINE data for Turkey was used, which was updated in 2015. An analysis was conducted to determine the relationships between the five generalized LC classes and the results of orthorectification process. The number of GCPs and mean RMSEs of the GCPs for each class are shown in Table 4.
According to the LC-based analysis, the “Forest and Semi-Natural Areas” class had the highest number of GCPs generated in all regions. The Artificial Surfaces class for the Istanbul and Izmir regions and the Agricultural Areas class for Bursa had the second-highest number of GCPs generated. These numbers are in agreement with the percentage of each LC class represented in Figure 3. As only 1% of the area was covered with Artificial Surfaces, there were fewer GCPs in the “Artificial Surfaces” class in the Bursa region. Image matching using SIFT in the “Forest and Semi-Natural Areas” class was successful, because the textural and spectral characteristics were not affected by seasonal conditions. Moreover, because artificial surfaces are static in terms of the spectral response in different seasons, the decrease in the number of GCPs for these areas in Istanbul and Izmir could have been due to the impact of the increasing incidence angle. In general, the RMSEs of the GCPs for LC classes did not indicate dramatic changes.
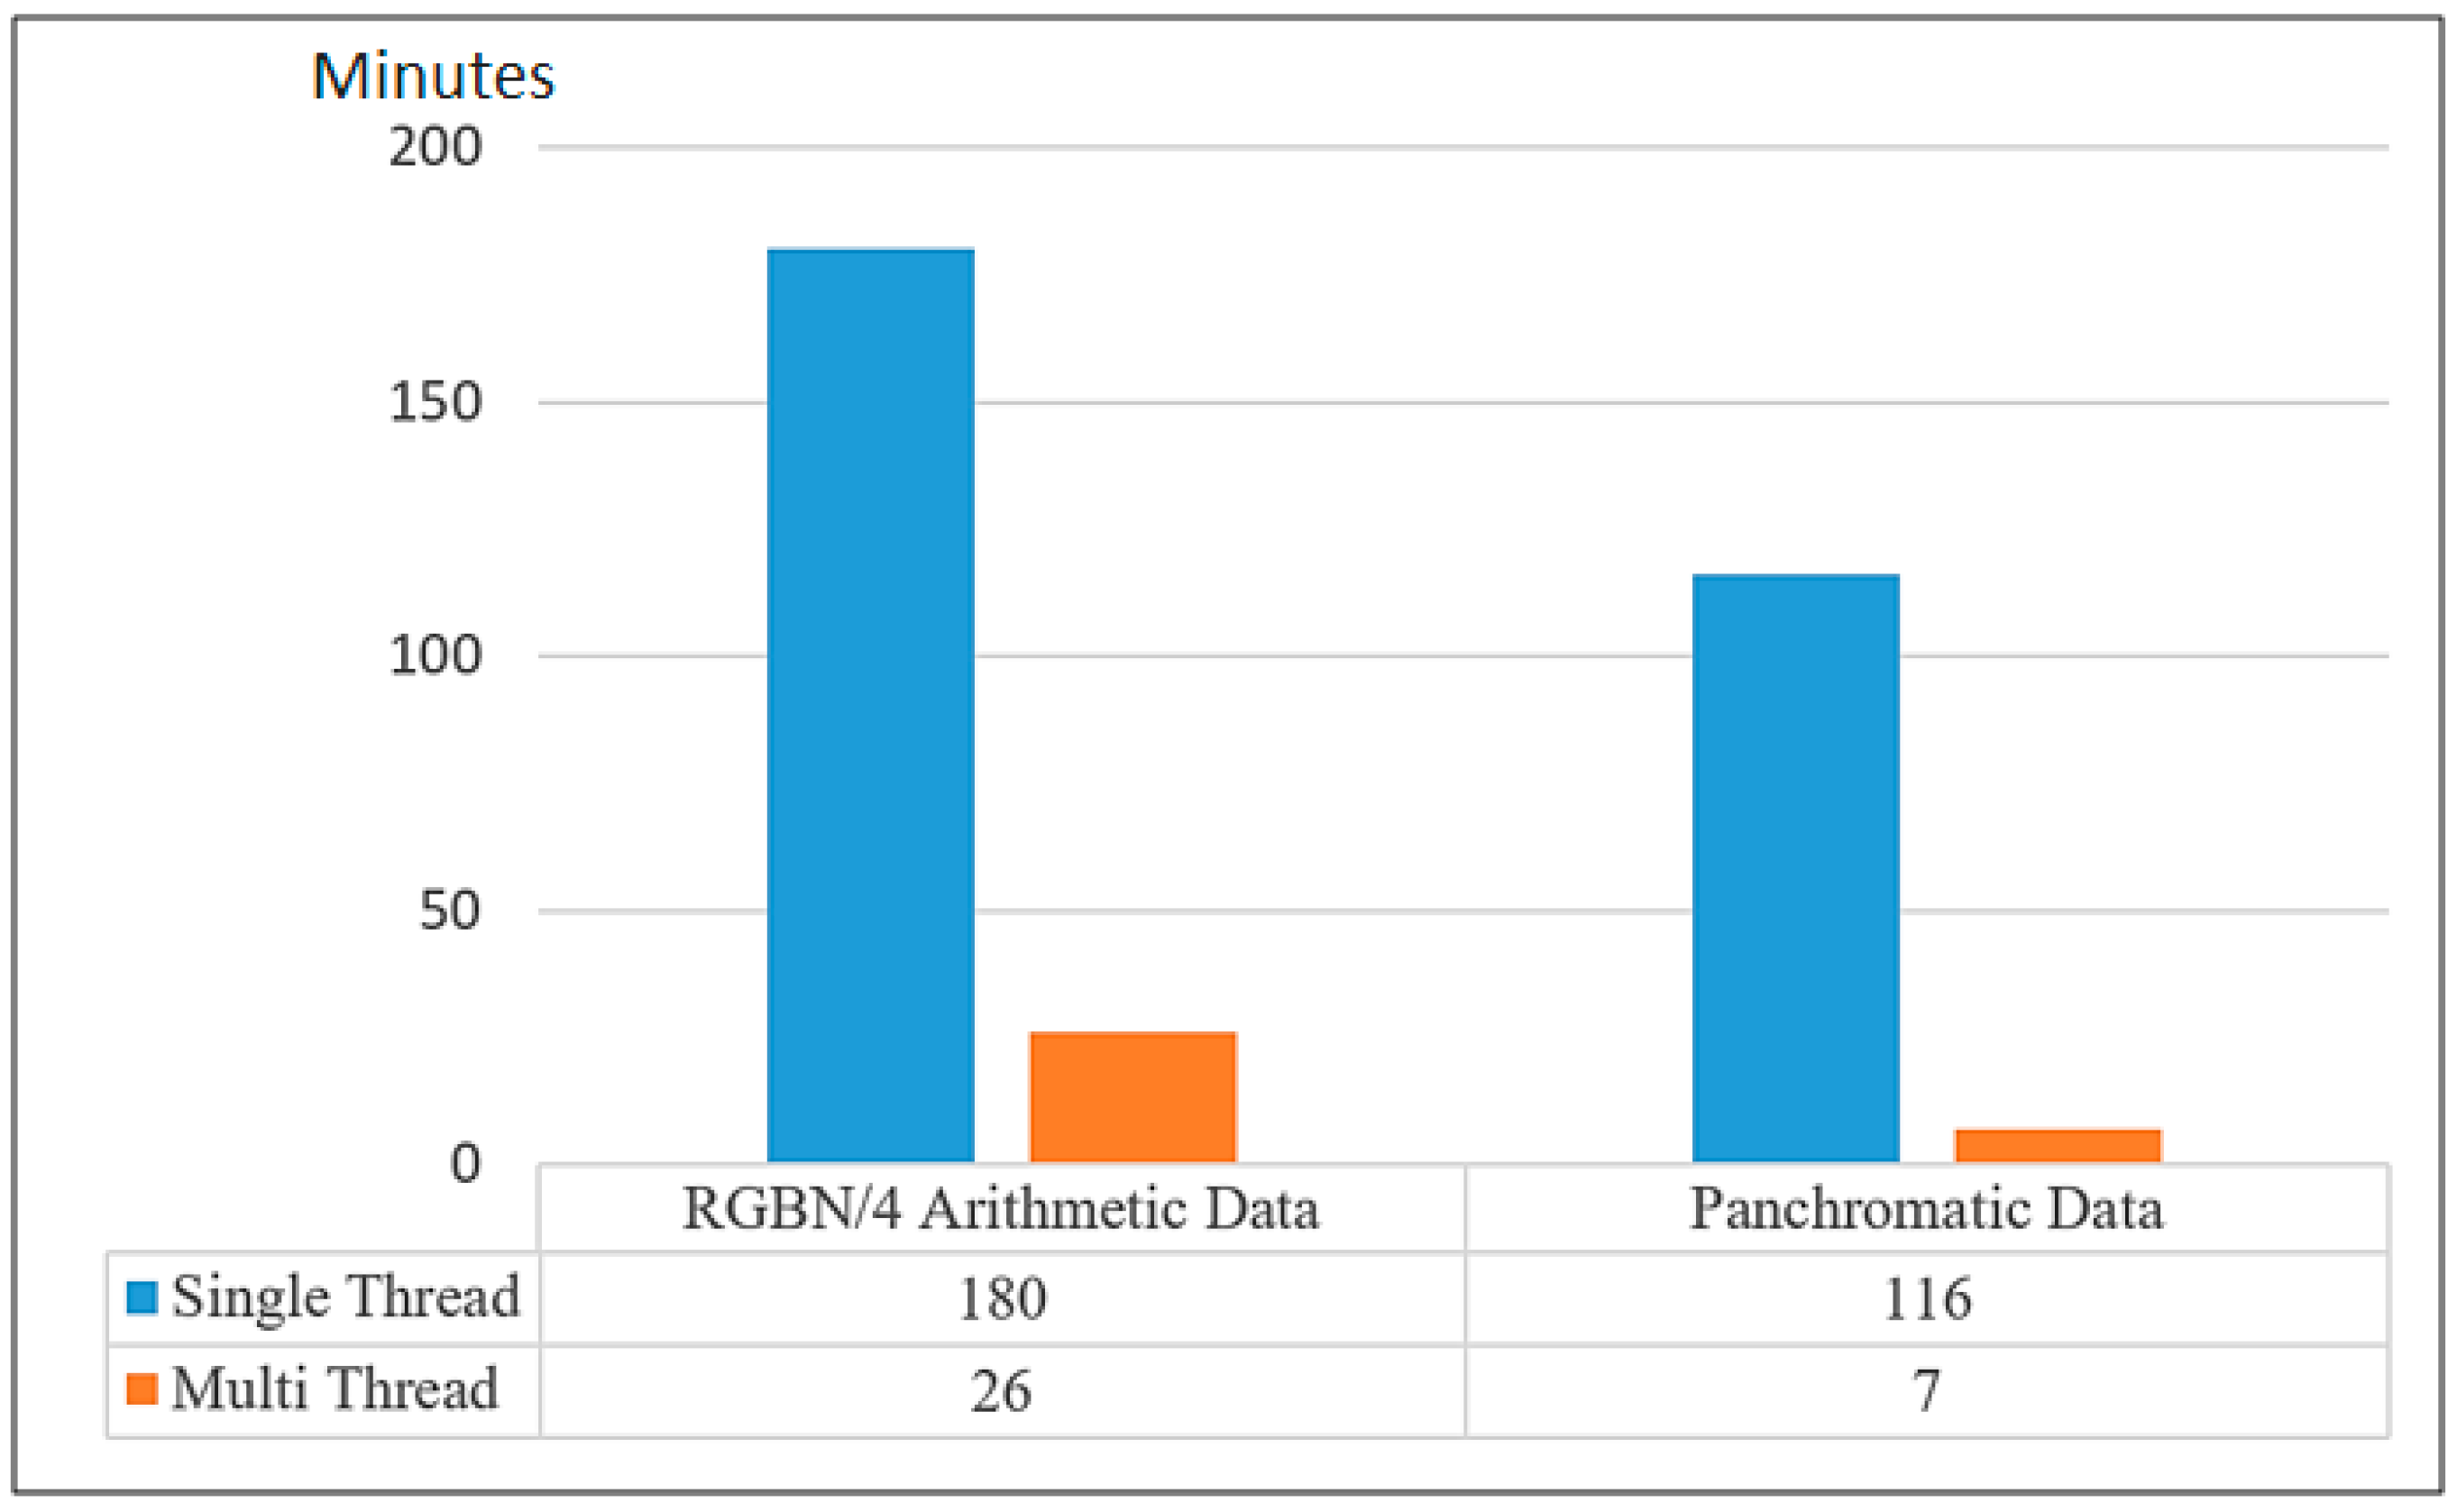
According to of the multi-thread performance analysis, the processing of the arithmetic data took 180 min using a single thread, whereas the same arithmetic data process took 26 min using a multi-thread approach. Additionally, it took 116 min for panchromatic data using a single thread, whereas it took 7 min to complete image matching for the same panchromatic data using a multi-thread approach for a single image scene. These results show that the multi-thread approach hastens the process by seven-fold for the arithmetic data and 16-fold for the panchromatic data (Figure 9).
The difference in the improvement ratios between the arithmetic and panchromatic data was due to the time cost of reading the separate bands of RGBN data from the hard drive. These results indicate the need for multi-thread design, as the single thread processing time is inefficient for a single image scene.
When the findings of this research are summarized, it can be concluded that the SIFT-based GCP production in combination with the proposed iterative outlier removal process enabled the construction of a highly accurate refinement function and improved the orthorectification accuracy when compared to the original RPC-based process. These findings are consistent with the findings of previous research conducted by Long et al. and Sedaghat et al., which proposed outlier removal to increase the accuracy of SIFT-based GCPs. However, our research proposed an iterative process for outlier removal which evaluates the GCP after performing a complete RPC refinement process, thus taking the topographic effects into account by use of DEM [25,26]. Additionally, the proposed outlier removal strategy is simpler than the one conducted in Sedaghat et al., which used combinations of contrast matching, curvature analysis and entropy calculation [25]. Moreover, our evaluation related to surface topography and LC characteristics meant that the accuracy and the number of GCPs produced by SIFT was not affected by topographic variation. The efficiency of GCP production was comparatively higher in the “Forests and Semi-Natural Areas” class, which can be explained by the consistent spectral and textural structure of this class across different seasonal conditions. The main influencing factor behind the GCP production process was the incidence angle of images. We reported an increase in number of GCPs and the orthorectification accuracy for low incidence angle images. Additionally, the multi-thread approach reduced the processing time cost which is a well-known drawback of the SIFT algorithm concerning high-resolution data for large areas. The findings on processing time improvement are also compatible with a previous study conducted by Huo et al. [22]. Lastly, automation of the whole process provided advantages when several images need to be orthorectified by minimizing the time cost and preventing additional errors that arise from manual GCP selection.
On the other hand, the proposed method is only usable when the reference pre-orthorectified image archive is available which can be considered to be a general drawback of image matching-based analyses. Additionally, the efficiency of the method was tested with the use of input and reference images from the same satellite. The performance of the method with different sensor data with different spectral and spatial resolution has not been evaluated yet. Lastly, the effect of DEM quality on the proposed method has not been evaluated, and DEM data was the only constant data used in this research. Further studies are planned to evaluate the mentioned limitations by use of the satellite images from different sensors and using other DEM data.
5. Conclusions
The assessment of the geometric accuracy of satellite images is critical, as the needs and requirements for positional accuracy vary by application, and the positional accuracy of a satellite image depends on several factors. The incidence angle affects the number of key points and GCPs generated using the SIFT algorithm and the final accuracy of the orthorectification. Low incidence angles over three different landscape characteristics resulted in automatic selection of more key points and GCPs and better RMSEs (better than 1 m) compared to high incidence angle images. The land cover analysis illustrated the predominant impact of the incidence angle in terms of the number of GCPs compared to seasonal effects, as the artificial surfaces had static geometry and spectral responses in different seasons within the analysis period, and there was a decrease in the number of SIFT-based GCPs as the increased incidence angle increased. The topographic conditions (slope properties) of the surface had no observable effects on the performance of SIFT in producing key points and GCPs. A similar number of points and RMSEs were achieved for different slope groups. As an important output for this study, SIFT-based automatic matching point production improved the RPC refinement process using polynomial transformation equations. The GCPs derived from matching points provided a better estimation of the polynomial coefficients, thus improving the accuracy of the rotations and shifts determined by these equations. Moreover, the designed multi-thread process approach effectively hastened the process and reduced the time cost, even with a mid-level desktop computer. The ASTER GDEM elevation model was the only unchanged data in this research; thus, the impact of the DEM on the location accuracy provided by the introduced process chain was not investigated. Additional research to evaluate the impact of various DEM data is planned. Lastly, the designed process chain provides automated orthorectification of satellite images with reference to a pre-orthorectified image data; thus, the accuracy results represent a relative horizontal location agreement between datasets. Therefore, the suggested method will be affective in situations where a highly accurate reference dataset is available, as demonstrated in this study.
Author Contributions
Conceptualization, U.A. and E.S.; Data curation, H.K.; Formal analysis, H.K.; Methodology, U.A. and E.S.; Project administration, U.A.; Supervision, E.S.; Visualization, H.K.; Writing-original draft, H.K., U.A. and E.S.
Acknowledgments
The authors acknowledge the support of the Istanbul Technical University—Center for Satellite Communications and Remote Sensing (ITU-CSCRS) for providing the Pleiades 1A and 1B satellite images and the HGK for providing the reference orthophotos. The authors also thank the anonymous reviewers who helped to improve the article with their comments.
Conflicts of Interest
The authors declare no conflict of interest.
Appendix A
Figure A1 provides the distribution of the validated GCPs and ICPs for the high and low incidence angle images of three test regions. The GCPs were derived from SIFT matching and outlier removal processes belonging to the arithmetic mean of the RGB channels.
Table A1 provides the number of matching points and the number of validated GCPs after the iterative outlier removal procedure for all test conditions. The matching ratios produced from these numbers are also given as statistical indicators.
Figure A1.
Distribution of the SIFT-based GCPs and Independent Check Points (ICPs) for the arithmetic mean of the RGB channels.
Figure A1.
Distribution of the SIFT-based GCPs and Independent Check Points (ICPs) for the arithmetic mean of the RGB channels.


Table A1.
Statistical comparison of matching points and validated GCPs derived from these points after outlier removal.
Table A1.
Statistical comparison of matching points and validated GCPs derived from these points after outlier removal.
| Region/Incidence Angle | Point Type | Spectral Band/Number of Points | Matching Ratio (%) | ||||||||||||
|---|---|---|---|---|---|---|---|---|---|---|---|---|---|---|---|
| Istanbul | PAN | PSP_R | PSP_G | PSP_B | PSP_NIR | PSP_RGB | PSP_RGBN | PAN | PSP_R | PSP_G | PSP_B | PSP_NIR | PSP_RGB | PSP_RGBN | |
| Low Incidence | Matching Points | 197 | 194 | 207 | 211 | 193 | 224 | 178 | 97% | 96% | 96% | 95% | 95% | 96% | 96% |
| Validated GCPs | 191 | 186 | 199 | 200 | 183 | 215 | 170 | ||||||||
| High Incidence | Matching Points | 44 | 52 | 50 | 51 | 38 | 37 | 49 | 64% | 56% | 68% | 47% | 42% | 59% | 59% |
| Validated GCPs | 28 | 29 | 34 | 24 | 16 | 22 | 29 | ||||||||
| Bursa | PAN | PSP_R | PSP_G | PSP_B | PSP_NIR | PSP_RGB | PSP_RGBN | PAN | PSP_R | PSP_G | PSP_B | PSP_NIR | PSP_RGB | PSP_RGBN | |
| Low Incidence | Matching Points | 224 | 225 | 229 | 227 | 188 | 225 | 203 | 96% | 96% | 95% | 96% | 95% | 96% | 95% |
| Validated GCPs | 214 | 216 | 217 | 217 | 179 | 216 | 192 | ||||||||
| High Incidence | Matching Points | 62 | 66 | 65 | 82 | 49 | 71 | 58 | 92% | 91% | 89% | 89% | 86% | 87% | 86% |
| Validated GCPs | 57 | 60 | 58 | 73 | 42 | 62 | 50 | ||||||||
| Izmir | PAN | PSP_R | PSP_G | PSP_B | PSP_NIR | PSP_RGB | PSP_RGBN | PAN | PSP_R | PSP_G | PSP_B | PSP_NIR | PSP_RGB | PSP_RGBN | |
| Low Incidence | Matching Points | 156 | 178 | 188 | 171 | 185 | 179 | 147 | 96% | 96% | 95% | 96% | 96% | 95% | 97% |
| Validated GCPs | 150 | 170 | 178 | 164 | 177 | 170 | 142 | ||||||||
| High Incidence | Matching Points | 92 | 100 | 56 | 73 | 101 | 99 | 98 | 87% | 91% | 71% | 79% | 76% | 89% | 89% |
| Validated GCPs | 80 | 91 | 40 | 58 | 77 | 88 | 87 | ||||||||
References
- Demirel, H.; Sertel, E.; Kaya, S.; Seker, D.Z. Exploring impacts of road transportation on environment: A spatial approach. Desalination 2008, 226, 279–288. [Google Scholar] [CrossRef]
- Alganci, U.; Sertel, E.; Ozdogan, M.; Ormeci, C. Parcel-level identification of crop types using different classification algorithms and multi-resolution imagery in southeastern turkey. Photogramm. Eng. Remote Sens. 2013, 79, 1053–1065. [Google Scholar] [CrossRef]
- Bai, X.; Zhang, H.; Zhou, J. VHR object detection based on structural feature extraction and query expansion. IEEE Trans. Geosci. Remote Sens. 2014, 52, 6508–6520. [Google Scholar]
- Gianinetto, M.; Aiello, M.; Marchesi, A.; Topputo, F.; Massari, M.; Lombardi, R.; Banda, F.; Tebaldini, S. Obia ship detection with multispectral and SAR images: A simulation for copernicus security applications. In Proceedings of the 2016 IEEE International Geoscience and Remote Sensing Symposium (IGARSS), Beijing, China, 10–15 July 2016; pp. 1229–1232. [Google Scholar]
- Toutin, T. Geometric processing of remote sensing images: Models, algorithms and methods. Int. J. Remote Sens. 2004, 25, 1893–1924. [Google Scholar] [CrossRef]
- Sertel, E.; Kutoglu, S.H.; Kaya, S. Geometric correction accuracy of different satellite sensor images: Application of figure condition. Int. J. Remote Sens. 2007, 28, 4685–4692. [Google Scholar] [CrossRef]
- Di, K.; Ma, R.; Ma, R.X. Rational functions and potential for rigorous sensor model recovery. Photogramm. Eng. Remote Sens. 2003, 69, 33–41. [Google Scholar]
- Schowengerdt, R.A. Remote Sensing: Models and Methods for Image Processing; Elsevier: New York, NY, USA, 2006. [Google Scholar]
- Toutin, T. State-of-the-art of geometric correction of remote sensing data: A data fusion perspective. Int. J. Image Data Fusion 2011, 2, 3–5. [Google Scholar] [CrossRef]
- Poli, D.; Toutin, T. Review of developments in geometric modelling for high resolution satellite pushbroom sensors. Photogramm. Rec. 2012, 27, 58–73. [Google Scholar] [CrossRef]
- Tao, C.V.; Hu, Y. A comprehensive study of the rational function model for photogrammetric processing. Photogramm. Eng. Remote Sens. 2001, 67, 1347–1358. [Google Scholar]
- Fraser, C.S.; Hanley, H.B. Bias-compensated RPCs for sensor orientation of high-resolution satellite imagery. Photogramm. Eng. Remote Sens. 2005, 71, 909–915. [Google Scholar] [CrossRef]
- Hu, Y.; Tao, V.; Croitoru, A. Understanding the rational function model: Methods and applications. Int. Arch. Photogramm. Remote Sens. 2004, 20, 119–124. [Google Scholar]
- Ehrlich, D.; Guo, H.D.; Molch, K.; Ma, J.W.; Pesaresi, M. Identifying damage caused by the 2008 Wenchuan earthquake from VHR remote sensing data. Int. J. Digit. Earth 2009, 2, 309–326. [Google Scholar] [CrossRef] [Green Version]
- Zitova, B.; Flusser, J. Image registration methods: A survey. Image Vis. Comput. 2003, 21, 977–1000. [Google Scholar] [CrossRef]
- Wong, A.; Clausi, D.A. ARRSI: Automatic registration of remote-sensing images. IEEE Trans. Geosci. Remote Sens. 2007, 45, 1483–1493. [Google Scholar] [CrossRef]
- Paul, S.; Pati, U.C. Coarse-to-Fine Registration of Remote Sensing Optical Images Using SIFT and SPSA Optimization. Soft Comput. Theor. Appl. 2016, 1, 771. [Google Scholar]
- Misra, I.; Moorthi, S.M.; Dhar, D.; Ramakrishnan, R. An automatic satellite image registration technique based on Harris corner detection and Random Sample Consensus (RANSAC) outlier rejection model. In Proceedings of the 2012 1st International Conference on Recent Advances in Information Technology (RAIT), Dhanbad, India, 15–17 March 2012; pp. 68–73. [Google Scholar]
- Bentoutou, Y.; Taleb, N.; Kpalma, K.; Ronsin, J. An automatic image registration for applications in remote sensing. IEEE Trans. Geosci. Remote Sens. 2005, 43, 2127–2137. [Google Scholar] [CrossRef]
- Teke, M.; Temizel, A. Multi-spectral satellite image registration using scale-restricted SURF. In Proceedings of the 2010 20th International Conference on Pattern Recognition (ICPR), Istanbul, Turkey, 23–26 August 2010; pp. 2310–2313. [Google Scholar]
- Song, Z.L.; Zhang, J. Remote sensing image registration based on retrofitted SURF algorithm and trajectories generated from Lissajous figures. IEEE Geosci. Remote Sens. Lett. 2010, 7, 491–495. [Google Scholar] [CrossRef]
- Huo, C.; Pan, C.; Huo, L.; Zhou, Z. Multilevel SIFT matching for large-size VHR image registration. IEEE Geosci. Remote Sens. Lett. 2012, 9, 171–175. [Google Scholar] [CrossRef]
- Yu, L.; Zhang, D.; Holden, E.J. A fast and fully automatic registration approach based on point features for multi-source remote-sensing images. Comput. Geosci. 2008, 34, 838–848. [Google Scholar] [CrossRef]
- Hasan, M.; Jia, X.; Robles-Kelly, A.; Zhou, J.; Pickering, M.R. Multi-spectral remote sensing image registration via spatial relationship analysis on sift keypoints. In Proceedings of the 2010 IEEE International Geoscience and Remote Sensing Symposium (IGARSS), Honolulu, HI, USA, 25–30 July 2010; pp. 1011–1014. [Google Scholar]
- Sedaghat, A.; Ebadi, H. Distinctive order based self-similarity descriptor for multi-sensor remote sensing image matching. ISPRS J. Photogramm. Remote Sens. 2015, 108, 62–71. [Google Scholar] [CrossRef]
- Long, T.; Jiao, W.; He, G.; Zhang, Z. A fast and reliable matching method for automated georeferencing of remotely-sensed imagery. Remote Sens. 2016, 8, 56. [Google Scholar] [CrossRef]
- Pareeth, S.; Delucchi, L.; Metz, M.; Rocchini, D.; Devasthale, A.; Raspaud, M.; Adrian, R.; Salmaso, N.; Neteler, M. New automated method to develop geometrically corrected time series of brightness temperatures from historical AVHRR LAC data. Remote Sens. 2016, 8, 169. [Google Scholar] [CrossRef]
- Liu, Y.; Mo, F.; Tao, P. Matching Multi-Source Optical Satellite Imagery Exploiting a Multi-Stage Approach. Remote Sens. 2017, 9, 1249. [Google Scholar] [CrossRef]
- Lowe, D.G. Object recognition from local scale-invariant features. In Proceedings of the Seventh IEEE International Conference on Computer Vision, Kerkyra, Greece, 20–27 September 1999; Volume 2, pp. 1150–1157. [Google Scholar]
- Juan, L.; Gwun, O. A comparison of sift, pca-sift and surf. Int. J. Image Process. 2009, 3, 143–152. [Google Scholar]
- Sedaghat, A.; Mokhtarzade, M.; Ebadi, H. Uniform robust scale-invariant feature matching for optical remote sensing images. IEEE Trans. Geosci. Remote Sens. 2011, 49, 4516–4527. [Google Scholar] [CrossRef]
- Airbus, Pleiades Products. 2017. Available online: http://www.intelligence-airbusds.com/en/3027-pleiades-50-cmresolution-products (accessed on 5 September 2017).
- Nasa, Jet Propulsion Laboratory, ASTER Global Digital Elevation Map Announcement. 2012. Available online: https://asterweb.jpl.nasa.gov/gdem.asp (accessed on 5 September 2017).
- European Environment Agency (EEA), CORINE Land Cover. 1995. Available online: https://www.eea.europa.eu/publications/COR0-landcover (accessed on 5 September 2017).
- Singh, G. Improved Geometric Modeling of Spaceborn Pushbroom Imagery Using Modified Rational Polynomial Coefficients and the Impact on DSM Generation. Master’s Thesis, The International Institute for Geo-Information Science and Earth Observation (ITC), Enschede, The Netherlands, 2008. [Google Scholar]
- Grodecki, J.; Dial, G. Block adjustment of high-resolution satellite images described by rational polynomials. Photogramm. Eng. Remote Sens. 2003, 69, 59–68. [Google Scholar] [CrossRef]
- Lowe, D.G. Distinctive image features from scale-invariant keypoints. Int. J. Comput. Vis. 2004, 60, 91–110. [Google Scholar] [CrossRef]
- Liu, X.; Tian, Z.; Chai, C.; Fu, H. Multiscale registration of remote sensing image using robust SIFT features in Steerable-Domain. Egypt. J. Remote Sens. Space Sci. 2011, 14, 63–72. [Google Scholar] [CrossRef]
- Wang, Y.; Du, L.; Dai, H. Unsupervised SAR image change detection based on SIFT keypoints and region information. IEEE Geosci. Remote Sens. Lett. 2016, 13, 931–935. [Google Scholar] [CrossRef]
- Cui, S.; Jiang, H.; Wang, Z.; Shen, C. Application of neural network based on sift local feature extraction in medical image classification. In Proceedings of the 2017 2nd International Conference on Image, Vision and Computing (ICIVC), Chengdu, China, 2–4 June 2017; pp. 92–97. [Google Scholar]
Figure 1.
Study sites and overview of the images used in this research: (a) Geographic distribution of the study regions (Google Earth©); (b) Overview of the Istanbul region; (c) Overview of the Bursa region; (d) Overview of the Izmir region.
Figure 1.
Study sites and overview of the images used in this research: (a) Geographic distribution of the study regions (Google Earth©); (b) Overview of the Istanbul region; (c) Overview of the Bursa region; (d) Overview of the Izmir region.

Figure 2.
Topographic characteristics of the study regions.

Figure 3.
Land cover (LC) characteristics of the study regions.

Figure 4.
Diagram of the Scale Invariant Feature Transform (SIFT)-based automated orthorectification.
Figure 4.
Diagram of the Scale Invariant Feature Transform (SIFT)-based automated orthorectification.

Figure 5.
The steps of SIFT feature extraction: (a) scale space generation; (b) DOG image generation; (c) detection of local maximum and minimum; (d) gradient calculation; (e) histogram calculation and generation of 128 dimensional vectors.
Figure 5.
The steps of SIFT feature extraction: (a) scale space generation; (b) DOG image generation; (c) detection of local maximum and minimum; (d) gradient calculation; (e) histogram calculation and generation of 128 dimensional vectors.

Figure 6.
Comparison of the results of the orthorectification process for different study areas based on the RMSE (number of the validated Ground Control Points (GCPs) given over each bar).
Figure 6.
Comparison of the results of the orthorectification process for different study areas based on the RMSE (number of the validated Ground Control Points (GCPs) given over each bar).

Figure 7.
Accuracy of the results obtained using the original RPC model.

Figure 8.
Improvement ratio of the GCPs retrieved using SIFT to the results using the original RPC-based orthorectification results as a reference.
Figure 8.
Improvement ratio of the GCPs retrieved using SIFT to the results using the original RPC-based orthorectification results as a reference.

Figure 9.
Comparison of the process times for single and multithread approaches.

Table 1.
Specifications of the satellite images used in this study.
| Region | Istanbul | Bursa | Izmir | |||
|---|---|---|---|---|---|---|
| Date | Incidence Angle | Date | Incidence Angle | Date | Incidence Angle | |
| Reference | 24 December 2015 | 2.03° | 25 September 2014 | 1.07° | 4 December 2015 | 8.90° |
| Low | 9 December 2016 | 12.53° | 2 November 2015 | 1.36° | 29 January 2017 | 8.22° |
| High | 29 April 2017 | 26.10° | 9 July 2014 | 18.74° | 28 March 2017 | 18.48° |
Table 2.
RMSE results of the first- and second-order refinement functions.
| RMSE (±m) | ||||||
|---|---|---|---|---|---|---|
| Region | Istanbul | Bursa | İzmir | |||
| Poly. Order | 1st | 2nd | 1st | 2nd | 1st | 2nd |
| Low Incidence | 1.80 | 1.70 | 3.10 | 3.00 | 4.72 | 4.66 |
| High Incidence | 5.13 | 4.90 | 4.86 | 4.71 | 4.96 | 4.95 |
Table 3.
Distribution of the number of GCPs and mean RMSEs (m) for different slope groups in the study regions (Ct.: GCP Count).
Table 3.
Distribution of the number of GCPs and mean RMSEs (m) for different slope groups in the study regions (Ct.: GCP Count).
| Region/Incidence | 0–2% | 2–5% | 5–8% | 8–16% | 16–30% | 30–45% | 45+% | ||||||||
|---|---|---|---|---|---|---|---|---|---|---|---|---|---|---|---|
| Ct. | RMS | Ct. | RMS | Ct. | RMS | Ct. | RMS | Ct. | RMS | Ct. | RMS | Ct. | RMS | ||
| Istanbul | Low | 3 | 1.135 | 14 | 1.328 | 19 | 1.367 | 70 | 1.406 | 65 | 1.348 | 18 | 1.305 | 3 | 1.720 |
| High | 1 | 1.912 | 3 | 1.970 | 4 | 2.212 | 11 | 2.307 | 6 | 1.927 | 1 | 2.388 | 0 | 0.000 | |
| Bursa | Low | 1 | 0.969 | 3 | 0.516 | 5 | 0.692 | 33 | 0.638 | 75 | 0.520 | 60 | 0.506 | 31 | 0.529 |
| High | 0 | 0.000 | 1 | 1.240 | 2 | 1.454 | 12 | 1.793 | 24 | 1.507 | 12 | 1.937 | 5 | 2.043 | |
| Izmir | Low | 8 | 1.744 | 19 | 1.586 | 22 | 1.409 | 44 | 1.510 | 44 | 1.642 | 19 | 1.737 | 8 | 2.741 |
| High | 3 | 2.473 | 8 | 1.934 | 10 | 1.700 | 22 | 1.766 | 25 | 2.129 | 5 | 2.311 | 1 | 2.920 | |
Table 4.
Distribution of the number of GCPs and mean RMSEs (m) for different LC classes in the study regions.
Table 4.
Distribution of the number of GCPs and mean RMSEs (m) for different LC classes in the study regions.
| Region/Incidence | Artificial Surfaces | Agricultural Areas | Forest and S. Natural | Wetlands | Water Bodies | ||||||
|---|---|---|---|---|---|---|---|---|---|---|---|
| Ct. | RMS | Ct. | RMS | Ct. | RMS | Ct. | RMS | Ct. | RMS | ||
| Istanbul | Low | 37 | 1.478 | 13 | 1.340 | 139 | 1.351 | 0 | 0 | 3 | 1.943 |
| High | 11 | 2.181 | 5 | 1.688 | 9 | 2.517 | 0 | 0 | 1 | 1.136 | |
| Bursa | Low | 2 | 0.573 | 38 | 0.615 | 167 | 0.522 | 0 | 0 | 0 | 0 |
| High | 1 | 1.266 | 13 | 1.593 | 43 | 1.747 | 0 | 0 | 0 | 0 | |
| Izmir | Low | 48 | 1.666 | 35 | 1.686 | 81 | 1.623 | 0 | 0 | 0 | 0 |
| High | 19 | 1.821 | 23 | 2.162 | 33 | 1.951 | 0 | 0 | 0 | 0 | |
© 2018 by the authors. Licensee MDPI, Basel, Switzerland. This article is an open access article distributed under the terms and conditions of the Creative Commons Attribution (CC BY) license (http://creativecommons.org/licenses/by/4.0/).
Share and Cite
MDPI and ACS Style
Kartal, H.; Alganci, U.; Sertel, E. Automated Orthorectification of VHR Satellite Images by SIFT-Based RPC Refinement. ISPRS Int. J. Geo-Inf. 2018, 7, 229. https://doi.org/10.3390/ijgi7060229
AMA Style
Kartal H, Alganci U, Sertel E. Automated Orthorectification of VHR Satellite Images by SIFT-Based RPC Refinement. ISPRS International Journal of Geo-Information. 2018; 7(6):229. https://doi.org/10.3390/ijgi7060229
Chicago/Turabian StyleKartal, Hakan, Ugur Alganci, and Elif Sertel. 2018. "Automated Orthorectification of VHR Satellite Images by SIFT-Based RPC Refinement" ISPRS International Journal of Geo-Information 7, no. 6: 229. https://doi.org/10.3390/ijgi7060229
Note that from the first issue of 2016, this journal uses article numbers instead of page numbers. See further details here.