Article

Heavy Metal Pre-Conditioning History Modulates Spartina patens Physiological Tolerance along a Salinity Gradient

by
João Carreiras
1,
Jesús Alberto Pérez-Romero
2,
Enrique Mateos-Naranjo
2,
Susana Redondo-Gómez
2,
Ana Rita Matos
3,4,
Isabel Caçador
1,4 and
Bernardo Duarte
1,4,*
1
MARE—Marine and Environmental Sciences Centre, Faculty of Sciences of the University of Lisbon, Campo Grande, 1749-016 Lisbon, Portugal
2
Departamento de Biología Vegetal y Ecología, Facultad de Biología, Universidad de Sevilla, Av. Reina Mercedes s/n, 41012 Sevilla, Spain
3
Plant Functional Genomics Group, BioISI—Biosystems and Integrative Sciences Institute, Departamento de Biologia Vegetal, Faculdade de Ciências da Universidade de Lisboa, Campo Grande, 1749-016 Lisboa, Portugal
4
Departamento de Biologia Vegetal, Faculdade de Ciências da Universidade de Lisboa, Campo Grande, 1749-016 Lisbon, Portugal
*
Author to whom correspondence should be addressed.
Plants 2021, 10(10), 2072; https://doi.org/10.3390/plants10102072
Submission received: 30 August 2021 / Revised: 27 September 2021 / Accepted: 28 September 2021 / Published: 30 September 2021

Abstract

:
Land salinization, resulting from the ongoing climate change phenomena, is having an increasing impact on coastal ecosystems like salt marshes. Although halophyte species can live and thrive in high salinities, they experience differences in their salt tolerance range, being this a determining factor in the plant distribution and frequency throughout marshes. Furthermore, intraspecific variation to NaCl response is observed in high-ranging halophyte species at a population level. The present study aims to determine if the environmental history, namely heavy metal pre-conditioning, can have a meaningful influence on salinity tolerance mechanisms of Spartina patens, a highly disperse grass invader in the Mediterranean marshes. For this purpose, individuals from pristine and heavy metal contaminated marsh populations were exposed to a high-ranging salinity gradient, and their intraspecific biophysical and biochemical feedbacks were analyzed. When comparing the tolerance mechanisms of both populations, S. patens from the contaminated marsh appeared to be more resilient and tolerant to salt stress, this was particularly present at the high salinities. Consequently, as the salinity increases in the environment, the heavy metal contaminated marsh may experience a more resilient and better adapted S. patens community. Therefore, the heavy metal pre-conditioning of salt mash populations appears to be able to create intraspecific physiological variations at the population level that can have a great influence on marsh plant distribution outcome.

1. Introduction

According to the analysis of the data gathered, through this and the last century, the Intergovernmental Panel on Climate Change (IPCC) report shows a worldwide intensification of abiotic stresses with alarming environmental and economic implications, notably the increase and intensity of extreme climate events, droughts, floods, sea-level rise, water, and land salinity variations and others [1]. Earth can be considered a salt planet since approximately, 97.5% of all planet’s water content is saltwater, occupying roughly 70% of the surface encompassed in oceans, lakes, and groundwater [2], furthermore, it has been estimated that high soil salinity is affecting 20% of total Earth’s land surface and 33% of agricultural irrigated lands [3,4].
In coastal regions, especially in the high populated low-elevation coastal lands and estuaries, climate change will likely increase, at an elevated rate, the soil, and water salinity, mostly due to predicted storm surges, tidal surges, and sea-level rise causing an onward saltwater land inundation. Therefore, it can be presumed that soil and water salinity-induced stress is and will be one of the major plant abiotic stresses. Usually, salt stress in plants is a powerful limiting production factor, upsetting every major crop development and productivity [5]. Most of the crop plants when exposed to NaCl concentrations from 40 mM to 200 mM become severely damage or die, plants exposed to elevated salt concentrations result in several complex biochemical, physiological, and morphological damages, such as nutrient uptake and assimilation [6,7,8]. On the other hand, and contrary to 99% of all the plant species, halophytic vegetation species can not only survive but be highly productive in saline environments. Halophytes are, by definition, plants that can live normally and complete their life cycle under a salt concentration of at least 200 mM, with most plants exhibiting tolerance to a remarkable amplitude of NaCl concentration [9]. However, it is known that different halophytes species have unlike responses to the same salinity, ranging from species having optimal performance in salt-free environments to high NaCl concentrations such as 400 mM [9,10]. Species salinity tolerance responses variations are relevant when taking into consideration the latent alterations to salinity in the environment, which will most likely change salt-tolerant plant habitat availability and distribution, within an ecosystem. This is evident in most halophytes inhabiting salt marshes, where species distribution is organized across salinity gradients and microhabitats salinity variations associated with marsh topography and morphology, where plants are arranged according to their salinity tolerance [11,12]. Nonetheless, intraspecies phenological and physiological variation phenomenon can occur to a greater degree in highly tolerant species that are capable to adapt to environments that largely differ in their abiotic conditions [13,14,15]. When intraspecific NaCl response is taken into consideration it may show a different response to the same NaCl concentration, therefore it is important to understand coastal ecosystem modification and evolution once exposed to salinity changes.
Tagus estuary wetland is considered one of the more important in Europe and encompasses the most extensive and continuous salt marsh area in Portugal, presenting a great concentration of organic matter and biological productivity [12]. Salt marshes located within this estuary share most of the colonized halophyte species, such as the halophyte Spartina patens (Aiton) Muhl, a highly tolerant, invasive salt-excreting grass that is now spreading across Mediterranean marshes [16]. Moreover, neighboring marshes within the Tagus estuary, although being under mostly similar abiotic conditions, like salinity and temperature, can, due to anthropogenic actions, display a significant difference in their soil chemistry, when comparing marshes located within natural reserves to industrially contaminated marshes, notably caused heavy metals pollution [17]. These aspects make this species a suitable model to understand the effects of metal pollution pre-conditioning on tolerance range to salinity variations and ascertain to what extent different populations could otherwise respond to future changes in soil and water salinity. Additionally, several studies have suggested that intraspecific salt tolerance variations can occur in different S. patens populations [18,19], as well as heavy metal pre-conditioning can have a significant impact on this plant abiotic tolerance mechanisms [20].
The present work intends to determine heavy metal cross-tolerance thru pre-conditioning to salinity stresses in S. patens. Employing imposing salinity treatments on two populations, one from a heavy metal contaminated marsh and the other from a pristine one, it was possible to evaluate significant intraspecific variability in the physiological salt tolerance mechanisms. Given the ongoing climate change, it is relevant knowledge of the differently salt marshes species potential to adapt and respond, as well as the perception of a more complex reaction directly related to future salt-induced habitat modifications, concerning plant distribution and frequency.

2. Results

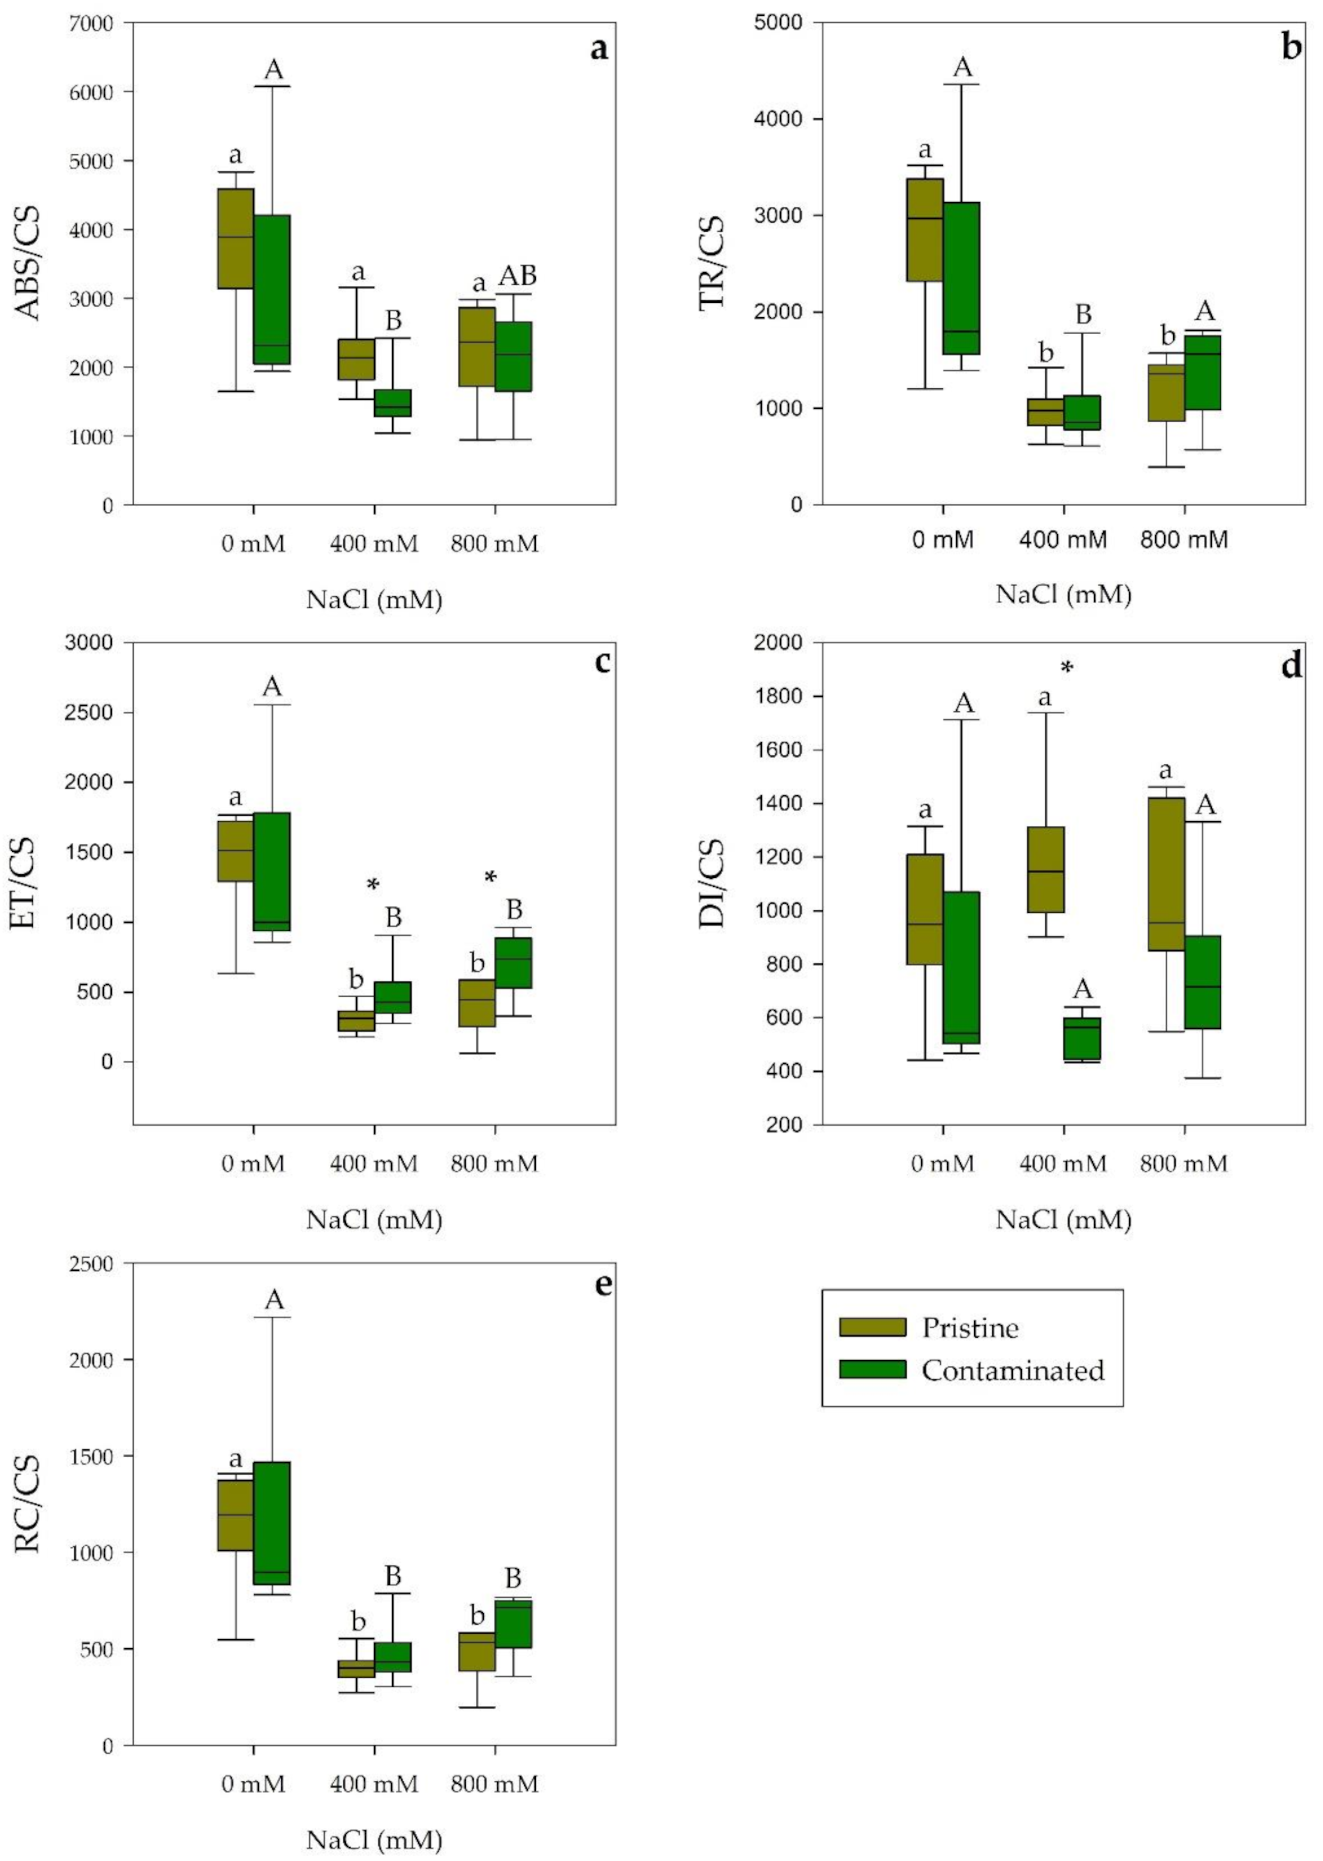
2.1. Photochemical Processes

When exposed to a salinity gradient, S. patens showed substantial variances in terms of their photochemical responses at a population level. The relative electron transport rates (rETR; Figure 1a) variation was shown to be significantly different, between populations, at 800 mM NaCl, higher values in the pristine marsh population. The photosynthetic efficiency (α; Figure 1b), measured within populations, displayed stability along the applied salinity gradient, with only individuals from the heavy metal contaminated marsh showing a significant difference at 400 mM NaCl. Nevertheless, significant differences were found between populations, contaminated marsh individuals displayed higher photosynthetic efficiency at 400 mM NaCl however at 800 mM NaCl the opposite was found. Maximum electron transport rates (ETRmax; Figure 1c) measurements showed a significant variation in 800 mM NaCl conditions between the populations, lower in the contaminated site individuals.
Energetic fluxes per leaf cross-section of the salt-treated chloroplasts showed a decrease in both populations under saline conditions in absorbed energy flux along a salinity gradient (ABS/CS; Figure 2a), significant in the 400 mM NaCl treated samples from the contaminated marsh. In trapped energy flux (TR/CS; Figure 2b) a similar significant reduction was observed in both populations although this decrease was not significant in the population from the heavy metal contaminated location at 800 mM NaCl, possibly due to the comparatively lower values exhibited in the 0 mM NaCl exposed individuals. Electron transport energy flux (ET/CS; Figure 2c) displayed a significant reduction at 400 and 800 mM NaCl, being this reduction more acute in S. patens from the pristine site. Dissipation energy flux (DI/CS; Figure 2d) showed unlike and significant responses to salinity stress between salt marsh populations. Plants from the pristine site when exposed to 400 mM NaCl showed increase energy dissipation whilst the contaminated site individuals exposed exhibited a reduction in dissipation. Finally, oxidized reaction centers (RC/CS; Figure 2e) significantly decreased with salinity concentration to a similar degree in both sampling populations.
Considering the total number of electrons transferred into the electron transport chain (N; Figure 3a), contaminated marsh individuals, when salt exposed, exhibited no significant changes while pristine site plants showed an increasing trend, displaying a significant increase at 400 mM NaCl and a highly significant increase at 800 mM NaCl, in relation to the contaminated site population as well at both salinities. Regarding the net rate of PS II reaction centers closure (M0; Figure 3b), a significantly higher value was evident in the 400 mM salt treatments of both populations, nonetheless contaminated site samples showed significantly lower M0 at 0 and 400 mM NaCl. Electron movement efficiency from the reduced intersystem electron acceptors to the PS I end electron movement (δR0; Figure 3c) showed an increase through salinity treatments in S. patens from the pristine mash, significant at 400 mM NaCl. The oxidized quinone pool size (Figure 3d) showed a similar pattern when comparing populations, the only difference was exhibited at 800 mM NaCl, a significantly lower size in the contaminated marsh population. Considering the grouping probability (PG; Figure 3e), a significantly higher PS II antennae connectivity was exhibited at 800 mM NaCl in both site samples, while at 400 mM NaCl S. patens from the contaminated marsh, showed a significantly higher value within and between populations.

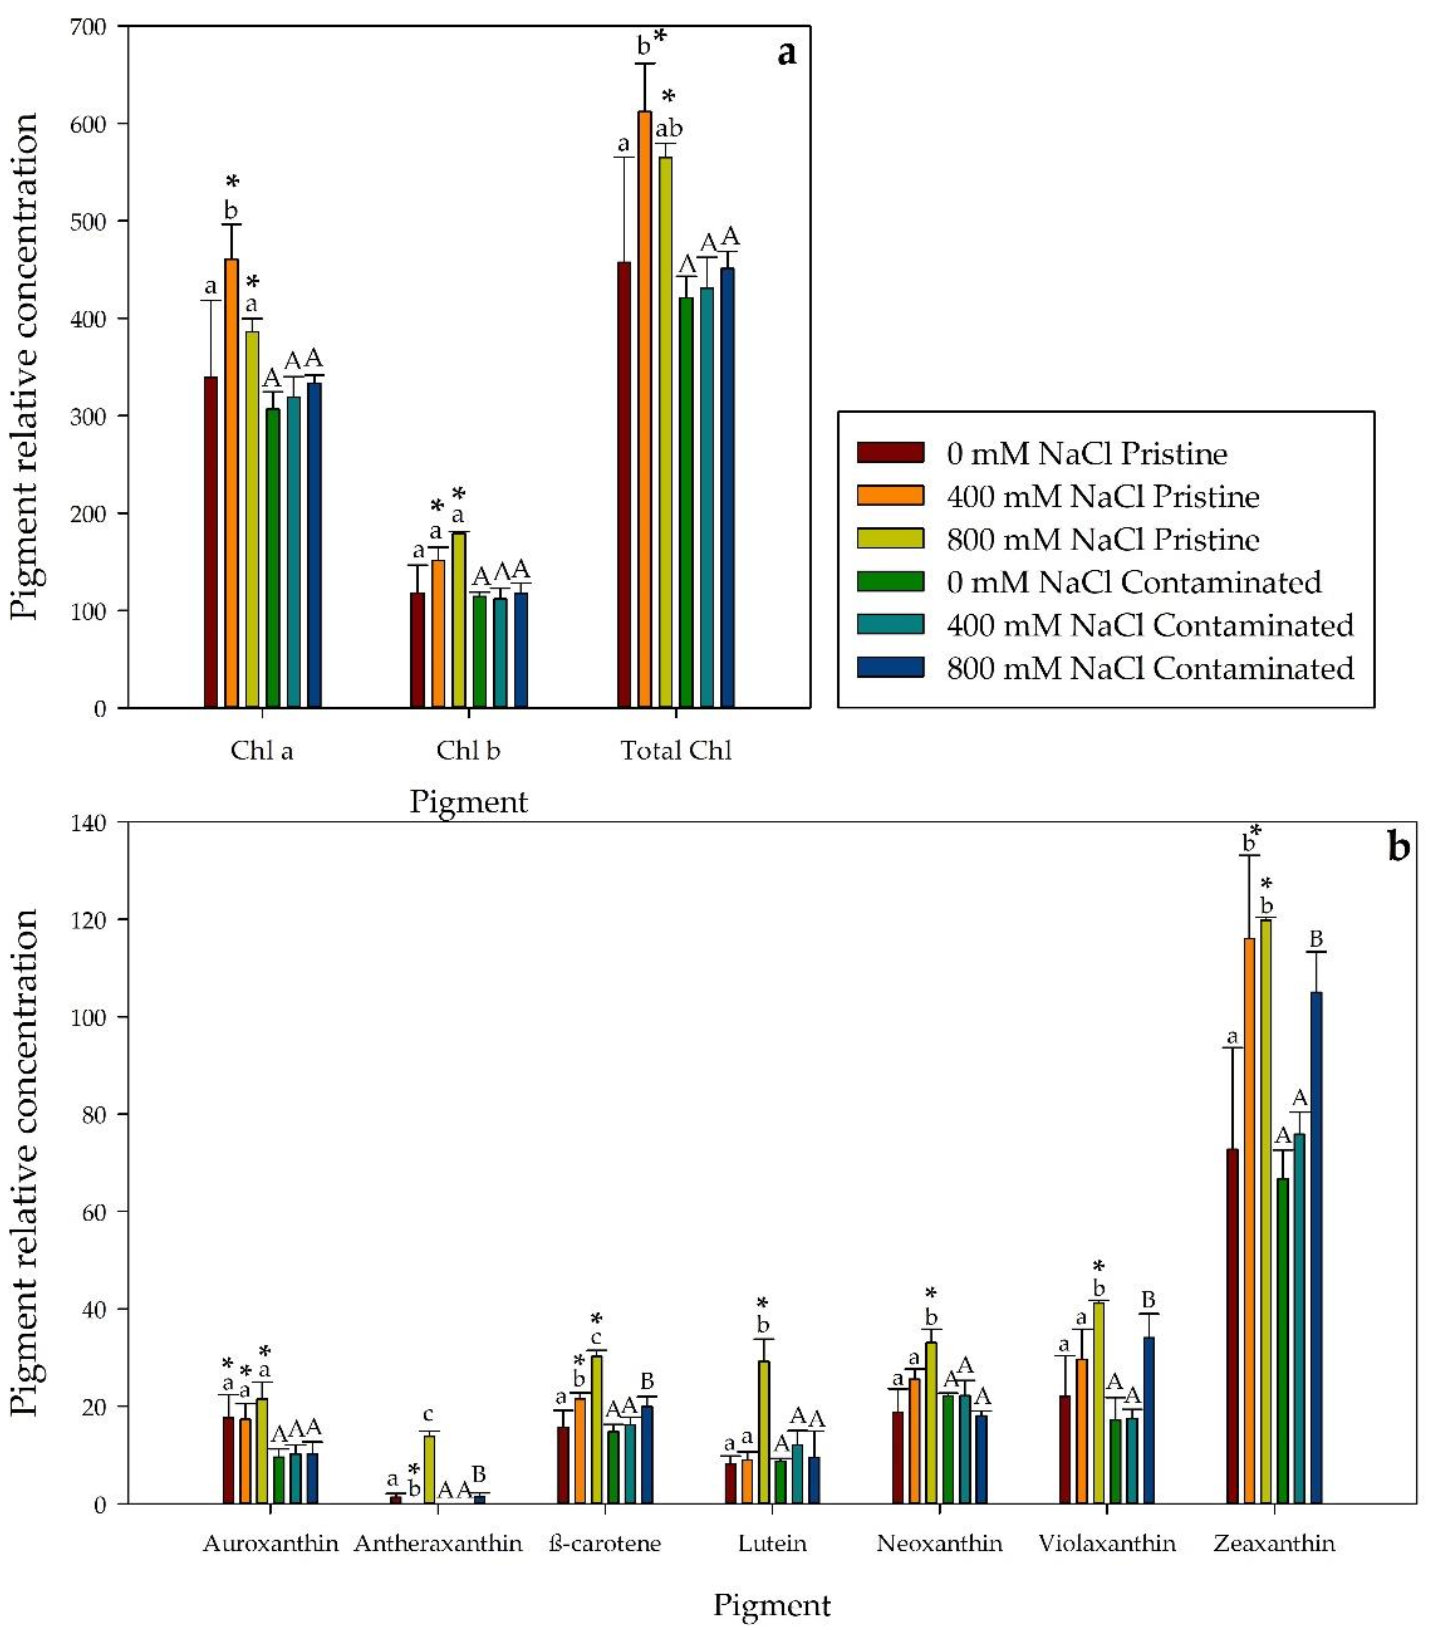
2.2. Photosynthetic Pigments Profile

Regarding leaf pigments concentration, we found significant differences between salinity treatments and populations (Figure 4). Thus, total chlorophyll concentration (chl a and chl b) was significantly higher in the salt-treated pristine marsh individuals compared with their contaminated marsh counterparts (Figure 4a). In addition, in the pristine marsh S. patens, higher pigment concentrations were also found, with significance, in auroxanthin in all treatments, in lutein, neoxanthin, and violaxanthin at 800 mM NaCl and β-carotene and zeaxanthin when exposed to 400 and 800 mM NaCl concentrations (Figure 4b). The total carotenoid to total chlorophyll ratio (Figure 5b) displayed a similar pattern, with no significant differences, between populations. Contaminated site samples exhibited a significantly higher Chlorophyll a/b ratio than the pristine marsh population at 800 mM NaCl (Figure 5a). Furthermore, at 800 mM NaCl, the contaminated marsh S. patens showed a significantly lower chlorophyll degradation index (CDI, Figure 5c) and de-epoxidation state (DES, Figure 5d).

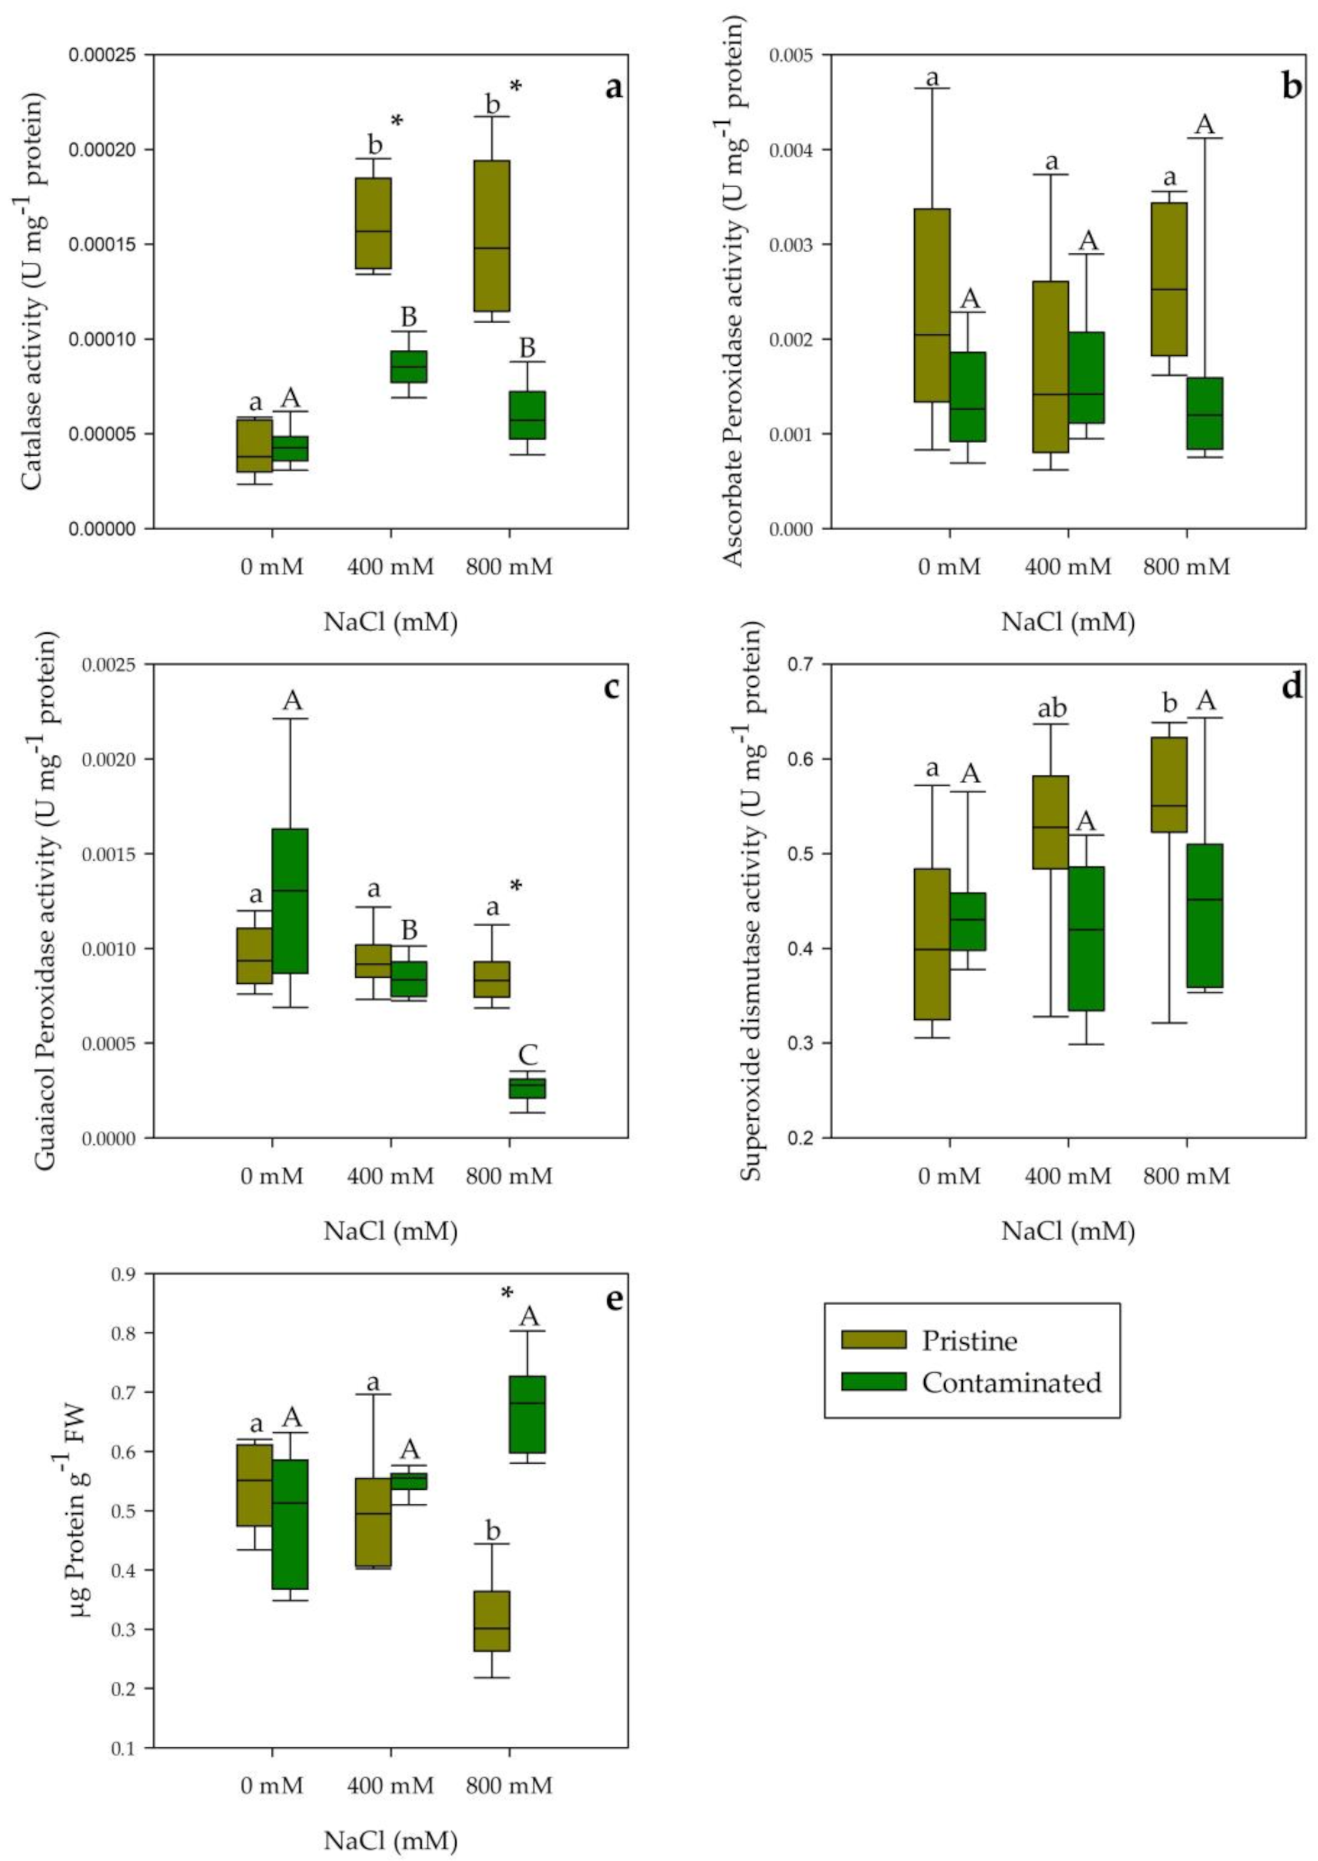
2.3. Antioxidant Enzymatic Activities

Catalase activity presented a highly significant increase in salt treatments, being these values considerably higher in plants from the pristine marsh (Figure 6a). Contrarily ascorbate peroxidase activity and superoxide dismutase activity did not show any significant variations between both tested populations and salinity concentrations (Figure 6b,d). Guaiacol peroxidase activity showed a significant activity decrease through NaCl concentration gradient in individuals from the contaminated marsh, while its values did not vary with salinity concentration in those collected in the pristine site (Figure 6c). Finally, regarding the total protein content of the leaves, a decreasing tendency was observed in the pristine site samples, significant at 800 mM NaCl within and between population groups (Figure 6e).

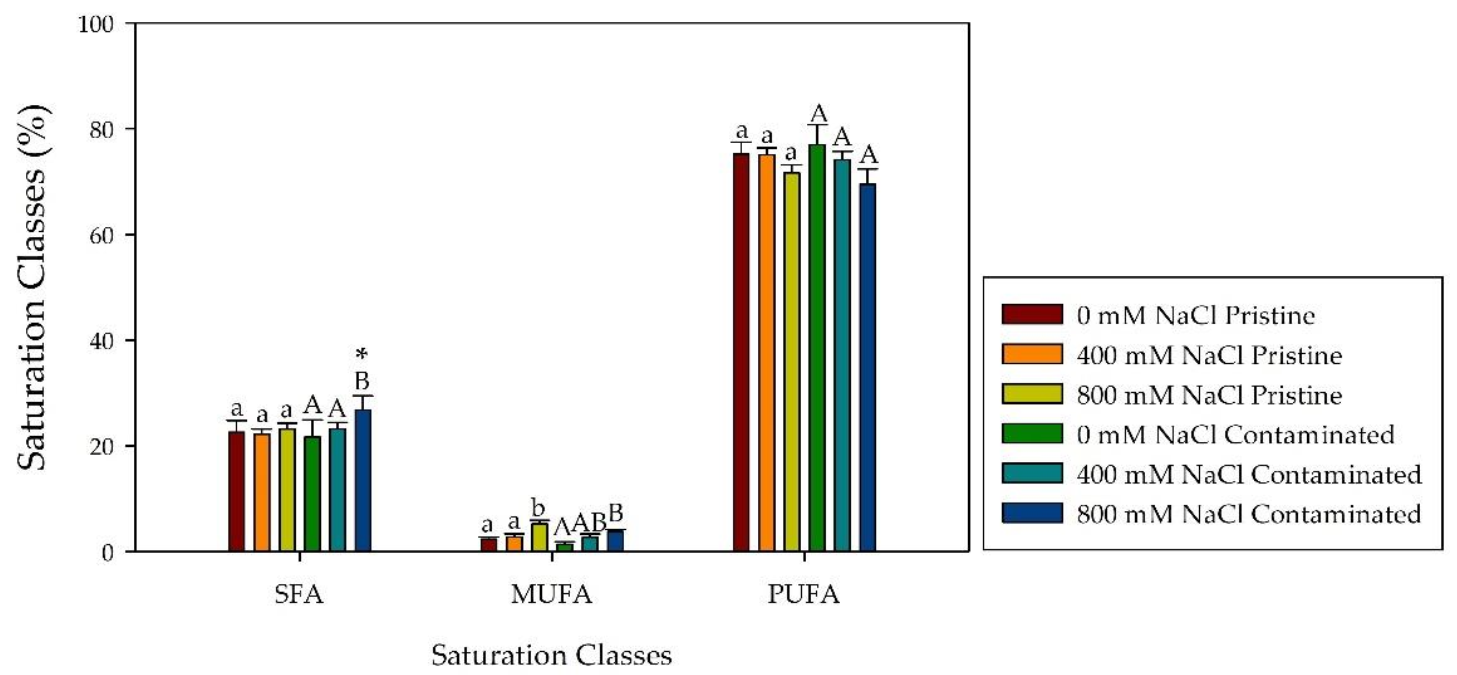
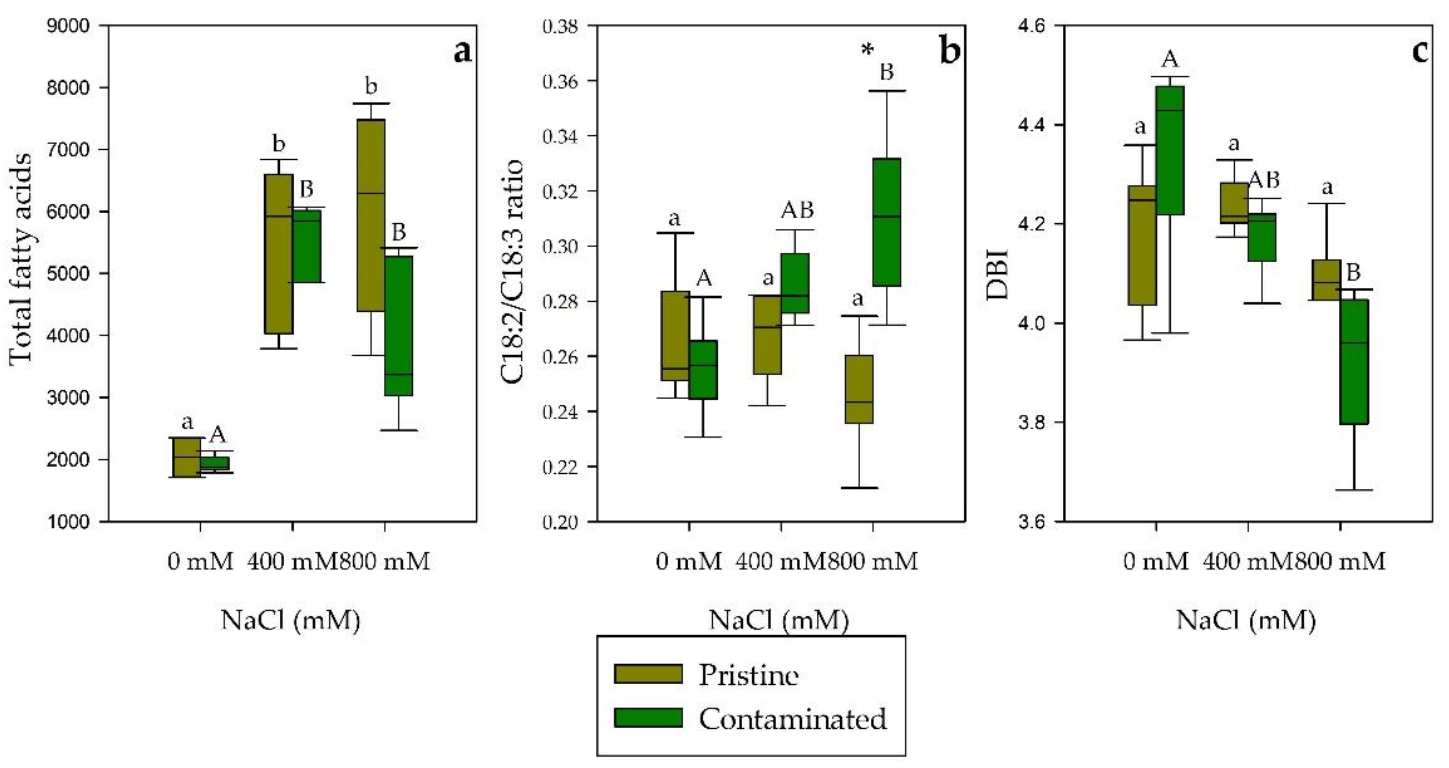
2.4. Fatty Acid Composition

Regarding fatty acid leaf content under salinity exposure (Table 1), the most abundant fatty acids found in the tested groups were palmitic acid (C16:0), linoleic acid (C18:2), and linolenic acid (C18:3). Spartina patens individuals from the pristine marsh when exposed to salinity showed an increase in palmitic acid, while the individuals from the contaminated site showed a decrease, displaying a significantly different trend between populations. An opposite trend, between the S. patens populations, was also found in the stearic acid (C18:0) concentration, increasing and decreasing through salinity treatments in the individuals from the contaminated and pristine marsh respectively. Trans-delta 3-hexadecenoic acid (C16:1t) displayed a significantly higher percentage in the pristine marsh group in 0 mM and 800 mM NaCl. Both populations displayed a decrease in linolenic acid content as a result of NaCl treatments. Considering the fatty acid saturation classes in salt-treated leaves, both marsh populations displayed similar trends. However, saturated fatty acid (SFA) at 800 mM NaCl was found to be significantly higher in the contaminated site samples (Figure 7). The total fatty acid content of S. patens presents highly significant increases in both population treatments (Figure 8a). Contaminated site individuals, when exposed to increasing salinities, displayed an increasing trend in the C18:2/C18:3 ratio (Figure 8b), as well as an inverse trend in the double bond index (DBI; Figure 8c). In contrast, in NaCl treated plants from the pristine site no significant changes were observed.

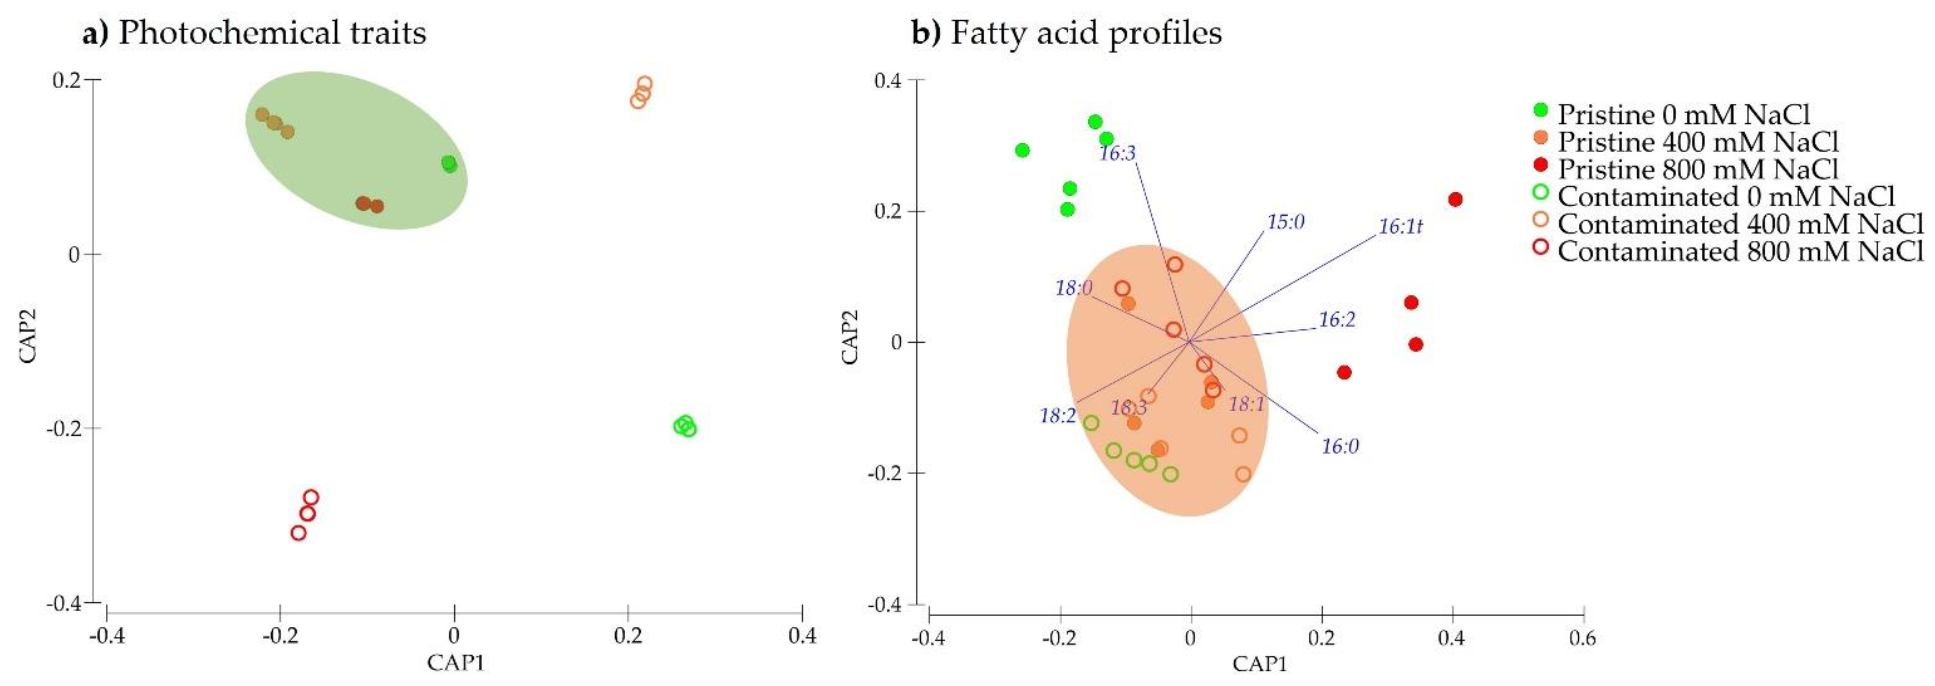
2.5. Multivariate Classification

Gathering all the photochemical data (full Kautsky induction curve dataset) into a unifying canonical analysis of principal coordinates (CAP) the abovementioned differences and traits are highlighted in an integrative form. Moreover, the cross-validation step of this canonical analysis presented a highly elevated classification efficiency of more than 95% for allocation within groups, reinforcing the statical differences observed at the individual level of each of the photochemical traits as efficient descriptors of the populations’ behavior along the tested salinity gradient (Figure 9a). The pristine marsh individuals were grouped and identified, sharing similar photochemical traits, while the individuals from the contaminated site evidence a clear separation under the exposure to different salinity values. A similar approach was performed regarding the leaf fatty acid profile, with the CAP projection based on these traits producing a different grouping profile. Intermediate salinity exposed samples from both populations shoed similar fatty acid profiles being grouped in the center of the projection alongside the samples from individuals collected at the contaminated site exposed to 0 mM NaCl (Figure 9b). Samples from the pristine site exposed to the lowest and highest salinity treatment tested were grouped differentially from the remaining samples. Worth noticing that the CAP analysis based on the fatty acid analysis showed a lower classification efficiency (approximately 70%). Both these CAP analyses show to highlight the different impacts of the tested salinity treatments in the photochemical and fatty acid metabolism, and the different feedbacks from each of the S. patens populations.

3. Discussion

Effects of environmental change on coastal regions include the progressive land immersion from ocean level rise, heightened storm damage, expanding drought seasons, and temperature increase [21]. These abiotic alterations reveal to have significant implications on the environmental salinity gradient, with recent studies forecasting disturbing impacts in salinity concerning waterfront areas [22,23,24]. Therefore, salt marshes ecosystems will be largely affected, especially when considering the salinity concentration to be one of the major constraints of species frequency, distribution, and zonation along with the marsh profile [25,26]. However, complex and significant interspecific variations in the salinity responses of halophytes due to pre-conditioned histories can be a factor in the adaptation of neighboring marsh populations [20].
Photochemical analysis of S. patens, when exposed to salt treatments, confirmed that this species has a high degree of tolerance to salinity even at high NaCl concentrations as shown in previous studies [27,28]. Nevertheless, noticeable differences were shown between NaCl treatments as well as between pristine and contaminated marsh populations. Considering the electron transport chain and related parameters in salt-treated S. patens, it was observed a significant intraspecific difference at 400 and 800 mM NaCl. The individuals from the contaminated marsh, at 400 mM NaCl, displayed a significantly higher photosynthetic light efficiency, coupled with relatively low dissipation energy (DI/CS), which suggests a high electronic transport chain efficiency [20]. On the other hand, at 800 mM NaCl, contaminated marsh samples show a significantly lower maximum ETR and photosynthetic efficiency suggesting an inferior electron transport chain proficiency at higher salinity concentration when compared to the heavy metal contaminated individuals. According to the data acquired, in the salt exposed groups, there is a linear relationship between the variation found in the oxidized quinone pool size and the electron transport energy flux (ET/CS), the absorbed energy flux (ABS/CS), the trapped energy flux (TR/CS), as well as the available reaction centers (RC/CS), nonetheless, the populations showed significant differences among these parameters. Even though the contaminated site S. patens, at 400 and 800 mM NaCl, when compared to the pristine site samples, showed a more significant decrease in quinone pool size, the reduction in the electron transport energy flux was less significant, this can be explained by a better PS II efficiency associated with the lower dissipation energy flux found in the individuals from the contaminated marsh, especially at 400 mM NaCl was the intraspecific differences were found to be more significant [29]. Although the size of the oxidized quinone pool, in the individuals from the pristine location, displayed no significant changes when subjected to salinity, the number of quinone turnovers increased, showing lower quinone pool reduction rates [30]. In contrast, the individuals from the contaminated marsh exhibited a significant reduction of the quinone pool size and no significant changes in its turnover time, indicating tolerance mechanisms that allowed the maintenance of electronic flow rate from the reduced quinone pool to the electron transport chain [10].
The Xanthophyll cycle is a well-described mechanism of energy dissipation, commonly observed in halophytic plants [10,30,31]. To reduce energy overload within light-harvesting complexes (LHCs), the de-epoxidation of the violaxanthin pool towards the zeaxanthin is normally activated [32]. Spartina patens when exposed to salinity, only in 800 mM NaCl treatments in both population samples, showed a highly significant increase in de-epoxidation, reflection of a higher activity of the xanthophyll cycle attempting to scatter the excessive redox potential amassed inside the stroma. The activity shift to photoprotection in the higher salinities was also clear due to the significant rise of the total carotenoid to total chlorophyll ratio. As a possible countermeasure against reactive oxygen species [31] significant increases were observed in β-carotene and lutein, antioxidant acting, pigment concentrations in the salt exposed populations, in particular, this phenomenon was found with more significance at the higher salt concentration in the individuals from the pristine marsh. A highly significant increase in β-carotene was present in the contaminated site samples at 800 mM NaCl and both salinity treatment in the plants from the pristine location, as well as a highly significant increase in lutein at 800 mM NaCl. This may indicate a better ROS savaging capability by S. patens from the contaminated marsh.
The interaction of high NaCl concentrations with the cell organelles leads to increased production of ROS resulting in potentially harmful physiological reactions within the plant cells, affecting among others, proteins production and metabolism [33,34]. Halophytes built up a highly proficient system of enzymatic rapid responses toward salinity changes, immediately activated when the environmental conditions shift aside from the saline comfort zone [35]. When assessing the oxidative stress biomarkers in S. patens, discrepancies in the responses to the salinity stress between populations are clear. Contrary to what was found in the contaminated marsh plants, the pristine site individuals displayed an increase of antioxidant enzyme activities, revealed by the increase of superoxide dismutase and catalase activity when salt treated, significant at 800 mM NaCl [36]. This, coupled with a decrease in total protein content found in this same group, suggests that, when exposed to 800 mM NaCl, S. patens from the pristine marsh, when comparing to the contaminated marsh population, as a higher ROS production, as well as comparatively inferior scavenging mechanism of the ROS species [37,38].
The fatty acid profiles of the salt exposed halophytes presented similar responses amongst populations, but some differences are noteworthy. The linoleic (C18:2) and linolenic (C18:3) ratios, considered a salt stress indication, when under stress conditions the ratio shifts towards linolenic, since it is a membrane restructuring with lower amounts of polyunsaturated acids, thus inferior C18:3 concentration in the leaf is considered an adaptation to salt exposure [39]. The C18:2/ C18:3 ratio increased exclusively in the salinity treated S. patens from the contaminated site, therefore it can be suggested that these individuals are less stressed than those from the pristine location. Furthermore, C18:3 can also act as a direct non-enzymatic reactive oxygen species scavenger [40], which complies with, comparatively, lower ROS consequences found previously in the S. patens from the contaminated marsh. Furthermore, the population from the contaminated marsh displayed a highly significant rise in oleic acid (C18:1), known for improving the stabilization of light-harvesting complexes [41], seen by the positive significant correlation between LHC stress indicator chl a/ chl b ration and the C18:1 fatty acid significant correlation (r2 = 0.921; p < 0.05). On the other hand, in the individuals from the pristine site, the correlation between these two variables is quite low (r2 = 0.161; p < 0.05), indicating that this mechanism only occurs in the plants from the contaminated marsh. Tras-delta-3 hexadecenoic acid (C16:1t), exclusive to plastids [42] and the only strictly light-dependent fatty acid, enables the correct organization of light-harvesting antennae complexes [30,43,44,45]. When comparing the individuals subjected to 0 mM NaCl from both populations, a significant increasing trend was found in the C16:1t concentration of the individuals from the contaminated marsh, concomitant with the, previously determined, lower energy dissipation and reduced reaction centers turnover and closure rates found in the plants from the contaminated marsh, comparatively to those found in the individuals from the pristine marsh, proposing a better LHC organization and heath in the heavy metal affected S. patens when exposed to salt stress.
The overall physiological shift was observed in the CAP analysis where it was compared the physiological and photochemical variations of the individuals under the different NaCl treatments. The cross-validation provided an efficient approach to classify and assess the changes and effects in both populations [46]. When observing the multivariate analysis, NaCl treated S. patens from the pristine marsh showed a clear grouping at the photochemical changes, however, when using the fatty acids profile as the basis the grouping was seen in the contaminated marsh populations. This distinct classification efficiently displays S. patens intraspecific variation. The higher degree of efficiency in the classification of the samples observed in the photochemical traits-based CAP analysis indicates that not only this metabolism is more affected (thus producing more pronounced differences between sample groups) but also that has a higher ability to be used as biomarkers in similar studies comparing not only salinity treatments but also plant populations. Although fatty acid profiles are known to be sensitive to osmotic stress in this particular species as well as in other halophyte species when comparing the same species along a salinity gradient [28,47,48], this canonical approach loses sensitivity when comparing populations of the same species exposed to the same salinity treatments, pointing out to a prevalent role of the salinity treatment over the population origin, in this case, thus leading to less efficient fatty acid-based canonical analysis.

4. Material and Methods

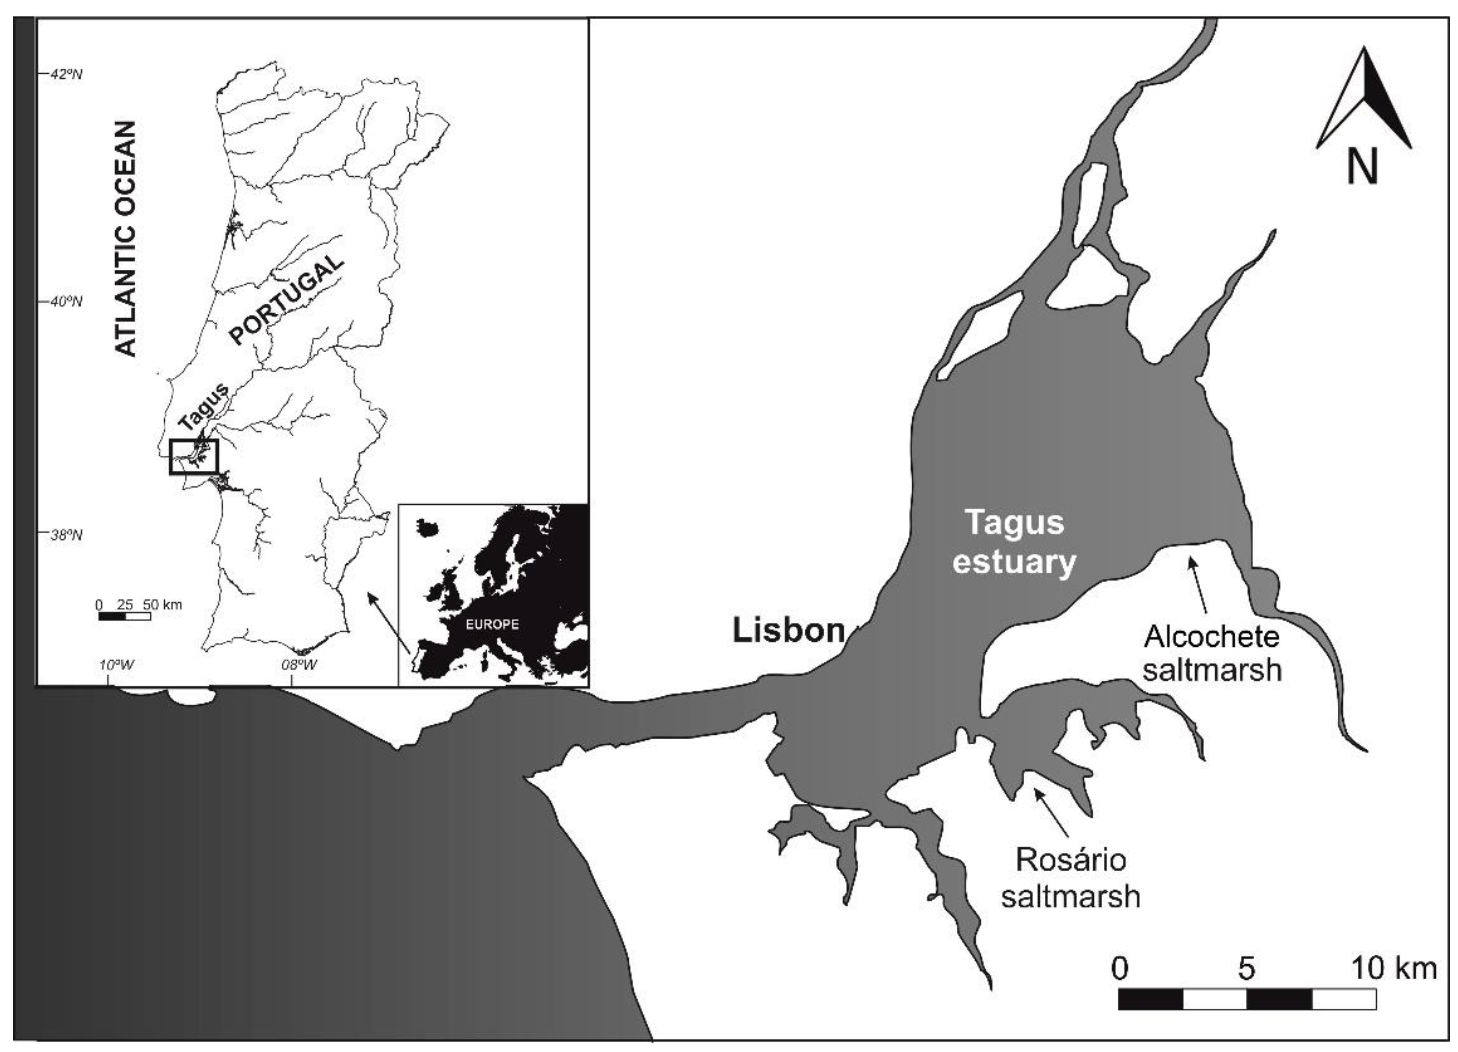
4.1. Sampling Sites and Plant Material Collection

Sampling was carried out on the Tagus estuary, located in the western coast of Portugal, one of the larger estuaries in occidental Europe with an area of approximately 320 km2 (38°44′ N, 9°03′ W; Figure 10). The estuary involves a watershed superior to 80,000 km2 in Spain and Portugal territories, being the second most significant hydrological basin in the whole Iberian Peninsula.
Spartina patens sampling was done during low tide in the southern part of the Tagus estuary in September 2017, on the same day and tidal period at two sampling sites: Alcochete salt marsh (38°45′ N, 8°56′ W) situated within the Tagus Estuary Natural Reserve and Rosário salt marsh (38°40′ N, 9°01′ W) in the vicinity of a former industrial area (Figure 10). Whole plants were excavated from the sediment and intact individuals were transported individually to the laboratory (in refrigerated bags and quickly transported (less than an hour) to the laboratory. Due to the high proximity between both sampling sites, the plant phenological cycle is not different, with very similar plants in terms of morphology and biomass between both sites (data not shown). The geographical location of both marshes prompts a differential metal contamination exposure from anthropogenic origins [28,31]. This is reflected in the bioavailable metal concentrations found in both marshes, with Alcochete sediments showing non-detectable bioavailable Cd concentrations, 0.023 ppm of Cu, 0.001 ppm of Ni, 0.022 ppm of Pb, and 0.052 ppm of Zn on average [31]. On the other hand, Rosário salt marsh sediments exhibited much higher bioavailable metals average concentration values, presenting 0.001 ppm of Cd, 0.034 ppm of Cu, 0.003 ppm of Ni, 0.116 ppm of Pb, and 0.233 ppm of Zn [20,33]. Considering these values, Alcochete marsh was classified as pristine and Rosário marsh as heavy metal contaminated.
At the laboratory, plant samples were gently washed to remove dust and sediments. Spartina patens intact tussocks were set in pots (N = 5) filled with perlite and irrigated with ¼ Hoagland nutrient solution [49]. For experimental proposes, individuals were chosen to have all experimental units with individuals presenting similar height and apparent biomass (data not shown). Plants were placed in a phytoclimatic chamber programmed to simulate a natural light environment using a sinusoidal function (maximum PAR 300 µmol photons m2 s−1, 16/8 h day/night rhythm, 20/18 °C day/night temperature amplitude, relative humidity, 50 ± 2%), and kept under these conditions for 2 months to acclimate to the new growth conditions.

4.2. Experimental Setup

After the abovementioned adaptation period, S. patens individuals from both sites (pristine and contaminated) were separated into 3 groups with 5 replicate individuals (pots). The sample groups were placed in a phytoclimatic chamber programmed to simulate a natural light environment using a sin function (maximum PAR 300 µmol photons m2 s−1, 16/8 h day/night rhythm, 20/18 °C day/night temperature amplitude, relative humidity, 50 ± 2%) and the Hoagland nutrient replaced, in two sample groups, with salinity treatment solution of ¼ Hoagland solution supplemented with NaCl to attain the desired target salinities (400 and 800 mM). Exposure trials lasted for 7 days after which chlorophyll fluorescence measurements were made and consecutively, plants were harvested. Leaf samples for biochemical measurements were immediately flash-frozen in liquid-N2 and stored at −80 °C until analysis.

4.3. Pulse Amplitude Modulated (PAM) Fluorometry

Modulated chlorophyll fluorescence measurements were made in attached leaves with a FluoroPen FP100 PAM (Photo System Instruments, Czech Republic). All the measurements in the dark-adapted state were made after the darkening of the leaves for at least 30 min. Rapid light curves (RLC) measurements, in dark-adapted leaves, were attained using the preprogrammed LC1 protocol of the FluorPen, consisting of a sequence of pulses from 0 to 500 µmol m−2 s−1. Each ΦPS II measurement was used to calculate the electron transport rate (ETR) through photosystem II using the following equation: ETR = ΦPS II × PAR × 0.5, where PAR is the actinic photosynthetically active radiation generated by the FluoroPen and 0.5 assumes that the photons absorbed are equally partitioned between PS II and PSI [51]. Without knowledge of the actual amount of light being absorbed, fluorescence measurements can only be used as an approximation for electron transport [52,53,54]. Rapid light curves (RLC) were generated from the calculated ETRs versus irradiance applied plot and fitted to a double exponential decay function to quantify the characteristic parameters, alpha and ETRmax [55,56]. The OJIP transient (or Kautsky curves) depicts the rate of reduction kinetics of various components of PS II. This is obtained when a dark-adapted leaf is illuminated with the saturating light intensity of 3500 µmol m−2 s−1 then it exhibits a polyphasic rise in fluorescence (OJIP): level O represents all the open reaction centers at the onset of illumination with no reduction of QA (fluorescence intensity lasts for 10 ms); O to J transient indicates the net photochemical reduction of QA (the stable primary electron acceptor of PS II) to QA (lasts for 2 ms); the J to I transition is due to all reduced states of closed RCs such as QA QB, QA QB2− and QA QB H2 (lasts for 2–30 ms); P-step coincides with a maximum concentration of QA QB2 with plastoquinol pool maximally reduced and also reflects a balance between the light incident at the PS II side and the rate of utilization of the chemical (potential) energy and the rate of heat dissipation [57]. Table 2 summarizes all the parameters that could be calculated from the fluorometric analysis.

4.4. Pigment Profiling

Ground freeze-dried leaf samples were extracted with 100% acetone added and subjected to an ultra-sound bath for 1 min to ensure complete disaggregation of the leaf material. Extraction occurred in the dark for 24 h at −20 °C, after which the samples were centrifuged at 4000× g at 4 °C for 15 min. Supernatants were scanned from 350 nm to 750 nm in 1 nm steps, using a dual-beam spectrophotometer (Shimadzu UV/VIS UV1601 Spectrophotometer). Finally, the detected pigment sample absorption spectra were analyzed and quantified employing Gauss-Peak Spectra (GPS) method [58]. The sample spectrum was analyzed, through the GPS fitting library, using SigmaPlot Software. This method is based on the sample spectrum fitting, by a linear combination, to the Gauss-peak spectra, that describes each pigment in the detected spectrum, identifying the samples pigment profile, chlorophyll a, chlorophyll b, auroxanthin, antheraxanthin, β-carotene, lutein, violaxanthin, and zeaxanthin.
For a better evaluation of the light-harvesting and photoprotection mechanisms, the De-Epoxidation State (DES) was calculated as:
DES = Antheraxanthin   +   Zeaxanthin Violaxanthin   +   Antheraxanthin   +   Zeaxanthin

4.5. Leaf Fatty Acid Composition

Leaf fatty acid analyses were performed by direct trans-esterification of leaf samples as previously described [20,59,60]. Fatty acid methyl esters (FAME) were prepared in glass tubes containing the internal standard heptadecanoate (C17:0), methanol, and sulphuric acid, at 70 °C for one hour. After cooling down the FAME were extracted by adding petroleum and water, vortexed, centrifuged at 4000× g for 5 min. The upper layer was dried under a nitrogen stream in a water bath set to 37 °C. After evaporation, 50 µL of hexane was added to the residue and one µL of the solution separated in a gas chromatograph (Varian 3900, Palo Alto, CA, USA) equipped with a hydrogen flame-ionization detector using a fused silica 0.25 mm i.d. × 50 m capillary column (WCOT Fused Silica, CP-Sil 88 for FAME; Varian). The double-bound index (DBI) was calculated using the equation:
DBI = 2 ×   16 : 1 t + 18 : 1 +   2 × 18 : 2 + 3 ×   18 : 3 + 16 : 3 100

4.6. Oxidative Stress Biomarkers

For enzyme extractions of S. patens leaf samples were retrieved from −80°C storage and extractions were performed according to Tiryakioglu et al. [61], at 4°C. Frozen leaves were homogenized in 50 mM sodium phosphate buffer (pH 7.6) supplemented with 0.1 mM Na-EDTA in a ceramic mortar with a proportion of 500 mg (FW) to 8 mL respectively. The homogenate was centrifuged at 8890× g for 20 minutes at 4 °C, and the supernatant was transferred to a test tube and used for the antioxidant enzyme analyses.
The enzyme activity measurements of catalase (CAT, EC.1.11.1.6.), Ascorbate peroxidase (APx, E.C. 1.11.1.11), Guaiacol peroxidase (GPX, E.C. 1.11.1.7), and Superoxide dismutase (SOD, E.C. 1.15.1.1) were performed in a dual-beam spectrophotometer (Shimadzu UV/VIS UV1601 Spectrophotometer) using quartz cuvettes. Catalase activity assays were performed according to the method of Teranishi et al. [62], by monitoring the H2O2 consumption and consequent decrease in absorbance at 240 nm (molar extinction coefficient of 39.4 mM−1 cm−1). Ascorbate peroxidase was measured according to Tiryakioglu et al. [61], by observing the ascorbate oxidation and consequent absorbance reduction at 290 nm (molar extinction coefficient of 2.8 mM−1 cm−1). Guaiacol peroxidase measurement was performed according to Bergmeyer et al. [63], by monitoring guaiacol oxidation products formation and its increase in absorbance during 60 seconds at 470 nm (molar extinction coefficient of 26.6 mM−1 cm−1). Superoxide dismutase total activity was assayed according to the method of Marklund and Marklund [64], by measuring the oxidation rate of pyrogallol monitored at 325 nm. The autoxidation of pyrogallol was read without enzymatic extract during the same period and time interval for comparison enabling. Protein quantification was determined using the Bradford method [65].
Membrane lipid peroxidation quantification was performed in S. patens leaf samples according to Heath & Packer [66]. First, leaf samples were homogenized in a freshly prepared Thiobarbituric acid (TBA) solution (0.5% (w/v) TBA in 20% (w/v) Trichloroacetic acid), in a proportion of 100 mg FW to 2 mL of solution. The homogenate was incubated for 30 min at 95 °C, cooled on ice to stop the reaction, and centrifuged at 4000× g for 5 min at 4 °C. The absorbance was read at 532 nm and 600 nm in a Shimadzu UV-1601 spectrophotometer. Malondialdehyde (MDA) concentration was calculated using the molar extinction coefficient, 155 mM−1 cm−1 when applying the following equation:
A 532 n m A 600 n m =   MDA m M × ε MDA

4.7. Statistical Analysis

Statistical analysis of the data derived from the previous analysis was made based on non-parametric tests, due to a lack of normality and homogeneity. The resultant effects of warming treatments in the different populations and salinity treatments were compared by performing Kruskal–Wallis test using Statistica Software (Statasoft, Tulsa, OK, USA). Significant and highly significant values were assumed when the probability value (p-value) was smaller than 0.05 and 0.01 respectively. Multivariate analysis was also conducted using Primer 6 software [67]. A Canonical Analysis of Principal Components (CAP) was also performed using the physiological traits as inputs, to test the efficiency of the variables in describing the populations’ behavior under altered thermal environments, but also to analyze this behavior, producing a statistically tested canonical plot. To evaluate the changes in photochemical and fatty acid metabolism as a whole, a multivariate approach was applied [46]. Canonical analysis of principle (CAP) coordinates, using Euclidean distances, were used to visualize differences in multivariate space regarding studied photochemical variables and fatty acid relative composition, as well as to determine the allocation efficiency to different treatment groups. This multivariate approach is insensitive to heterogeneous data and frequently used to compare different sample groups using the intrinsic characteristics of each group (metabolic characteristics) [30,46,68]. Multivariate statistical analyses were conducted using Primer 6 software [67].

5. Conclusions

This study provides new insights on the relationship between environmental history and tolerance variation of Spartina patens to salinity. Biophysical and biochemical intraspecific data variation suggests that heavy metal pre-conditioning has a considerable and significant influence on the salinity tolerance mechanisms and salinity resistance of these plants. When comparing marshes, individuals from the pristine site appear to withstand the harshest photochemical consequences as seen by the decrease of the chlorophyll a/b ratio, through salt concentrations, opposite to the increasing tendency found in the pre-conditioned S. patens. These responses were correlated with the highly significant increase in oleic acid found only in S. patens from the contaminated marsh, indicating that these plants have an effective light-harvesting complexes stabilization mechanism. Moreover, individual from the pristine marsh exhibited impairments in the LHC mechanisms, coupled with the comparatively deficient energy dissipation mechanisms at high salinities, seems to lead to higher ROS generation and as a consequence of higher plant damage degree. Therefore, it could be concluded that, as salinity increases, the heavy metal contaminated marsh (i.e., Rosario) may generate a more aggressive S. patens invasion and spreading, and consequently a more negative ecological effect in the marsh biodiversity especially at high salinities (800 mM NaCl) where the fitness variation between populations is more significant. Therefore, pre-conditioning history seems to potentially be a key factor in the understanding of intraspecies response to future constraints and, subsequently, essential when considering ecological evolution to climate change realities.

Author Contributions

Conceptualization, J.C. and B.D.; methodology, J.C., A.R.M. and B.D; software, J.C. and B.D.; validation, E.M.-N., S.R.-G. and I.C.; formal analysis, J.C.; investigation, J.C. and J.A.P.-R.; resources, A.R.M. and B.D.; data curation, J.C. and B.D.; writing—original draft preparation, J.C.; writing—review and editing, E.M.-N., S.R.-G., A.R.M., I.C. and B.D.; visualization, supervision, project administration and funding acquisition, I.C. and B.D. All authors have read and agreed to the published version of the manuscript.

Funding

This research was funded by Fundação para a Ciência e a Tecnologia (FCT), via the project grant UIDB/04292/2020, UID/MULTI/04046/2019 and PTDC/CTA-AMB/30056/2017. Work was also funded by MAR 2020 program via the Project RESTAURA2020 (16-01-04-FMP-0014). B. Duarte was supported by investigation contracts (CEECIND/00511/2017).

Conflicts of Interest

The authors declare no conflict of interest.

References

  1. Barros, V.R.; Field, C.B.; Dokken, D.J.; Mastrandrea, M.D.; Mach, K.J.; Bilir, T.E.; Chatterjee, M.; Ebi, K.L.; Estrada, Y.O.; Genova, R.C.; et al. Climate Change 2014 Impacts, Adaptation and Vulnerability Part B: Regional Aspects: Working Group Ii Contribution to the Fifth Assessment Report of the Intergovernmental Panel on Climate Change; Barros, V.R., Field, C.B., Dokken, D.J., Mastrandrea, M.D., Mach, K.J., Eds.; Cambridge University Press: Cambridge, UK, 2014. [Google Scholar] [CrossRef] [Green Version]
  2. Shiklomanov, I.A. Appraisal and assessment of world water resources. Water Int. 2000, 25. [Google Scholar] [CrossRef]
  3. Glick, B.R.; Cheng, Z.; Czarny, J.; Duan, J. Promotion of Plant Growth by ACC Deaminase-Producing Soil Bacteria. Eur. J. Plant Pathol. 2007. [Google Scholar] [CrossRef]
  4. Shrivastava, P.; Kumar, R. Soil Salinity: A Serious Environmental Issue and Plant Growth Promoting Bacteria as One of the Tools for Its Alleviation. Saudi J. Biol. Sci. 2015. [Google Scholar] [CrossRef] [Green Version]
  5. Bacilio, M.; Rodriguez, H.; Moreno, M.; Hernandez, J.P.; Bashan, Y. Mitigation of Salt Stress in Wheat Seedlings by a Gfp-Tagged Azospirillum Lipoferum. Biol. Fertil. Soils 2004, 40. [Google Scholar] [CrossRef]
  6. Munns, R.; Tester, M. Mechanisms of Salinity Tolerance. Annu. Rev. Plant Biol. 2008. [Google Scholar] [CrossRef] [PubMed] [Green Version]
  7. Akbarimoghaddam, H.; Galavi, M.; Ghanbari, A.; Panjehkeh, N. Salinity Effects on Seed Germination and Seedling Growth of Bread Wheat Cultivars. Trakia J. Sci. 2011, 9, 43–50. [Google Scholar]
  8. Jamil, A.; Riaz, S.; Ashraf, M.; Foolad, M.R. Gene Expression Profiling of Plants under Salt Stress. Crit. Rev. Plant Sci. 2011. [Google Scholar] [CrossRef]
  9. Flowers, T.J.; Colmer, T.D. Salinity Tolerance in Halophytes. New Phytol. 2008. [Google Scholar] [CrossRef] [PubMed]
  10. Duarte, B.; Santos, D.; Marques, J.C.; Caçador, I. Biophysical Probing of Spartina Maritima Photo-System II Changes during Prolonged Tidal Submersion Periods. Plant Physiol. Biochem. 2014, 77. [Google Scholar] [CrossRef] [Green Version]
  11. Adam, P. Saltmarshes in a Time of Change. Environ. Conserv. 2002, 29. [Google Scholar] [CrossRef]
  12. Caçador, I.; Tibério, S.; Cabral, H.N. Species zonation in corroios salt marsh in the tagus estuary (Portugal) and its dynamics in the past fifty years. Hydrobiologia 2007, 587, 205–211. [Google Scholar] [CrossRef]
  13. Jump, A.S.; Peñuelas, J. Running to Stand Still: Adaptation and the Response of Plants to Rapid Climate Change. Ecol. Lett. 2005, 8, 1010–1020. [Google Scholar] [CrossRef]
  14. Gratani, L.; Crescente, M.F. Phenology and Leaf Adaptive Strategies of Mediterranean Maquis Plants. Ecol. Mediterr. 1997, 23, 11–19. [Google Scholar] [CrossRef]
  15. Valladares, F.; Gianoli, E.; Gómez, J.M. Ecological Limits to Plant Phenotypic Plasticity. New Phytol. 2007, 176, 749–763. [Google Scholar] [CrossRef] [PubMed]
  16. Duarte, B.; Baeta, A.; Rousseau-Gueutin, M.; Ainouche, M.; Marques, J.C.; Caçador, I. A Tale of Two Spartinas: Climatic, Photobiological and Isotopic Insights on the Fitness of Non-Indigenous versus Native Species. Estuar. Coast. Shelf Sci. 2015, 167, 178–190. [Google Scholar] [CrossRef]
  17. Caçador, I.; Vale, C.; Catarino, F. The Influence of Plants on Concentration and Fractionation of Zn, Pb and Cu in Salt Marsh Sediments (Tagus Estuary, Portugal). J. Aquat. Ecosyst. Stress Recov. 1996, 5. [Google Scholar] [CrossRef]
  18. Flowers, T.J. Improving crop salt tolerance. J. Exp. Bot. 2004, 55. [Google Scholar] [CrossRef]
  19. Hester, M.W.; Mendelssohn, I.A.; Mckee, K.L. Intraspecific Variation in Salt Tolerance and Morphology in the Coastal Grass Spartina Patens (Poaceae). Am. J. Bot. 1996, 83. [Google Scholar] [CrossRef]
  20. Carreiras, J.; Alberto Pérez-Romero, J.; Mateos-Naranjo, E.; Redondo-Gómez, S.; Rita Matos, A.; Caçador, I.; Duarte, B. The Effect of Heavy Metal Contamination Pre-Conditioning in the Heat Stress Tolerance of Native and Invasive Mediterranean Halophytes. Ecol. Indic. 2020, 111. [Google Scholar] [CrossRef]
  21. Lee, J.-Y.; Marotzke, J.; Nala, G.; Cao, L.; Corti, S.; Dunne, J.P.; Engelbrecht, F.; Fisher, E.; Fyfe, J.C.; Jones, C.; et al. Climate Change 2021: The Physical Science Basis. Contribution of Working Group I to the Sixth Assessment Report of the Intergovernmental Panel on Climate Change. Cambridge Univ. Press 2021, No. In Press, 3949. [Google Scholar]
  22. Rodrigues, M.; Fortunato, A.B. Assessment of a Three-Dimensional Baroclinic Circulation Model of the Tagus Estuary (Portugal). AIMS Environ. Sci. 2017, 4, 763–787. [Google Scholar] [CrossRef]
  23. Dasgupta, S.; Hossain, M.M.; Huq, M.; Wheeler, D. Climate Change and Soil Salinity: The Case of Coastal Bangladesh. Ambio 2015, 44. [Google Scholar] [CrossRef] [Green Version]
  24. Wheeler, D. Quantifying Vulnerability to Climate Change: Implications for Adaptation Assistance. SSRN Electron. J. 2012. [Google Scholar] [CrossRef] [Green Version]
  25. Duarte, B.; Sleimi, N.; Cagador, I. Biophysical and Biochemical Constraints Imposed by Salt Stress: Learning from Halophytes. Front. Plant Sci. 2014, 5. [Google Scholar] [CrossRef] [PubMed] [Green Version]
  26. Silvestri, S.; Defina, A.; Marani, M. Tidal Regime, Salinity and Salt Marsh Plant Zonation. Estuar. Coast. Shelf Sci. 2005, 62. [Google Scholar] [CrossRef]
  27. Duarte, B.; Santos, D.; Marques, J.C.; Caçador, I. Ecophysiological Constraints of Two Invasive Plant Species under a Saline Gradient: Halophytes versus Glycophytes. Estuar. Coast. Shelf Sci. 2015, 167, 154–165. [Google Scholar] [CrossRef]
  28. Duarte, B.; Matos, A.R.; Marques, J.C.; Caçador, I. Leaf Fatty Acid Remodeling in the Salt-Excreting Halophytic Grass Spartina Patens along a Salinity Gradient. Plant Physiol. Biochem. 2018, 124, 112–116. [Google Scholar] [CrossRef] [PubMed]
  29. Kalaji, H.M.; Govindjee; Bosa, K.; Kościelniak, J.; Zuk-Gołaszewska, K. Effects of Salt Stress on Photosystem II Efficiency and CO2 Assimilation of Two Syrian Barley Landraces. Environ. Exp. Bot. 2011, 73. [Google Scholar] [CrossRef]
  30. Duarte, B.; Cabrita, M.T.; Gameiro, C.; Matos, A.R.; Godinho, R.; Marques, J.C.; Caçador, I. Disentangling the Photochemical Salinity Tolerance in Aster Tripolium, L.: Connecting Biophysical Traits with Changes in Fatty Acid Composition. Plant Biol. 2017, 19. [Google Scholar] [CrossRef] [PubMed]
  31. Duarte, B.; Santos, D.; Marques, J.C.; Caçador, I. Ecophysiological Adaptations of Two Halophytes to Salt Stress: Photosynthesis, PS II Photochemistry and Anti-Oxidant Feedback-Implications for Resilience in Climate Change. Plant Physiol. Biochem. 2013, 67. [Google Scholar] [CrossRef] [PubMed]
  32. Wentworth, M.; Ruban, A.V.; Horton, P. Chlorophyll Fluorescence Quenching in Isolated Light Harvesting Complexes Induced by Zeaxanthin. FEBS Lett. 2000, 471. [Google Scholar] [CrossRef] [Green Version]
  33. Duarte, B.; Santos, D.; Caçador, I. Halophyte anti-oxidant feedback seasonality in two salt marshes with different degrees of metal contamination: Search for an efficient biomarker. Funct. Plant Biol. 2013, 40. [Google Scholar] [CrossRef]
  34. Kaya, C.; Ashraf, M.; Alyemeni, M.N.; Ahmad, P. The Role of Endogenous Nitric Oxide in Salicylic Acid-Induced up-Regulation of Ascorbate-Glutathione Cycle Involved in Salinity Tolerance of Pepper (Capsicum Annuum L.) Plants. Plant Physiol. Biochem. 2020, 147, 10–20. [Google Scholar] [CrossRef]
  35. Zhou, H.; Lin, H.; Chen, S.; Becker, K.; Yang, Y.; Zhao, J.; Kudla, J.; Schumaker, K.S.; Guo, Y. Inhibition of the Arabidopsis Salt Overly Sensitive Pathway by 14-3-3 Proteins. Plant Cell 2014, 26. [Google Scholar] [CrossRef] [PubMed] [Green Version]
  36. Sheteiwy, M.S.; Shao, H.; Qi, W.; Hamoud, Y.A.; Shaghaleh, H.; Khan, N.U.; Yang, R.; Tang, B. GABA-Alleviated Oxidative Injury Induced by Salinity, Osmotic Stress and Their Combination by Regulating Cellular and Molecular Signals in Rice. Int. J. Mol. Sci. 2019, 20, 5709. [Google Scholar] [CrossRef] [PubMed] [Green Version]
  37. Ahanger, M.A.; Aziz, U.; Alsahli, A.A.; Alyemeni, M.N.; Ahmad, P. Influence of Exogenous Salicylic Acid and Nitric Oxide on Growth, Photosynthesis and Ascorbate- Glutathione Cycle in Salt Stressed Vigna Angularis. Biomolecules 2020, 10, 42. [Google Scholar] [CrossRef] [PubMed] [Green Version]
  38. Khan, I.; Raza, M.A.; Awan, S.A.; Shah, G.A.; Rizwan, M.; Ali, B.; Tariq, R.; Hassan, M.J.; Alyemeni, M.N.; Brestic, M.; et al. Amelioration of Salt Induced Toxicity in Pearl Millet by Seed Priming with Silver Nanoparticles (AgNPs): The Oxidative Damage, Antioxidant Enzymes and Ions Uptake Are Major Determinants of Salt Tolerant Capacity. Plant Physiol. Biochem. 2020, 156, 221–232. [Google Scholar] [CrossRef] [PubMed]
  39. Ben Hamed, K.; Ben Youssef, N.; Ranieri, A.; Zarrouk, M.; Abdelly, C. Changes in Content and Fatty Acid Profiles of Total Lipids and Sulfolipids in the Halophyte Crithmum Maritimum under Salt Stress. J. Plant Physiol. 2005, 162. [Google Scholar] [CrossRef]
  40. Mène-Saffrané, L.; Dubugnon, L.; Chételat, A.; Stolz, S.; Gouhier-Darimont, C.; Farmer, E.E. Nonenzymatic Oxidation of Trienoic Fatty Acids Contributes to Reactive Oxygen Species Management in Arabidopsis. J. Biol. Chem. 2009, 284. [Google Scholar] [CrossRef] [Green Version]
  41. Siefermann-Harms, D.; Angerhofer, A. Evidence for an O2-Barrier in the Light-Harvesting Chlorophyll-a/b-Protein Complex LHC II. Photosynth. Res. 1998, 55. [Google Scholar] [CrossRef]
  42. Trémolières, A.; Siegenthaler, P.-A. Reconstitution of photosynthetic structures and activities with lipids. Lipids Photosynth. Struct. Funct. Genet. 1998, 6. [Google Scholar] [CrossRef]
  43. Hobe, S.; Prytulla, S.; Kühlbrandt, W.; Paulsen, H. Trimerization and Crystallization of Reconstituted Light-Harvesting Chlorophyll a/b Complex. EMBO J. 1994, 13. [Google Scholar] [CrossRef]
  44. Hobe, S.; Förster, R.; Klingler, J.; Paulsen, H. N-Proximal Sequence Motif in Light-Harvesting Chlorophyll a/b-Binding Protein Is Essential for the Trimerization of Light-Harvesting Chlorophyll Alb Complex. Biochemistry 1995, 34. [Google Scholar] [CrossRef] [PubMed]
  45. Nußberger, S.; Dörr, K.; Wang, D.N.; Kühlbrandt, W. Lipid-Protein Interactions in Crystals of Plant Light-Harvesting Complex. J. Mol. Biol. 1993, 234. [Google Scholar] [CrossRef] [PubMed]
  46. Duarte, B.; Prata, D.; Matos, A.R.; Cabrita, M.T.; Caçador, I.; Marques, J.C.; Cabral, H.N.; Reis-Santos, P.; Fonseca, V.F. Ecotoxicity of the Lipid-Lowering Drug Bezafibrate on the Bioenergetics and Lipid Metabolism of the Diatom Phaeodactylum Tricornutum. Sci. Total Environ. 2019, 650. [Google Scholar] [CrossRef]
  47. Duarte, B.; Caçador, I.; Matos, A.R. Lipid Landscape Remodelling in Sarcocornia Fruticosa Green and Red Physiotypes. Plant Physiol. Biochem. 2020, 157. [Google Scholar] [CrossRef]
  48. Duarte, B.; Matos, A.R.; Caçador, I. Photobiological and Lipidic Responses Reveal the Drought Tolerance of Aster Tripolium Cultivated under Severe and Moderate Drought: Perspectives for Arid Agriculture in the Mediterranean. Plant Physiol. Biochem. 2020, 154. [Google Scholar] [CrossRef]
  49. Hoagland, D.R.; Arnon, D.I. Preparing the Nutrient Solution. Water-Cult. Method Grow. Plants Soil 1950, 347, 2–33. [Google Scholar]
  50. Pedro, S.; Duarte, B.; Raposo de Almeida, P.; Caçador, I. Metal Speciation in Salt Marsh Sediments: Influence of Halophyte Vegetation in Salt Marshes with Different Morphology. Estuar. Coast. Shelf Sci. 2015, 167. [Google Scholar] [CrossRef]
  51. Genty, B.; Briantais, J.M.; Baker, N.R. The Relationship between the Quantum Yield of Photosynthetic Electron Transport and Quenching of Chlorophyll Fluorescence. Biochim. Biophys. Acta-Gen. Subj. 1989, 990. [Google Scholar] [CrossRef]
  52. Beer, S.; Björk, M. Measuring Rates of Photosynthesis of Two Tropical Seagrasses by Pulse Amplitude Modulated (PAM) Fluorometry. Aquat. Bot. 2000, 66. [Google Scholar] [CrossRef]
  53. Beer, S.; Vilenkin, B.; Weil, A.; Veste, M.; Susel, L.; Eshel, A. Measuring Photosynthetic Rates in Seagrasses by Pulse Amplitude Modulated (PAM) Fluorometry. Mar. Ecol. Prog. Ser. 1998, 174. [Google Scholar] [CrossRef]
  54. Runcie, J.W.; Durako, M.J. Among-Shoot Variability and Leaf-Specific Absorptance Characteristics Affect Diel Estimates of in Situ Electron Transport of Posidonia Australis. Aquat. Bot. 2004, 80. [Google Scholar] [CrossRef]
  55. Marshall, H.L.; Geider, R.J.; Flynn, K.J. A Mechanistic Model of Photoinhibition. New Phytol. 2000, 145. [Google Scholar] [CrossRef] [Green Version]
  56. Platt, T.; Gallegos, C.L.; Harrison, W.G. Photoinhibition of photosynthesis in natural assemblages of marine phytoplankton. J. Mar. Res. 1980, 38, 687–701. [Google Scholar]
  57. Zhu, X.G.; Govindjee; Baker, N.R.; DeSturler, E.; Ort, D.R.; Long, S.P. Chlorophyll a Fluorescence Induction Kinetics in Leaves Predicted from a Model Describing Each Discrete Step of Excitation Energy and Electron Transfer Associated with Photosystem II. Planta 2005, 223. [Google Scholar] [CrossRef] [PubMed]
  58. Küpper, H.; Seibert, S.; Parameswaran, A. Fast, Sensitive and Inexpensive Alternative to Analytical Pigment HPLC: Quantification of Chlorophylls and Carotenoids in Crude Extracts by Fitting with Gauss Peak Spectra. Anal. Chem. 2007, 79. [Google Scholar] [CrossRef] [PubMed]
  59. Duarte, B.; Pedro, S.; Marques, J.C.; Adão, H.; Caçador, I. Zostera Noltii Development Probing Using Chlorophyll a Transient Analysis (JIP-Test) under Field Conditions: Integrating Physiological Insights into a Photochemical Stress Index. Ecol. Indic. 2017, 76, 219–229. [Google Scholar] [CrossRef]
  60. Esquível, M.G.; Matos, A.R.; Marques Silva, J. Rubisco Mutants of Chlamydomonas Reinhardtii Display Divergent Photosynthetic Parameters and Lipid Allocation. Appl. Microbiol. Biotechnol. 2017, 101. [Google Scholar] [CrossRef] [PubMed]
  61. Tiryakioglu, M.; Eker, S.; Ozkutlu, F.; Husted, S.; Cakmak, I. Antioxidant Defense System and Cadmium Uptake in Barley Genotypes Differing in Cadmium Tolerance. J. Trace Elem. Med. Biol. 2006, 20. [Google Scholar] [CrossRef]
  62. Teranishi, Y.; Tanaka, A.; Osumi, M.; Fukui, S. Catalase Activities of Hydrocarbon-Utilizing Candida Yeasts. Agric. Biol. Chem. 1974, 38. [Google Scholar] [CrossRef]
  63. Bergmeyer, H.U.; Gawehn, K.; Grassl, M. Lactatedehydrogenase, UV-assay with pyruvate and NADH. Methods Enzym. Anal. 1974, 2, 574–579. [Google Scholar] [CrossRef]
  64. Marklund, S.; Marklund, G. Involvement of the Superoxide Anion Radical in the Autoxidation of Pyrogallol and a Convenient Assay for Superoxide Dismutase. Eur. J. Biochem. 1974, 47. [Google Scholar] [CrossRef]
  65. Bradford, M.M. A Rapid and Sensitive Method for the Quantitation of Microgram Quantities of Protein Utilizing the Principle of Protein-Dye Binding. Anal. Biochem. 1976, 72, 248–254. [Google Scholar] [CrossRef]
  66. Heath, R.L.; Packer, L. Photoperoxidation in Isolated Chloroplasts. I. Kinetics and Stoichiometry of Fatty Acid Peroxidation. Arch. Biochem. Biophys. 1968, 125. [Google Scholar] [CrossRef]
  67. Clarke, K.R.; Gorley, R.N. PRIMER v6: User Manual/Tutorial., 1st ed.; PRIMER-E: Plymouth, UK, 2006; 192p. [Google Scholar]
  68. Cabrita, M.T.; Duarte, B.; Gameiro, C.; Godinho, R.M.; Caçador, I. Photochemical Features and Trace Element Substituted Chlorophylls as Early Detection Biomarkers of Metal Exposure in the Model Diatom Phaeodactylum Tricornutum. Ecol. Indic. 2018, 95. [Google Scholar] [CrossRef]
Figure 1. (a) Relative electron transport rates (rETR), (b) photosynthetic efficiency (α), and (c) maximum electron transport rate (ETRmax) in S. patens dark-adapted leaves from pristine and heavy metal contaminated sites (average ± standard error, N = 5), along with the tested NaCl concentrations. Letters indicate significant differences between treatments at p < 0.05; asterisks mark significant differences between populations at p < 0.05.
Plants 10 02072 g001
Figure 2. Phenomenological energetic parameters, (a) absorbed energy flux (ABS/CS), (b) trapped energy flux (TR/CS), (c) electron transport energy flux (ET/CS), (d) dissipation energy flux (DI/CS), and (e) oxidized reaction centers (RC/CS) on a cross-section basis, in S. patens dark-adapted leaves from pristine and heavy metal contaminated sites (average ± standard error, N = 5), along with the tested NaCl concentrations. Letters indicate significant differences between treatments at p < 0.05; asterisks mark significant differences between populations at p < 0.05.
Plants 10 02072 g002
Figure 3. OJIP derived parameters, (a) the total number of electrons transferred into the electron transport chain (N), (b) the net rate of PS II reaction centers closure (M0), (c) PS I efficiency in reducing its electron acceptors (δR0), (d) size of the oxidized quinone pool, and (e) grouping probability (PG) in S. patens dark-adapted leaves from pristine and heavy metal contaminated sites (average ± standard error, N = 5), along with the tested NaCl concentrations. Letters indicate significant differences between treatments at p < 0.05; asterisks mark significant differences between populations at p < 0.05.
Plants 10 02072 g003
Figure 4. Pigment relative concentration. (a) Leaf chlorophyll a (Chl a), chlorophyll b (Chl b), total chlorophyll (Total Chl), (b) auroxanthin, antheraxanthin, β-carotene, lutein, neoxanthin, violaxanthin and zeaxanthin concentration (µg g−1 FW) in S. patens individuals from pristine and heavy metal contaminated sites (average ± standard error, N = 5), along with the tested NaCl concentrations. Letters indicate significant differences between treatments at p < 0.05; asterisks mark significant differences between populations at p < 0.05.
Plants 10 02072 g004
Figure 5. Leaves pigment ratios, (a) chlorophyll a/b ratio (Chl a/b ratio), (b) total carotenoid to total chlorophyll ratio, (c) chlorophyll degradation index (CDI), and (d) de-epoxidation state (DES) in S. patens individuals from pristine and heavy metal contaminated sites (average ± standard error, N = 5), along with the tested NaCl concentrations. Letters indicate significant differences between treatments at p < 0.05; asterisks mark significant differences between populations at p < 0.05.
Plants 10 02072 g005
Figure 6. (a) Catalase, (b) ascorbate peroxidase, (c) guaiacol peroxidase, and (d) superoxide dismutase activities (U mg−1 protein) and (e) total protein content (µg Protein g−1 FW) in the leaves of S. patens from pristine and heavy metal contaminated sites (average ± standard error, N = 5), along with the tested NaCl concentrations. Letters indicate significant differences between treatments at p < 0.05; asterisks mark significant differences between populations at p < 0.05.
Plants 10 02072 g006
Figure 7. Saturated fatty acid (SFA), monounsaturated fatty acid (MUFA) and polyunsaturated fatty acid (PUFA) relative concentration (%, average ± standard error, N = 5) in S. patens leaves from pristine and heavy metal contaminated sites, along with the tested NaCl concentrations. Letters indicate significant differences between treatments at p < 0.05; asterisks mark significant differences between populations at p < 0.05.
Plants 10 02072 g007
Figure 8. (a) Total fatty acid content (µg.g−1 FW), (b) linoleic acid to linolenic acid ratio (C18:2/C18:3 ratio), and (c) double-bound index (DBI) in S. patens leaves from pristine and heavy metal contaminated sites (average ± standard error, N = 5), along with the tested NaCl concentrations. Letters indicate significant differences between treatments at p < 0.05; asterisks mark significant differences between populations at p < 0.05.
Plants 10 02072 g008
Figure 9. Canonical analysis of principal coordinates (CAP) based on (a) photochemical traits and (b) based on the fatty acid profiles, pentadecanoic acid (C15:0), palmitic acid (C16:0), trans-delta 3-hexadecenoic acid (C16:1t), hexadecatrienoic acid (C16:3), stearic acid (C18:0), oleic acid (C18:1), linoleic acid (C18:2) and linolenic acid (C18:3)) from S. patens collected in pristine and heavy metal contaminated salt marshes exposed to the tested NaCl concentrations.
Plants 10 02072 g009
Figure 10. Tagus Estuary map with Alcochete (pristine) and Rosário (heavy metal contaminated) salt marshes sampling stations marked [50].
Plants 10 02072 g010
Table 1. Fatty acid relative content (%, average ± standard error, N = 5) namely, pentadecanoic acid (C15:0), palmitic acid (C16:0), trans-delta 3-hexadecenoic acid (C16:1t), hexadecatrienoic acid (C16:3), stearic acid (C18:0), oleic acid (C18:1), linoleic acid (C18:2) and linolenic acid (C18:3) in S. patens leaves from pristine and heavy metal contaminated sites, along with the tested NaCl concentrations. Letters indicate significant differences between treatments at p < 0.05; asterisks mark significant differences between populations at p < 0.05.
Salinity
(mM)
15:016:0 16:1t 16:318:018:118:218:3
0Pristine4.16 ± 0.42 a12.12 ± 0.72 a*1.34 ± 0.37 a*1.13 ± 0.44 a6.26 ± 1.68 a0.97 ± 0.38 a15.55 ± 0.66 a58.46 ± 3.00 a
Contaminated2.82 ± 1.18 A15.34 ± 1.78 A0.42 ± 0.24 A3.46 ± 1.57 A0.94 ± 0.38 A0.00 ± 0.00 A15.64 ± 0.61 A61.37 ± 3.65 A
400Pristine4.07 ± 0.85 a12.78 ± 0.59 a*1.02 ± 0.41 a 0.00 ± 0.00 a5.35 ± 0.87 a1.74 ± 0.27 a15.79 ± 0.96 a59.21 ± 1.01 a
Contaminated3.20 ± 0.47 A14.92 ± 1.03 A0.96 ± 0.21 A5.08 ± 0.98 A1.71 ± 0.50 A0.00 ± 0.00 A16.49 ± 0.71 A57.65 ± 1.41 A
800Pristine4.66 ± 1.20 a16.03 ± 1.28 b*3.84 ± 0.86 b*2.47 ± 0.47 a1.36 ± 0.18 a0.23 ± 0.29 a14.06 ± 1.25 a57.25 ± 1.34 a
Contaminated4.01 ± 0.39 B13.77 ± 0.93 A1.59 ± 0.37 A9.00 ± 3.05 A2.17 ± 0.74 A0.00 ± 0.00 A16.41 ± 1.31 A53.05 ± 2.87 A
Table 2. Summary of fluorometric analysis parameters and their description.
JIP-Test
Rapid Light Curves (RLCs)
rETRRelative electron transport rate at each light intensity (rETR = QY × PAR × 0.5).
ETRmaxMaximum ETR after which photo-inhibition can be observed.
αPhotosynthetic efficiency, obtained from the initial slope of the RLC.
AreaCorresponds to the oxidized quinone pool size available for reduction and is a function of the area above the Kautsky plot.
NReaction center turnover rate.
SMCorresponds to the energy needed to close all reaction centers.
M0The net rate of PS II RC closure.
δR0PS I efficiency in reducing its electron acceptors.
PGGrouping probability, directly related to PS II antennae connectivity.
ABS/CSAbsorbed energy flux per cross-section.
TR/CSTrapped energy flux per cross-section
ET/CSElectron transport energy flux per cross-section.
DI/CSDissipated energy flux per cross-section.
RC/CSThe number of available reaction centers per cross-section.
Publisher’s Note: MDPI stays neutral with regard to jurisdictional claims in published maps and institutional affiliations.

