
Differences in Density Dependence among Tree Mycorrhizal Types Affect Tree Species Diversity and Relative Growth Rates
 ,
,  ,
,
Abstract
:1. Introduction
2. Methods
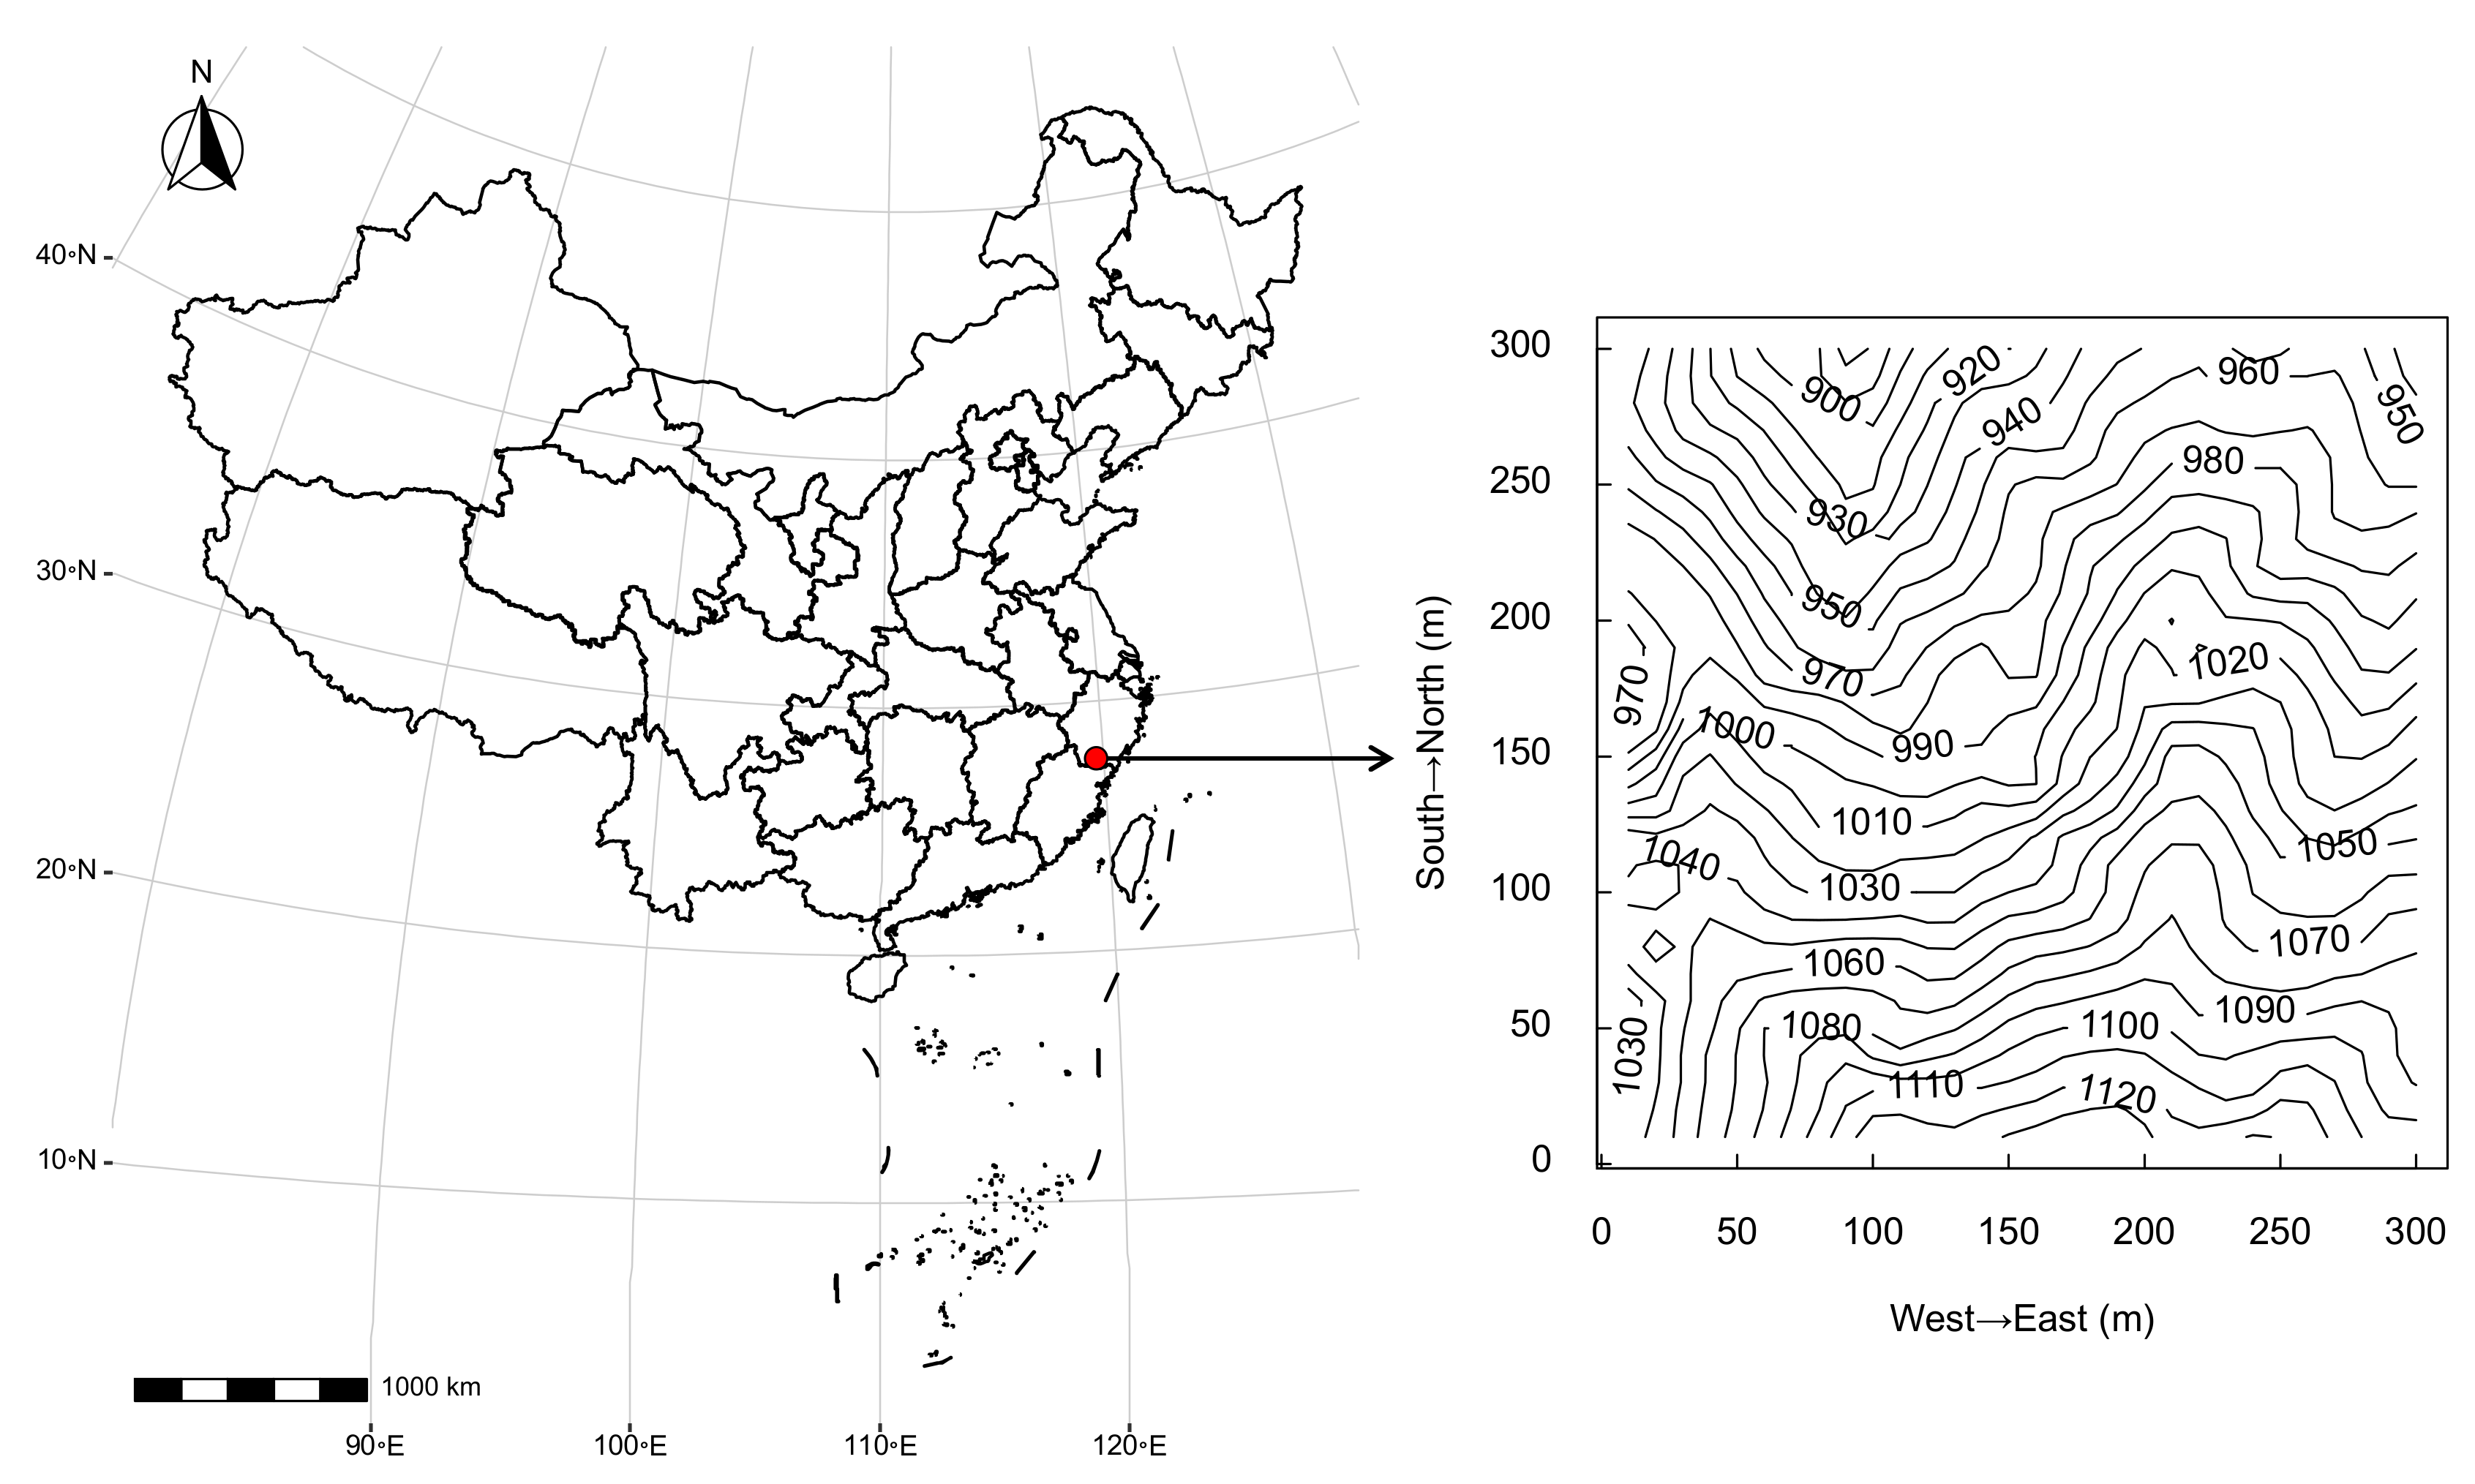
2.1. Study Site
2.2. Focal Species and Mycorrhizal Associations
2.3. Neighborhood Factors
2.4. Statistical Analyses
3. Results
3.1. Neighbor Effects on All Individuals across Tree Life Stages
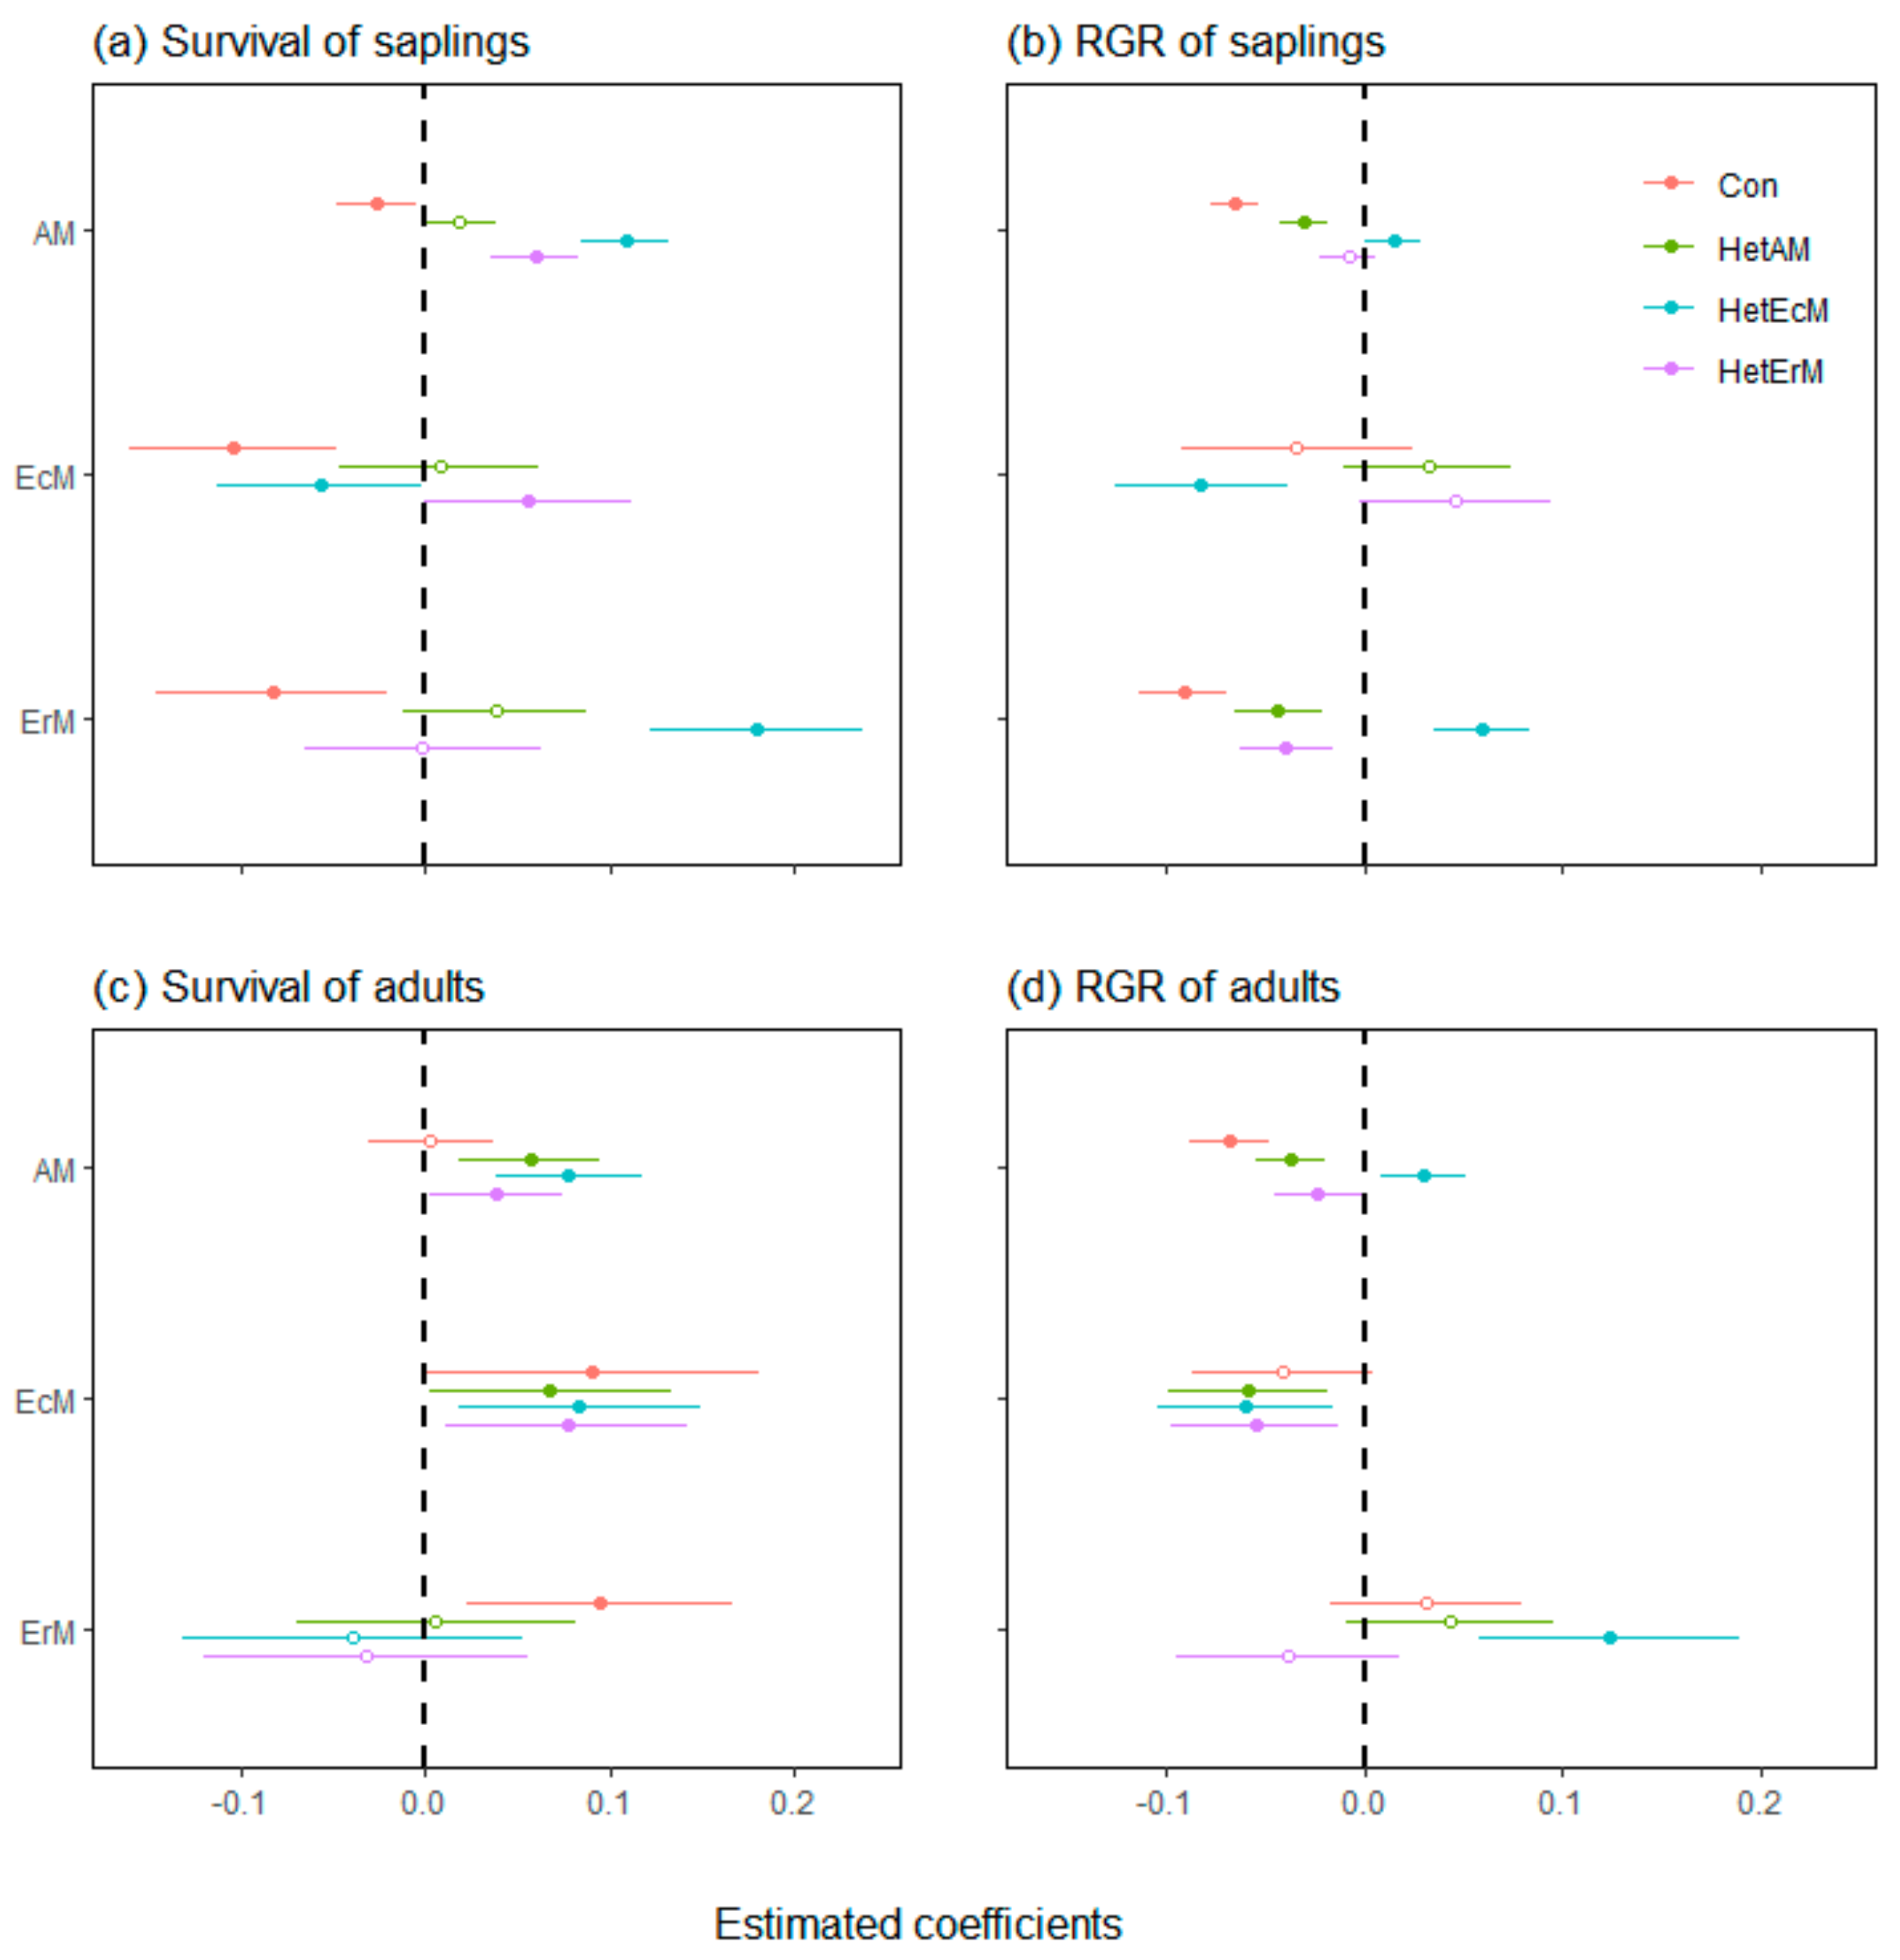
3.2. Neighbor Effects on Different Tree Mycorrhizal Types
3.3. Relationships between REA and Species Diversity and Average RGR
4. Discussion
4.1. The Strength of CNDD Varied among Tree Mycorrhizal Types
4.2. The Different Effects of Heterospecific Mycorrhizal Type Neighbors
4.3. The REA Affects Species Diversity and Forest Carbon Sink Rates
5. Conclusions
Supplementary Materials
Author Contributions
Funding
Institutional Review Board Statement
Informed Consent Statement
Data Availability Statement
Acknowledgments
Conflicts of Interest
References
- Pimm, S.L.; Jenkins, C.N.; Abell, R.; Brooks, T.M.; Gittleman, J.L.; Joppa, L.N.; Raven, P.H.; Roberts, C.M.; Sexton, J.O. The biodiversity of species and their rates of extinction, distribution, and protection. Science 2014, 344, 1246752. [Google Scholar] [CrossRef] [PubMed]
- Ripple, W.J.; Wolf, C.; Newsome, T.M.; Galetti, M.; Alamgir, M.; Crist, E.; Mahmoud, M.I.; Laurance, W.F.; Scientist, S.F.C. World scientists’ warning to humanity: A second notice. Bioscience 2017, 67, 1026–1028. [Google Scholar] [CrossRef]
- Thomas, C.D.; Cameron, A.; Green, R.E.; Bakkenes, M.; Beaumont, L.J.; Collingham, Y.C.; Erasmus, B.F.; De Siqueira, M.F.; Grainger, A.; Hannah, L. Extinction risk from climate change. Nature 2004, 427, 145–148. [Google Scholar] [CrossRef]
- Urban, M.C. Accelerating extinction risk from climate change. Science 2015, 348, 571–573. [Google Scholar] [CrossRef] [PubMed]
- Intergovernmental Panel on Climate Change. Climate Change 2013: The Physical Science Basis: Working Group I Contribution to the Fifth Assessment Report of the Intergovernmental Panel on Climate Change; Cambridge University Press: Cambridge, UK; New York, NY, USA, 2013. [Google Scholar]
- Bunker, D.E.; DeClerck, F.; Bradford, J.C.; Colwell, R.K.; Perfecto, I.; Phillips, O.L.; Sankaran, M.; Naeem, S. Species loss and aboveground carbon storage in a tropical forest. Science 2005, 310, 1029–1031. [Google Scholar] [CrossRef] [PubMed]
- Terrer, C.; Phillips, R.P.; Hungate, B.A.; Rosende, J.; Pett-Ridge, J.; Craig, M.E.; van Groenigen, K.J.; Keenan, T.F.; Sulman, B.N.; Stocker, B.D. A trade-off between plant and soil carbon storage under elevated CO2. Nature 2021, 591, 599–603. [Google Scholar] [CrossRef] [PubMed]
- Trisos, C.H.; Merow, C.; Pigot, A.L. The projected timing of abrupt ecological disruption from climate change. Nature 2020, 580, 496–501. [Google Scholar] [CrossRef]
- Ammer, C. Diversity and forest productivity in a changing climate. New Phytol. 2019, 221, 50–66. [Google Scholar] [CrossRef]
- Liang, J.; Crowther, T.W.; Picard, N.; Wiser, S.; Zhou, M.; Alberti, G.; Schulze, E.; McGuire, A.D.; Bozzato, F.; Pretzsch, H. Positive biodiversity-productivity relationship predominant in global forests. Science 2016, 354, f8957. [Google Scholar] [CrossRef]
- Liu, X.; Trogisch, S.; He, J.; Niklaus, P.A.; Bruelheide, H.; Tang, Z.; Erfmeier, A.; Scherer-Lorenzen, M.; Pietsch, K.A.; Yang, B. Tree species richness increases ecosystem carbon storage in subtropical forests. Proc. R. Soc. B 2018, 285, 20181240. [Google Scholar] [CrossRef] [Green Version]
- Chesson, P. Mechanisms of maintenance of species diversity. Annu. Rev. Ecol. Syst. 2000, 31, 343–366. [Google Scholar] [CrossRef]
- Chesson, P. Updates on mechanisms of maintenance of species diversity. J. Ecol. 2018, 106, 1773–1794. [Google Scholar] [CrossRef]
- HilleRisLambers, J.; Adler, P.B.; Harpole, W.S.; Levine, J.M.; Mayfield, M.M. Rethinking community assembly through the lens of coexistence theory. Annu. Rev. Ecol. Evol. Syst. 2012, 43, 2012. [Google Scholar] [CrossRef]
- Hubbell, S. The Unified Neutral Theory of Biodiversity and Biogeography; Princeton University Press: Princeton, NJ, USA, 2001. [Google Scholar]
- Vellend, M. The Theory of Ecological Communities (MPB-57); Princeton University Press: Princeton, NJ, USA, 2016. [Google Scholar]
- Comita, L.S.; Queenborough, S.A.; Murphy, S.J.; Eck, J.L.; Xu, K.; Krishnadas, M.; Beckman, N.; Zhu, Y. Testing predictions of the J anzen–C onnell hypothesis: A meta-analysis of experimental evidence for distance-and density-dependent seed and seedling survival. J. Ecol. 2014, 102, 845–856. [Google Scholar] [CrossRef] [PubMed]
- Connell, J.H. On the role of natural enemies in preventing competitive exclusion in some marine animals and in rain forest trees. In Dynamics of Populations; Centre for Agricultural Publishing and Documentation: Wageningen, The Netherlands, 1971; pp. 298–312. [Google Scholar]
- Janzen, D.H. Herbivores and the number of tree species in tropical forests. Am. Nat. 1970, 104, 501–528. [Google Scholar] [CrossRef]
- LaManna, J.A.; Mangan, S.A.; Myers, J.A. Conspecific negative density dependence and why its study should not be abandoned. Ecosphere 2021, 12, e3322. [Google Scholar] [CrossRef]
- Bagchi, R.; Gallery, R.E.; Gripenberg, S.; Gurr, S.J.; Narayan, L.; Addis, C.E.; Freckleton, R.P.; Lewis, O.T. Pathogens and insect herbivores drive rainforest plant diversity and composition. Nature 2014, 506, 85–88. [Google Scholar] [CrossRef]
- Crawford, K.M.; Bauer, J.T.; Comita, L.S.; Eppinga, M.B.; Johnson, D.J.; Mangan, S.A.; Queenborough, S.A.; Strand, A.E.; Suding, K.N.; Umbanhowar, J. When and where plant-soil feedback may promote plant coexistence: A meta-analysis. Ecol. Lett. 2019, 22, 1274–1284. [Google Scholar] [CrossRef]
- Johnson, D.J.; Clay, K.; Phillips, R.P. Mycorrhizal associations and the spatial structure of an old-growth forest community. Oecologia 2018, 186, 195–204. [Google Scholar] [CrossRef]
- Tedersoo, L.; Bahram, M.; Zobel, M. How mycorrhizal associations drive plant population and community biology. Science 2020, 367, a1223. [Google Scholar] [CrossRef]
- Ferlian, O.; Cesarz, S.; Craven, D.; Hines, J.; Barry, K.; Bruelheide, H.; Buscot, F.; Haider, S.; Heklau, H.; Herrmann, S.; et al. Mycorrhiza in tree diversity-ecosystem function relationships: Conceptual framework and experimental implementation. Ecosphere 2018, 9, e2226. [Google Scholar] [CrossRef]
- Smith, S.E.; Read, D.J. Mycorrhizal Symbiosis, 3rd ed.; Academic Press: London, UK, 2008. [Google Scholar]
- Van der Heijden, M.G.; Martin, F.M.; Selosse, M.A.; Sanders, I.R. Mycorrhizal ecology and evolution: The past, the present, and the future. New Phytol. 2015, 205, 1406–1423. [Google Scholar] [CrossRef] [PubMed]
- Genre, A.; Lanfranco, L.; Perotto, S.; Bonfante, P. Unique and common traits in mycorrhizal symbioses. Nat. Rev. Microbiol. 2020, 18, 649–660. [Google Scholar] [CrossRef] [PubMed]
- Chen, L.; Swenson, N.G.; Ji, N.; Mi, X.; Ren, H.; Guo, L.; Ma, K. Differential soil fungus accumulation and density dependence of trees in a subtropical forest. Science 2019, 366, 124–128. [Google Scholar] [CrossRef]
- Jiang, F.; Zhu, K.; Cadotte, M.W.; Jin, G. Tree mycorrhizal type mediates the strength of negative density dependence in temperate forests. J. Ecol. 2020, 108, 2601–2610. [Google Scholar] [CrossRef]
- Chapman, S.K.; Langley, J.A.; Hart, S.C.; Koch, G.W. Plants actively control nitrogen cycling: Uncorking the microbial bottleneck. New Phytol. 2006, 169, 27–34. [Google Scholar] [CrossRef] [PubMed]
- Dickie, I.A.; Koele, N.; Blum, J.D.; Gleason, J.D.; McGlone, M.S. Mycorrhizas in changing ecosystems. Botany 2014, 92, 149–160. [Google Scholar] [CrossRef]
- Phillips, R.P.; Brzostek, E.; Midgley, M.G. The mycorrhizal-associated nutrient economy: A new framework for predicting carbon–nutrient couplings in temperate forests. New Phytol. 2013, 199, 41–51. [Google Scholar] [CrossRef]
- Bennett, J.A.; Maherali, H.; Reinhart, K.O.; Lekberg, Y.; Hart, M.M.; Klironomos, J. Plant-soil feedbacks and mycorrhizal type influence temperate forest population dynamics. Science 2017, 355, 181–184. [Google Scholar] [CrossRef]
- Mao, Z.; Corrales, A.; Zhu, K.; Yuan, Z.; Lin, F.; Ye, J.; Hao, Z.; Wang, X. Tree mycorrhizal associations mediate soil fertility effects on forest community structure in a temperate forest. New Phytol. 2019, 223, 475–486. [Google Scholar] [CrossRef]
- Corrales, A.; Mangan, S.A.; Turner, B.L.; Dalling, J.W. An ectomycorrhizal nitrogen economy facilitates monodominance in a neotropical forest. Ecol. Lett. 2016, 19, 383–392. [Google Scholar] [CrossRef] [PubMed]
- McGuire, K.L. Common ectomycorrhizal networks may maintain monodominance in a tropical rain forest. Ecology 2007, 88, 567–574. [Google Scholar] [CrossRef]
- Qin, J.; Geng, Y.; Li, X.; Zhang, C.; Zhao, X.; von Gadow, K. Mycorrhizal type and soil pathogenic fungi mediate tree survival and density dependence in a temperate forest. For. Ecol. Manag. 2021, 496, 119459. [Google Scholar] [CrossRef]
- Peters, H.A. Neighbour-regulated mortality: The influence of positive and negative density dependence on tree populations in species-rich tropical forests. Ecol. Lett. 2003, 6, 757–765. [Google Scholar] [CrossRef]
- Wills, C.; Green, D.R. A Genetic Herd-Immunity Model for the Maintenance of MHC Polymorphism. Immunol. Rev. 1995, 143, 263–292. [Google Scholar] [CrossRef] [PubMed]
- Zhu, Y.; Comita, L.S.; Hubbell, S.P.; Ma, K. Conspecific and phylogenetic density-dependent survival differs across life stages in a tropical forest. J. Ecol. 2015, 103, 957–966. [Google Scholar] [CrossRef]
- Lambers, H.; Albornoz, F.; Kotula, L.; Laliberté, E.; Ranathunge, K.; Teste, F.P.; Zemunik, G. How belowground interactions contribute to the coexistence of mycorrhizal and non-mycorrhizal species in severely phosphorus-impoverished hyperdiverse ecosystems. Plant Soil 2018, 424, 11–33. [Google Scholar] [CrossRef]
- Liang, M.; Johnson, D.; Burslem, D.F.; Yu, S.; Fang, M.; Taylor, J.D.; Taylor, A.F.; Helgason, T.; Liu, X. Soil fungal networks maintain local dominance of ectomycorrhizal trees. Nat. Commun. 2020, 11, 2636. [Google Scholar] [CrossRef]
- Zhong, L.; Chang-Yang, C.; Lu, P.; Gu, X.; Lei, Z.; Cai, Y.; Zheng, F.; Sun, I.; Yu, M. Community structure and species composition of the secondary evergreen broad-leaved forest: The analyses for a 9 ha forest dynamics plot in Wuyanling Nature Reserve, Zhejiang Province, East China (in Chinese). Biodivers. Sci. 2015, 23, 619. [Google Scholar] [CrossRef]
- Anderson Teixeira, K.J.; Davies, S.J.; Bennett, A.C.; Gonzalez Akre, E.B.; Muller Landau, H.C.; Joseph Wright, S.; Abu Salim, K.; Almeyda Zambrano, A.M.; Alonso, A.; Baltzer, J.L. CTFS-Forest GEO: A worldwide network monitoring forests in an era of global change. Global Chang. Biol. 2015, 21, 528–549. [Google Scholar] [CrossRef] [Green Version]
- LaManna, J.A.; Walton, M.L.; Turner, B.L.; Myers, J.A. Negative density dependence is stronger in resource-rich environments and diversifies communities when stronger for common but not rare species. Ecol. Lett. 2016, 19, 657–667. [Google Scholar] [CrossRef] [PubMed]
- Liu, J.; Zhong, Y.; Zhong, L.; Wei, B.; Zheng, S.; Xie, Y.; Jin, Y.; Yu, M. The asymmetric relationships of the distribution of conspecific saplings and adults in forest fragments. J. Plant Ecol. 2020, 13, 398–404. [Google Scholar] [CrossRef]
- Pu, X.; Jin, G. Conspecific and phylogenetic density-dependent survival differs across life stages in two temperate old-growth forests in Northeast China. For. Ecol. Manag. 2018, 424, 95–104. [Google Scholar] [CrossRef]
- Editorial Committee of the Flora of China. Flora of China; Beijing Science Press: Beijing, China, 2018. (In Chinese) [Google Scholar]
- Editorial Committee of Flora of Zhejiang. Flora of Zhejiang; Zhejiang Science Technology Press: Hangzhou, China, 1993. (In Chinese) [Google Scholar]
- Soudzilovskaia, N.A.; Vaessen, S.; Barcelo, M.; He, J.; Rahimlou, S.; Abarenkov, K.; Brundrett, M.C.; Gomes, S.I.; Merckx, V.; Tedersoo, L. FungalRoot: Global online database of plant mycorrhizal associations. New Phytol. 2020, 227, 955–966. [Google Scholar] [CrossRef]
- Keller, A.B.; Phillips, R.P. Leaf litter decay rates differ between mycorrhizal groups in temperate, but not tropical, forests. New Phytol. 2019, 222, 556–564. [Google Scholar] [CrossRef]
- Detto, M.; Visser, M.D.; Wright, S.J.; Pacala, S.W. Bias in the detection of negative density dependence in plant communities. Ecol. Lett. 2019, 22, 1923–1939. [Google Scholar] [CrossRef]
- Bolker, B.M.; Brooks, M.E.; Clark, C.J.; Geange, S.W.; Poulsen, J.R.; Stevens, M.H.H.; White, J.S. Generalized linear mixed models: A practical guide for ecology and evolution. Trends Ecol. Evol. 2009, 24, 127–135. [Google Scholar] [CrossRef]
- Zuur, A.F.; Ieno, E.N.; Walker, N.J.; Saveliev, A.A.; Smith, G.M. Mixed Effects Models and Extensions in Ecology with R; Springer: New York, NY, USA, 2009; Volume 574. [Google Scholar]
- Yao, J.; Bachelot, B.; Meng, L.; Qin, J.; Zhao, X.; Zhang, C. Abiotic niche partitioning and negative density dependence across multiple life stages in a temperate forest in northeastern China. J. Ecol. 2020, 108, 1299–1310. [Google Scholar] [CrossRef]
- Chen, L.; Comita, L.S.; Wright, S.J.; Swenson, N.G.; Zimmerman, J.K.; Mi, X.; Hao, Z.; Ye, W.; Hubbell, S.P.; Kress, W.J. Forest tree neighborhoods are structured more by negative conspecific density dependence than by interactions among closely related species. Ecography 2018, 41, 1114–1123. [Google Scholar] [CrossRef]
- Lu, M.; Du, H.; Song, T.; Peng, W.; Su, L.; Zhang, H.; Zeng, Z.; Wang, K.; Zeng, F. Effects of density dependence in an evergreen-deciduous broadleaf karst forest in southwest China. For. Ecol. Manag. 2021, 490, 119142. [Google Scholar] [CrossRef]
- May, F.; Wiegand, T.; Huth, A.; Chase, J.M. Scale-dependent effects of conspecific negative density dependence and immigration on biodiversity maintenance. Oikos 2020, 129, 1072–1083. [Google Scholar] [CrossRef]
- Burnham, K.P.; Anderson, D.R. Model Selection and Inference: A Practical Information Theoretic Approach; Springer Science & Business Media: New York, NY, USA, 2002. [Google Scholar]
- Crawley, M.J. The R Book, 2nd ed.; John Wiley & Sons: Chichester, UK, 2012. [Google Scholar]
- R Core Team. R: A Language and Environment for Statistical Computing. Available online: https://www.R-project.org/ (accessed on 10 March 2022).
- Bates, D.; Mächler, M.; Bolker, B.; Walker, S. Fitting Linear Mixed-Effects Models Using lme4. J. Stat. Softw. 2015, 67, 1–48. [Google Scholar] [CrossRef]
- Kuznetsova, A.; Brockhoff, P.B.; Christensen, R.H. LmerTest package: Tests in linear mixed effects models. J. Stat. Softw. 2017, 82, 1–26. [Google Scholar] [CrossRef]
- Pinheiro, J.; Bates, D.; R Core Team. Nlme: Linear and Nonlinear Mixed Effects Models. R package Version 3.1-157. Available online: https://CRAN.R-project.org/package=nlme (accessed on 15 June 2022).
- Zhu, Y.; Queenborough, S.A.; Condit, R.; Hubbell, S.P.; Ma, K.P.; Comita, L.S. Density-dependent survival varies with species life-history strategy in a tropical forest. Ecol. Lett. 2018, 21, 506–515. [Google Scholar] [CrossRef] [PubMed]
- Bennett, J.A.; Klironomos, J. Mechanisms of plant–soil feedback: Interactions among biotic and abiotic drivers. New Phytol. 2019, 222, 91–96. [Google Scholar] [CrossRef] [PubMed]
- Jia, S.; Wang, X.; Yuan, Z.; Lin, F.; Ye, J.; Lin, G.; Hao, Z.; Bagchi, R. Tree species traits affect which natural enemies drive the Janzen-Connell effect in a temperate forest. Nat. Commun. 2020, 11, 286. [Google Scholar] [CrossRef]
- Jiang, F.; Lutz, J.A.; Guo, Q.; Hao, Z.; Wang, X.; Gilbert, G.S.; Mao, Z.; Orwig, D.A.; Parker, G.G.; Sang, W. Mycorrhizal type influences plant density dependence and species richness across 15 temperate forests. Ecology 2021, 102, e3259. [Google Scholar] [CrossRef]
- Liu, Y.; He, F. Incorporating the disease triangle framework for testing the effect of soil-borne pathogens on tree species diversity. Funct. Ecol. 2019, 33, 1211–1222. [Google Scholar] [CrossRef]
- Schroeder, J.W.; Dobson, A.; Mangan, S.A.; Petticord, D.F.; Herre, E.A. Mutualist and pathogen traits interact to affect plant community structure in a spatially explicit model. Nat. Commun. 2020, 11, 2204. [Google Scholar] [CrossRef]
- Van der Heijden, M.G.; Horton, T.R. Socialism in soil? The importance of mycorrhizal fungal networks for facilitation in natural ecosystems. J. Ecol. 2009, 97, 1139–1150. [Google Scholar] [CrossRef]
- Brown, A.J.; Payne, C.J.; White, P.S.; Peet, R.K. Shade tolerance and mycorrhizal type may influence sapling susceptibility to conspecific negative density dependence. J. Ecol. 2020, 108, 325–336. [Google Scholar] [CrossRef]
- Marx, D. Ectomycorrhizae as Biological Deterrents to Pathogenic Root Infections. Annu. Rev. Phytopathol. 1972, 10, 429–454. [Google Scholar] [CrossRef] [PubMed]
- Sasaki, T.; Konno, M.; Hasegawa, Y.; Imaji, A.; Terabaru, M.; Nakamura, R.; Ohira, N.; Matsukura, K.; Seiwa, K. Role of mycorrhizal associations in tree spatial distribution patterns based on size class in an old-growth forest. Oecologia 2019, 189, 971–980. [Google Scholar] [CrossRef] [PubMed]
- Allsopp, N.; Stock, W.D. Density dependent interactions between VA mycorrhizal fungi and even-aged seedlings of two perennial Fabaceae species. Oecologia 1992, 91, 281–287. [Google Scholar] [CrossRef] [PubMed]
- Zhang, H.Y.; Lü, X.T.; Hartmann, H.; Keller, A.; Han, X.G.; Trumbore, S.; Phillips, R.P. Foliar nutrient resorption differs between arbuscular mycorrhizal and ectomycorrhizal trees at local and global scales. Global Ecol. Biogeogr. 2018, 27, 875–885. [Google Scholar] [CrossRef]
- Bennett, A.E.; Groten, K. The Costs and Benefits of Plant–Arbuscular Mycorrhizal Fungal Interactions. Annu. Rev. Plant Biol. 2022, 73, 649–672. [Google Scholar] [CrossRef]
- Fitter, A.H. Costs and benefits of mycorrhizas: Implications for functioning under natural conditions. Experientia 1991, 47, 350–355. [Google Scholar] [CrossRef]
- Genney, D.R.; Hartley, S.H.; Alexander, I.J. Arbuscular mycorrhizal colonization increases with host density in a heathland community. New Phytol. 2001, 152, 355–363. [Google Scholar] [CrossRef]
- Mangan, S.A.; Schnitzer, S.A.; Herre, E.A.; Mack, K.M.; Valencia, M.C.; Sanchez, E.I.; Bever, J.D. Negative plant–soil feedback predicts tree-species relative abundance in a tropical forest. Nature 2010, 466, 752–755. [Google Scholar] [CrossRef]
- Carteron, A.; Vellend, M.; Laliberté, E. Mycorrhizal dominance reduces local tree species diversity across US forests. Nat. Ecol. Evol. 2022, 6, 370–374. [Google Scholar] [CrossRef]


| Mycorrhizal Types | Richness | No. Saplings | No. Adults | Survival Rate | Relative Abundance | Relative Basal Area |
|---|---|---|---|---|---|---|
| AM | 146 | 21,623 | 9932 | 85.26% | 68.78% | 49.06% |
| EcM | 24 | 2721 | 3104 | 84.22% | 12.70% | 44.34% |
| ErM | 9 | 6667 | 1836 | 92.07% | 18.53% | 6.60% |
Publisher’s Note: MDPI stays neutral with regard to jurisdictional claims in published maps and institutional affiliations. |
© 2022 by the authors. Licensee MDPI, Basel, Switzerland. This article is an open access article distributed under the terms and conditions of the Creative Commons Attribution (CC BY) license (https://creativecommons.org/licenses/by/4.0/).
Share and Cite
Wei, B.; Zhong, L.; Liu, J.; Zheng, F.; Jin, Y.; Xie, Y.; Lei, Z.; Shen, G.; Yu, M. Differences in Density Dependence among Tree Mycorrhizal Types Affect Tree Species Diversity and Relative Growth Rates. Plants 2022, 11, 2340. https://doi.org/10.3390/plants11182340
Wei B, Zhong L, Liu J, Zheng F, Jin Y, Xie Y, Lei Z, Shen G, Yu M. Differences in Density Dependence among Tree Mycorrhizal Types Affect Tree Species Diversity and Relative Growth Rates. Plants. 2022; 11(18):2340. https://doi.org/10.3390/plants11182340
Chicago/Turabian StyleWei, Boliang, Lei Zhong, Jinliang Liu, Fangdong Zheng, Yi Jin, Yuchu Xie, Zupei Lei, Guochun Shen, and Mingjian Yu. 2022. "Differences in Density Dependence among Tree Mycorrhizal Types Affect Tree Species Diversity and Relative Growth Rates" Plants 11, no. 18: 2340. https://doi.org/10.3390/plants11182340