Article

Machine Learning Analysis of the Impact of Silver Nitrate and Silver Nanoparticles on Wheat (Triticum aestivum L.): Callus Induction, Plant Regeneration, and DNA Methylation

1
Department of Field Crops, Faculty of Agriculture, Necmettin Erbakan University, Konya 42310, Türkiye
2
Department of Field Crops, Faculty of Agriculture, Ataturk University, Erzurum 25240, Türkiye
3
Department of Agricultural Biotechnology, Faculty of Agriculture, Igdır University, Igdir 76000, Türkiye
4
Department of Agricultural Biotechnology, Faculty of Agriculture, Ataturk University, Erzurum 25240, Türkiye
5
Department of Molecular Biology and Genetics, Faculty of Science, Van Yüzüncü Yıl University, Van 65080, Türkiye
6
Department of Geoecology and Geoinformation, Institute of Biology and Earth Sciences, Pomeranian University in Słupsk, 27 Partyzantów St., 76-200 Słupsk, Poland
7
Department of Agronomy, Poznań University of Life Sciences, Dojazd 11, 60-632 Poznań, Poland
8
Department of Biosystems Engineering, Faculty of Environmental and Mechanical Engineering, Poznań University of Life Sciences, Wojska Polskiego 50, 60-627 Poznań, Poland
*
Authors to whom correspondence should be addressed.
Plants 2023, 12(24), 4151; https://doi.org/10.3390/plants12244151
Submission received: 9 October 2023 / Revised: 28 November 2023 / Accepted: 29 November 2023 / Published: 13 December 2023

Abstract

:
The objective of this study was to comprehend the efficiency of wheat regeneration, callus induction, and DNA methylation through the application of mathematical frameworks and artificial intelligence (AI)-based models. This research aimed to explore the impact of treatments with AgNO3 and Ag-NPs on various parameters. The study specifically concentrated on analyzing RAPD profiles and modeling regeneration parameters. The treatments and molecular findings served as input variables in the modeling process. It included the use of AgNO3 and Ag-NPs at different concentrations (0, 2, 4, 6, and 8 mg L−1). The in vitro and epigenetic characteristics were analyzed using several machine learning (ML) methods, including support vector machine (SVM), random forest (RF), extreme gradient boosting (XGBoost), k-nearest neighbor classifier (KNN), and Gaussian processes classifier (GP) methods. This study’s results revealed that the highest values for callus induction (CI%) and embryogenic callus induction (EC%) occurred at a concentration of 2 mg L−1 of Ag-NPs. Additionally, the regeneration efficiency (RE) parameter reached its peak at a concentration of 8 mg L−1 of AgNO3. Taking an epigenetic approach, AgNO3 at a concentration of 2 mg L−1 demonstrated the highest levels of genomic template stability (GTS), at 79.3%. There was a positive correlation seen between increased levels of AgNO3 and DNA hypermethylation. Conversely, elevated levels of Ag-NPs were associated with DNA hypomethylation. The models were used to estimate the relationships between the input elements, including treatments, concentration, GTS rates, and Msp I and Hpa II polymorphism, and the in vitro output parameters. The findings suggested that the XGBoost model exhibited superior performance scores for callus induction (CI), as evidenced by an R2 score of 51.5%, which explained the variances. Additionally, the RF model explained 71.9% of the total variance and showed superior efficacy in terms of EC%. Furthermore, the GP model, which provided the most robust statistics for RE, yielded an R2 value of 52.5%, signifying its ability to account for a substantial portion of the total variance present in the data. This study exemplifies the application of various machine learning models in the cultivation of mature wheat embryos under the influence of treatments and concentrations involving AgNO3 and Ag-NPs.

1. Introduction

Plant tissue culture, also referred to as in vitro culture, is a method of cultivating plant cells or plant parts in a controlled, sterile, artificial environment on a nutrient medium. It holds significant importance in various realms of plant biology, encompassing embryogenesis, morphogenesis, cytology, nutrition, germplasm conservation, extensive clonal propagation, genetic engineering, pathology, and the generation of pathogen-free plants and valuable metabolites [1]. In vitro plant culture is influenced by factors such as genotype, the composition of the culture medium, and the presence of plant growth regulators.
Plant growth regulators (PGRs) play a crucial role in governing growth, differentiation, shoot initiation, proliferation, callus induction, embryogenesis, and root development in in vitro studies. The five classes of PGRs that regulate plant growth are auxins, gibberellins, cytokinins, ethylene, and abscisic acid. Each category primarily includes both synthetic and naturally occurring compounds. Calluses and plantlets, generated through plant tissue and cell culture, contribute to the release of ethylene. Ethylene, a plant growth regulator, is known to influence morphogenesis in plant culture [2,3,4]. Prior research has shown that ethylene has the potential to hinder shoot rejuvenation, callus growth, and somatic embryogenesis [5,6]. Closed vessels are utilized in tissue culture to prevent contamination. However, in certain instances, this practice can lead to atypical plant development due to the accumulation of gases, such as ethylene, within the vessels used for tissue culture. Researchers have sought to mitigate the negative impact of ethylene on the regeneration process in two ways: by removing the gas from the air through mechanical ventilation, and by employing chemical substances to either limit its production or impede the hormone’s function [7,8]. The incorporation of ethylene antagonists in the culture media distinctly influences the concentration of ACC (1-amino cyclopropane-1-carboxylic acid), leading to consequential alterations in ethylene levels [9]. Furthermore, the introduction of silver ions into the culture medium, specifically in the form of silver nitrate (AgNO3), which acts as an inhibitor of ethylene, has been demonstrated as a successful method for enhancing the regeneration process and subsequently increasing the likelihood of transformation. This approach has been observed to have a significant impact on somatic embryogenesis and the development of shoots in various plant tissues under in vitro conditions [2,10]. Various perspectives and examples of experimental evidence have been presented to explain how silver ions can obstruct ethylene receptors, rendering plants resistant to ethylene [2,5,11].
Nanotechnology, a branch of science, involves the manipulation of materials at the atomic level, typically at a scale smaller than 100 nanometers, to enhance their functionality [12]. Its applications span various fields, including the degradation and distribution of pesticides, the development of nanosensors, the utilization of micronutrients in agriculture, and plant protection and nutrition [13]. Nanotechnology offers viable approaches for safeguarding soil health and conditions by reducing agricultural waste and mitigating environmental contamination [14,15]. Nanoparticles (NPs) have the potential to significantly enhance the functioning of agriculture [14]. Due to their high surface area-to-volume ratio, nanoparticles are highly biologically active [16].
These characteristics endow nanotechnology with immense commercial potential, but they also underscore various health and environmental concerns [17]. Nanoparticles (NPs) have demonstrated effectiveness in enhancing the regeneration, morphological development, morpho-physiology, and biochemical parameters of in vitro-produced plantlets [18]. Silver nanoparticles (Ag-NPs) have garnered significant attention, owing to their well-established antimicrobial properties. These properties have been effectively utilized in various medical applications, devices, textiles, clothing, and food packaging, as well as healthcare and household products [19]. In the pursuit of enhancing the quality of tissue-cultured plantlets through various means, silver nanoparticles (Ag-NPs) have been a subject of intense research. Recent studies show that Ag-NPs have been employed for various applications, including reducing microbial contamination [20], inducing somaclonal variation [21], enhancing proliferation rates [22], and in vitro bioactive chemical generation [23]. Therefore, this study represents an initial endeavor to examine the influence of AgNO3 and Ag-NP treatments on in vitro wheat culture, with a specific emphasis on callus induction and regeneration efficiency. Wheat, a paramount crop in temperate regions, holds the distinction of occupying the largest cultivable area globally [24]. Hence, studies on wheat continue to receive significant attention due to its paramount importance in human nutrition, its adaptability to a wide range of climates, and its abundance of essential nutrients [25].
Several studies have been conducted to investigate the effects of nanoparticles (NPs) on cytosine methylation in human cell DNA [26,27,28,29]. However, limited research exists on the epigenetic modifications induced in plant DNA by nanomaterials. In recent studies, it has been proposed that nanoparticles have the potential to induce epigenetic alterations in plants, such as cytosine DNA methylation and histone modification [30,31,32,33,34]. DNA meth-ylation occurs when a methyl group from S-adenosyl-L-methionine is transferred to the carbon five position of cytosine, resulting in 5-methylcytosine (5-meC) [35]. Gene expres-sion patterns can be influenced by DNA methylation, miRNA (microRNA), and retrotransposon activities, all of which have the potential to contribute to genomic insta-bility [36]. Recently, alterations in DNA methylation have been detected using various methods, including coupled restriction enzyme digestion–random amplification (CRED-RA) [37] and coupled restriction enzyme digestion–inter-primer binding site (CRED-iPBS) [38] methylation-sensitive amplified fragment length polymorphism (met-AFLP) [39], DArTseqMet [40], methylRAD [41], methyl-seq [42], and semiquantitative MSAP [43]. The objective of our study was to investigate alterations in cytosine methyla-tion in wheat when exposed to silver nitrate and Ag-NPs in an in vitro condition using the CRED-RA technique.
Research on plant tissue culture explores the impact of various input parameters, whether singular or numerous, on the regenerative capacity of targeted plant species [44]. In most cases, traditional statistical methods have been employed to analyze and interpret the output variables. These methodologies often utilize variance analysis and linear regression models to determine the degree of correlation between independent input factors and dependent output variables [45,46]. Complex factors and non-linear features present some of the most significant challenges for researchers working in the field of plant tissue culture [47,48]. Addressing these challenges may be achieved through the utilization of effective high-throughput technologies, such as machine learning (ML) models. These models enable the examination and enhancement of output variables in relation to input factors [49,50]. The utilization of various machine learning algorithm models in the field of plant biotechnology is a growing and emerging area of research. This area focuses on the prediction and optimization of variables in complex biological systems [51,52]. Ma-chine learning (ML) is a well-recognized framework within the field of data science that addresses complex difficulties across various scientific fields. This methodology surpass-es traditional one-way analyses, enabling a more nuanced understanding and accurate interpretation of findings [53,54]. The application of machine learning has demonstrated favorable results in various areas of plant science, including in vitro germination [49,51], regeneration studies [49,55], and mutagenesis [56].
The application of mathematical frameworks and artificial intelligence (AI)-based models under in vitro conditions is still notably limited to wheat. The goal is to understand the complex dynamics of callus induction, regeneration efficiency, and the DNA methylation process. Within the framework of this specific scenario, the goals of this research were threefold: (1) examining the effects of AgNO3 and Ag-NP treatments on wheat in vitro regeneration; (2) identifying RAPD profiles and DNA methylation changes among experimental groups; and (3) modeling the observed in vitro regeneration parameters of wheat using all complex inputs and formulating the predicted results.

2. Results

2.1. Effects of Silver Nitrate and Silver Nanoparticles on In Vitro Parameters
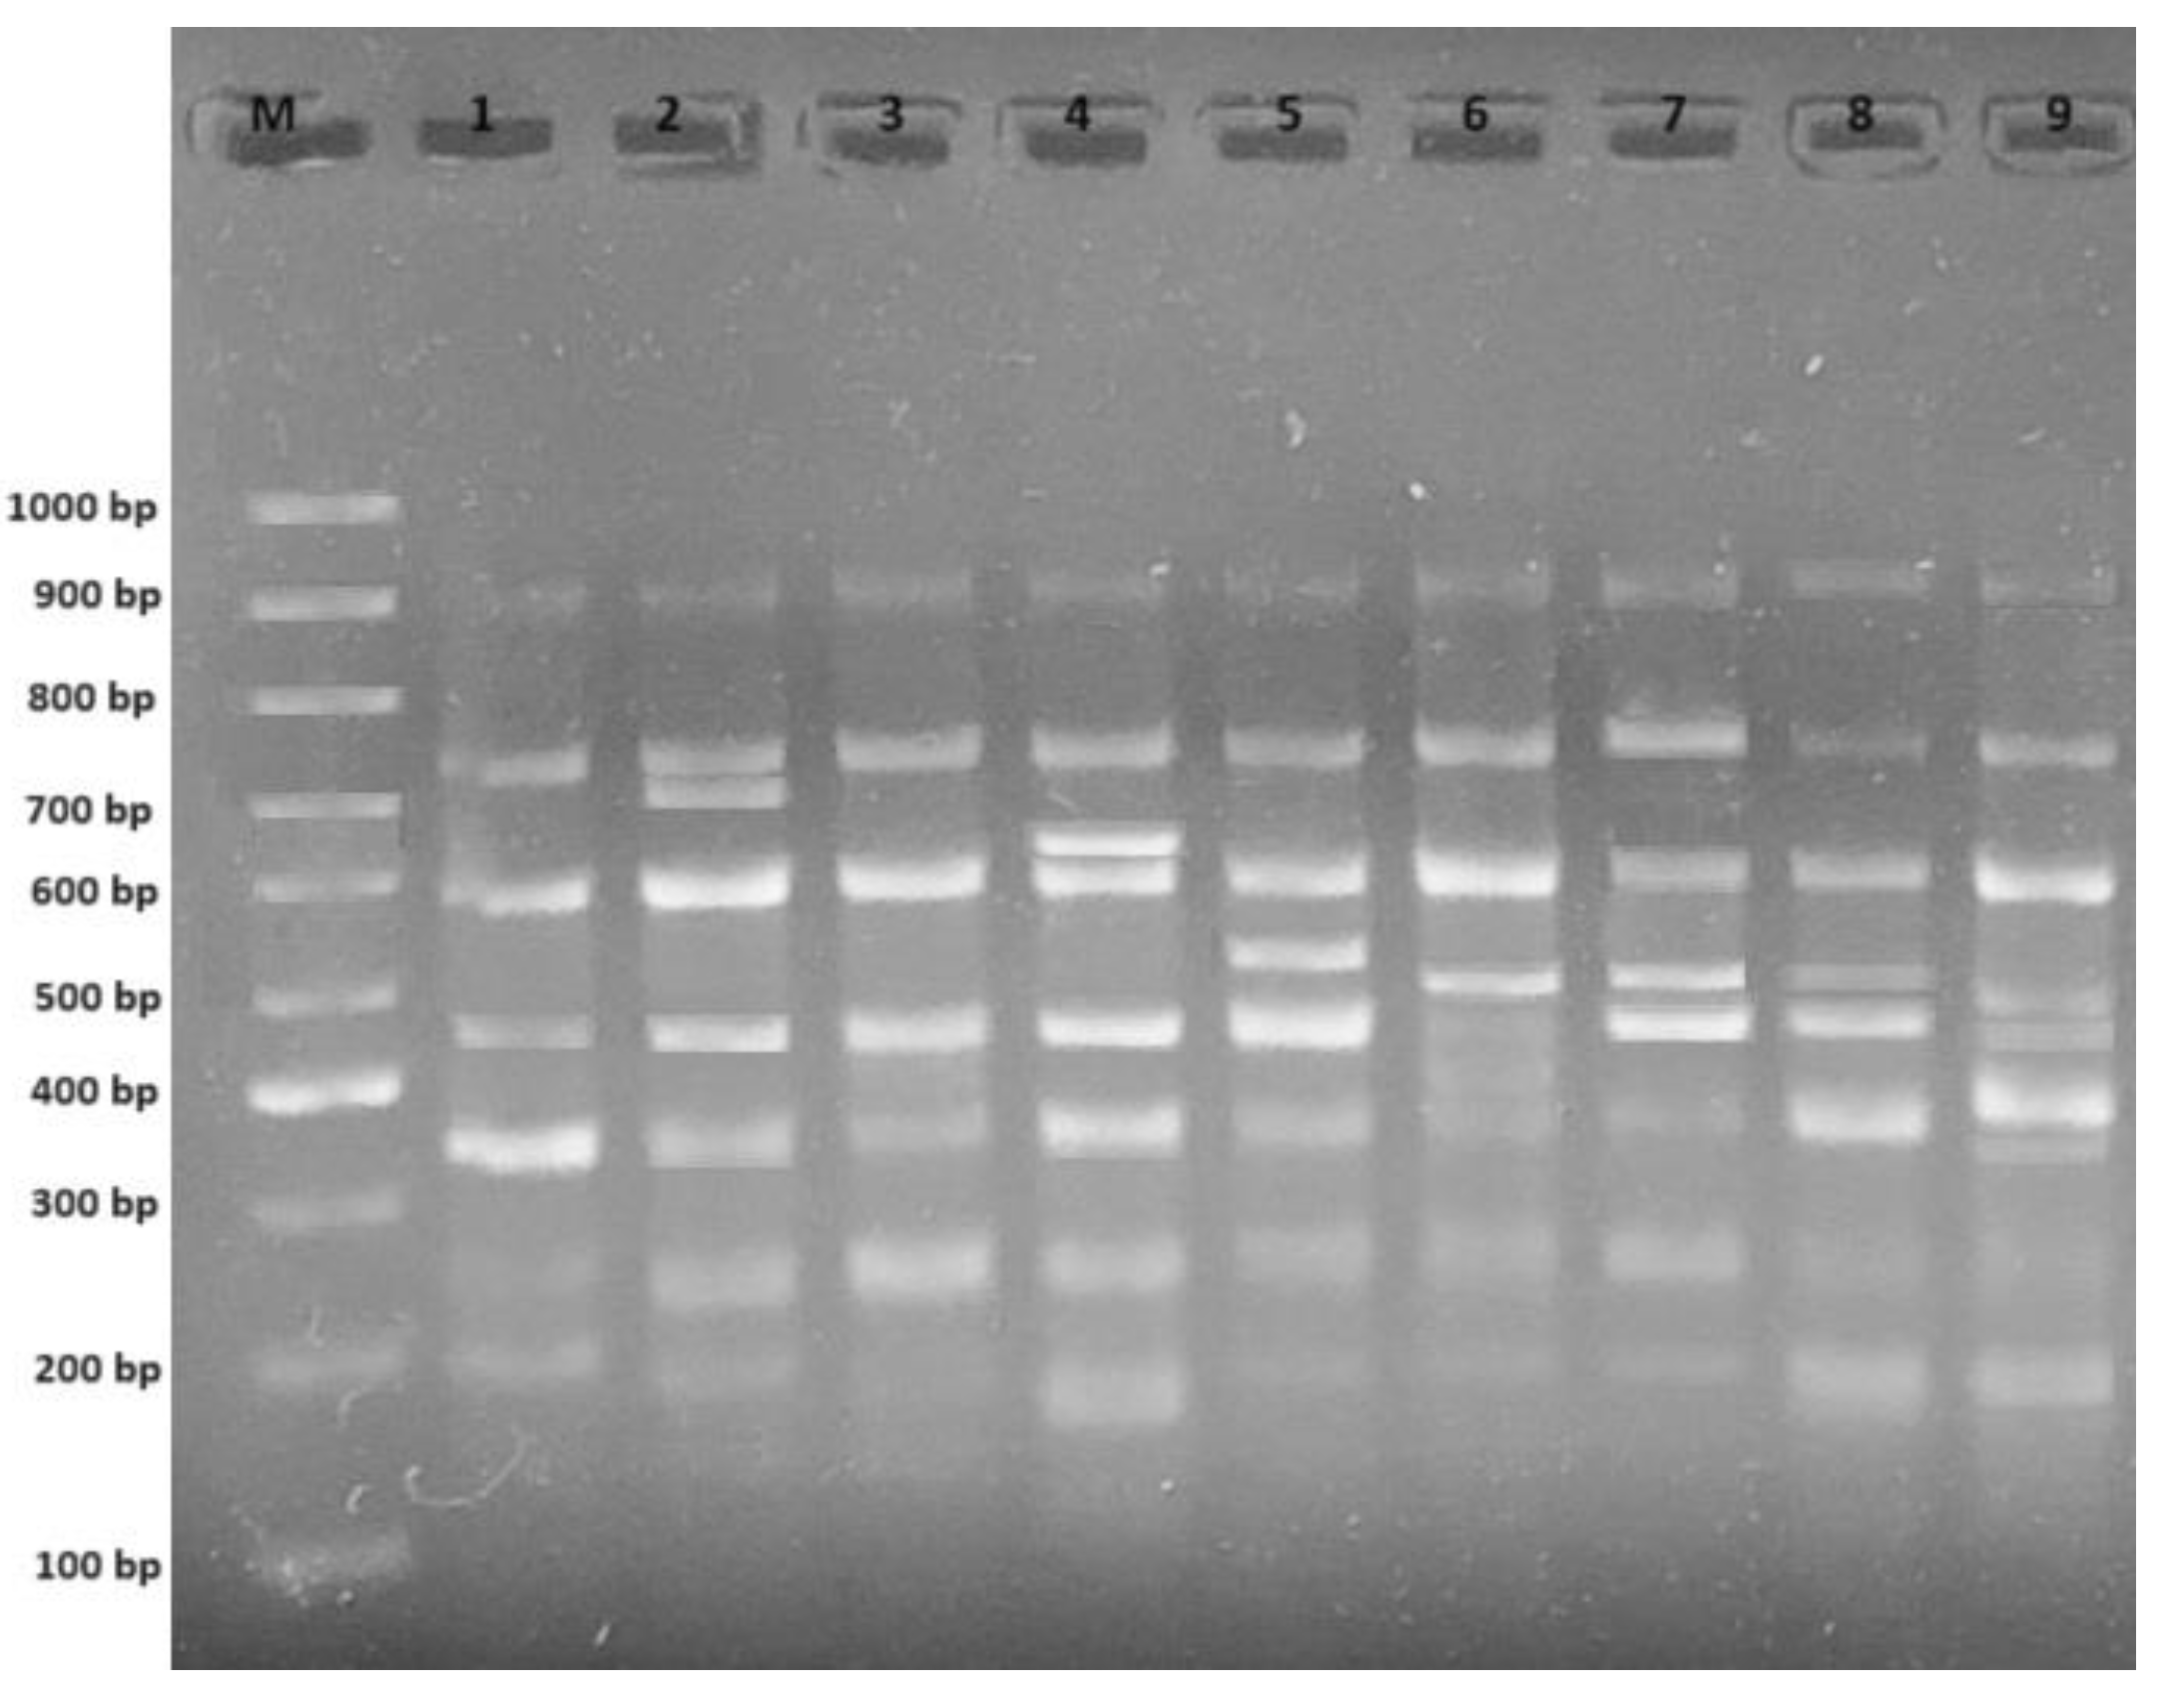
The analysis of variance demonstrated that the types of treatment (AgNO3 and Ag-NPs) were not significant for the whole set of investigated parameters (CI, EC, and RE). Among the experimental groups, it was determined that the concentrations of AgNO3 and Ag-NPs did not provide statistically significant results for CI (Table 1). However, these concentrations did exhibit statistical significance for EC (p ≤ 0.01) and RE (p ≤ 0.05). Based on the obtained variance result pertaining to the interaction between the treatment and concentration, it was concluded that a statistically significant difference was observed across all attributes (p ≤ 0.001) (Table 1).
The MS medium with 2 mg L−1 Ag-NPs had the maximum EC rate, which was 95.00%, while the MS medium with 4 mg L−1 AgNO3 had the lowest value, which was 60%. The EC ratios obtained from MS medium with 2 mg L−1 Ag-NPs and 4 mg L−1 AgNO3 concentrations ranged from 85.0% to 37.5%, representing the greatest and lowest values, respectively. The MS medium containing 8 mg L−1 AgNO3 exhibited the highest recorded RE value of 0.83, whilst the MS medium containing 4 mg L−1 AgNO3 had the lowest recorded value of 0.13 (Table 1, Figure 1 and Figure 2).
Analysis revealed that the EC parameter exhibited the maximum value of 77.50% at an average concentration of 2 mg L−1, while the RE parameter showed the highest value of 0.69 at an average concentration of 6 mg L−1. The results of this study demonstrate that varying concentrations of Ag-NPs have a notable influence on the development of plants, with certain concentrations of Ag-NPs exhibiting the potential to improve plant growth.

2.2. RAPD Analysis

A RAPD analysis was conducted to assess the polymorphic effect of simultaneous treatment with varied concentrations of AgNO3 and Ag-NPs on wheat genomic DNA (Figure 3). An evaluation of the number of polymorphic bands generated by the applied primers was conducted by comparing control plants to the plants treated with AgNO3 and Ag-NPs (Table 2). The control exhibited a total of 29 bands, with the OPW-6 marker generating the highest number of bands (seven bands), and the OPH-17 marker generating the lowest number of bands (one band). The polymorphic bands ranged from 207 base pairs (bp) to 812 bp (for OPH-17 and OPW-4, respectively). Furthermore, the experimental group exposed to 8 mg L−1 AgNO3 displayed the smallest molecular size (207 bp), while the experimental groups exposed to 4 mg L−1 Ag-NPs and 6 mg L−1 Ag-NPs showed the largest molecular size (812 bp). Following the administration of varying doses, the experiments treated with AgNO3 and Ag-NPs exhibited significant alterations in their RAPD profiles. In comparison to the control group, the experimental groups showed a significant net increase of 51 newly created bands and a notable net loss of 19 pre-existing bands (Figure 4A). The observed polymorphism rates varied between 20.7% (at a concentration of 2 mg L−1 AgNO3) and 44.8% (at a concentration of 8 mg L−1 Ag-NPs) (Figure 4B). A measurement of alterations in the RAPD profiles was conducted using the genomic template stability (GTS) percentage. The treatment with a concentration of 2 mg L−1 AgNO3 exhibited the greatest GTS value (79.3%), while the treatment with a concentration of 8 mg L−1 Ag-NPs showed the lowest value (55.2%). The GTS value was at its lowest during the treatment involving AgNO3 at a concentration of 6 mg L−1, as well as during the treatment using Ag-NPs at a concentration of 8 mg L−1 (Figure 4C).

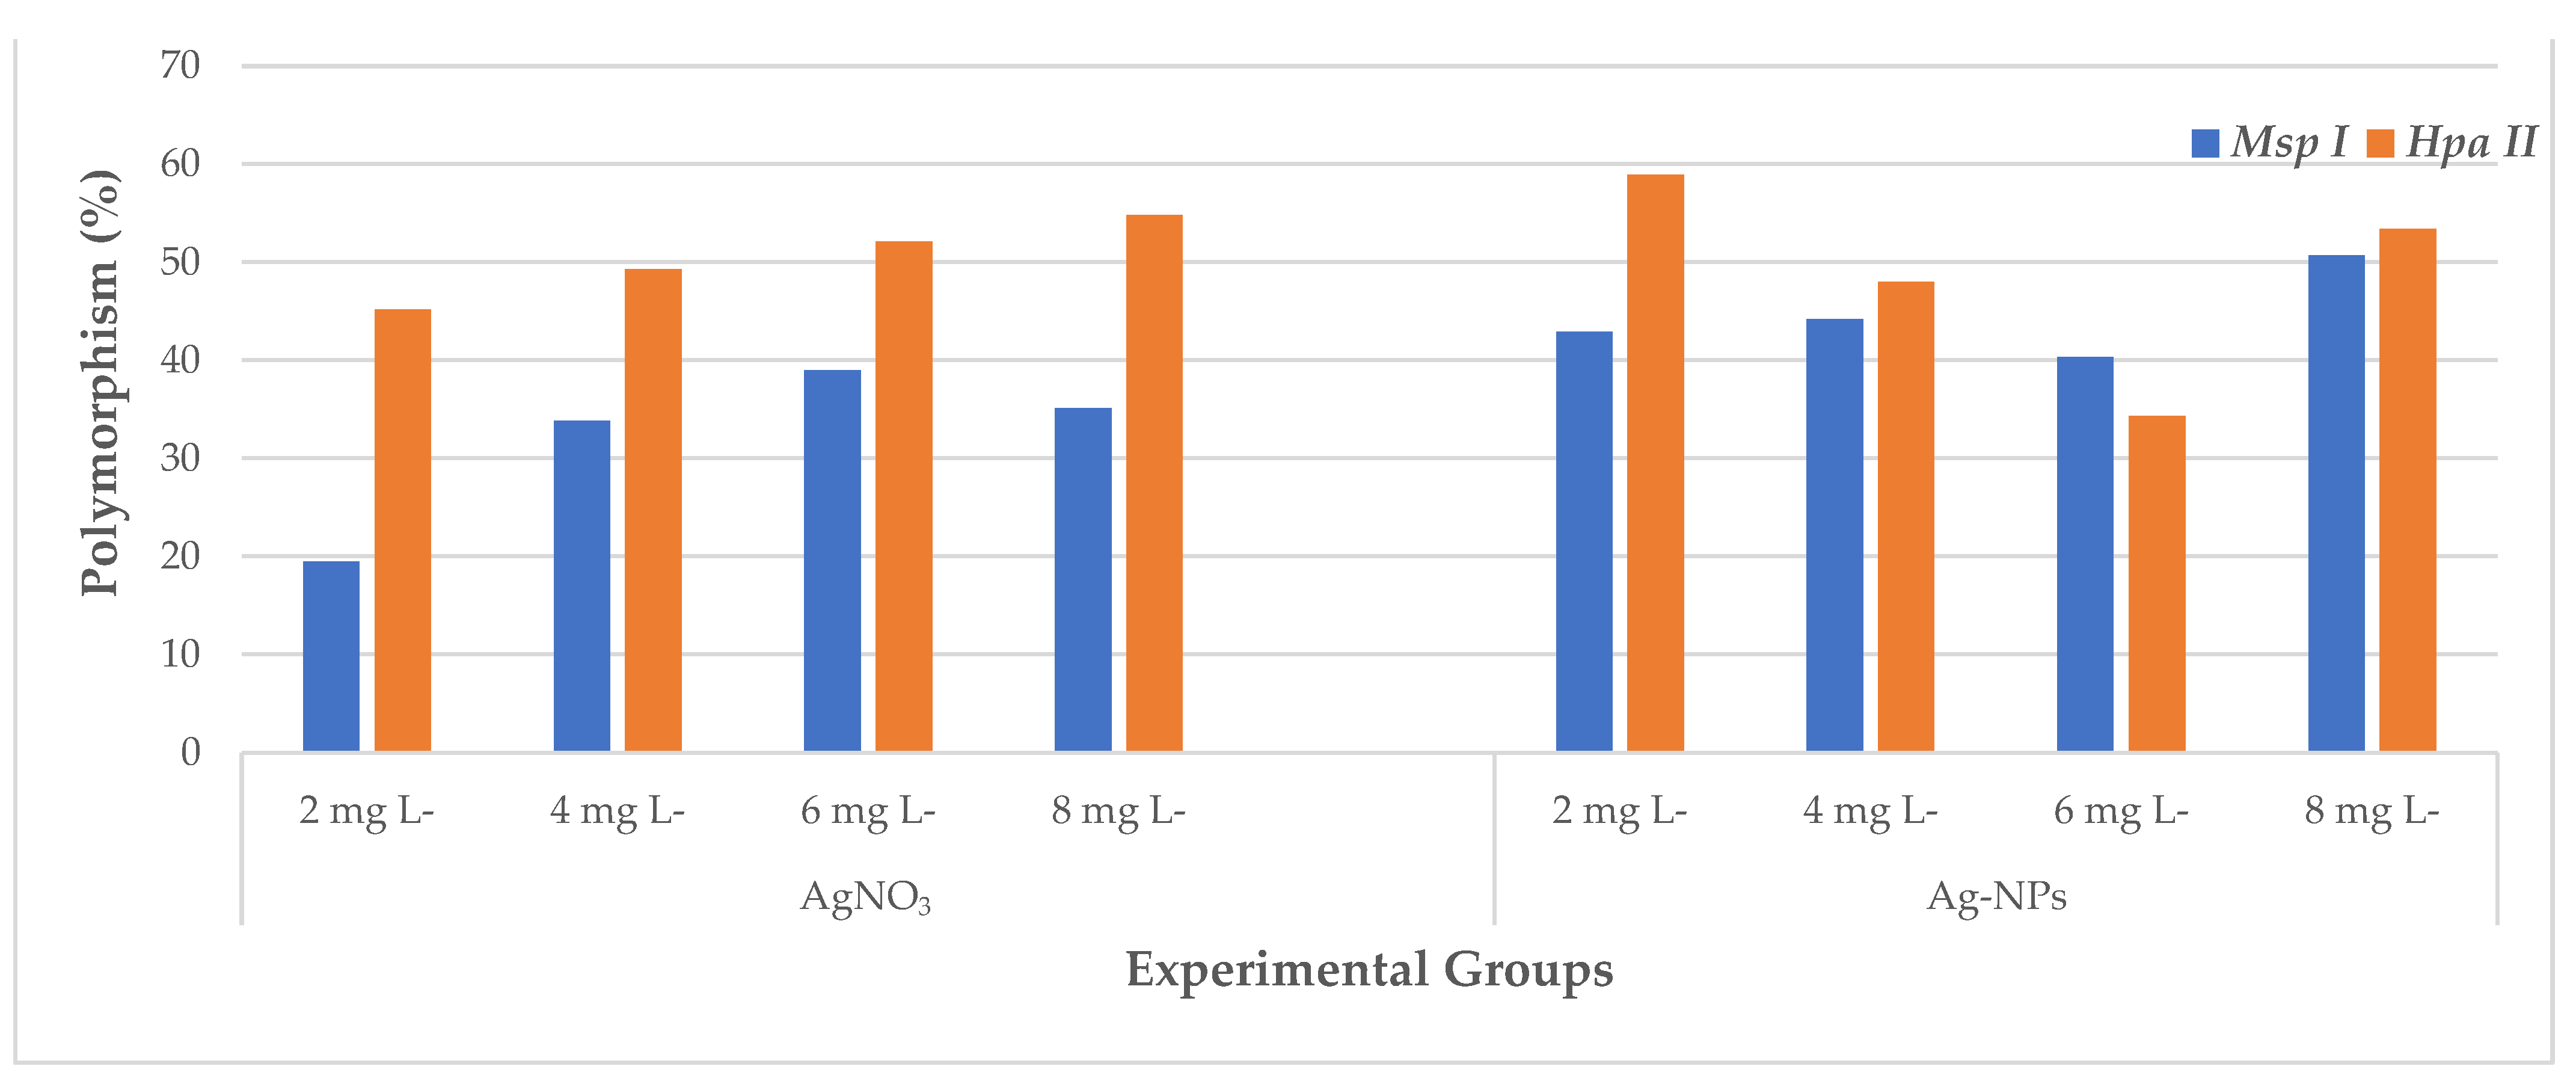
2.3. CRED-RA Analysis

The outcomes of the CRED-RA test are presented as the proportion of polymorphism observed in the CRED-RA assays that underwent digestion via Msp I and Hpa II enzymes (Figure 5 and Table 3). These findings indicate that the DNA methylation status, whether hypermethylated or hypomethylated, depended on the type and quantity of treatments (AgNO3 and Ag-NPs). This determination was made by comparing the PCR products obtained from the control DNA to those obtained from the experimental DNA. The data obtained reveal that the Msp I- and Hpa II-digested controls exhibited 77 and 73 bands, respectively. The total count of bands observed in the experimental groups subjected to Msp I digestion (232) was found to be lower compared to the experimental groups subjected to Hpa II digestion (289), considering both the bands that disappeared and those that newly appeared. In comparison to the control group, the experimental groups for Msp I exhibited a net increase of 157 newly created bands and a net reduction of 75 pre-existing bands. When compared to the control group for Hpa II, the experimental groups demonstrated a net increase of 195 newly created bands and a net loss of 94 pre-existing bands.
The observed Msp I polymorphism percentages exhibited a range of variability spanning from 19.5% to 50.7%. The findings of the CRED-RA test that was performed on Msp I indicate that the experimental group treated with 8 mg L−1 Ag-NPs displayed the greatest polymorphism value of 50.7%, while the experimental group treated with 2 mg L−1 AgNO3 presented the lowest value of 19.5%. According to the findings of this research, there was a rise in the polymorphism values for Msp I in conjunction with an increase in the concentrations of AgNO3, which resulted in a condition of hypermethylation. In addition, the findings of our research suggest that there was generally a rise in the polymorphism values with an increase in the Ag-NP concentrations for Msp I, which also resulted in a condition of hypermethylation. When looking at the polymorphism rates for Msp I in a more general sense, the rate of polymorphism in the experimental groups that were treated with Ag-NPs was greater than the rate of polymorphism in the experimental groups that were treated with AgNO3. In other words, methylation was observed to be at a higher level in the Ag-NP-treated experimental groups compared to the AgNO3-treated experimental groups.
The proportion of Hpa II polymorphism had a varied range, which spanned from 34.3% all the way up to 58.9%. The findings of the CRED-RA test that was performed on Hpa II indicated that the experimental group treated with 2 mg L−1 Ag-NPs displayed the greatest polymorphism value of 58.9%, while the experimental group treated with 6 mg L−1 AgNO3 presented the lowest value of 34.3%. It was established that the level of methylation that occurred in Hpa II reduced as the concentration of Ag-NPs increased in the experimental groups that were treated with Ag-NPs. On the other hand, the amount of methylation that occurred in the experimental groups that were treated with AgNO3 increased as the concentration of AgNO3 increased (Figure 6).

2.4. Machine Learning (ML) Analysis

In this study, we utilized the support vector machine (SVM), random forest (RF), extreme gradient boosting (XGBoost), k-nearest neighbor classifier (KNN), and Gaussian processes classifier (GP) algorithms to predict the relationship between our inputs and outputs. We compared and evaluated the performances of these models, analyzing the data generated from the experiments, including tissue culture and molecular analysis. The training dataset was employed during the model’s learning process, while the test dataset was used to assess the model’s performance. The outcomes of the machine learning models in this investigation are presented in Table 4, summarizing the findings of the study.
Metrics such as the MSE, MAPE, and MAD are the criteria that are used in the process of determining an algorithm’s overall performance. A model’s predictions are more accurate when these criteria have a lower value, since this means their values are closer to the actual values observed (Table 4). Our examination of the test performance outcomes, namely the mean squared error (MSE), mean absolute percentage error (MAPE), and mean absolute deviation (MAD), indicated a discernible trend of the XGBoost model having the highest performance, followed by GP, RF, SVM, and KNN, in the context of their CI predictions. In other words, the order of the best predictive models for CI was XGBoost < GP < RF < SVM < KNN. The XGBoost model had the greatest R2 value of 51.5%, indicating its superior ability to predict CI compared to the other models (Table 4).
The rankings of the most accurate prediction models in embryogenic callus (EC) was consistent based on the mean squared error (MSE) and mean absolute deviation (MAD) values but diverged when considering the mean absolute percentage error (MAPE) values. The rankings of the best prediction models for EC regarding their MSE, MAPE, and MAD values were RF < GP < SVM < KNN < XGBoost, RF < SVM < GP < KNN < XGBoost, and RF < GP < SVM < KNN < XGBoost, respectively. Overall, the random forest (RF) model had superior performance when predicting EC, as shown in all three distinct performance metrics (MSE, MAPE, and MAD). The RF model had the highest R2 value of 71.9%, suggesting its greater predictive capability for EC in comparison to the other models (Table 4).
The ranking of the best prediction models for forecasting regeneration efficiency (RE) was found to be consistent based on the mean squared error (MSE) and mean absolute deviation (MAD) values. However, there were discrepancies in these rankings when considering the mean absolute percentage error (MAPE) values. The rankings of the best RE prediction models regarding the MSE, MAPE, and MAD values were GP < SVM < XGBoost < RF < KNN, GP < XGBoost < SVM < RF < KNN, and GP < SVM < XGBoost < RF < KNN, respectively. Ultimately, the Gaussian processes classifier (GP) model had the superior performance when predicting RE, as shown in all three distinct performance metrics (MSE, MAPE, and MAD). The GP model had the highest R2 value of 52.5%, suggesting its greater predictive capability for RE in comparison to the other models (Table 4).
Additionally, the empirical data we obtained on in vitro regeneration in wheat are shown in Figure 7, together with the values that were predicted by the models. According to our results, the formula “Y = 0.596236907 X + 32.43690725” is the equation for the linear regression model that describes the relationship between the values estimated by the XGBoost algorithm, which generated the most accurate model for EC% estimation, and the actual values that were observed. The linear regression model equation “Y = 0.4973360939678 X + 34.31029044065” describes the relationship between the values estimated by the RF algorithm, which produced the most accurate model for EC estimation, and the actual observed values. The equation “Y = 0.55315933213564 X + 0.227900700516488” is the linear regression model that characterizes the association between the estimated values produced by the GP algorithm, which yielded the most perfect model for RE estimation, and the real observed values.

3. Discussion

Interactions between nanoparticles and plants result in a variety of morphological and physiological alterations, which are contingent upon the characteristics of the nanoparticles. The effectiveness of nanoparticles depends on factors such as their chemical composition, size, surface coverage, reactivity, and, critically, the dosage at which they are administered. Khodakovskaya et al. [57] demonstrated that nanoparticles can have both positive and negative effects on plant growth and development. It is important to note that the effectiveness of nanoparticles depends on their concentration and varies from plant to plant. The introduction of AgNO3 into the tissue culture medium resulted in a notable enhancement in the regenerative capacity of both monocot and dicot plants [51,58]. The precise process through which AgNO3 affects plants remains uncertain. However, there is limited data available that supports the involvement of this pathway in ethylene perception. AgNO3 has been utilized in tissue culture research to mitigate the action of ethylene, given its solubility in water and lack of phytotoxicity at effective doses [2]. In recent years, it has been demonstrated in many plants that silver nanoparticles (Ag-NPs), including AgNO3, have a positive effect when added to tissue culture. [10,59,60,61]. The potential beneficial impacts of Ag-NPs on in vitro parameters such as callus induction, regeneration, and micropropagation might be attributed to their ability to suppress ethylene synthesis within the growth medium. In this research, CI%, EC%, and the RE all altered based on the kind and amounts of treatment (AgNO3 and Ag-NPs). The highest in vitro measures, including CI rate (95.00%), EC rate (85.00%) and RE number (0.68), were seen when using the MS medium with a concentration of 2 mg L−1 of silver nanoparticles (Ag-NPs). The lowest values of EC% rate, CI% rate and RE number were obtained from MS medium with 4 mg L−1 AgNO3. The gaseous ingredients inside the tissue culture system, with a particular emphasis on ethylene, have a significant influence on the growth and developmental processes of plants [2,6]. According to the literature, the presence of ethylene has been shown to hinder the process of somatic embryogenesis and the production of shoot primordia in callus cultures [62]. The potential benefits of AgNO3, acting as a competitor for the binding site of ethylene, on plant tissue culture have been documented in several plant species. [63,64]. The use of silver nitrate, particularly in cereals, has been seen to have a positive effect on somatic embryogenesis. In buffalograss, the treatment of AgNO3 was shown to considerably enhance callus induction frequency as well as growth, according to the findings of Fei et al. [65]. The callus induction frequency reached its maximum value of 79.9% when exposed to a concentration of 10 mg L−1 AgNO3. It was observed that the application of AgNO3 had a positive effect on the initiation of callus formation in Paspalum scrobiculatum and Eleusine coracana. Based on their research results, it was observed that the use of MS medium enriched with AgNO3 resulted in the development of embryogenic and friable callus in both species [66]. According to the literature, the addition of AgNO3 has been shown to increase the development of embryogenic callus in bread wheat [62]. So far, there have been limited studies conducted on the effects of Ag-NPs on various plant species, including Phaseolus vulgaris [67], Eruca sativa [68], Lolium multiflorum [69], Sorghum bicolor [70], Arabidopsis thaliana [71], Allium cepa [5], and Oryza sativa [72]. Positive response of Ag-NPs added to tissue culture has been reported in many plant species [61,73,74]. Various studies have shown the beneficial impacts of NPs on the processes of callus induction, shoot regeneration, and growth. Sarmast et al. [75] reported significant differences in the mean number of shoots per explants, mean length of shoots per explants and percentage of explants producing shoots between explants grown in MS medium supplemented with 60 µg ml−1 Ag-NPs compared to controls. Silver nanoparticles (30 mg L−1) added to a culture medium have been shown to increase biomass production in cell suspension cultures of Arabidopsis thaliana [60]. Karimi and Mohsenzadeh [76] documented that wheat plants exhibited a notable and significant decline in growth when subjected to two concentrations of AgNO3 and Ag-NPs treatments (10 mg L−1, 100 mg L−1). Based on our findings, higher doses of AgNO3 administration resulted in a general rise in the induction of embryogenic callus in bread wheat. On the contrary, concentrations increasing of Ag-NPs treatment led to a reduction in CI rate, EC rate and RE number. When Ag-NPs were applied at greater doses, negative effects on plant development were also seen in Saccharum spp. [77], Vanilla planifolia [78], and Prunus armeniaca [22]. According to Castro-González et al. [79], elevated concentrations of this compound may have a negative impact on the cellular processes, including cell divisions. According to Timoteo et al. [80], the application of Ag-NPs at low concentrations resulted in an increase in both the fresh and dry weights of Physalis peruviana seedlings. However, greater concentrations of Ag-NPs were shown to inhibit shoot development and root formation. On the other hand, the exposure to silver nanoparticles (Ag-NPs) was shown to impede the development and biomass accumulation of Spirodela polyrhiza, as reported by Jiang et al. [81]. To a certain degree, the plant has the potential to endure an elevation in the concentration of metallic particles, and it may even aid development to a limited level. However, it has been shown that elevated levels of metal ions have detrimental effects on the development of plants [82]. The potential impacts of high concentrations of Ag-NPs on plants might vary depending on factors such as the specific kind of plant, its genetic structure, morphology, biochemistry, and physical properties.
Although its underlying mechanisms are not fully understood, the properties of tissue culture are thought to be a potential source of genomic instability [83]. The advancement of modern methodologies has revealed that plant tissue culture is subject to epigenetic modifications, such as histone methylation/demethylation [84], DNA methylation levels [85], alterations in gene expression [86], and the involvement of various small RNAs [87]. In the present study, RAPD techniques were employed to assess genetic variability. The results presented in Table 2 indicate the existence of genetic variability among wheat plants exposed to different concentrations of Ag-NPs and AgNO3, as compared to the control group. This finding is consistent with that of Abdel-Azeem and Elsayed [88], whom studied the effects of silver engineered nanoparticles on Vicia faba seedlings and discovered that the particles altered mitotic indices and chromosomal morphology, causing metaphase and anaphase chromosome lag, chromosome fragmentation and bridging, chromosome stickiness, and micronuclei. Ewais et al. [89] investigated genetic variation in DNA samples treated with Ag-NPs and a control treatment of Solanum nigrum using RAPD techniques and reported that there were different levels of genetic variation, which is consistent with our study according to our RAPD analysis results.
It is expected that regenerants produced by somatic embryogenesis will be phenotypically and genetically indistinguishable from their parent plant. However, this cannot be assumed as a rule for all cases. Regenerants can show phenotypic, cytological, and genetic alterations [90]. The factors contributing to variance in plant tissue grown in vitro are diverse, including the components of the culture media, the duration of plant tissue cultivation, and the environmental conditions [91,92]. For instance, among the components of the culture medium, micronutrients like copper or silver appear to influence the process of somatic embryogenesis, as has recently been revealed in research on genetic and epigenetic modifications [39]. During the process of cell differentiation and dedifferentiation in plant regeneration systems, epigenetic variation has been observed both during and after the cells were subjected to the conditions of in vitro culture [93]. DNA sequence variation is the essential evolutionary mechanism generating phenotypic variances [94], whereas DNA methylation changes in may impact gene expression and thus may conceivably contribute to trait differences that may be passed on to future generations. DNA methylation plays a crucial role in proper cellular development cellular differentiation [95]. The effects of various nanomaterials and nanoparticles on DNA methylation have been studied extensively in recent years [30,32]. In the present research, we assessed the average proportion of DNA methylation-induced polymorphism across all the experimental groups using the CRED-RA test. In our study, the Msp I experimental groups showed a net increase of 157 newly formed bands and a net decrease of 75 pre-existing bands when compared to the control group and, the experimental groups for Hpa II showed a net increase of 195 newly produced bands and a net loss of 94 pre-existing bands when compared to the control group. A wide variation was seen in the percentages of Msp I polymorphism, from 19.5% to 50.7%. The CRED-RA analysis conducted on Msp I determined that the experimental group treated with 8 mg L−1 Ag-NPs provided the highest polymorphism value (50.7%), whereas the experimental group treated with 2 mg L−1 AgNO3 presented the lowest value (19.5%). According to CRED-RA analysis, the rate of polymorphism in experimental groups treated with Ag-NPs was higher than the rate of polymorphism in experimental groups treated with AgNO3. In other words, methylation levels appeared to be higher in Ag-NPs treated experimental groups when compared to AgNO3-treated experimental groups. The process of modifying the chromatin structure via DNA and histone changes, known as epigenetic modulation, plays a crucial role in regulating gene expression at the transcriptional level in response to environmental stimuli. DNA methylation plays a crucial role in shaping chromatin structure and regulating gene expression by influencing the accessibility of genes to the transcriptional machinery, a well-recognized phenomenon in the field. In both AgNO3 application and Ag-NPs application, an increase in hyper methylation was observed with an increase in concentration, and the results are similar to previous studies [32,33]. It is noteworthy to emphasize that DNA cytosine methylation plays a crucial role as a checkpoint control mechanism in regulating cellular transcription programs. The present study suggests that AgNO3 and Ag-NPs may induce epigenetic modifications in the genome, resulting in the modulation of growth, physiology, anatomy, tissue differentiation, and metabolism.
In the scope of this study, output variables (CI, EC, and RE) were targeted by making use of input components and molecular values, and estimate models were assessed by means of ML algorithms. The ML algorithms are very suitable for analyzing and validating projected output variables due to their ability to evaluate the input parameters associated with the desired results [47,48,49,50]. In recent times, there has been a growing use of machine learning models in the field of in vitro regeneration research for the purpose of data validation. These models have been utilized in a diverse range of studies, each with its own specific objectives and goals [47,48,96]. To the best of our knowledge, this research endeavor marks the first instance of employing ML techniques to analyze the efficacy of AgNO3 and Ag-NPs in vitro regeneration, considering their concentrations and molecular effects as input factors. The results of our research indicated that the XGBoost, RF, and GP algorithms, in that order, are the ones that perform the best when it comes to the estimation of CI, EC, and RE, which are the in vitro regeneration parameters of wheat. In parallel, in a recent study conducted by Kirtis et al. [55], it was shown that XGBoost had the highest predictive performance when compared to three other machine learning algorithms (support vector regression, gaussian process regression, and random forest) in the context of modeling the in vitro regeneration of chickpea (Cicer arietinum L.). Similarly, RF (random forest) and XGBoost (extreme gradient boosting) have emerged as suitable candidates for predicting shot counts and shoot length in Alternanthera reineckii [48]. Aasim et al. [50] demonstrated the capability of Cannabis sativa to generate an optimal model using the RF algorithm for the prediction and validation of germination and growth indices. According to the findings of our research, the use of a mixture of XGBoost, RF, and GP algorithms demonstrates superior predictive capabilities for in vitro parameters. This amalgamation of algorithms has promised as a valuable tool for improving and forecasting outcomes in in vitro culture systems.

4. Materials and Methods

4.1. Synthesis of Silver Nanoparticles (Ag-NPs)

In this study, silver nanoparticles (Ag-NPs) were synthesized using Eruca vesicaria plant extracts. Briefly, after washing 2–3 times (with tap water and distilled water), the Eruca vesicaria plant leaves were cut into small pieces and transferred into a glass beaker containing 200 mL of distilled water. After the process of heating at 75 °C for 10 min and boiling for 5 min, it was cooled to room temperature and filtered using Whatman filter paper no.1. Then, the Eruca vesicaria extract was stored at 4 °C for Ag-NP synthesis. The nanoparticles were characterized using a UV-Vis spectrophotometer (Shimadzu, UV-3600 Plus, Kyoto, Japan), transmission electron microscopy (TEM) (Hitachi HighTech HT7700, Tokyo, Japan), and X-ray diffractometer (XRD) (PANalytical, Empyrean, the Netherlands), as in previous study [97]. Ag-NPs were obtained by adding 10 mL of plant extract to a solution of AgNO3 (Sigma-Aldrich, cat. no: 7761-88-8, St. Louis, MO, USA) (500 mL, 1 mM). A color change (from brown to red) was observed, followed by centrifugation, washing, and drying processes at 75 °C. One previous study [97] has also presented the results of a characterization study on Ag-NPs. These nanoparticles had sizes ranging from 5 to 20 nm and exhibited spherical, triangular, and cubic shapes. The study found that Ag-NPs showed absorption peaks at 250 and 450 nm. Ag-NPs were also found to have a face-centered cubic crystal structure.

4.2. Plant Material

For the plant material in this investigation, a Kırik wheat (Triticum aestivum L.) cultivar was used. The seeds, obtained from the Faculty of Agriculture at Ataturk University, were washed with regular water and surface-sterilized with 70% ethanol for five minutes, and then subjected to treatment for twenty-five minutes with a solution containing one percent sodium hypochlorite and a few drops of Tween-20, with steady stirring. Finally, the seeds were washed three times with sterile distilled water. The seeds were stored in a controlled environment at a temperature of 4 °C and subjected to a period of darkness lasting 16–18 h. To induce callus formation, mature wheat embryo seeds were cultured on Murashige and Skoog (MS) [98] medium.

4.3. In Vitro Conditions

Mature seeds underwent surface sterilization initially by being washed in 70% ethanol for 5 min, followed by rinsing with sterile water. Subsequently, the seeds were treated with a 10% solution of sodium hypochlorite containing two drops of Tween-20 for 20 min. Afterward, the seeds were rinsed three times with sterile water and then incubated at 4 ºC for 24 h in sterile distilled water. Imbibed seeds were prepared according to the method described by Türkoğlu [99].
The callus induction medium used in this study consisted of a combination of MS, 12 mg L−1 dicamba, 0.5 mg L−1 IAA (Indole-3-Acetic acid), 20 g L−1 sucrose, 2 g L−1 phytagel, and 1.95 g L−1 MES (Sigma-Aldrich, St. Louis, MO, USA). The medium also included different treatments, namely silver nitrate (AgNO3) and silver nanoparticles (Ag-NPs), at concentrations of 0, 2, 4, 6, and 8 mg L−1. The pH of each medium was brought to its ultimate value of 5.8 using 1 N NaOH. The pH of the media was adjusted to 5.8 using sodium hydroxide (NaOH) before autoclaving at 121 ℃ and 105 kPa for 20 min. Vitamins and plant growth regulators went through a process of filter-based sterilizing. The Petri dishes were incubated in darkness at 25 ± 1 °C for 30 days to induce callus formation from endosperm-supported mature embryos. After, callus induction ratio (CI%), embryogenic callus ratio (EC%), and regeneration efficiency (RE) were determined [100,101]. After 30 days of culturing, the calluses were placed into Petri dishes containing MS (Murashige and Skoog) medium supplemented with 0.5 mg L−1 TDZ (N-Phenyl-N′-1,2,3-thiadiazol-5-ylurea, Thidiazuron), 20 g L−1 sucrose, and 7 g L−1 agar, which is the medium needed for embryonic callus development and plant regeneration. Solidification of the media, adjustment of the pH, and sterilization were performed in accordance with the instructions outlined for the callus induction media. After that, they were cultivated for 30 days at 25 °C with a photoperiod of 16 h of light (62 mol m−2 s−1) and 8 h of darkness. EC (%) was calculated as the number of embryonic callus es/number of explants × 100, and RE was calculated as the number of regenerated plants/numbers of embryonic calluses. The plants were transferred into magenta boxes containing the same regeneration material and kept at the same plant regeneration settings once they had grown to a height of 10–12 cm [100,101]. The present experiments were performed using a completely randomized factorial design (two different Ag substances (AgNO3 and Ag-NPs) × five different concentrations (0, 2, 4, 6, and 8 mg L−1), with four replications and ten explants per replicate. Each Petri dish was considered as one experimental unit, and ten mature embryos were cultured on each dish. The statistical software package GenStat v. 23, developed by VSN, was utilized to perform a two-way analysis of variance (ANOVA). The treatment means and interactions were compared using Duncan’s multiple range test.

4.4. Molecular Assays

4.4.1. Isolation of Genomic DNA

Genomic DNA was isolated from the cultured embryogenic calluses. Briefly, DNA samples were prepared using the CTAB method from the study by Zeinalzadehtabrizi et al. [102]. After that, the DNA was preserved for later use by being stored at a temperature of −20 °C. A nanodrop spectrophotometer (Thermo Fisher Scientific, Waltham, MA, USA) and electrophoresis on a 0.8% agarose gel were used to determine the concentration of the genomic DNA as well as its level of purity.

4.4.2. RAPD and CRED-RA PCR Assays

A total of fifteen random amplified polymorphic DNA (RAPD) primers consisting of 15 nucleotides were used for the purpose of analysis. Only eight primers were found to successfully amplify polymorphic bands and were then used in polymerase chain reaction (PCR) for RAPD and CRED-RA analyses (Table 5). To conduct RAPD analysis, a polymerase chain reaction was executed with a total volume of 20 µL. This volume included of 10× PCR buffer, 10 mM dNTP mixture, 25 mM MgCl2, ddH2O, 10 pmol of random primer, 1 U of Taq DNA polymerase (Thermo Fisher Scientific, Waltham, MA, USA), and 50 ng µL1 DNA sample. Afterward, the prepared cocktail in the tubes was placed in a thermocycler (Senso Quest Lab cycler, manufactured in Gottingen, Germany) for amplification. The first stage of the PCR process consisted of an initial denaturation phase, which was performed at a temperature of 95 °C for five minutes. After that, a total of forty cycles were performed, each of which consisted of denaturation for one minute at 95 °C, annealing for one minute at the ideal annealing temperature of the marker employed, extension for two minutes at 72 °C, and final extension for ten minutes at 72 °C.
To conduct a CRED-RA analysis, a quantity of 1 µg of DNA sample was individually digested at 37 °C for 2 h using 1 µL of Hpa II and 1 µL of Msp I, as directed by the manufacturer (Thermo Scientific, Waltham, USA). The DNA samples that were subjected to digest were then used as templates in the polymerase chain reaction (PCR) process. The process for amplification was carried out by employing the primers that are presented in Table 5. The methodological stages of the PCR were like those used in the RAPD investigation. The electrophoresis approach was used to differentiate the RAPD and CRED-RA PCR products based on their base size [38,103].

4.4.3. Genetics Analysis

To analyze the RAPD and CRED-RA banding patterns, a TotalLab TL120 software (Nonlinear Dynamics Ltd., Newcastle, UK) was used. When compared to the control, the RAPD profiles revealed polymorphism when a band that was predicted to be present did not exist and a novel band did appear. Changes in the average polymorphism were calculated for each treatment group (changing concentrations of AgNO3 and Ag-NPs), and the results were reported as a percentage in comparison to the value obtained from the control (which was set to 100%) [45,46,104,105]. A quantitative metric known as genomic template stability (GTS%) was estimated for RAPD using the formula GTS = (1 − a/n) × 100. In this calculation, a represents the mean number of polymorphic bands in each treated template, and n represents the total number of bands in the control [38,103]. With the use of the formula Polymorphism = a/n × 100 [45,46,104,105], we were able to calculate the average polymorphism values (in percent) for each concentration.

4.5. Modeling Using Machine Learning Algorithms

In order to train the model and estimate the output variables of tissue culture parameters [CI, EC, and RE], the following ML methods were applied: support vector machines (SVM) [106], random forest (RF) [107], extreme gradient boosting (XGBoost) [108], k-nearest neighbors classifier (KNN) [109], and gaussian processes classifier (GP) [110]. In the data set, the inputs that were used comprised two separate experimental design treatments (AgNO3 and Ag-NPs), as well as the concentration of treatments (0, 2, 4, 6, and 8 mg L−1). Furthermore, the data set included the inclusion of GTS rates, Msp I polymorphism, and Hpa II polymorphism in wheat, which were influenced by the experimental groups under investigation. As a result, the estimations on the observed variables (CI, EC, and RE) were derived based on the influence of both the treatments applied in MS medium and the resulting variations in gDNA. The wheat dataset was partitioned into two separate sets of data, referred to as the training set and the test set, with a ratio of 70% to the training set and 30% to the test set, respectively. To determine how well the models were performing, the leave-one-out cross-validation (LOO-CV) method was used [101]. To conduct an accurate analysis of the performance of each model, a total of four separate performance indicators, namely R2, MSE, MAPE, and MAD, were used.
The degree of correlation that exists between the model and the dependent variables was evaluated using a calculation of the coefficient (R2), which can be found in Equation (1). The mean squared error (MSE) is a statistical metric employed to assess the accuracy of a regression model by measuring the mean squared difference between the actual and predicted values. Calculating the mean squared error (MSE) involves finding the average of the squared deviations that occur between the values that were seen and the values that were anticipated using Equation (2). The mean absolute percentage error (MAPE) is a typical error metric that is used in regression analysis. It is a statistical measure that determines the average of the absolute differences that exist between the values that were predicted and those that really occurred for each data point.
These differences are then reported as a percentage (%) of the value that occurred. The mean absolute percentage error, also known as MAPE, has the virtue of scale independence, which means that changes may be expressed as percentages. This makes it possible to evaluate datasets that are not identical to one another. This capability enables comparisons to be made across many different datasets (Equation (3)). The mean absolute deviation (MAD) is calculated by first determining the absolute difference between the actual value and the anticipated value for each data point, and then determining the average of these absolute differences. Since it uses absolute values of differences in its calculation (Equation (4)), the mean absolute deviation (MAD) measure is sensitive to the presence of substantial outliers [47,48,49,50,54,96,111,112].
R 2 = 1 i = 1 n y i y i p 2 i = 1 n y i y ¯ 2
M S E = 1 n i = 1 n y i y i p 2
M A P E = 1 n i = 1 n y i y i p y i × 100
M A D = 1 n i = 1 n y i y i p
where n is the total number of samples used for training and testing, yi is the actual value that was measured, yip is the value that was predicted, and y ¯ is the mean of the measured values. The ML methods and performance metrics were both computed with the help of the R software [113,114].

5. Conclusions

To facilitate the progress of plant tissue culture techniques, it is essential that regenerated plantlets exhibit consistent genetic and morphological stability. The findings of this study provide evidence that the inclusion of AgNO3 relative to Ag-NPs in the growth medium had a substantial positive impact on the CI%, EC%, and RE values of Triticum aestivum L. These results offer new perspectives on the detrimental or beneficial effects of Ag-NPs as a potent antagonist in growth media. Potential epigenetic changes brought on by AgNO3 and Ag-NPs that affect a variety of in vitro characteristics might have a negative influence on wheat in vitro regeneration. Conducting further research is recommended to further explore the evaluation of molecular and biological processes triggered by nanoparticles, as well as to gain a deeper understanding of many aspects of nanoparticle-induced toxicity in plants. Additionally, the estimation of variables and the creation of models in in vitro processes with ML algorithms have not been sufficiently investigated yet. As this study’s results indicate, a computational method that combines XGBoost, RF, and GP techniques may be a promising strategy for predicting and improving the in vitro characteristics of wheat.

Author Contributions

Conceptualization, A.T., K.H. and G.N.; methodology, A.T., M.A., E.Y., S.Ç. and G.N.; software, A.T., F.D., M.P., P.S. and G.N.; validation, A.T., K.H., F.D., M.P., P.S. and G.N.; formal analysis, A.T., K.H., F.D. and G.N.; investigation, A.T., K.H. and G.N.; resources, A.T., K.H., M.P. and G.N.; data curation, A.T., K.H., F.D., M.A., P.S. and G.N.; writing—original draft preparation, A.T., K.H., F.D. and G.N.; writing—review and editing, A.T., K.H., F.D., S.D., M.P., P.S. and G.N.; visualization, K.H., A.T. and G.N.; supervision, K.H. and G.N.; project administration, K.H., A.T. and G.N.; funding acquisition, A.T. and K.H. All authors have read and agreed to the published version of the manuscript.

Funding

This research received no external funding.

Data Availability Statement

All data supporting the conclusions of this article are included in this article.

Conflicts of Interest

The authors declare no conflict of interest.

References

  1. Thorpe, T. History of plant tissue culture. Plant Cell Cult. Protoc. 2012, 877, 9–27. [Google Scholar]
  2. Kumar, V.; Parvatam, G.; Ravishankar, G.A. AgNO3: A potential regulator of ethylene activity and plant growth modulator. Electron. J. Biotechnol. 2009, 12, 8–9. [Google Scholar] [CrossRef]
  3. Neves, M.; Correia, S.; Canhoto, J. Ethylene Inhibition Reduces De Novo Shoot Organogenesis and Subsequent Plant Development from Leaf Explants of Solanum betaceum Cav. Plants 2023, 12, 1854. [Google Scholar] [CrossRef] [PubMed]
  4. Neves, M.; Correia, S.; Cavaleiro, C.; Canhoto, J. Modulation of Organogenesis and Somatic Embryogenesis by Ethylene: An Overview. Plants 2021, 10, 1208. [Google Scholar] [CrossRef] [PubMed]
  5. Kumari, M.; Mukherjee, A.; Chandrasekaran, N. Genotoxicity of silver nanoparticles in Allium cepa. Sci. Total Environ. 2009, 407, 5243–5246. [Google Scholar] [CrossRef] [PubMed]
  6. Prem Kumar, G.; Sivakumar, S.; Siva, G.; Vigneswaran, M.; Senthil Kumar, T.; Jayabalan, N. Silver nitrate promotes high-frequency multiple shoot regeneration in cotton (Gossypium hirsutum L.) by inhibiting ethylene production and phenolic secretion. In Vitro Cell. Dev. Biol. 2016, 52, 408–418. [Google Scholar] [CrossRef]
  7. Arigita, L.; González, A.; Tamés, R.S. Influence of CO2 and sucrose on photosynthesis and transpiration of Actinidia deliciosa explants cultured in vitro. Physiol. Plant. 2002, 115, 166–173. [Google Scholar] [CrossRef]
  8. Arigita, L.; Sánchez Tamés, R.; González, A. 1-Methylcyclopropene and ethylene as regulators of in vitro organogenesis in kiwi explants. Plant Growth Regul. 2003, 40, 59–64. [Google Scholar] [CrossRef]
  9. Gong, Y.; Gao, F.; Tang, K.; Debergh, P. In vitro high frequency direct root and shoot regeneration in sweet potato using the ethylene inhibitor silver nitrate. S. Afr. J. Bot. 2005, 71, 110–113. [Google Scholar] [CrossRef]
  10. Venkatachalam, P.; Malar, S.; Thiyagarajan, M.; Indiraarulselvi, P.; Geetha, N. Effect of phycochemical coated silver nanocomplexes as novel growth-stimulating compounds for plant regeneration of Alternanthera sessilis L. J. Appl. Phycol. 2017, 29, 1095–1106. [Google Scholar] [CrossRef]
  11. Kumar, M.; Muthusamy, A.; Kumar, V.; Bhalla-Sarin, N. In Vitro Plant Breeding towards Novel Agronomic Traits: Biotic and Abiotic Stress Tolerance; Springer: Berlin/Heidelberg, Germany, 2019. [Google Scholar]
  12. Bergeson, L.L.; Cole, M.F. Regulatory implications of nanotechnology. Biol. Interact. 2014, 315, 1–12. [Google Scholar] [CrossRef]
  13. Ghormade, V.; Deshpande, M.V.; Paknikar, K.M. Perspectives for nano-biotechnology enabled protection and nutrition of plants. Biotechnol. Adv. 2011, 29, 792–803. [Google Scholar] [CrossRef]
  14. Duhan, J.S.; Kumar, R.; Kumar, N.; Kaur, P.; Nehra, K.; Duhan, S. Nanotechnology: The new perspective in precision agriculture. Biotechnol. Rep. 2017, 15, 11–23. [Google Scholar] [CrossRef] [PubMed]
  15. Raliya, R.; Saharan, V.; Dimkpa, C.; Biswas, P. Nanofertilizer for precision and sustainable agriculture: Current state and future perspectives. J. Agric. Food Chem. 2017, 66, 6487–6503. [Google Scholar] [CrossRef] [PubMed]
  16. Prasad, R.; Bhattacharyya, A.; Nguyen, Q.D. Nanotechnology in sustainable agriculture: Recent developments, challenges, and perspectives. Front. Microbio. 2017, 8, 1014. [Google Scholar] [CrossRef] [PubMed]
  17. Beer, C.; Foldbjerg, R.; Hayashi, Y.; Sutherland, D.S.; Autrup, H. Toxicity of silver nanoparticles—Nanoparticle or silver ion? Toxicol. Lett. 2012, 208, 286–292. [Google Scholar] [CrossRef]
  18. Kulus, D.; Tymoszuk, A. Gold nanoparticles affect the cryopreservation efficiency of in vitro-derived shoot tips of bleeding heart. Plant Cell Tissue Organ Cult. (PCTOC) 2021, 146, 297–311. [Google Scholar] [CrossRef]
  19. Zhang, X.-F.; Liu, Z.-G.; Shen, W.; Gurunathan, S. Silver nanoparticles: Synthesis, characterization, properties, applications, and therapeutic approaches. Int. J. Mol. Sci. 2016, 17, 1534. [Google Scholar] [CrossRef]
  20. Parzymies, M. Nano-silver particles reduce contaminations in tissue culture but decrease regeneration rate and slows down growth and development of Aldrovanda vesiculosa explants. Appl. Sci. 2021, 11, 3653. [Google Scholar] [CrossRef]
  21. Bello-Bello, J.J.; Spinoso-Castillo, J.L.; Arano-Avalos, S.; Martínez-Estrada, E.; Arellano-García, M.E.; Pestryakov, A.; Toledano-Magaña, Y.; García-Ramos, J.C.; Bogdanchikova, N. Cytotoxic, genotoxic, and polymorphism effects on Vanilla planifolia Jacks ex Andrews after long-term exposure to Argovit® silver nanoparticles. Nanomaterials 2018, 8, 754. [Google Scholar] [CrossRef]
  22. Pérez-Caselles, C.; Alburquerque, N.; Faize, L.; Bogdanchikova, N.; García-Ramos, J.C.; Rodríguez-Hernández, A.G.; Pestryakov, A.; Burgos, L. How to get more silver? Culture media adjustment targeting surge of silver nanoparticle penetration in apricot tissue during in vitro micropropagation. Horticulturae 2022, 8, 855. [Google Scholar] [CrossRef]
  23. Rahmawati, M.; Mahfud, C.; Risuleo, G.; Jadid, N. Nanotechnology in plant metabolite improvement and in animal welfare. Appl. Sci. 2022, 12, 838. [Google Scholar] [CrossRef]
  24. Reynolds, M.P.; Braun, H.-J. Wheat Improvement. In Wheat Improvement Food Security in a Changing Climate; Reynolds, M.P., Braun, H.-J., Eds.; Springer: Cham, Switzerland, 2022; pp. 3–15. ISBN 9783030906733. [Google Scholar]
  25. Huertas-García, A.B.; Tabbita, F.; Alvarez, J.B.; Sillero, J.C.; Ibba, M.I.; Rakszegi, M.; Guzmán, C. Genetic variability for grain components related to nutritional quality in spelt and common wheat. J. Agric. Food Chem. 2023, 71, 10598–10606. [Google Scholar] [CrossRef] [PubMed]
  26. Blanco, J.; Lafuente, D.; Gómez, M.; García, T.; Domingo, J.L.; Sánchez, D.J. Polyvinyl pyrrolidone-coated silver nanoparticles in a human lung cancer cell: Time-and dose-dependent influence over p53 and caspase-3 protein expression and epigenetic effects. Arch. Toxicol. 2017, 91, 651–666. [Google Scholar] [CrossRef] [PubMed]
  27. Brzóska, K.; Grądzka, I.; Kruszewski, M. Silver, gold, and iron oxide nanoparticles alter miRNA expression but do not affect DNA methylation in HepG2 cells. Materials. 2019, 12, 1038. [Google Scholar] [CrossRef] [PubMed]
  28. Mytych, J.; Zebrowski, J.; Lewinska, A.; Wnuk, M. Prolonged effects of silver nanoparticles on p53/p21 pathway-mediated proliferation, DNA damage response, and methylation parameters in HT22 hippocampal neuronal cells. Mol. Neurobiol. 2017, 54, 1285–1300. [Google Scholar] [CrossRef]
  29. Smolkova, B.; Miklikova, S.; Kajabova, V.H.; Babelova, A.; El Yamani, N.; Zduriencikova, M.; Fridrichova, I.; Zmetakova, I.; Krivulcik, T.; Kalinkova, L. Global and gene specific DNA methylation in breast cancer cells was not affected during epithelial-to-mesenchymal transition in vitro. Neoplasma 2016, 609. [Google Scholar] [CrossRef]
  30. Haliloğlu, K.; Türkoğlu, A.; Balpınar, Ö.; Nadaroğlu, H.; Alaylı, A.; Poczai, P. Effects of Zinc, Copper and Iron Oxide Nanoparticles on Induced DNA Methylation, Genomic Instability and LTR Retrotransposon Polymorphism in Wheat (Triticum aestivum L.). Plants 2022, 11, 2193. [Google Scholar] [CrossRef]
  31. Pejam, F.; Ardebili, Z.O.; Ladan-Moghadam, A.; Danaee, E. Zinc oxide nanoparticles mediated substantial physiological and molecular changes in tomato. PloS ONE 2021, 16, e0248778. [Google Scholar] [CrossRef]
  32. Rajaee Behbahani, S.; Iranbakhsh, A.; Ebadi, M.; Majd, A.; Ardebili, Z.O. Red elemental selenium nanoparticles mediated substantial variations in growth, tissue differentiation, metabolism, gene transcription, epigenetic cytosine DNA methylation, and callogenesis in bittermelon (Momordica charantia); an in vitro experiment. PloS ONE 2020, 15, e0235556. [Google Scholar] [CrossRef]
  33. Sotoodehnia-Korani, S.; Iranbakhsh, A.; Ebadi, M.; Majd, A.; Ardebili, Z.O. Selenium nanoparticles induced variations in growth, morphology, anatomy, biochemistry, gene expression, and epigenetic DNA methylation in Capsicum annuum; an in vitro study. Environ. Pollut. 2020, 265, 114727. [Google Scholar] [CrossRef] [PubMed]
  34. Vafaie Moghadam, A.; Iranbakhsh, A.; Saadatmand, S.; Ebadi, M.; Oraghi Ardebili, Z. New insights into the transcriptional, epigenetic, and physiological responses to zinc oxide nanoparticles in Datura stramonium; potential species for phytoremediation. J. Plant Growth Reg. 2022, 41, 271–281. [Google Scholar] [CrossRef]
  35. Li, X.; Liu, W.; Sun, L.; Aifantis, K.E.; Yu, B.; Fan, Y.; Feng, Q.; Cui, F.; Watari, F. Effects of physicochemical properties of nanomaterials on their toxicity. J. Biomed. Mater. Res. A 2015, 103, 2499–2507. [Google Scholar] [CrossRef]
  36. Erturk, F.A.; Aydin, M.; Sigmaz, B.; Taspinar, M.S.; Arslan, E.; Agar, G.; Yagci, S. Effects of As2O3 on DNA methylation, genomic instability, and LTR retrotransposon polymorphism in Zea mays. Environ. Sci. Pollut. Res. 2015, 22, 18601–18606. [Google Scholar] [CrossRef] [PubMed]
  37. Lu, Y.; Rong, T.; Cao, M. Analysis of DNA methylation in different maize tissues. J. Genet. Genom. 2008, 35, 41–48. [Google Scholar] [CrossRef]
  38. Hossein Pour, A.; Özkan, G.; Nalci, Ö.; Haliloğlu, K. Estimation of genomic instability and DNA methylation due to aluminum (Al) stress in wheat (Triticum aestivum L.) using iPBS and CRED-iPBS analyses. Turk. J. Bot. 2019, 43, 27–37. [Google Scholar] [CrossRef]
  39. Orłowska, R.; Pachota, K.A.; Androsiuk, P.; Bednarek, P.T. Triticale green plant regeneration is due to DNA methylation and sequence changes affecting distinct sequence contexts in the presence of copper ions in induction medium. Cells 2021, 11, 84. [Google Scholar] [CrossRef]
  40. Pereira, W.J.; Pappas, M.d.C.R.; Grattapaglia, D.; Pappas, G.J., Jr. A cost-effective approach to DNA methylation detection by Methyl Sensitive DArT sequencing. PloS ONE 2020, 15, e0233800. [Google Scholar] [CrossRef]
  41. Wang, S.; Lv, J.; Zhang, L.; Dou, J.; Sun, Y.; Li, X.; Fu, X.; Dou, H.; Mao, J.; Hu, X. MethylRAD: A simple and scalable method for genome-wide DNA methylation profiling using methylation-dependent restriction enzymes. Open Biol. 2015, 5, 150130. [Google Scholar] [CrossRef]
  42. Brunner, A.L.; Johnson, D.S.; Kim, S.W.; Valouev, A.; Reddy, T.E.; Neff, N.F.; Anton, E.; Medina, C.; Nguyen, L.; Chiao, E. Distinct DNA methylation patterns characterize differentiated human embryonic stem cells and developing human fetal liver. Genome Res. 2009, 19, 1044–1056. [Google Scholar] [CrossRef]
  43. Bednarek, P.T.; Orłowska, R.; Niedziela, A. A relative quantitative methylation-sensitive amplified polymorphism (MSAP) method for the analysis of abiotic stress. BMC Plant Biol. 2017, 17, 1–13. [Google Scholar] [CrossRef] [PubMed]
  44. Bulunuz Palaz, E.; Ugur, R.; Yaman, M. Micropropagation Protocols of New Prunus Hybrids with Significant Rootstock Potential in Fruit Breeding and Cultivation. Erwerbs-Obstbau 2023, 65, 1359–1364. [Google Scholar] [CrossRef]
  45. Türkoğlu, A.; Haliloğlu, K.; Tosun, M.; Szulc, P.; Demirel, F.; Eren, B.; Bujak, H.; Karagöz, H.; Selwet, M.; Özkan, G. Sodium Azide as a Chemical Mutagen in Wheat (Triticum aestivum L.): Patterns of the Genetic and Epigenetic Effects with iPBS and CRED-iPBS Techniques. Agriculture 2023, 13, 1242. [Google Scholar] [CrossRef]
  46. Türkoğlu, A.; Tosun, M.; Haliloğlu, K. Evaluation of ethyl methanesulfonate-induced in vitro mutagenesis, polymorphism, and genomic instability in wheat (Triticum aestivum L.). J. Crop Sci.Biotechnol. 2023, 26, 199–213. [Google Scholar] [CrossRef]
  47. Aasim, M.; Akin, F.; Ali, S.A.; Taskin, M.B.; Colak, M.S.; Khawar, K.M. Artificial neural network modeling for deciphering the in vitro induced salt stress tolerance in chickpea (Cicer arietinum L). Physiol. Mol. Biol. Plants 2023, 29, 289–304. [Google Scholar] [CrossRef] [PubMed]
  48. Aasim, M.; Ali, S.A.; Altaf, M.T.; Ali, A.; Nadeem, M.A.; Baloch, F.S. Artificial neural network and decision tree facilitated prediction and validation of cytokinin-auxin induced in vitro organogenesis of sorghum (Sorghum bicolor L.). Plant Cell Tissue Organ Cult. (PCTOC) 2023, 153, 611–624. [Google Scholar] [CrossRef]
  49. Aasim, M.; Ali, S.A.; Bekiş, P.; Nadeem, M.A. Light-emitting diodes induced in vitro regeneration of Alternanthera reineckii mini and validation via machine learning algorithms. In Vitro Cell. Dev. Biol. 2022, 58, 816–825. [Google Scholar] [CrossRef]
  50. Aasim, M.; Katırcı, R.; Akgur, O.; Yildirim, B.; Mustafa, Z.; Nadeem, M.A.; Baloch, F.S.; Karakoy, T.; Yılmaz, G. Machine learning (ML) algorithms and artificial neural network for optimizing in vitro germination and growth indices of industrial hemp (Cannabis sativa L.). Ind. Crops Prod. 2022, 181, 114801. [Google Scholar] [CrossRef]
  51. Hesami, M.; Jones, A.M.P. Application of artificial intelligence models and optimization algorithms in plant cell and tissue culture. Appl. Microbiol. Biotechnol. 2020, 104, 9449–9485. [Google Scholar] [CrossRef]
  52. Niazian, M.; Niedbała, G. Machine learning for plant breeding and biotechnology. Agriculture 2020, 10, 436. [Google Scholar] [CrossRef]
  53. Gökmen, F.; Uygur, V.; Sukuşu, E. Extreme Gradient Boosting Regression Model for Soil Available Boron. Eurasian Soil Sci. 2023, 56, 738–746. [Google Scholar] [CrossRef]
  54. Iqbal, F.; Raziq, A.; Tirink, C.; Fatih, A.; Yaqoob, M. Using the artificial bee colony technique to optimize machine learning algorithms in estimating the mature weight of camels. Trop. Anim. Health Prod. 2023, 55, 86. [Google Scholar] [CrossRef] [PubMed]
  55. Kirtis, A.; Aasim, M.; Katırcı, R. Application of artificial neural network and machine learning algorithms for modeling the in vitro regeneration of chickpea (Cicer arietinum L.). Plant Cell Tissue Organ Cult. (PCTOC) 2022, 150, 141–152. [Google Scholar] [CrossRef]
  56. Mirza, K.; Aasim, M.; Katırcı, R.; Karataş, M.; Ali, S.A. Machine learning and artificial neural networks-based approach to model and optimize ethyl methanesulfonate and sodium azide induced in vitro regeneration and morphogenic traits of water hyssops (Bacopa monnieri L.). J. Plant Growth Regul. 2023, 42, 3471–3485. [Google Scholar] [CrossRef]
  57. Khodakovskaya, M.V.; De Silva, K.; Biris, A.S.; Dervishi, E.; Villagarcia, H. Carbon nanotubes induce growth enhancement of tobacco cells. ACS Nano 2012, 6, 2128–2135. [Google Scholar] [CrossRef]
  58. Malik, W.A.; Mahmood, I.; Razzaq, A.; Afzal, M.; Shah, G.A.; Iqbal, A.; Zain, M.; Ditta, A.; Asad, S.A.; Ahmad, I.; et al. Exploring potential of copper and silver nano particles to establish efficient callogenesis and regeneration system for wheat (Triticum aestivum L.). GM Crops Food 2021, 12, 564–585. [Google Scholar] [CrossRef]
  59. Salama, H.M. Effects of silver nanoparticles in some crop plants, common bean (Phaseolus vulgaris L.) and corn (Zea mays L.). Int. Res. J. Biotechnol. 2012, 3, 190–197. [Google Scholar]
  60. Selivanov, N.Y.; Selivanova, O.; Sokolov, O.; Sokolova, M.; Sokolov, A.; Bogatyrev, V.; Dykman, L. Effect of gold and silver nanoparticles on the growth of the Arabidopsis thaliana cell suspension culture. Nanotechnol. Russ. 2017, 12, 116–124. [Google Scholar] [CrossRef]
  61. Zhang, B.; Zheng, L.P.; Yi Li, W.; Wen Wang, J. Stimulation of artemisinin production in Artemisia annua hairy roots by Ag-SiO2 core-shell nanoparticles. Curr. Nanosci. 2013, 9, 363–370. [Google Scholar] [CrossRef]
  62. Wu, J.; Song, K.H.; Litzinger, T.; Lee, S.Y.; Santoro, R.; Linevsky, M.; Colket, M.; Liscinsky, D. Reduction of PAH and soot in premixed ethylene–air flames by addition of ethanol. Combust. Flame 2006, 144, 675–687. [Google Scholar] [CrossRef]
  63. Alva Ticona, S.; Oropeza, M. Effect of culture medium consistence and silver nitrate on micropropagation of two potato (Solanum tuberosum) cultivars. Rev. Colomb. Biotecnol. 2013, 15, 55–62. [Google Scholar] [CrossRef]
  64. Sharma, A.; Kumar, V.; Giridhar, P.; Ravishankar, G.A. Induction of in vitro flowering in Capsicum frutescens under the influence of silver nitrate and cobalt chloride and pollen transformation. Electron. J. Biotechnol. 2008, 11, 84–89. [Google Scholar] [CrossRef]
  65. Fei, S.; Read, P.E.; Riordan, T.P. Improvement of embryogenic callus induction and shoot regeneration of buffalograss by silver nitrate. Plant Cell Tissue Organ Cult. (PCTOC) 2000, 60, 197–203. [Google Scholar] [CrossRef]
  66. Kothari-Chajer, A.; Sharma, M.; Kachhwaha, S.; Kothari, S. Micronutrient optimization results into highly improved in vitro plant regeneration in kodo (Paspalum scrobiculatum L.) and finger (Eleusine coracana (L.) Gaertn.) millets. Plant Cell Tissue Organ Cult. (PCTOC) 2008, 94, 105–112. [Google Scholar] [CrossRef]
  67. Najafi, S.; Heidari, R.; Jamei, R. Photosynthetic characteristics, membrane lipid levels and protein content in the Phaseolus vulgaris L. (cv. Sadri) exposed to magnetic field and silver nanoparticles. Bull. Environ. Pharmacol. Life Sci. 2014, 3, 72–76. [Google Scholar]
  68. Vannini, C.; Domingo, G.; Onelli, E.; Prinsi, B.; Marsoni, M.; Espen, L.; Bracale, M. Morphological and proteomic responses of Eruca sativa exposed to silver nanoparticles or silver nitrate. PLoS ONE 2013, 8, e68752. [Google Scholar] [CrossRef] [PubMed]
  69. Yin, L.; Cheng, Y.; Espinasse, B.; Colman, B.P.; Auffan, M.; Wiesner, M.; Rose, J.; Liu, J.; Bernhardt, E.S. More than the ions: The effects of silver nanoparticles on Lolium multiflorum. Environ. Sci. Technol. 2011, 45, 2360–2367. [Google Scholar] [CrossRef] [PubMed]
  70. Lee, W.M.; Kwak, J.I.; An, Y.J. Effect of silver nanoparticles in crop plants Phaseolus radiatus and Sorghum bicolor: Media effect on phytotoxicity. Chemosphere 2012, 86, 491–499. [Google Scholar] [CrossRef]
  71. Kaveh, R.; Li, Y.S.; Ranjbar, S.; Tehrani, R.; Brueck, C.L.; Van Aken, B. Changes in Arabidopsis thaliana gene expression in response to silver nanoparticles and silver ions. Environ. Sci. Technol. 2013, 47, 10637–10644. [Google Scholar] [CrossRef]
  72. Mazumdar, H.; Ahmed, G. Phytotoxicity effect of silver nanoparticles on Oryza sativa. Int. J. Chem. Technol. Res. 2011, 3, 1494–1500. [Google Scholar]
  73. Aghdaei, M.; Sarmast, M.; Salehi, H. Effects of silver nanoparticles on Tecomella undulata (Roxb.) Seem. micropropagation. Adv. Hort. Sci. 2012, 26, 21–24. [Google Scholar]
  74. Gruyer, N.; Dorais, M.; Bastien, C.; Dassylva, N.; Triffault-Bouchet, G. Interaction between silver nanoparticles and plant growth. ISHS 2013, 1037, 795–800. [Google Scholar] [CrossRef]
  75. Sarmast, M.; Niazi, A.; Salehi, H.; Abolimoghadam, A. Silver nanoparticles affect ACS expression in Tecomella undulata in vitro culture. Plant Cell Tissue Organ Cult. (PCTOC) 2015, 121, 227–236. [Google Scholar] [CrossRef]
  76. Karimi, J.; Mohsenzadeh, S. Physiological effects of silver nanoparticles and silver nitrate toxicity in Triticum aestivum. Iran. J. Sci. Technol. Trans. A Sci. 2017, 41, 111–120. [Google Scholar] [CrossRef]
  77. Bello-Bello, J.J.; Chavez-Santoscoy, R.A.; Lecona-Guzman, C.A.; Bogdanchikova, N.; Salinas-Ruíz, J.; Gomez-Merino, F.C.; Pestryakov, A. Hormetic response by silver nanoparticles on in vitro multiplication of sugarcane (Saccharum spp. Cv. Mex 69–290) using a temporary immersion system. Dose-Response 2017, 15, 1559325817744945. [Google Scholar] [CrossRef]
  78. Spinoso-Castillo, J.; Chavez-Santoscoy, R.; Bogdanchikova, N.; Pérez-Sato, J.; Morales-Ramos, V.; Bello-Bello, J. Antimicrobial and hormetic effects of silver nanoparticles on in vitro regeneration of vanilla (Vanilla planifolia Jacks. ex-Andrews) using a temporary immersion system. Plant Cell Tissue Organ Cult. (PCTOC) 2017, 129, 195–207. [Google Scholar] [CrossRef]
  79. Castro-González, C.G.; Sánchez-Segura, L.; Gómez-Merino, F.C.; Bello-Bello, J.J. Exposure of stevia (Stevia rebaudiana B.) to silver nanoparticles in vitro: Transport and accumulation. Sci. Rep. 2019, 9, 10372. [Google Scholar] [CrossRef]
  80. Timoteo, C.d.O.; Paiva, R.; Dos Reis, M.V.; Claro, P.I.C.; Ferraz, L.M.; Marconcini, J.M.; de Oliveira, J.E. In vitro growth of Physalis peruviana L. affected by silver nanoparticles. 3 Biotech 2019, 9, 145. [Google Scholar] [CrossRef]
  81. Jiang, H.S.; Li, M.; Chang, F.Y.; Li, W.; Yin, L.Y. Physiological analysis of silver nanoparticles and AgNO3 toxicity to Spirodela polyrhiza. Environ. Toxicol. Chem. 2012, 31, 1880–1886. [Google Scholar] [CrossRef]
  82. Shang, H.; Guo, H.; Ma, C.; Li, C.; Chefetz, B.; Polubesova, T.; Xing, B. Maize (Zea mays L.) root exudates modify the surface chemistry of CuO nanoparticles: Altered aggregation, dissolution and toxicity. Sci. Total Environ. 2019, 690, 502–510. [Google Scholar] [CrossRef]
  83. Guo, X.; Ni, J.; Xue, J.; Wang, X. Extract of bulbus Fritillaria cirrhosa perturbs spindle assembly checkpoint, induces mitotic aberrations and genomic instability in human colon epithelial cell line. Exp. Toxicol. Pathol. 2017, 69, 163–171. [Google Scholar] [CrossRef] [PubMed]
  84. Grafi, G.; Ben-Meir, H.; Avivi, Y.; Moshe, M.; Dahan, Y.; Zemach, A. Histone methylation controls telomerase-independent telomere lengthening in cells undergoing dedifferentiation. Dev. Biol. 2007, 306, 838–846. [Google Scholar] [CrossRef]
  85. Han, Z.; Crisp, P.A.; Stelpflug, S.; Kaeppler, S.M.; Li, Q.; Springer, N.M. Heritable epigenomic changes to the maize methylome resulting from tissue culture. Genetics 2018, 209, 983–995. [Google Scholar] [CrossRef] [PubMed]
  86. Kabita, K.C.; Sharma, S.K.; Sanatombi, K. Analysis of capsaicinoid biosynthesis pathway genes expression in callus cultures of Capsicum chinense Jacq. cv. ‘Umorok’. Plant Cell Tissue Organ Cult. (PCTOC) 2019, 137, 565–573. [Google Scholar] [CrossRef]
  87. Li, H.; Zhao, X.; Dai, H.; Wu, W.; Mao, W.; Zhang, Z. Tissue culture responsive microRNAs in strawberry. Plant Mol. Biol. Rep. 2012, 30, 1047–1054. [Google Scholar] [CrossRef]
  88. Abdel-Azeem, E.A.; Elsayed, B.A. Phytotoxicity of silver nanoparticles on Vicia faba seedlings. NY Sci. J. 2013, 6, 148–155. [Google Scholar]
  89. Ewais, E.A.; Desouky, S.A.; Elshazly, E.H. Evaluation of callus responses of Solanum nigrum L. exposed to biologically synthesized silver nanoparticles. Nanosci. Nanotechnol. Lett. 2015, 5, 45–56. [Google Scholar]
  90. de la Puente, R.; González, A.I.; Ruiz, M.L.; Polanco, C. Somaclonal variation in rye (Secale cereale L.) analyzed using polymorphic and sequenced AFLP markers. In Vitro Cell. Dev. Biol. 2008, 44, 419–426. [Google Scholar] [CrossRef]
  91. Bednarek, P.T.; Orłowska, R. Plant tissue culture environment as a switch-key of (epi) genetic changes. Plant Cell Tissue Organ Cult. (PCTOC) 2020, 140, 245–257. [Google Scholar] [CrossRef]
  92. Bednarek, P.T.; Orłowska, R.; Mańkowski, D.R.; Zimny, J.; Kowalczyk, K.; Nowak, M.; Zebrowski, J. Glutathione and copper ions as critical factors of green plant regeneration efficiency of triticale in vitro anther culture. Front. Plant Sci. 2022, 13, 926305. [Google Scholar] [CrossRef]
  93. Yang, X.; Wang, L.; Yuan, D.; Lindsey, K.; Zhang, X. Small RNA and degradome sequencing reveal complex miRNA regulation during cotton somatic embryogenesis. J. Exp. Bot. 2013, 64, 1521–1536. [Google Scholar] [CrossRef] [PubMed]
  94. Becker, C.; Weigel, D. Epigenetic variation: Origin and transgenerational inheritance. Curr. Opin. Plant 2012, 15, 562–567. [Google Scholar] [CrossRef] [PubMed]
  95. Karaca, M.; Aydin, A.; Ince, A.G. Cytosine methylation polymorphisms in cotton using TD-MS-RAPD-PCR. Mod. Phytomorphol. 2019, 13, 13–19. [Google Scholar]
  96. Demirel, F.; Eren, B.; Yilmaz, A.; Türkoğlu, A.; Haliloğlu, K.; Niedbała, G.; Bujak, H.; Jamshidi, B.; Pour-Aboughadareh, A.; Bocianowski, J. Prediction of Grain Yield in Wheat by CHAID and MARS Algorithms Analyses. Agronomy 2023, 13, 1438. [Google Scholar] [CrossRef]
  97. Çiçek, S. Cytotoxicity of silver nanoparticles obtained from Eruca vesicaria on rainbow trout gonad cell line-2 (RTG-2). GUFBD 2022, 12, 1093–1101. [Google Scholar]
  98. Murashige, T.; Skoog, F. A revised medium for rapid growth and bio-assays with tobacco tissue cultures. Physiol. Plant. 1962, 15, 473–497. [Google Scholar] [CrossRef]
  99. Turkoglu, A. Effects of mammalian sex hormones on regeneration capacity, retrotransposon polymorphism and genomic instability in wheat (Triticum aestivum L.). Plant Cell Tissue Organ Cult. (PCTOC) 2023, 152, 647–659. [Google Scholar] [CrossRef]
  100. Hossein Pour, A.; Aydin, M.; Haliloglu, K. Plant regeneration system in recalcitrant rye (Secale cereale L.). Biologia 2020, 75, 1017–1028. [Google Scholar] [CrossRef]
  101. Nalci, O.B.; Nadaroglu, H.; Pour, A.H.; Gungor, A.A.; Haliloglu, K. Effects of ZnO, CuO and γ-Fe 3 O 4 nanoparticles on mature embryo culture of wheat (Triticum aestivum L.). Plant Cell Tissue Organ Cult. (PCTOC) 2019, 136, 269–277. [Google Scholar] [CrossRef]
  102. Zeinalzadehtabrizi, H.; Hosseinpour, A.; Aydin, M.; Haliloglu, K. A modified genomic DNA extraction method from leaves of sunflower for PCR based analyzes. J. Biodivers. Environ. Sci. 2015, 7, 222–225. [Google Scholar]
  103. Hosseinpour, A.; Ilhan, E.; Özkan, G.; Öztürk, H.İ.; Haliloglu, K.; Cinisli, K.T. Plant growth-promoting bacteria (PGPBs) and copper (II) oxide (CuO) nanoparticle ameliorates DNA damage and DNA Methylation in wheat (Triticum aestivum L.) exposed to NaCl stress. J. Plant Biochem. Biotechnol. 2022, 31, 751–764. [Google Scholar] [CrossRef]
  104. Demirel, F.; Türkoğlu, A.; Haliloğlu, K.; Eren, B.; Özkan, G.; Uysal, P.; Pour-Aboughadareh, A.; Leśniewska-Bocianowska, A.; Jamshidi, B.; Bocianowski, J. Mammalian sex hormones as steroid-structured compounds in wheat seedling: Template of the cytosine methylation alteration and retrotransposon polymorphisms with iPBS and CRED-iBPS techniques. Appl. Sci. 2023, 13, 9538. [Google Scholar] [CrossRef]
  105. Türkoğlu, A.; Haliloğlu, K.; Tosun, M.; Bujak, H.; Eren, B.; Demirel, F.; Szulc, P.; Karagöz, H.; Selwet, M.; Özkan, G. Ethyl methanesulfonate (EMS) mutagen toxicity-induced DNA damage, cytosine methylation alteration, and iPBS-retrotransposon polymorphisms in wheat (Triticum aestivum L.). Agronomy 2023, 13, 1767. [Google Scholar] [CrossRef]
  106. Noble, W.S. What is a support vector machine? Nat. Biotechnol. 2006, 24, 1565–1567. [Google Scholar] [CrossRef]
  107. Breiman, L. Random forests. Mach. Learn. 2001, 45, 5–32. [Google Scholar] [CrossRef]
  108. Chen, T.; Guestrin, C. Xgboost: A scalable tree boosting system. In Proceedings of the 22nd ACM Sigkdd International Conference on Knowledge Discovery and Data Mining, San Francisco, CA, USA, 13–17 August 2016; pp. 785–794. [Google Scholar]
  109. Appelhans, T.; Mwangomo, E.; Hardy, D.R.; Hemp, A.; Nauss, T. Evaluating machine learning approaches for the interpolation of monthly air temperature at Mt. Kilimanjaro, Tanzania. Spat. Stat. 2015, 14, 91–113. [Google Scholar] [CrossRef]
  110. Rasmussen, C.E. Gaussian processes in machine learning. In Summer School on Machine Learning; Springer: Berlin/Heidelberg, Germany, 2003; pp. 63–71. [Google Scholar]
  111. Sammut, C.; Webb, G.I. Leave-one-out cross-validation. In Encyclopedia of Machine Learning; Sammut, C., Webb, G.I., Eds.; Springer: Boston, MA, USA, 2010; pp. 600–601. [Google Scholar]
  112. Grzesiak, W.; Zaborski, D. Examples of the use of data mining methods in animal breeding. Data Min. Appl. Eng. Med. 2012, 13, 303–324. [Google Scholar]
  113. Kuhn, M.; Wing, J.; Weston, S.; Williams, A.; Keefer, C.; Engelhardt, A.; Cooper, T.; Mayer, Z.; Kenkel, B.; Benesty, M. Caret: Classification and Regression Training: R Package; R Core Team: Vienna, Austria, 2019. [Google Scholar]
  114. Team R Core. R: A Language and Environment for Statistical Computing; R Core Team: Vienna, Austria, 2010. [Google Scholar]
Figure 1. Embryogenic callus induction of wheat (Triticum aestivum L.) on MS medium supplemented with different concentrations of AgNO3 and Ag-NPs. (A): Control (without AgNO3 and Ag-NPs); (B): 2 mg L−1 AgNO3 treatment; (C): 4 mg L−1 AgNO3 treatment; (D): 6 mg L−1 AgNO3 treatment; (E): 8 mg L−1 AgNO3 treatment; (F): 2 mg L−1 AgNO3-NP treatment; (G): 4 mg L−1 AgNO3-NP treatment; (H): 6 mg L−1 AgNO3-NP treatment; (I): 8 mg L−1 AgNO3-NP treatment. The red arrows indicate the presence of somatic embryos (S.E.) in (B,F).
Plants 12 04151 g001
Figure 2. Regeneration plants occurring from the embryonic calluses in wheat (Triticum aestivum L.) on MS medium supplemented with different concentrations of AgNO3 and Ag-NPs. (A): Control (without AgNO3 and Ag-NPs); (B): 2 mg L−1 AgNO3 treatment; (C): 4 mg L−1 AgNO3 treatment; (D): 6 mg L−1 AgNO3 treatment; (E): 8 mg L−1 AgNO3 treatment; (F): 2 mg L−1 AgNO3-NP treatment; (G): 4 mg L−1 AgNO3-NP treatment; (H): 6 mg L−1 AgNO3-NP treatment; (I): 8 mg L−1 AgNO3-NP treatment.
Plants 12 04151 g002
Figure 3. RAPD profiles of various experimental groups with OPW-06 primer. M: 100–1000 bp DNA ladder; 1: control; 2: 2 mg L−1 AgNO3 treatment; 3: 4 mg L−1 AgNO3 treatment; 4: 6 mg L−1 AgNO3 treatment; 5: 8 mg L−1 AgNO3 treatment; 6: 2 mg L−1 AgNO3-NP treatment; 7: 4 mg L−1 AgNO3-NP treatment; 8: 6 mg L−1 AgNO3-NP treatment; 9: 8 mg L−1 AgNO3-NP treatment.
Plants 12 04151 g003
Figure 4. DNA methylation changes in the wheat exposed to AgNO3 and Ag-NPs. (A) Total band; (B) polymorphism; (C) GTS value, as estimated using different experimental groups.
Plants 12 04151 g004aPlants 12 04151 g004b
Figure 5. CRED-RA profiles of various experimental groups with OPW-06 primer. M: 100–1000 bp DNA ladder; 1: control Hpa II; 2: control Msp I; 3: 2 mg L−1 AgNO3-treated Hpa II; 4: 2 mg L−1 AgNO3-treated Msp I; 5: 4 mg L−1 AgNO3-treated Hpa II; 6: 4 mg L−1 AgNO3-treated Msp I; 7: 6 mg L−1 AgNO3-treated Hpa II; 8: 6 mg L−1 AgNO3-treated Msp I; 9: 8 mg L−1 AgNO3-treated Hpa II; 10: 8 mg L−1 AgNO3-treated Msp I; 11: 2 mg L−1 AgNO3-NP-treated Hpa II; 12: 2 mg L−1 AgNO3-NP-treated Msp I; 13: 4 mg L−1 AgNO3-treated Hpa II; 14: 4 mg L−1 AgNO3-treated Msp I; 15: 6 mg L−1 AgNO3-treated Hpa II; 16: 6 mg L−1 AgNO3-treated Msp I; 17: 8 mg L−1 AgNO3-treated Hpa II; 18: 8 mg L−1 AgNO3-treated Msp I.
Plants 12 04151 g005
Figure 6. The effects of AgNO3 and Ag-NPs on polymorphism percentages in different experimental groups of wheat.
Plants 12 04151 g006
Figure 7. The observed actual values of the in vitro regeneration of wheat and the values predicted by the ML models.
Plants 12 04151 g007
Table 1. Average values and analyses of variance of AgNO3 and Ag-NPs at different doses examined in wheat plant.
TreatmentConcentration (mg L−1)CI (%) 1EC (%)RE (Number)
AgNO3080.00 abc265.00 bc0.43 bcd
AgNO3282.50 abc70.00 abc0.20 d
AgNO3460.00 d37.50 d0.13 d
AgNO3690.00 ab80.00 ab0.73 ab
AgNO3890.00 ab80.00 ab0.83 a
Means80.5066.500.46
Ag-NPs080.00 abc65.00 bc0.43 bcd
Ag-NPs295.00 a85.00 a0.68 ab
Ag-NPs487.50 ab67.50 abc0.55 abc
Ag-NPs675.00 bcd62.50 bc0.65 ab
Ag-NPs867.50 cd55.00 c0.33 cd
Means81.0067.000.53
Mean concentration080.0065.00 a0.43 bc
288.7577.50 a0.44 bc
473.7552.50 b0.34 c
682.5071.25 a0.69 a
878.7567.50 a0.58 ab
Mean square of treatment (T) 2.50 ns2.50 ns0.04 ns
Mean square of concentration (C) 241.25 ns685.00 **0.15 *
Mean square of T × C 821.25 ***1027.50 ***0.32 ***
1 CI: callus induction (%); EC: embryogenic callus induction (%); and RE: regeneration efficiency (number). 2 Letters of the same notation indicate important items. ns: non-significant at p ≥ 0.05; ** significant at p ≤ 0.01; * significant at p ≤ 0.05; *** significant at p ≤ 0.001.
Table 2. Molecular sizes (bp) of appearing/disappearing bands in the RAPD profiles of wheat treated with varying concentrations of AgNO3 and Ag-NPs.
Primers± 1Control 2Experimental Groups
AgNO3Ag-NPs
2 mg L−14 mg L−16 mg L−18 mg L−12 mg L−14 mg L−16 mg L−18 mg L−1
OPA 4+4-------679; 560; 542; 368
-458---458---
OPH 17+1--375; 216628; 466; 207--588418
---295295--295295
OPH 18+2574267634567629; 226-604; 571; 285365
-467500-467----
OPW 4+6549; 412481; 457436481478; 457-471488
-----297812; 297812-
OPW 6+7706-618531502; 367615; 502500413; 331
---------
OPW 11+3- -511; 469; 400---478-
------418--
OPW 17+2-629; 312; 208; 156----613788
---400400400400400-
OPW 20+4-500162408412; 236352329527; 111
--------
1 appearance of a new band (+), and disappearance of a normal band (-); 2 without AgNO3 and Ag-NPs, respectively.
Table 3. Molecular size of bands and polymorphism percentages according to the CRED-RA analysis.
PrimersM*/H* 1± 2Control 3Experimental Groups
AgNO3Ag-NPs
2 mg L−14 mg L−16 mg L−18 mg L−12 mg L−14 mg L−16 mgL−18 mg L−1
OPA 4M+9-647; 585576; 515; 402; 274616; 564; 526668; 600; 547708; 622; 544; 508654; 576; 505691; 641; 564; 528; 512
--827-871; 827---827
H+7951; 330907; 751; 600; 498; 433; 406; 289; 256; 2271000; 916; 792; 550; 489; 433; 317; 294; 242990; 541; 498; 472; 323; 1601018; 907; 768; 641; 560; 489; 412; 298907; 852; 792; 708; 553; 538; 519; 474; 416; 360; 330; 307-900; 871; 725; 491; 472; 319
---------
OPH 18M+15----1427; 800; 5141427-1472
-1309; 337; 2861145; 708; 582; 337; 2861145; 1063; 882; 708; 666; 286708; 337; 2862861145; 666; 286708; 337; 286420; 286
H+11--4711018; 832; 492; 359467380; 3281145; 1000-
-1336; 1109; 775; 683; 6271336; 891; 775; 6831336; 1181; 89111817751109-627
OPW 4M+11-731; 549--600; 434; 306445543; 310800; 434
-362; 259; 205362; 205362; 205205305-841-
H+13439--777; 434296---
-900; 600; 327; 149900; 629; 600; 516; 362; 149900; 600900; 629; 600;900; 629; 600;831; 600; 516900; 600; 516900; 831; 600; 570; 391
OPW 5M+6491813;497; 3381318; 864; 654 502; 338; 323826; 494; 354;331; 305852; 747; 578; 494; 406; 313888; 760; 578; 482; 360; 338864; 711; 639;570; 488; 403; 333; 297; 206930; 839; 722; 632; 488 450; 346;320; 292
---------
H+12826900; 760; 679; 600; 524; 510; 264983; 930; 760; 604826; 502800; 711921; 734; 600; 294864888; 773; 513; 292
-639; 482; 394; 373; 352; 333-415; 394; 333; 252; 200373394; 373394532; 415; 333; 200415; 394
OPW 6M+11829; 296854; 749; 466; 145800; 154966; 866; 715955; 866; 766955; 866; 700; 641; 449; 352; 228;179900; 800; 700; 312900; 800; 715; 191
----485; 429--485-
H+12605922; 672 252; 150955; 732955; 749; 600; 472; 318; 296; 166456; 432; 324; 179866; 216933; 863429; 220; 154; 100
-515515515515584; 539; 515--641; 539
OPW 11M+9-646670; 514---800; 145-
--238367; 293722; 530; 238722; 400; 293428; 293--
H+6300; 210293-813; 575; 450; 378455; 312; 232504; 331; 268437; 400679; 495; 437
---722; 419-----
OPW 17M+5788324547180860; 644; 563; 321309900; 810; 419983; 886; 846
-488; 449488362-221488; 449; 221-488; 268; 221
H+3860; 737; 609; 514; 465; 435; 375-724; 582800; 502913; 810; 700; 574; 547; 509567; 524880; 800; 631838; 604; 377
---321265321; 265321; 265321; 265265
OPW 20M+11-800; 713710; 655; 512900; 362775; 524; 502; 384818; 652; 561; 507; 306655; 512; 287818; 761; 649; 368; 324
-485; 469; 203203203677; 203203--540; 485
H+9717; 622818; 619; 600849; 734; 710; 605; 509860; 717; 600; 514; 384800; 734; 448; 386; 306; 219818; 258917; 791; 625;600; 386880; 749; 710; 661; 512; 431; 362
-258258258258634258258258
1 M—Msp I, H—Hpa II; 2 (+) appearance of a new band, and (-) disappearance of a normal band; 3 without AgNO3 and Ag-NPs, respectively.
Table 4. Machine learning algorithm goodness-of-fit criteria for predicting callus induction (CI), embryogenic callus induction (EC), and regeneration efficiency (RE).
TraitsML CriteriaSVMRFXGBoostKNNGP
TrainTestTrainTestTrainTestTrainTestTrainTest
CI 1R20.2810.0980.4020.2440.5510.5150.0760.0680.5390.443
MSE10.46216.6209.54515.2178.27312.19011.85916.8908.37913.055
MAPE10.43821.63510.26719.7538.60716.24812.02521.6919.02817.425
MAD7.76112.1187.87611.2876.6779.5239.29812.1727.00610.332
ECR20.3830.5740.4360.7190.6480.3930.1440.4320.5950.706
MSE13.3249.32612.7397.57710.06911.13015.69410.76810.7987.743
MAPE15.8359.89920.1339.32914.87016.65024.51815.23315.82510.389
MAD8.6656.92310.4726.1658.3349.98312.5479.1698.5226.916
RER20.5260.5050.5020.4220.6710.4610.1450.2360.6590.525
MSE0.1850.1730.1900.1860.1550.1800.2490.2140.1570.169
MAPE37.89555.64256.05359.25334.18854.18472.59369.55636.62348.638
MAD0.1310.1540.1610.1670.1210.1590.2010.1910.1260.138
1 CI: callus induction (%); EC: embryogenic callus induction (%); and RE: regeneration efficiency (number).
Table 5. Primers and sequences used in the RAPD and CRED-RA assays.
Primer NameSequence (5′–3′)Annealing Temperature (°C)
OPA 4AATCGGGCTG39.50
OPH 17CACTCTCCTC35.50
OPH 18GAATCGGCCA37.50
OPW 4CAGAAGCGGA39.50
OPW 6AGGCCCGATG38.50
OPW 11CTGATGCGTG35.50
OPW 17GTCCTGGGTT36.50
OPW 20TGTGGCAGCA44.50
Disclaimer/Publisher’s Note: The statements, opinions and data contained in all publications are solely those of the individual author(s) and contributor(s) and not of MDPI and/or the editor(s). MDPI and/or the editor(s) disclaim responsibility for any injury to people or property resulting from any ideas, methods, instructions or products referred to in the content.

