Article

A Nanotechnological Approach to Exploit and Enhance the Bioactivity of an Extract from Onopordum illyricum L. Leaves

1
Department of Life and Environmental Sciences, University of Cagliari, SS 554—Bivio per Sestu, Monserrato, 09042 Cagliari, Italy
2
Department of Life and Environmental Sciences, University of Cagliari, Via S. Ignazio da Laconi 13, 09123 Cagliari, Italy
*
Author to whom correspondence should be addressed.
Plants 2023, 12(7), 1453; https://doi.org/10.3390/plants12071453
Submission received: 28 February 2023 / Revised: 21 March 2023 / Accepted: 24 March 2023 / Published: 26 March 2023

Abstract

:
Plant-derived products have been used for preventive and curative purposes from the ancient era to the present day. Several studies have demonstrated the efficacy of either multicomponent-based extracts, enriched fractions, or isolated bioactives. However, they often display low solubility and bioavailability, chemical instability, poor absorption, and even toxicity, which restrict application in therapy. The use of drug delivery systems, especially nanocarriers, can overcome these physicochemical and pharmacokinetic limitations. In this study, an extract from Onopordum illyricum leaves was produced by maceration in 80% ethanol, characterized by liquid chromatography coupled to mass spectrometry, and formulated in phospholipid vesicles with the aim of exploiting and possibly enhancing its bioactivity for skin delivery. The results showed that phenolic compounds were abundantly present in the extract, especially hydroxycinnamic acid and flavonol derivatives. The extract-loaded vesicles showed small size (<100 nm), high entrapment efficiency (even >90% for most phenolic compounds), and good long-term stability. Moreover, the extract-loaded vesicles exhibited remarkable antioxidant activity, as demonstrated by colorimetric assays and by enhanced reduction of intracellular reactive oxygen species (ROS) levels in cultured skin cells. Hence, our findings support the key role of nanotechnological approaches to promote the potential of plant extracts and strengthen their application in therapy.

1. Introduction

Onopordum illyricum L. is a wild thistle belonging to Asteraceae family, widespread in the Mediterranean basin. It is a biennial herb, known as Illyrian thistle or Illyrian cottonthistle (in Italy it is called “Onopordo Maggiore”), which exceeds two meters in maximum height. It produces spiny leaves, up to 50 cm long, and inflorescences made of large purple flower heads.
It is traditionally used for food and therapeutic purposes. In Sardinia (Italy), its young scapes and capitula are eaten raw in salad [1]. The whole plant is used in decoction as cough sedative, digestive, and for biliary disease, while flower heads are used in decoction or infusion as antipyretic to treat malarial fever, and for washing exanthematous skin [2].
O. illyricum was found to be rich in sesquiterpene lactones [3,4,5,6,7,8], caffeoylquinic acid derivatives, and flavonoids [8,9]. Out of the compounds isolated, onopordopicrin and vernomelitensin, as well as 3,5 dicaffeoylquinic acid, exhibited a strong antinflammatory activity, inhibiting interleukin-8 (IL-8) release, pro-inflammatory transcription factors NF-κB, and signal transducer and activator of transcription 3 STAT3, and also activating the transcription factor Nrf2 [7,9]. Furthermore, 1,5-dicaffeoylquinic acid and luteolin showed anti-HIV-1 activity, inhibiting both reverse transcriptase and integrase enzymes [8].
In the last decades, there has been an increasing interest in the search for novel pharmacophores from plants because of their chemical diversity and versatility not matched by synthetic chemistry libraries. Various biological effects have been described for plant-derived compounds. The latter, in the form of either isolated molecules or extracts, might find applications in foods, cosmetics, and pharmaceuticals, but their direct incorporation into viable products presents certain difficulties [10]. Plant-derived products are often prone to degradation and possess poor aqueous solubility and limited permeability that hinder their dissolution and absorption. In this context, nanotechnologies can be a valuable strategy to overcome these limitations. Phospholipid vesicles are being successfully used to load plant extracts and deliver them to a number of targets via different administration routes, and several studies have demonstrated their greater therapeutic efficacy compared with conventional approaches [11,12]. Nanocarriers have been proved to be effective in resolving critical issues of natural compounds, such as poor bioavailability, low stability in physiological environment, low site-specific distribution, and side effects due to multi-targeting [13,14].
In this study, the possibility to exploit and even enhance the bioactivity of an O. illyricum extract by using nanotechnologies was investigated. Particularly, a potential topical application of vesicle formulations for the treatment of oxidative stress-related skin disorders is proposed. An extract from O. illyricum leaves was produced and characterized by identifying phenolic compounds commonly known for their biological importance. Two types of phospholipid vesicles (i.e., liposomes and Penetration Enhancer-containing Vesicles, PEVs) were prepared to improve the extract’s bioavailability and applicability on the skin. The vesicles were characterized by size distribution, surface charge, stability, and entrapment efficiency. In addition, their antioxidant power was evaluated via colorimetric assays (DPPH and FRAP) and in cultured skin cells.

2. Results

2.1. Quali-Quantitative Determination of Phenolic Compounds in O. illyricum Extract

The extract obtained from O. illyricum leaves was qualitatively analyzed by (HR) LC-ESI-QTOF MS/MS in negative ion mode, and targeted phenolic compounds were quantified by LC-DAD analysis.
The negative LC-MS profile highlighted the presence of a large group of compounds corresponding to the deprotonated molecular ions of different phenolic derivatives, mainly hydroxycinnamic acid and flavonoid derivatives (Figure 1). Individual components were identified by comparison of their m/z values in the total compound chromatogram (TCC) profile with those described in the literature (see References in Table 1). Moreover, by comparing experimental MS/MS spectra with fragmentation patterns reported in the literature for the same analytes or with the fragmentation patterns and spectra reported in a public repository of mass spectral data [15,16,17], 16 compounds were identified. Table 1 reports the identified compounds, listed according to their retention times (Rt), the UV maximum absorbance (λmax), the chemical formula derived by accurate mass measurement, MS/MS results, the references used for identification, and the identification confidence levels [18].
LC-DAD analysis supported the investigation of the phenolic fraction. Indeed, based on the evaluation of the typical UV-vis spectrum acquired between 200 and 600 nm, the most representative wavelength of maximum absorbance (λmax) and through the comparison with the literature data, it was possible to attribute the compounds to specific polyphenolic classes and identify with certainty some molecules (Table 1). Finally, polyphenols were quantified at 360 nm for flavonols and at 313 nm for hydroxycinnamic acids.
The most representative compounds belong to the class of hydroxycinnamates. The reference nomenclature for caffeoylquinic acid derivatives used in this work is the IUPAC one [23]. Compounds 13, 58, 1012 and 14 were identified as hydroxycinnamic derivatives. Peak 1 was identified as a mono-caffeoylquinic acid, due to the [M−H] m/z 353.0884 and a fragment at m/z 191.0559 (quinic acid unit) [4,20]. By comparison with a pure standard, the peak was attributed to 5-O-caffeoylquinic acid, well known as chlorogenic acid. Peaks 2, 5, 6, 7, 8 and 11 were identified as dicaffeoylquinic acids due to the [M−H] m/z 515.1197 and the fragments at m/z 191.0560, 353.0884 (chlorogenic acid unit) and 179.0339 (caffeic acid unit) [4,20]. Again, by comparison with pure standards, the peaks 2, 5, 6 and 11 were attributed to 1,3-dicaffeoylquinic acid (cynarin), 3,4-dicaffeoylquinic acid (isochlorogenic acid B), 3,5-dicaffeoylquinic acid (isochlorogenic acid A) and 4,5-dicaffeoylquinic acid (isochlorogenic acid C), respectively. Peak 8 was tentatively attributed to 1,5-dicaffeoylquinic acid due to the [M−H] m/z 515.1197 and fragments at m/z 353.0863, 191.0562, and 179.0339, and by comparison with literature data [4,8,9]. Compound 3 was tentatively identified as feruloylquinic acid due to the [M−H] m/z 367.1038 and two fragments at m/z 191.0560 and 193.0482 (loss of ferulic acid unit) [19]. Peak 14 was tentatively attributed to a feruloylcaffeoylquinic acid due to the [M−H] m/z 529.1354 and the fragments at m/z 367.1038 (feruloylquinic acid unit), 353.0884 and 191.0560 [19]. Compounds 10 and 12 were tentatively attributed to dicaffeoylsuccinoylquinic acids due to the [M−H] m/z 615.1361 [4,9,20]. Besides being the most represented compounds, hydroxycinnamic acids were also the most abundant phenolic compounds in O. illyricum (9.59 ± 0.07 mg/g dm; Table 2). Dicaffeoylquinic acids accounted for 80% of all hydroxycinnamic acids, and 1,5-di-O-caffeoylquinic acid was the most abundant (3.40 ± 0.07 mg/g dm).
Compounds 4, 9, 13, 15 and 16 were attributed to the phenolic class of flavonols by the study of the UV-vis spectra through LC/DAD and the interpretation of mass spectra and MS/MS fragments. Compound 4 was identified as luteolin glucuronide due to the [M−H] m/z 461.3725 and a fragment at m/z 285.0404, corresponding to a residue of luteolin aglycon. Neutral loss of 176 allowed us to identify the glucuronide unit [21]. A similar [M−H] m/z was found in a previous study on O. illyricum by Verotta et al. [4], and was attributed to a kaempferide glucoside, but the UV-vis spectrum is more consistent with a luteolin derivative than a kaempferide one. Peak 9 was tentatively attributed to apigenin rutinoside (isorhoifolin) due to the [M−H] m/z 577.1564 and a fragment at m/z 269.0452, as well as comparison with literature data [4]. Compound 13 was tentatively attributed to hispidulin glucuronide due to the [M−H] m/z 475.0880 and fragments at m/z 299.0535 and 284.0334. Compounds 15 and 16 were attributed to luteolin and hispidulin due to their [M−H] m/z 285.04 and 299.0558, respectively, and the interpretation of UV-vis spectra, with the confirmation of literature data [4,8]. Total flavonols amount accounted for 7.32 ± 0.05 mg/g dm, and luteolin glucuronide was the most abundant flavonol compound (4.37 ± 0.00, mg/g dm), followed by hispidulin and luteolin (Table 2).

2.2. Vesicle Characterization

Two vesicle formulations, namely liposomes and propylene glycol-Penetration Enhancer-containing Vesicles (PG-PEVs), were developed and characterized in terms of mean diameter, polydispersity, and zeta potential. To evaluate the extract’s impact on the vesicles’ characteristics, the liposomes and PG-PEVs with O. illyricum extract were compared with the empty liposomes and empty PG-PEVs. The light-scattering results, as reported in Table 3, showed that both the empty liposomes and the empty PG-PEVs were around 80 nm in diameter, slightly polydispersed (PI > 0.3), and negatively charged (approximately −14 mV). The extract’s loading significantly increased the liposomes’ mean diameter, although they remained small (96 nm), whereas it had no effect on the PG-PEVs. Furthermore, the extract’s loading significantly decreased the polydispersity index and zeta potential values (Table 3).
The stability of the vesicle formulations was evaluated by monitoring the mean diameter, the polydispersity index, and the zeta potential during storage. No signs of significant alterations were detected in the formulations containing the extract, since the vesicles remained small and monodispersed (Table 4). The empty vesicles were less stable, as indicated by increased mean diameter and polydispersity index values (90 nm and 0.4, respectively; Table 4).
The entrapment efficiency (EE) of the two nanoformulations was calculated based on the amount of 13 targeted phenolic compounds identified in the O. illyricum extract and detected in the dialyzed and non-dialyzed vesicle dispersions (Table 5). In general, liposomes provided greater entrapment efficiency values than PG-PEVs, even above 90% for most hydroxycinnamic acids and the flavonols.

2.3. Antioxidant Assays

The antioxidant activity of the O. illyricum extract was estimated as a function of its radical scavenging and ferric-reducing abilities (Table 6). The extract solution scavenged the DPPH radical completely (AA 94%), corresponding to approximately 670 μg/mL of Trolox equivalents. Given the presence of phosphatidylcholine, empty vesicles displayed a slight antioxidant activity (AA 39%). The level of antioxidant activity for the O. illyricum vesicles was similar to that of the extract solution: AA 99% and approximately 700 μg/mL of Trolox equivalents, without statistical differences (Table 6).
The results of the FRAP assay showed that the extract solution had a strong reducing power (approximately 450 μg/mL of ferrous equivalents; Table 6). Additionally, in this case, the empty vesicles showed a slight reducing power (190 μg/mL of ferrous equivalents), which contributed to the activity detected for the O. illyricum vesicles, which was above 550 μg/mL of ferrous equivalents (p < 0.01 vs. the extract solution).
These findings confirm that the antioxidant activity of the O. illyricum extract was retained, or even enhanced, in the vesicle formulations.

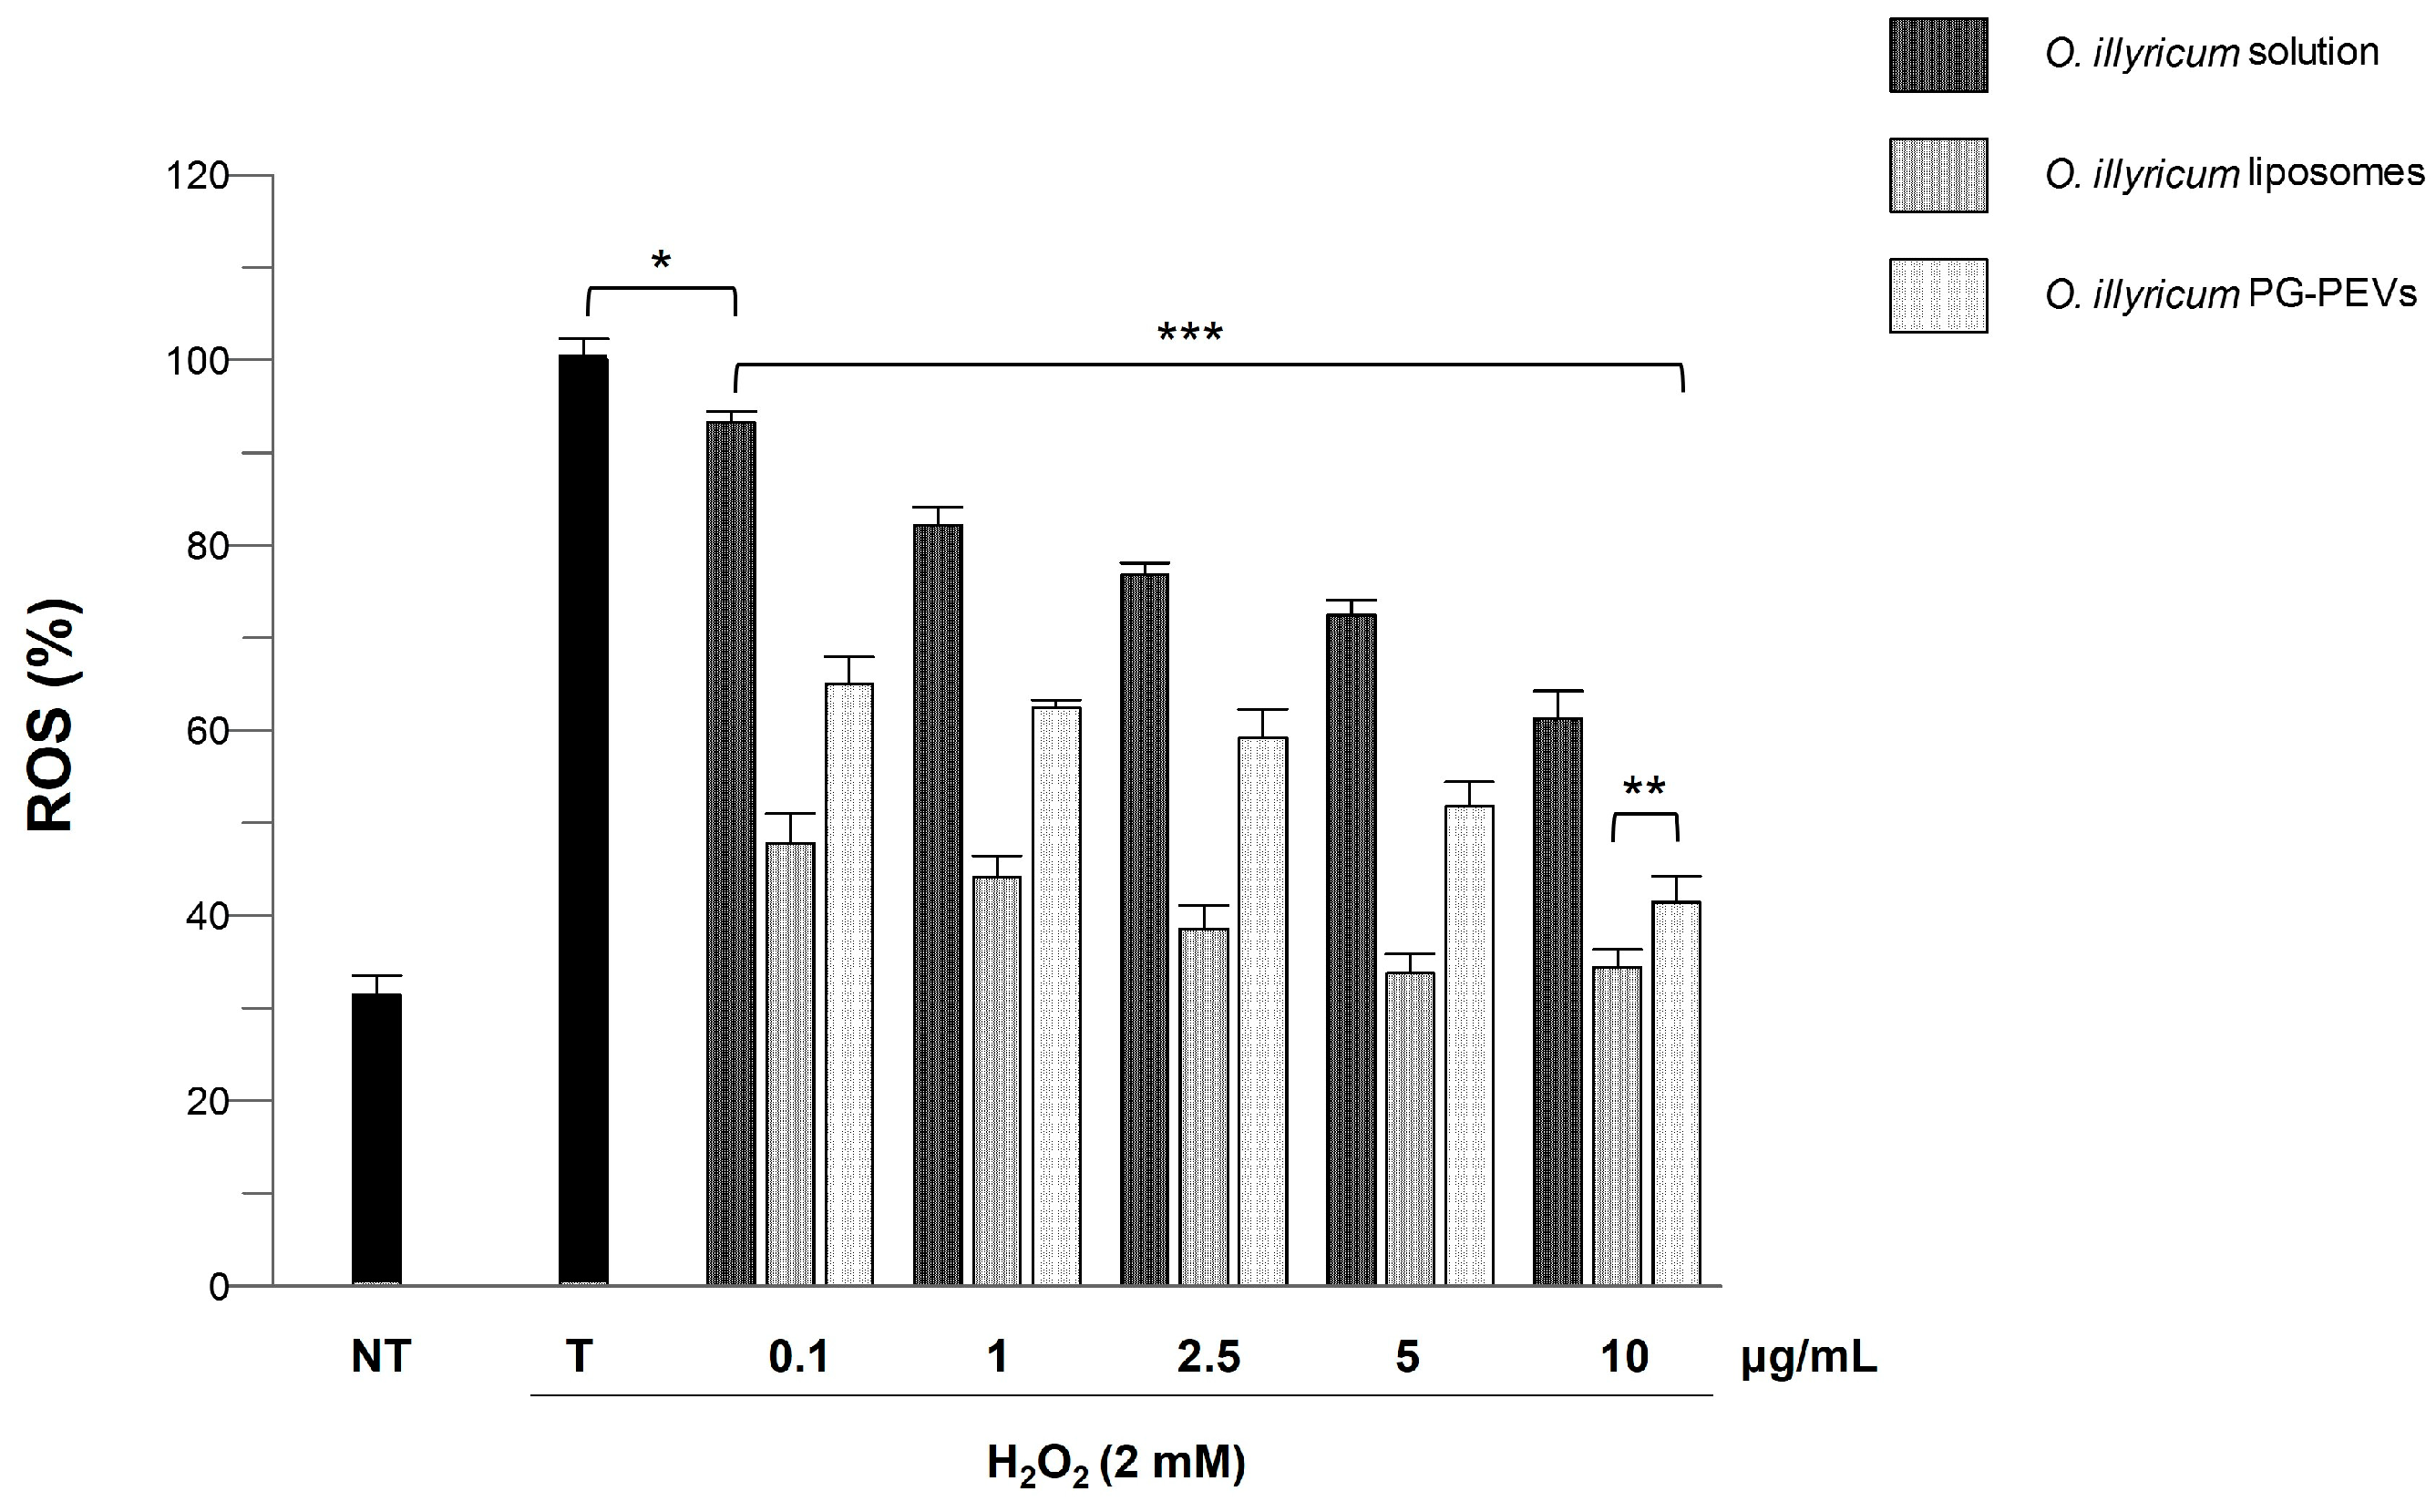
2.4. Cell Viability and Anti-ROS Activity

The effects of O. illyricum solution (2 mg/mL in DMSO) and O. illyricum liposomes/PG-PEVs were examined on cell viability, after proper dilution of samples to reach the concentrations of 0.1, 1, 2.5, 5 and 10 µg/mL. To this end, HaCaT cells were treated with the O. illyricum samples for 24 h and the viability was investigated using the MTT test. The results indicated that none of the samples were cytotoxic in HaCaT cells. A slight decrease in viability was observed in the cells exposed to the O. illyricum solution, reaching the lower value (87%) at the higher concentration (10 μg/mL) (Figure 2). On the other hand, an increase in viability was observed in the cells exposed to the O. illyricum nanoformulations in the 0.1–5 μg/mL concentration range.
In addition, ROS levels in cells were evaluated before and after H2O2-induced oxidative stress and upon treatment with O. illyricum solution or O. illyricum liposomes/PG-PEVs. H2O2-generated ROS in the cytoplasm oxidate DCFH to fluorescent DCF, whose levels were quantified spectrophotometrically. As shown in Figure 3, the incubation of the HaCaT cells with H2O2 significantly increased ROS levels (vs non-treated cells). Treatment with O. illyricum solution and O. illyricum liposomes/PG-PEVs prevented ROS production in a dose-dependent manner. In particular, the greatest intracellular ROS inhibition was provided by O. illyricum liposomes, followed by O. illyricum PG-PEVs, and finally O. illyricum solution. Considering each concentration, both vesicle formulations were statistically more efficient (p < 0.0001) than the solution. Thus, these results demonstrate that the two vesicle formulations enhanced the anti-ROS activity of the extract.

3. Discussion

The phytochemical characterization of O. illyricum extract displayed a rich phenolic fraction in accordance with previous studies [4,8,9]. The most representative compounds are widely present in other plants belonging to the Asteraceae family. Luteolin-7-glucuronide was previously found in Achillea millefolium [24] and Cynara scolymus [25], and hispidulin glucuronide was previously identified in Centaurea castriferri [22]. Other compounds were described for O. illyricum, mainly belonging to the group of sesquiterpene lactones and neolignan derivatives [3,4,5,6,7,8].
O. illyricum has been previously investigated for its antinflammatory, antiviral, and antifeedant properties [6,7,8,9], but the antioxidant activity was never investigated before, neither by using colorimetric assays nor in skin cells. We observed a strong antioxidant activity, both in cell-free systems and in cultured skin cells, that could be correlated to the high phenolic content of the extract. Our results are consistent with the literature, since a linear correlation between the antioxidant activity and the total phenolic content has been frequently described [26,27]. Among the specialized metabolites identified in our study, particularly 1,5-dicaffeoylquinic acid has been related to a strong antioxidant activity [28]. Moreover, out of the flavonols detected, luteolin has been previously reported for its antioxidant capacity [29], while hispidulin showed contrasting results, being not active in cell-free systems but effective in the protection against erythrocyte membrane lipid peroxidation [30].
Furthermore, to the best of our knowledge, this is the first study that reports on the exploitation of an O. illyricum extract by using nanotechnologies to favor its application on the skin for therapeutic purposes. In our study, liposomes and PG-PEVs were developed to load the extract. The obtained results point to a strong interaction between the phospholipid and the extract, rather than the penetration enhancer PG, and to a consequent modification of the arrangement of the bilayer leading to nanosized and more homogeneous vesicles. The good storage stability and the high entrapment efficiency of key phenolic compounds highlighted the vesicles’ potential as vehicles for the O. illyricum extract. These findings are in agreement with other studies reporting that phospholipid vesicles provided high entrapment efficiency, narrow polydispersity, and good stability of plant extracts [31,32,33].
The retention and even enhancement of the antioxidant activity of the O. illyricum extract after the nanoformulation process was demonstrated. The results obtained in keratinocytes showed that the nanoformulations, liposomes especially, protected the cells from chemically generated ROS more efficiently than the free extract. A 35% reduction of intracellular ROS levels was measured in cells exposed to the extract solution at the higher concentration (10 μg/mL). The same extent of reduction was achieved with extract-loaded PG-PEVs at a 100-times lower concentration (0.1 μg/mL). At this concentration, extract-loaded liposomes provided a 50% reduction, and at a 5 μg/mL concentration, ROS levels were comparable with those recorded in non-treated cells. A similar enhancement of the antioxidant activity of a plant extract was demonstrated by De Luca et al. [34]. The authors reported that basal intracellular ROS levels were restored in stressed skin cells when Myrtus communis L. extract liposomes were used. Hence, the nanotechnologies, which had the primary task of allowing the development of formulations suitable for skin application, were proved to represent a valuable approach for exploiting and potentiating the bioactivity of O. illyricum extract.

4. Materials and Methods

4.1. Chemicals

Phospholipon90G (P90G; phosphatidylcholine content ≥ 94%) was purchased from Lipoid GmbH (Ludwigshafen, Germany). Propylene glycol (PG) were purchased from Galeno Srl (Comeana, Prato, Italy). LC-MS grade acetonitrile, formic acid, methanol, 85% w/w phosphoric acid, 2,2-diphenyl-1-picrylhydrazyl (DPPH), 6-hydroxy-2,5,7,8-tetramethylchroman-2-carboxylic acid (Trolox), 2,4,6-tris(pyridin-2-yl)-1,3,5-triazine (TPTZ), 3-(4,5-dimethylthiazol-2-yl)-2,5-diphenyltetrazolium bromide (MTT), 2′,7′-dichlorofluorescein diacetate (DCFH-DA), dimethyl sulphoxide (DMSO), and all the other reagents, if not otherwise specified, were purchased from Sigma-Aldrich/Merck (Milan, Italy). Standards of 5-O-caffeoylquinic (chlorogenic acid), 1,3-dicaffeoylquinic acid (cynarin), 3,5-dicaffeoylquinic acid (isochlorogenic acid A), 3,4-dicaffeoylquinic acid (isochlorogenic acid B), 4,5-dicaffeoylquinic acid (isochlorogenic acid C), ferulic acid, apigenin, hispidulin, and luteolin were purchased from Extrasynthese (Genay, France) and TransMIT (Giessen, Germany). Ultrapure water (18 MΩ·cm) was obtained with a Milli-Q Advantage A10 System apparatus (Millipore, Milan, Italy).

4.2. Plant Material

O. illyricum leaves were collected in Gairo Taquisara (Sardinia, Italy) in June 2021. The sampling was carried out at the flowering stage of the plant. The leaves were randomly harvested from 10 individuals of the same population. The species was botanically identified by Cinzia Sanna, and a voucher specimen (CAG 798/V1) was deposited in the General Herbarium of the Department of Life and Environment Sciences, University of Cagliari. Plant material was dried in a ventilated stove at 40 °C to constant weight.

4.3. Extract Preparation

Dried leaves of O. illyricum (40 g) were ground in an electric grinder and the obtained powder was extracted with 80% ethanol three times, at room temperature for 24 h. The obtained extracts were joined, filtered, and concentrated under reduced pressure to evaporate the alcohol. The resulting aqueous phase was first frozen to −80 °C and then freeze-dried, affording 4.2 g of crude extract that was stored at −20 °C until use.

4.4. High-Resolution LC-ESI-QTOF-MS-MS Analysis

Qualitative investigation of the O. illyricum extract was performed by an ion mobility QTOF LC-MS system using a 1290 Infinity II UPLC equipped with an autosampler (G7167B), a quat pump (G7120A), a column comp (G7116B), and 6560 IM-QTOF (Agilent Technologies Inc., Santa Clara, CA, USA). Overall instrument performances were tested before analysis using an Agilent tuning solution mix (G1969-85000), and during the analysis, two reference masses at m/z 112.9855 and m/z 966.0007 were continuously infused to the system for constant mass correction. The electrospray ionization (ESI) source in negative ion mode was used to perform all the experiments and the optimized source parameters were the follows: drying gas at 300 °C with a flow of 5 L/min, sheath gas at 250 °C with at 12 L/min, nebulizer at 45 psi, capillary voltage set to 3500 V with a nozzle voltage of 500 V. Automatic acquisition MS/MS experiments were carried out applying a formula to calculate the collision energy by linear interpolation, calculated according to the following equation: collision energy = [slope (5) × m/z of precursor mass]/100 + Offset (2). The mass spectra were acquired by full-range acquisition, covering the m/z range of 40–1300.
Chromatographic separation was performed on a Kinetex EVO C18 column (150 × 2.1 mm, 1.7 µm 100 Å; Phenomenex, Castel Maggiore, Bologna, Italy) maintained at 55 ± 1 °C. The mobile phase consisted of a combination of solvent A (0.1% formic acid) and solvent B (acetonitrile + 0.1% formic acid) at a flow rate of 0.3 mL/min. The gradient elution was as follows: 0–20 min (99–80% A), 20–35 min (80–70% A), 35–40 min (70–1% A), 40–45 min (1–1% A), 45–46 min (1–99% A) and 46–50 min (99–99% A). The injection volume was 4 µL.
Data acquisition and processing were done using Agilent MassHunter Workstation Acquisition software v. B.09.00 (Agilent Technologies). ESI/QTOF MS data were then analyzed using the molecular feature extraction algorithm of the MassHunter Workstation Qualitative Analysis software v. 10.0 (Agilent Technologies). The tentative identification and analysis of LC-MS/MS data for the metabolites were carried out using the MassHunter METLIN metabolite PCDLdatabase v. B.08.00 (Agilent Technologies) and Sirius® software v. 4.7.4 to predict fragmentation and molecular formulae [16,17].

4.5. HPLC-DAD Analysis

Quantitative analysis of targeted phenolic compounds was carried out using a modified HPLC-DAD method, as described by De Luca et al. [34] using an Agilent 1260 Infinity II HPLC system (Agilent Technologies) fitted with a pump module G7111A, an autosampler module G7129A, a thermostatted HPLC column compartment G7116A (30 ± 1 °C), and an Agilent G4212B photodiode array detector. The separation was obtained with a Kinetex EVO C18 column (150 × 4.60 mm, 2.6 μm, Phenomenex, Casalecchio di Reno, Bologna, Italy) using 0.22 M phosphoric acid (solvent A) and acetonitrile (solvent B) as the mobile phase, at a constant flow rate of 0.8 mL/min. The gradient (v/v) was generated decreasing from 100% solvent A to 80% in 20 min, to 70% in 35 min, to 0% in 45 min, and then remaining stable up to 50 min; finally, the gradient achieved 100% solvent A and remained stable for 5 min before following injection. The injection volume was 10 μL. The chromatograms and spectra, acquired in the wavelength range 200–600 nm, were elaborated with an OpenLab CDS software v. 2.5 (Agilent Technologies). Stock standard solutions were prepared in methanol and working standard solutions were prepared in 0.22 M phosphoric acid. The calibration curves for commercial standards (see Section 4.1) were plotted with the method of the external standard, correlating the peak area with the concentration by means of the least-squares method, with a coefficient of determination (r2) > 0.999 in the range of 1–200 mg/L for all the compounds. Quantification of phenolic compounds for which no pure standards were available was obtained by comparison with the most similar calibration curve. Compounds 3 and 14 were dosed as ferulic acid equivalents, compounds 8, 10, and 12 as 1,3-di-O-caffeoylquinic acid equivalents, compound 4 as luteolin equivalents, compound 9 as apigenin equivalents, and compound 13 as hispidulin equivalents. Phenolic compound amounts were expressed as mg/g dm (extract dry mass). For the LC-DAD analysis, the O. illyricum extract was dissolved in methanol (2 mg/mL) and diluted 1:50 v/v with methanol, as well as the nanoformulations. The solutions were filtered with 0.22 μm CA syringe filter before injection.

4.6. Vesicle Preparation and Characterization

Liposomes and Penetration Enhancer-containing Vesicles (PEVs) were developed. The liposomes were prepared by dispersing P90G and the O. illyricum extract in water (Table 7) and sonicating with a Soniprep 150 plus disintegrator (MSE Crowley, London, UK; 11 cycles of 5 s on/2 s off + 9 cycles of 2 s on/2 s off; 13 µm of probe amplitude).
For the preparation of PEVs, the penetration enhancer propylene glycol (PG) was included in the formulation. PG-PEVs were prepared according to the same protocol used for liposomes, but with the addition of 10% v/v PG. For a proper comparison, empty vesicles were prepared according to the same procedure as extract-loaded vesicles, but without the extract (Table 7).
The mean diameter, polydispersity index (PI), and zeta potential of the Et-PEVs were determined by dynamic and electrophoretic light scattering using a Zetasizer nano-ZS (Malvern Panalytical, Worcestershire, UK). The samples (n > 10) were diluted with water (1:100) and analyzed at 25 °C.
The above three parameters were monitored for 60 days to assess the long-term stability of the nanoformulations, stored at 4 °C.
The non-incorporated extract components were removed from the liposomes and PG-PEVs dispersions through dialysis. A 1 mL sample was loaded into Spectra/Por® tubing (12,000–14,000 Da MWCO; Spectrum, Breda, The Netherlands) and kept in water (2 L), under gentle stirring. After 2 h, dialyzed vesicles were disrupted by diluting (1:50 v/v) with methanol, as well as non-dialyzed vesicles, and analyzed by LC–DAD to determine the amounts of targeted phenolic compounds (see Section 4.4). The entrapment efficiency (EE) was calculated as the percentage of the hydroxycinnamic acids and flavonols detected in dialyzed vs. non-dialyzed liposomes and PG-PEVs.

4.7. Antioxidant Assays

The DPPH assay was carried out to evaluate the antioxidant activity of O. illyricum extract (2 mg/mL) in methanol solution or in liposomes/PG-PEVs. Empty vesicles were also tested to evaluate the activity of the nanocarriers. Each sample (40 µL) was added to a DPPH methanolic solution (25 µM; 2 mL) and incubated at room temperature in the dark for 30 min. The discoloration of the DPPH solution, which occurs as a function of the antioxidant power and the concentration of a sample, leads to a decrease in absorbance (A) at 517 nm. The antioxidant activity (AA) of the samples was calculated according to Equation (1):
A A = A D P P H A s a m p l e A D P P H × 100
The results were expressed also as Trolox equivalents (TEs). The TE values (µg TE/mL solution) were calculated by using a calibration curve (Trolox concentration range: 50–750 µg/mL).
The antioxidant activity of O. illyricum extract (2 mg/mL), either in methanol solution or in liposomes/PG-PEVs, and empty vesicles was assessed also by the FRAP (ferric reducing antioxidant power) assay. The test is based on the reduction of Fe3+-TPTZ to Fe2+-TPTZ that causes an increase in absorbance. A total of 40 µL of each sample was mixed with 2 mL of the TPTZ–ferric solution. After 4 min of incubation at room temperature in the dark, the absorbance was read at 593 nm. The results, expressed as ferrous equivalents (FE; µg Fe2+ equivalents/mL solution), were calculated by using a calibration curve (FeSO4 concentration range: 13.9−1112 µg/mL).

4.8. Cell Viability

Human keratinocytes (HaCaT; CLS–Cell Lines Service, Eppelheim, Germany) were cultured under standard conditions (5% CO2, 95% relative humidity, and 37 °C) in Dulbecco’s Modified Eagle’s Medium plus 1% penicillin/streptomycin (Euroclone, Milan, Italy) and 10% fetal bovine serum (Gibco, Grand Island, NY, USA). Cell viability was measured by the MTT assay. Briefly, the cells were seeded in 96-well plates (5000 cells/well) and exposed for 24 h to O. illyricum solution (2 mg/mL in DMSO) or O. illyricum liposomes/PG-PEVs, properly diluted to reach the required extract concentrations (0.1, 1, 2.5, 5, and 10 µg/mL). Thereafter, the MTT solution (0.5 mg/mL) was added. After 3 h, DMSO was added to dissolve the formazan crystals, and the absorbance was recorded at 590 nm.

4.9. Antioxidant Activity in Cells

The antioxidant activity of O. illyricum extract was assessed by analyzing the intracellular ROS levels via the DCFH-DA method. HaCaT cells were incubated with the samples diluted to achieve the required extract concentrations (0.1, 1, 2.5, 5, and 10 µg/mL) for 24 h. Then, the cells were incubated with 10 µM DCFH-DA for 30 min. After the incubation, 2 mM H2O2 was added to each well, and the fluorescence intensity of ROS-oxidized 2′,7′-dichlorofuorescein (DCF) was measured at 485/530 nm (excitation/emission wavelengths), recording data for 60 min.

4.10. Statistical Analysis

The results are reported as means ± standard deviations (SD). Student’s t-test was performed to substantiate differences between groups (i.e., the vesicle formulations). For cell viability and intracellular antioxidant activity data, a two-way analysis of variance (ANOVA) was performed using the type of extract (free or nanoformulated) and the different concentrations tested as variables, followed by Tukey’s test, using GraphPad Prism software version 9 (San Diego, CA, USA). Differences were considered statistically significant for p values below 0.05.

5. Conclusions

The results of this study demonstrate that the antioxidant power of a phenolic-rich extract from O. illyricum leaves was enhanced by the incorporation in nanovesicles. This supports the role that nanotechnologies can play to allow and even promote the application of plant-derived products in therapy. Further investigation is certainly required to understand the interactions between extract-loaded vesicles and cells and to assess the penetration of targeted phenolic compounds in the skin.

Author Contributions

Conceptualization, C.C. and F.P.; investigation, C.C., C.I.G.T., S.F., V.M., C.S. and F.P.; writing—original draft preparation, C.C., C.I.G.T. and V.M.; writing—review and editing, C.C., C.I.G.T., C.S. and F.P. All authors have read and agreed to the published version of the manuscript.

Funding

This publication was produced while Valentina Masala is attending the PhD program in Life, Environmental and Drug Science at the University of Cagliari, Cycle XXXVIII, with the support of a scholarship financed by the Ministerial Decree No. 351 of 9 April 2022, based on the NRRP—funded by the European Union—NextGenerationEU—Mission 4 “Education and Research”, Component 1 “Enhancement of the offer of educational services: from nurseries to universities”—Investment 4.1 “Extension of the number of research doctorates and innovative doctorates for public administration and cultural heritage”.

Data Availability Statement

The data presented in this study are available within this article.

Acknowledgments

The Authors acknowledge CeSAR (Centro Servizi d’Ateneo per la Ricerca) core facility, University of Cagliari (Italy) for the experiments performed with Agilent 6560 IM-QTOF and Giulio Ferino for assistance with the generation of LC-MS data.

Conflicts of Interest

The authors declare no conflict of interest.

References

  1. Atzei, A.D. Le Piante Nella Tradizione Popolare della Sardegna; Carlo Delfino Editore: Sassari, Italy, 2003. [Google Scholar]
  2. Ballero, M.; Bruni, A.; Sacchetti, G.; Poli, F. Le piante utilizzate nella medicina popolare nel Comune di Tempio Pausania (Sardegna settentrionale). Acta Phytother. 1997, 1, 23–29. [Google Scholar]
  3. Braca, A.; De Tommasi, N.; Morelli, I.I.; Pizza, C. New metabolites from Onopordum illyricum. J. Nat. Prod. 1999, 62, 1371–1375. [Google Scholar] [CrossRef] [PubMed]
  4. Verotta, L.; Belvisi, L.; Bertacche, V.; Loi, M. Complete characterization of extracts of Onopordum illyricum L. (Asteraceae) by HPLC/PDA/ESIMS and NMR. Nat. Prod. Commun. 2008, 3, 2037–2042. [Google Scholar] [CrossRef] [Green Version]
  5. Bruno, M.; Maggio, A.; Rosselli, S.; Safder, M.; Bancheva, S. The metabolites of the genus Onopordum (Asteraceae): Chemistry and biological properties. Curr. Org. Chem. 2011, 15, 888–927. [Google Scholar] [CrossRef]
  6. Rosselli, S.; Maggio, A.M.; Canzoneri, M.; Simmonds, M.S.; Bruno, M. Sesquiterpenes from Onopordum illyricum and their antifeedant activity. Nat. Prod. Commun. 2012, 7, 1131–1132. [Google Scholar] [CrossRef] [Green Version]
  7. Formisano, C.; Sanna, C.; Ballero, M.; Chianese, G.; Sirignano, C.; Rigano, D.; Millán, E.; Muñoz, E.; Taglialatela-Scafati, O. Anti-inflammatory sesquiterpene lactones from Onopordum illyricum L. (Asteraceae), an Italian medicinal plant. Fitoterapia 2017, 116, 61–65. [Google Scholar] [CrossRef]
  8. Sanna, C.; Rigano, D.; Cortis, P.; Corona, A.; Ballero, M.; Parolin, C.; Del Vecchio, C.; Chianese, G.; Saccon, E.; Formisano, C.; et al. Onopordum illyricum L., a Mediterranean plant, as a source of anti HIV-1 compounds. Plant Biosyst. 2018, 152, 1274–1281. [Google Scholar] [CrossRef]
  9. Marengo, A.; Fumagalli, M.; Sanna, C.; Maxia, A.; Piazza, S.; Cagliero, C.; Rubiolo, P.; Sangiovanni, E.; Dell’Agli, M. The hydro-alcoholic extracts of Sardinian wild thistles (Onopordum spp.) inhibit TNFα-induced IL-8 secretion and NF-κB pathway in human gastric epithelial AGS cells. J. Ethnopharmacol. 2018, 210, 469–476. [Google Scholar] [CrossRef] [Green Version]
  10. Kyriakoudi, A.; Spanidi, E.; Mourtzinos, I.; Gardikis, K. Innovative Delivery Systems Loaded with Plant Bioactive Ingredients: Formulation Approaches and Applications. Plants 2021, 10, 1238. [Google Scholar] [CrossRef]
  11. Gupta, M.K.; Sansare, V.; Shrivastava, B.; Jadhav, S.; Gurav, P. Comprehensive review on use of phospholipid based vesicles for phytoactive delivery. J. Liposome Res. 2022, 32, 211–223. [Google Scholar] [CrossRef]
  12. Sahu, A.N.; Mohapatra, D. Nanovesicular transferosomes for the topical delivery of plant bioactives. Nanomedicine 2021, 16, 2491–2495. [Google Scholar] [CrossRef] [PubMed]
  13. Cheng, X.; Yan, H.; Pang, S.; Ya, M.; Qiu, F.; Qin, P.; Zeng, C.; Lu, Y. Liposomes as multifunctional nano-carriers for medicinal natural products. Front. Chem. 2022, 10, 963004. [Google Scholar] [CrossRef] [PubMed]
  14. Rahman, H.S.; Othman, H.H.; Hammadi, N.I.; Yeap, S.K.; Amin, K.M.; Abdul Samad, N.; Alitheen, N.B. Novel drug delivery systems for loading of natural plant extracts and their biomedical applications. Int. J. Nanomed. 2020, 15, 2439–2483. [Google Scholar] [CrossRef] [PubMed] [Green Version]
  15. KNApSAcK Core System. Available online: http://www.knapsackfamily.com/knapsack_core/top.php (accessed on 19 December 2022).
  16. Dührkop, K.; Fleischauer, M.; Ludwig, M.; Aksenov, A.A.; Melnik, A.V.; Meusel, M.; Dorrestein, P.C.; Rousu, J.; Böcker, S. SIRIUS 4: A rapid tool for turning tandem mass spectra into metabolite structure information. Nat. Methods 2019, 16, 299–302. [Google Scholar] [CrossRef] [Green Version]
  17. Hoffmann, M.A.; Nothias, L.F.; Ludwig, M.; Fleischauer, M.; Gentry, E.C.; Witting, M.; Dorrestein, P.C.; Dührkop, K.; Böcker, S. High-confidence structural annotation of metabolites absent from spectral libraries. Nat. Biotechnol. 2022, 40, 411–421. [Google Scholar] [CrossRef]
  18. Blaženović, I.; Kind, T.; Ji, J.; Fiehn, O. Software tools and approaches for compound identification of LC-MS/MS data in metabolomics. Metabolites 2018, 8, 31. [Google Scholar] [CrossRef] [Green Version]
  19. Jaiswal, R.; Kiprotich, J.; Kuhnert, N. Determination of the hydroxycinnamate profile of 12 members of the Asteraceae family. Phytochemistry 2011, 72, 781–790. [Google Scholar] [CrossRef]
  20. Jaiswal, R.; Kuhnert, N. Identification and characterization of five new classes of chlorogenic acids in burdock (Arctium lappa L.) roots by liquid chromatography/tandem mass spectrometry. Food Funct. 2011, 2, 63–71. [Google Scholar] [CrossRef]
  21. Sánchez-Rabaneda, F.; Jáuregui, O.; Lamuela-Raventós, R.M.; Bastida, J.; Viladomat, F.; Codina, C. Identification of phenolic compounds in artichoke waste by high-performance liquid chromatography-tandem mass spectrometry. J. Chromatogr. A 2003, 1008, 57–72. [Google Scholar] [CrossRef]
  22. Kubik, J.; Waszak, Ł.; Adamczuk, G.; Humeniuk, E.; Iwan, M.; Adamczuk, K.; Michalczuk, M.; Korga-Plewko, A.; Józefczyk, A. Phytochemical analysis and anti-cancer properties of extracts of Centaurea castriferrei Borbás & Waisb Genus of Centaurea L. Molecules 2022, 27, 7537. [Google Scholar] [CrossRef]
  23. Abrankó, L.; Clifford, M.N. An unambiguous nomenclature for the acyl-quinic acids commonly known as chlorogenic acids. J. Agric. Food Chem. 2017, 65, 3602–3608. [Google Scholar] [CrossRef] [PubMed]
  24. Benedek, B.; Geisz, N.; Jäger, W.; Thalhammer, T.; Kopp, B. Choleretic effects of yarrow (Achillea millefolium s.l.) in the isolated perfused rat liver. Phytomedicine 2006, 13, 702–706. [Google Scholar] [CrossRef] [PubMed]
  25. Sarawek, S.; Feistel, B.; Pischel, I.; Butterweck, V. Flavonoids of Cynara scolymus possess potent xanthinoxidase inhibitory activity in vitro but are devoid of hypouricemic effects in rats after oral application. Planta Med. 2008, 74, 221–227. [Google Scholar] [CrossRef] [PubMed] [Green Version]
  26. Orčić, D.Z.; Mimica-Dukić, N.M.; Francišković, M.M.; Petrović, S.S.; Jovin, E.D. Antioxidant activity relationship of phenolic compounds in Hypericum perforatum L. Chem. Cent. J. 2011, 5, 34. [Google Scholar] [CrossRef] [PubMed] [Green Version]
  27. Ruiz-Riaguas, A.; Fernández-de Córdova, M.L.; Llorent-Martínez, E.J. Phenolic profile and antioxidant activity of Euonymus japonicus thunb. Nat. Prod. Res. 2022, 36, 3445–3449. [Google Scholar] [CrossRef] [PubMed]
  28. Pagano, I.; Piccinelli, A.L.; Celano, R.; Campone, L.; Gazzerro, P.; De Falco, E.; Rastrelli, L. Chemical profile and cellular antioxidant activity of artichoke by-products. Food Funct. 2016, 7, 4841–4850. [Google Scholar] [CrossRef]
  29. Ahmadi, S.M.; Farhoosh, R.; Sharif, A.; Rezaie, M. Structure-Antioxidant Activity Relationships of Luteolin and Catechin. J. Food Sci. 2020, 85, 298–305. [Google Scholar] [CrossRef]
  30. Kut, K.; Bartosz, G.; Soszyński, M.; Sadowska-Bartosz, I. Antioxidant properties of hispidulin. Nat. Prod. Res. 2022, 36, 6401–6404. [Google Scholar] [CrossRef]
  31. Aisha, A.F.; Majid, A.M.; Ismail, Z. Preparation and characterization of nano liposomes of Orthosiphon stamineus ethanolic extract in soybean phospholipids. BMC Biotechnol. 2014, 14, 23. [Google Scholar] [CrossRef] [Green Version]
  32. Păvăloiu, R.-D.; Sha’at, F.; Neagu, G.; Deaconu, M.; Bubueanu, C.; Albulescu, A.; Sha’at, M.; Hlevca, C. Encapsulation of polyphenols from Lycium barbarum leaves into liposomes as a strategy to improve their delivery. Nanomaterials 2021, 11, 1938. [Google Scholar] [CrossRef]
  33. Shariare, M.H.; Pinky, N.J.K.; Abedin, J.; Kazi, M.; Aldughaim, M.S.; Uddin, M.N. Liposomal drug delivery of Blumea lacera leaf extract: In-Vivo hepatoprotective effects. Nanomaterials 2022, 12, 2262. [Google Scholar] [CrossRef] [PubMed]
  34. De Luca, M.; Lucchesi, D.; Tuberoso, C.I.G.; Fernàndez-Busquets, X.; Vassallo, A.; Martelli, G.; Fadda, A.M.; Pucci, L.; Caddeo, C. Liposomal formulations to improve antioxidant power of myrtle berry extract for potential skin application. Pharmaceutics 2022, 14, 910. [Google Scholar] [CrossRef] [PubMed]
Figure 1. (HR) LC-ESI-QTOF MS/MS total compound chromatogram (TCC) of O. illyricum extract acquired in negative ion mode. Peak identification is given in Table 1.
Plants 12 01453 g001
Figure 2. Effect of O. illyricum solution and O. illyricum liposomes/PG-PEVs on HaCaT cell viability. After 24 h of incubation with samples at different concentrations (0.1–10 µg/mL), cell viability was determined by the MTT assay. Asterisks indicate the statistical differences (p < 0.01) vs. non-treated control cells (NT). At each concentration, the three samples were also statistically different (p < 0.001) from each other, with the exception of O. illyricum solution vs. O. illyricum liposomes at 10 µg/mL.
Plants 12 01453 g002
Figure 3. Inhibition of H2O2-induced ROS generation (1 h-incubation with 2 mM H2O2) by O. illyricum solution and O. illyricum liposomes/PG-PEVs in HaCaT cells. NT, non-treated cells; T, cells treated with H2O2 only. *** Values statistically different (p < 0.0001) from each other and from cells treated with H2O2 only (T), with the exceptions of 0.1 μg/mL O. illyricum solution vs. cells treated with H2O2 only (* p < 0.05) and 10 μg/mL O. illyricum liposomes vs. PG-PEVs (** p < 0.005).
Plants 12 01453 g003
Table 1. Compounds identified by (HR) LC-ESI-QTOF MS/MS in O. illyricum extract.
Compound No.Rt
min
IdentityUV λmax
nm
[M-H]
m/z
Molecular FormulaΔ ppmMS/MS *
m/z
ReferencesLevel #
18.965-O-caffeoylquinic acid218, 326353.0884C16H18O90.39191.0559(100)[4,19]1
212.161,3-Dicaffeoylquinic acid244, 322515.1197C25H24O120.18353.0884(12)/191.0567(100)[4,19,20]1
313.14Feruloylquinic acid244, 328367.1038C17H20O90.68193.0482(11)/191.0560(100)[19]2
417.10Luteolin glucuronide256, 267, 348461.0725C21H18O12−0.04285.0404(100)[21]2
517.733,4-Dicaffeoylquinic acid244, 328515.1197C25H24O120.15353.0883(9)/191.0567(100)[4,19,20]1
617.993,5-Dicaffeoylquinic acid242, 328515.1197C25H24O120.26353.0882(15)/191.0567(100)[4,19,20]1
718.56Dicaffeoylquinic acid242, 328515.1197C25H24O120.44353.0863(12)/191.0562(100)/179.0339(29)[4,19,20]2
818.771,5-Dicaffeoylquinic acid245, 330515.1197C25H24O120.37353.0863(7)/191.0562(100)/179.0339(8)[4,19,20]2
919.32Apigenin rutinoside48, 338577.1564C27H30O140.02269.0452(100)[4]2
1019.76Dicaffeoylsuccunoylquinic acid I243, 330615.1361C29H28O150.52515.06924(9)/353.0855(9)/191.0598(98)[4,9,20]2
1119.914,5-Dicaffeoylquinic acid244, 328515.1197C25H24O12−0.06353.0883(14)/191.0567(100)[4,19,20]1
1220.24Dicaffeoylsuccunoylquinic acid II244, 330615.1361C29H28O150.52515.0774(20)/353.0821(11)/191.0564(100)[4,9,20]2
1320.73Hispidulin glucuronide270, 334475.0880C22H20O12−0.41299.0535(100)/284.0334(57)[22]2
1422.61Feruloylcaffeoylquinic acid244, 330529.1354C26H26O120.68367.1038(15)/353.0867(7)/191.0560(100)[19]2
1524.39Luteolin256, 268, 346285.0398C15H10O6−0.04212.0463(25)/171.0460(12)[4,8]1
1630.02Hispidulin274, 337299.0558C16H12O6−1.05284.0334(100)[4,8]1
* in parentheses the relative intensity; # according to Blaženović et al. [18].
Table 2. Concentration of targeted phenolic compounds detected in O. illyricum extract (mg/g extract dry mass, mean ± SD; n = 3).
CompoundNo.O. illyricum Extract
(mg/g dm)
Mean ± SD
Total Hydroxycinnamic acids 9.59 ± 0.07
5-O-caffeoylquinic acid11.30 ± 0.02
1,3-di-O-caffeoylquinic acid20.1 ± 0.00
Feruloyl quinic acid A30.13 ± 0.00
3,4-di-O-caffeoylquinic acid50.35 ± 0.00
3,5-di-O-caffeoylquinic acid60.44 ± 0.01
Dicaffeoylquinic acid B70.67 ± 0.00
1,5-di-O-caffeoylquinic acid B83.40 ± 0.07
Dicaffeoyl succinoyl quinic acid I B100.30 ± 0.01
4,5-di-O-caffeoylquinic acid110.77 ± 0.02
Dicaffeoyl succinoyl quinic acid II B121.70 ± 0.00
Feruloyl caffeoyl quinic acid A140.44 ± 0.01
Total Flavonols 7.32 ± 0.05
Luteolin-glucuronide C44.37 ± 0.00
Apigenin-rutinoside D90.24 ± 0.00
Hispidulin-glucuronide E130.28 ± 0.00
Luteolin151.14 ± 0.01
Hispidulin161.30 ± 0.02
Total polyphenols 16.91 ± 0.83
A dosed as ferulic acid equivalents; B dosed as 1,3-di-O-caffeoylquinic acid equivalents; C dosed as luteolin equivalents; D dosed as apigenin equivalents; E dosed as hispidulin equivalents.
Table 3. Characteristics of empty and O. illyricum liposomes and PG-PEVs: mean diameter (MD), polydispersity index (PI), and zeta potential (ZP).
FormulationMD
nm ± SD
PI ± SDZP
mV ± SD
Empty liposomes80 ± 3.60.31 ± 0.04−14 ± 1.4
O. illyricum liposomes*** 96 ± 3.3*** 0.24 ± 0.01*** −6 ± 1.6
Empty PG-PEVs77 ± 10.10.36 ± 0.08−15 ± 2.8
O. illyricum PG-PEVs§§§ 77 ± 3.1§§§, °°° 0.22 ± 0.01°°° −6 ± 1.2
Each value represents the mean ± SD (n > 10). *** values statistically different (p < 0.001) from empty liposomes; °°° values statistically different (p < 0.001) from empty PG-PEVs; §§§ values statistically different (p < 0.001) from O. illyricum liposomes.
Table 4. Mean diameter (MD), polydispersity index (PI), and zeta potential (ZP) of empty and O. illyricum liposomes and PG-PEVs after 2 months of storage (t2) vs. the data generated from time zero (t0).
FormulationTimeMD
nm ± SD
PI ± SDZP
mV ± SD
Empty liposomest080 ± 3.60.31 ± 0.04−14 ± 1.4
t2* 91 ± 4.70.39 ± 0.08−15 ± 2.8
O. illyricum liposomest096 ± 3.30.24 ± 0.01−6 ± 1.6
t2103 ± 2.4§ 0.28 ± 0.02−10 ± 2.2
Empty PG-PEVst077 ± 10.10.36 ± 0.08−15 ± 2.8
t290 ± 6.30.42 ± 0.07−17 ± 3.8
O. illyricum PG-PEVst077 ± 3.10.22 ± 0.01−6 ± 1.2
t284 ± 4.10.25 ± 0.03−10 ± 3.5
Each value represents the mean ± SD (n = 4). * value statistically different (p < 0.05) from empty liposomes at t0; § value statistically different (p < 0.05) from O. illyricum liposomes at t0.
Table 5. Entrapment efficiency (EE%) of the main phenolic compounds identified in O. illyricum extract.
Peak No.CompoundEE% ± SD
PG-PEVsLiposomes
Hydroxycinnamic acids
15-O-caffeoylquinic acid38.8 ± 5.4 a60.0 ± 2.5 b
21,3-Dicaffeoylquinic acid43.0 ± 6.7 a66.7 ± 3.4 b
3Feruloyl quinic acid A45.8 ± 4.8 a57.1 ± 7.8 a
53,4-Dicaffeoylquinic acid97.6 ± 5.0 a95.6 ± 9.8 a
63,5-Dicaffeoylquinic acid93.5 ± 4.3 a93.1 ± 6.1 a
7Dicaffeoylquinic acid B83.0 ± 5.6 a96.0 ± 7.8 a
81,5-Dicaffeoylquinic acid B88.2 ± 8.7 a77.8 ± 8.8 a
10Dicaffeoylsuccunoylquinic acid I B82.6 ± 3.5 a99.3 ± 5.5 b
114,5-Dicaffeoylquinic acid80.7 ± 4.9 a94.5 ± 4.8 b
12Dicaffeoylsuccunoylquinic acid II B77.3 ± 9.8 a69.6 ± 6.8 a
14Feruloyl caffeoyl quinic acid A89.2 ± 7.2 a100.3 ± 7.2 a
Flavonols
4Luteolin glucuronide C82.5 ± 6.1 a97.3 ± 2.7 b
13Hispidulin glucuronide D77.5 ± 5.1 a94.9 ± 5.5 b
A Dosed as ferulic acid equivalents. B Dosed as 1,3-di-O-caffeoylquinic acid equivalents. C Dosed as luteolin equivalents. D Dosed as hispidulin equivalents. Mean values within a line with different letters are significantly different at p ≤ 0.05. Data are given as means ± standard deviations (SD) (n = 4).
Table 6. In vitro antioxidant activity of O. illyricum formulations. For the DPPH assay, results are expressed as AA (antioxidant activity %) and TE (μg Trolox equivalents/mL solution); for the FRAP assay, results are expressed as FE (µg Fe2+ equivalents/mL solution).
FormulationDPPH AssayFRAP Assay
AA
(%)
TE
(µg Trolox Equivalents/mL)
FE
(µg Fe2+ Equivalents/mL)
O. illyricum solution94 ± 4.4673 ± 23445 ± 15
Empty liposomes39 ± 9.9262 ± 28186 ± 9
O. illyricum liposomes99 ± 0.3715 ± 3** 590 ± 19
Empty PG-PEVs39 ± 6.9265 ± 32186 ± 15
O. illyricum PG-PEVs99 ± 0.2716 ± 2** 560 ± 6
Results are reported as the mean ± SD of at least three separate experiments, each performed in triplicate. ** Values statistically different (p < 0.01) from the O. illyricum solution.
Table 7. Composition of the vesicle formulations.
FormulationP90G 1O. illyricum 2PG 3H2O
Empty liposomes90 mg----1 mL
O. Illyricum liposomes90 mg2 mg--1 mL
Empty PG-PEVs90 mg--0.1 mL0.9 mL
O. illyricum PG-PEVs90 mg2 mg0.1 mL0.9 mL
1 phospholipid; 2 O. illyricum extract; 3 propylene glycol.
Disclaimer/Publisher’s Note: The statements, opinions and data contained in all publications are solely those of the individual author(s) and contributor(s) and not of MDPI and/or the editor(s). MDPI and/or the editor(s) disclaim responsibility for any injury to people or property resulting from any ideas, methods, instructions or products referred to in the content.

