Article

Two Arabidopsis Splicing Factors, U2AF65a and U2AF65b, Differentially Control Flowering Time by Modulating the Expression or Alternative Splicing of a Subset of FLC Upstream Regulators

1
Division of Life Sciences, Korea University, 145 Anam-ro, Seongbuk-gu, Seoul 02841, Republic of Korea
2
Division of Life Sciences, Jeonbuk National University, 567 Baekje-daero, Deokjin-gu, Jeonju 54896, Jeollabuk-do, Republic of Korea
*
Author to whom correspondence should be addressed.
Plants 2023, 12(8), 1655; https://doi.org/10.3390/plants12081655
Submission received: 7 March 2023 / Revised: 7 April 2023 / Accepted: 11 April 2023 / Published: 14 April 2023

Abstract

:
We investigated the transcriptomic changes in the shoot apices during floral transition in Arabidopsis mutants of two closely related splicing factors: AtU2AF65a (atu2af65a) and AtU2AF65b (atu2af65b). The atu2af65a mutants exhibited delayed flowering, while the atu2af65b mutants showed accelerated flowering. The underlying gene regulatory mechanism of these phenotypes was unclear. We performed RNA-seq analysis using shoot apices instead of whole seedlings and found that the atu2af65a mutants had more differentially expressed genes than the atu2af65b mutants when they were compared to wild type. The only flowering time gene that was significantly up- or down-regulated by more than two-fold in the mutants were FLOWERING LOCUS C (FLC), a major floral repressor. We also examined the expression and alternative splicing (AS) patterns of several FLC upstream regulators, such as COOLAIR, EDM2, FRIGIDA, and PP2A-b’ɤ, and found that those of COOLAIR, EDM2, and PP2A-b’ɤ were altered in the mutants. Furthermore, we demonstrated that AtU2AF65a and AtU2AF65b genes partially influenced FLC expression by analyzing these mutants in the flc-3 mutant background. Our findings indicate that AtU2AF65a and AtU2AF65b splicing factors modulate FLC expression by affecting the expression or AS patterns of a subset of FLC upstream regulators in the shoot apex, leading to different flowering phenotypes.

1. Introduction

The shoot apical meristem (SAM) is formed together with the cotyledons during embryogenesis [1,2,3]. The SAM also undergoes a developmental switch from vegetative to reproductive phase, in which it produces floral meristems (FMs) that give rise to flowers [4]. The main pathways regulating the transition to flowering in Arabidopsis thaliana include the photoperiodic pathway, the autonomous pathway, the gibberellin pathway, the aging pathway, the ambient temperature pathway, and the vernalization pathway. The floral signals converge on the flowering integrators FLOWERING LOCUS T (FT) and SUPPRESSOR OF OVEREXPRESSION OF CONSTANS1 (SOC1) forming a flowering network that sequentially activates the floral meristem identity genes [4,5]. SOC1 is primarily involved in the upregulation of AGAMOUS-LIKE 24 (AGL24) in SAM during the transition to flowering, and AGL24 is also involved in the regulation of SOC1 [6,7]. SOC1 is also suppressed by FLOWERING LOCUS C (FLC), a flowering repressor [7]. Alternative splicing (AS) is a common and important mechanism of gene regulation in eukaryotes at posttranscriptional level such as mRNA stability, translation efficiency, and interactions with microRNAs [8]. It can also modulate gene expression in response to various developmental and environmental cues. Among the different types of AS events, intron retention (IR) is the most frequent and distinctive in Arabidopsis, accounting for more than 40% of all AS events [9,10,11]. AS is regulated by a complex network of splicing factors that bind to specific cis-elements on pre-mRNAs and interact with the spliceosome machinery.
Among several spliceosome members, the U2 small nuclear ribonucleoprotein (snRNP) auxiliary factor is a group of non-snRNPs involved in early splicing, including the large subunit U2 snRNP auxiliary factor 65kDa (U2AF65) and the small subunit U2 snRNP auxiliary factor 35kDa (U2AF35). In Arabidopsis, AtU2AF65a and AtU2AF65b and AtU2AF35a and AtU2AF35b are known as U2AF65 and U2AF35 counterparts, respectively [12,13,14]. In the E-complex assembly stage, U2AF65 interacts with U2AF35 after binding to the 3′ splice site, helping to recognize the branch site (BS) of splicing factor 1 (SF1), a branch point binding protein (BBP) [15,16,17]. Recognition of polypyrimidine tract (PPT) by U2AF65 can be promoted by serine-arginine (SR) protein [15,16].
It has been reported that defects in splicing factors cause abnormal flowering phenotypes in Arabidopsis [18]. For example, atu2af35 mutants show a late flowering phenotype [14], whereas atsf1 mutants show an early flowering phenotype [13]. In addition, atu2af65a and atu2af65b mutants exhibit late and early flowering phenotypes, respectively [12,19,20].
There is no clear difference in phenotype could be identified except for flowering time between the atu2af65a and atu2af65b mutants [12]. This is presumably due to functional redundancy between the two proteins, but these mutants also have opposite flowering time phenotypes. This characteristic can be found in members of various plant gene families. For instance, two isoforms of Arabidopsis SR45 proteins play distinct roles in floral and root development [21].
Previously, we found that FLOWERING LOCUS C (FLC) is a major determinant of the flowering time difference between the atu2af65a and atu2af65b mutants [12]. The FLC transcript levels are increased in the atu2af65a mutants but decreased in the atu2af65b mutants. However, we do not yet know how FLC transcript levels are differentially regulated in these two mutants. In this study, we examined the transcriptomes of these two mutants using RNA sequencing (RNA-seq) to compare their global expression patterns. This may lead to a better understanding of the flowering time differences between these two mutants. The AtU2AF65a and AtU2AF65b genes are expressed at higher levels in some parts of the plant, including the shoot apex, than in other parts [12,20]. Flowering time regulation may occur in two separate compartments of plants, the leaf and SAM. For example, photoperiod signals are integrated into FT gene expression in leaves and FT proteins are transported into the SAM to participate in gene regulation. In our previous study, we measured the FLC transcript levels using whole seedlings [12]. In this study, we examined shoot apices isolated from young seedlings rather than the whole seedlings for transcriptome analysis because FLC expression is much higher in shoot apex than in leaf [22].
Based on RNA-seq analysis of the shoot apices of wild-type (Col-0), atu2af65a and atu2af65b plants, this study provides evidence for how Arabidopsis AtU2AF65a and AtU2AF65b splicing factors play opposing roles in regulating flowering. Furthermore, pre-mRNA splicing defects were analyzed in a subset of genes, and their AS defects were identified using the replicate-multivariate analysis of transcript splicing (rMAT) statistical program [23].

2. Results

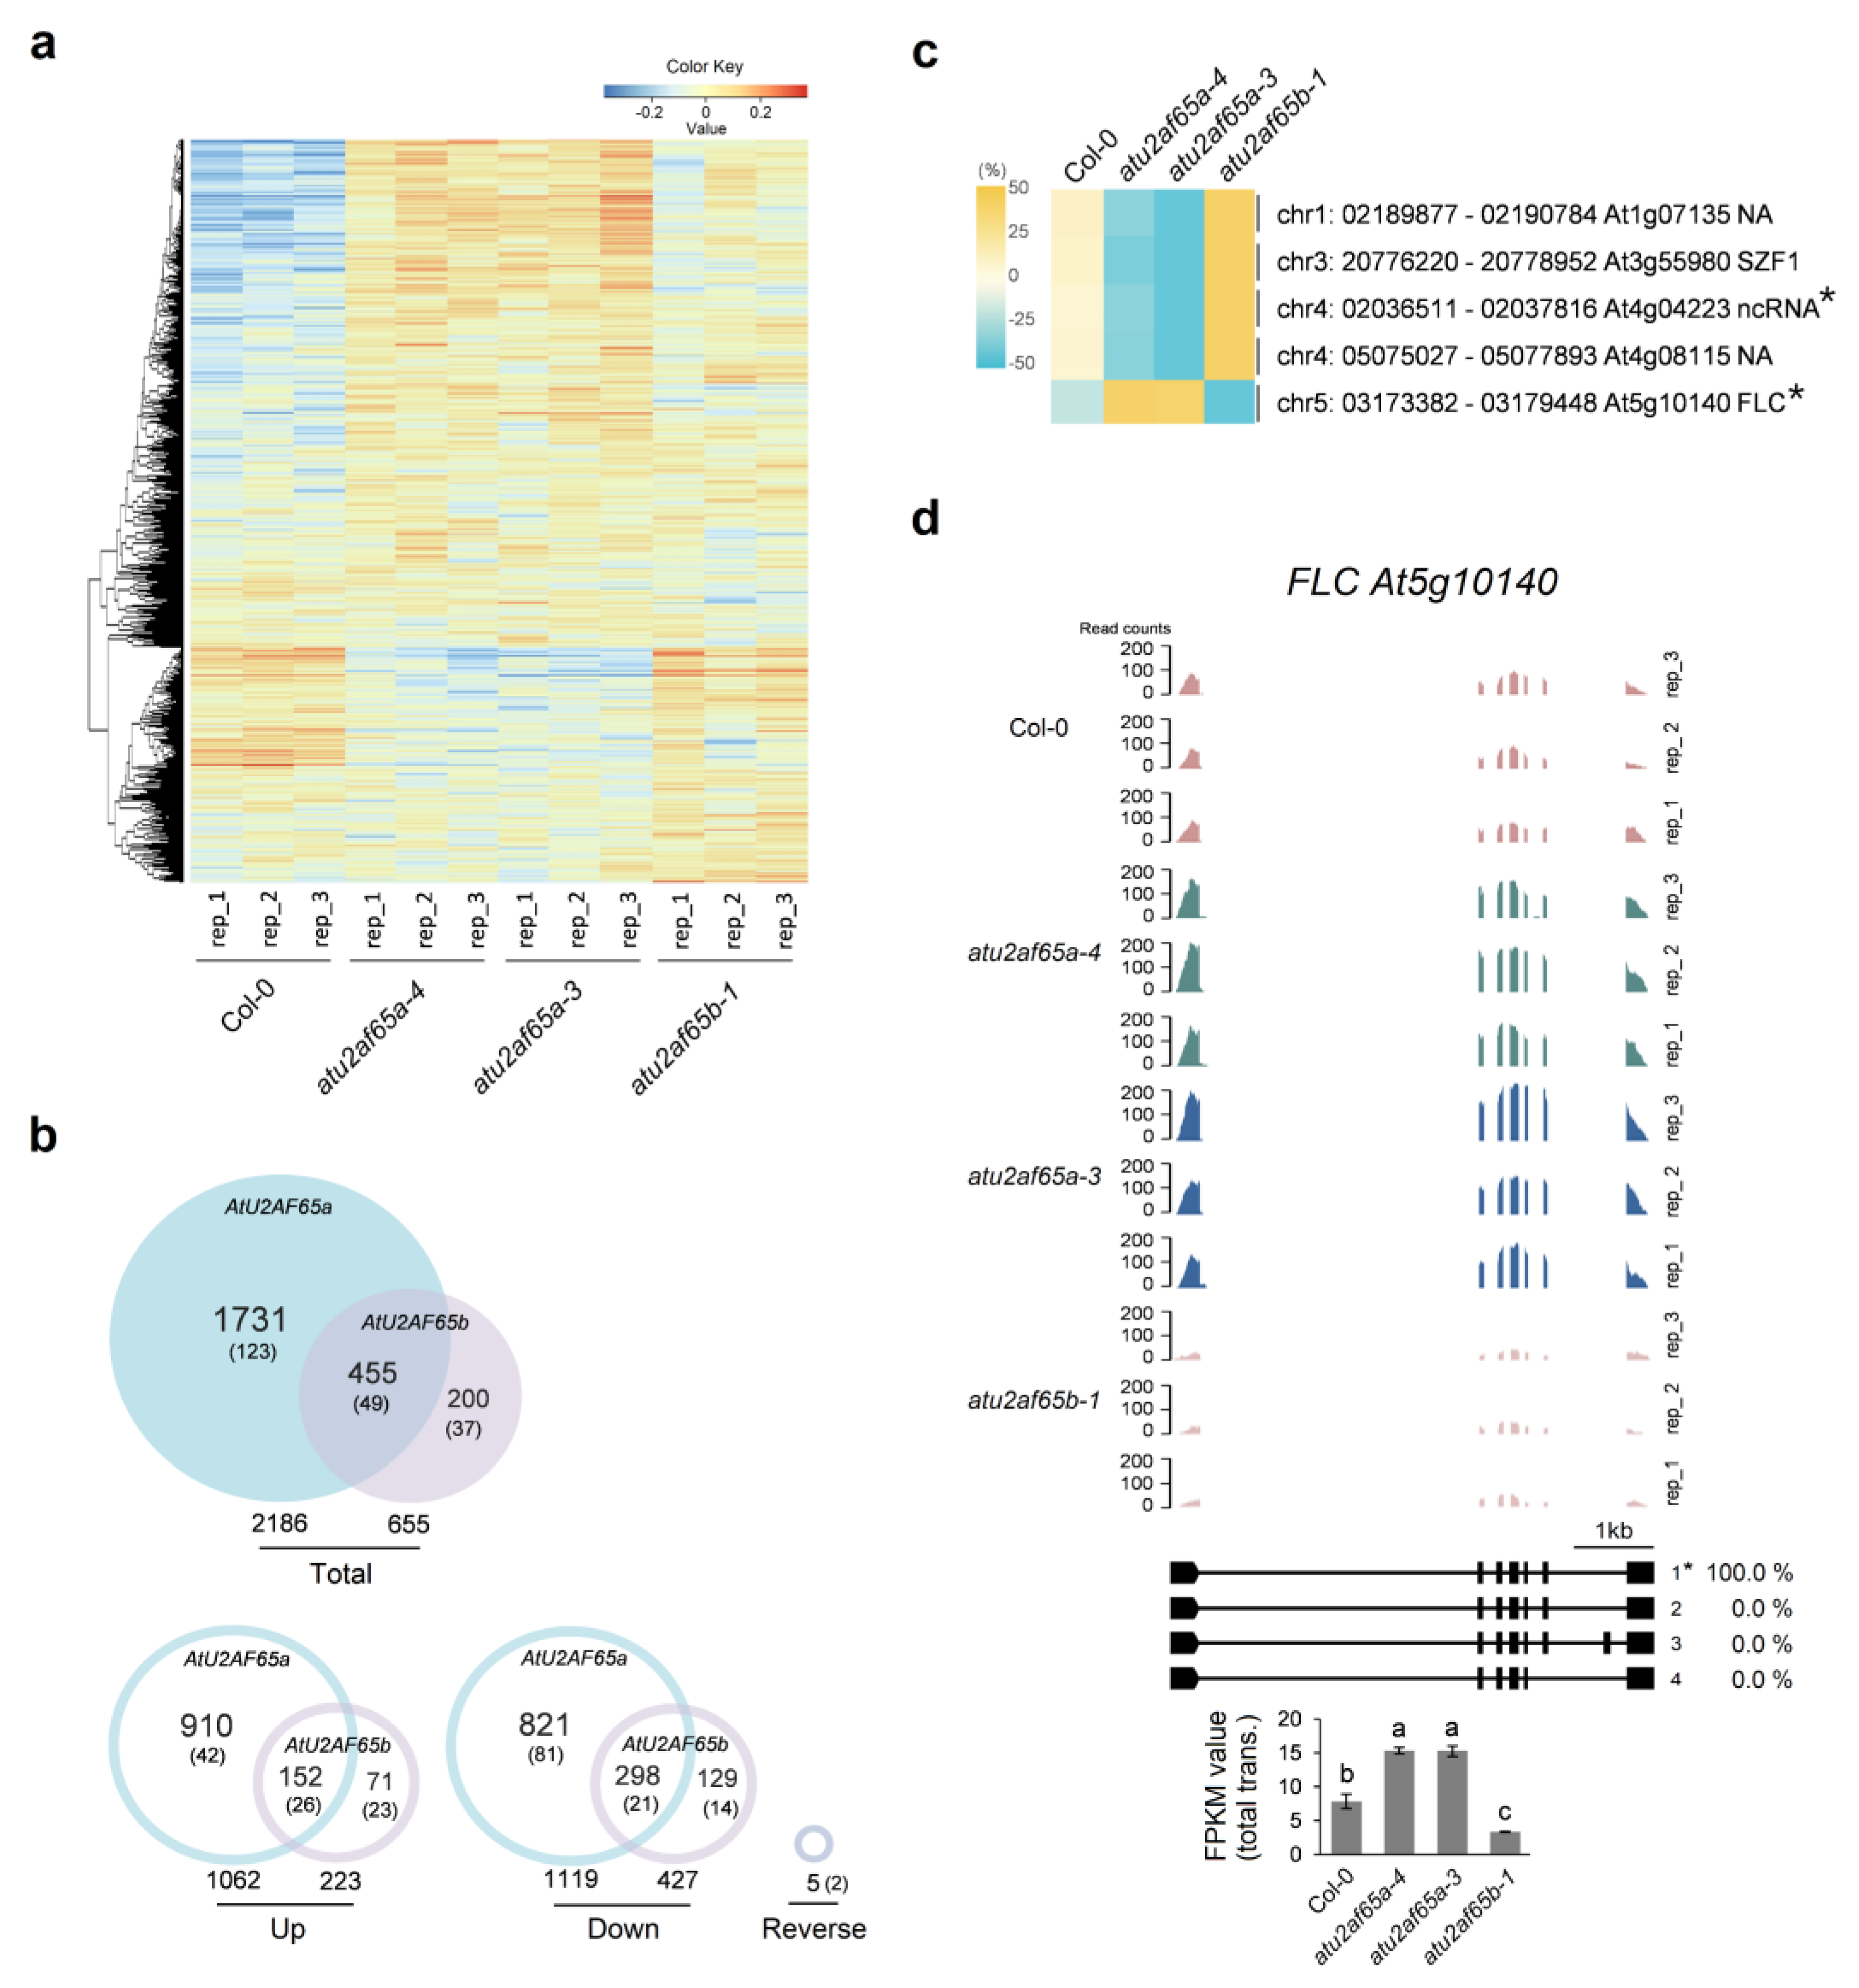
2.1. RNA Sequencing Analysis in the Shoot Apex-Enriched Samples of atu2af65a and atu2af65b Mutants

We previously revealed that two different AtU2AF65 proteins differentially regulate flowering time by modulating the expression of FLC [12]. To investigate the global-scale changes in expression levels affected by atu2af65a or atu2af65b mutation, we performed the RNA sequencing (RNA-seq) analysis in shoot apex (SA)-enriched samples of wild-type (Col-0), two atu2af65a and one atu2af65b mutant plants. These mutants were chosen based on our previous data for stronger phenotypes [12]. The atu2af65b mutants are the same mutant plants used in other laboratory for its transcriptome analysis [20]. We included it for comparison. Although the shoot apices were carefully isolated from 7-d-old seedlings, it is likely that the samples contained a small fraction of emerging leaves and primordia (Figure S1). Total RNA extracted from each sample was used for library construction and sequenced using Illumina protocols. After the removal of low-quality reads, approximately 38, 42, 44, and 45 million uniquely mapped reads were retained for further analysis from wild-type (Col-0), atu2af65a-4, atu2af65a-3, and atu2af65b-1 plants, respectively (Table S1). A heat map was constructed to identify significantly altered genes in the shoot apices of wild-type (Col-0), atu2af65a-4, atu2af65a-3, and atu2af65b-1 plants (FDR < 0.05) (Figure 1a and Figure S2). The overall transcriptome profiles of atu2af65 mutants showed distinct expression patterns compared to those of wild-type (Col-0) plants. Samples of two different T-DNA mutant alleles for AtU2AF65a gene were used for RNA-seq analysis, and 2186 genes showing similar expression patterns between the atu2af65a-4 and atu2af65a-3 mutants were selected and used as representatives of the genes affected by atu2af65a mutation for further analysis (Figure S3a). The expression of 2186 genes or 655 genes was affected by either atu2af65a or atu2af65b mutation, respectively, and the expression of 455 genes was affected by both atu2af65a and atu2af65b mutations (q-value < 0.05) although only 172 and 86 genes were affected by more than two-fold expression level changes in the atu2af65a and atu2af65b mutants, respectively (Figure 1b).
A total of 1062 and 1119 genes were up- and down-regulated by the atu2af65a mutation, respectively, whereas 223 and 427 genes were up- and down-regulated by the atu2af65b mutation, respectively (Figure 1b). These results showed that a similar number of genes were up- or downregulated in the atu2af65a mutants, whereas the number of downregulated genes in the atu2af65b mutants was more than two times that of the upregulated genes. Furthermore, compared to the atu2af65a mutation, the atu2af65b mutation affected a relatively smaller number of genes, especially the upregulated genes. A total of 152 upregulated and 298 downregulated genes were affected in both atu2af65a and atu2af65b mutants (Figure 1b). In other words, about 70% of genes affected by the atu2af65b mutation were also affected by the atu2af65a mutation. However, only about 14% upregulated genes and 27% downregulated genes affected by the atu2af65b mutation were also affected by atu2af65a mutation. These results showed that more genes appeared to be affected specifically by atu2af65a mutation, suggesting that the AtU2AF65a protein may have more specific target pre-mRNAs for its splicing function than the AtU2AF65b protein.
Only five genes, including FLC (At5g10140), were identified in the genes that were reversely regulated by either atu2af65a or atu2af65b mutation (Figure 1c,d and Figure S2c). Four genes, except FLC were downregulated by atu2af65a mutation, but upregulated by atu2af65b mutation (Figure 1c). Two genes, ncRNA (At4g04223) and FLC showed more than two-fold change in expression (Figure 1d and Figure S2c). These FLC expression patterns in the shoot apices of the atu2af65a and atu2af65b mutants were consistent with previous data generated from whole plants [8,16]. However, the function of other two genes are not known yet, but SZF1 (At3g55980) gene is known to be involved in salt stress resistance [24].
The gene ontology (GO) analysis indicated that several categories of genes were affected in the mutants. In particular, the photosynthesis process related category was significantly affected in atu2af65a mutants, whereas the hormonal response related process category was affected in atu2af65b mutants (Figure S4).

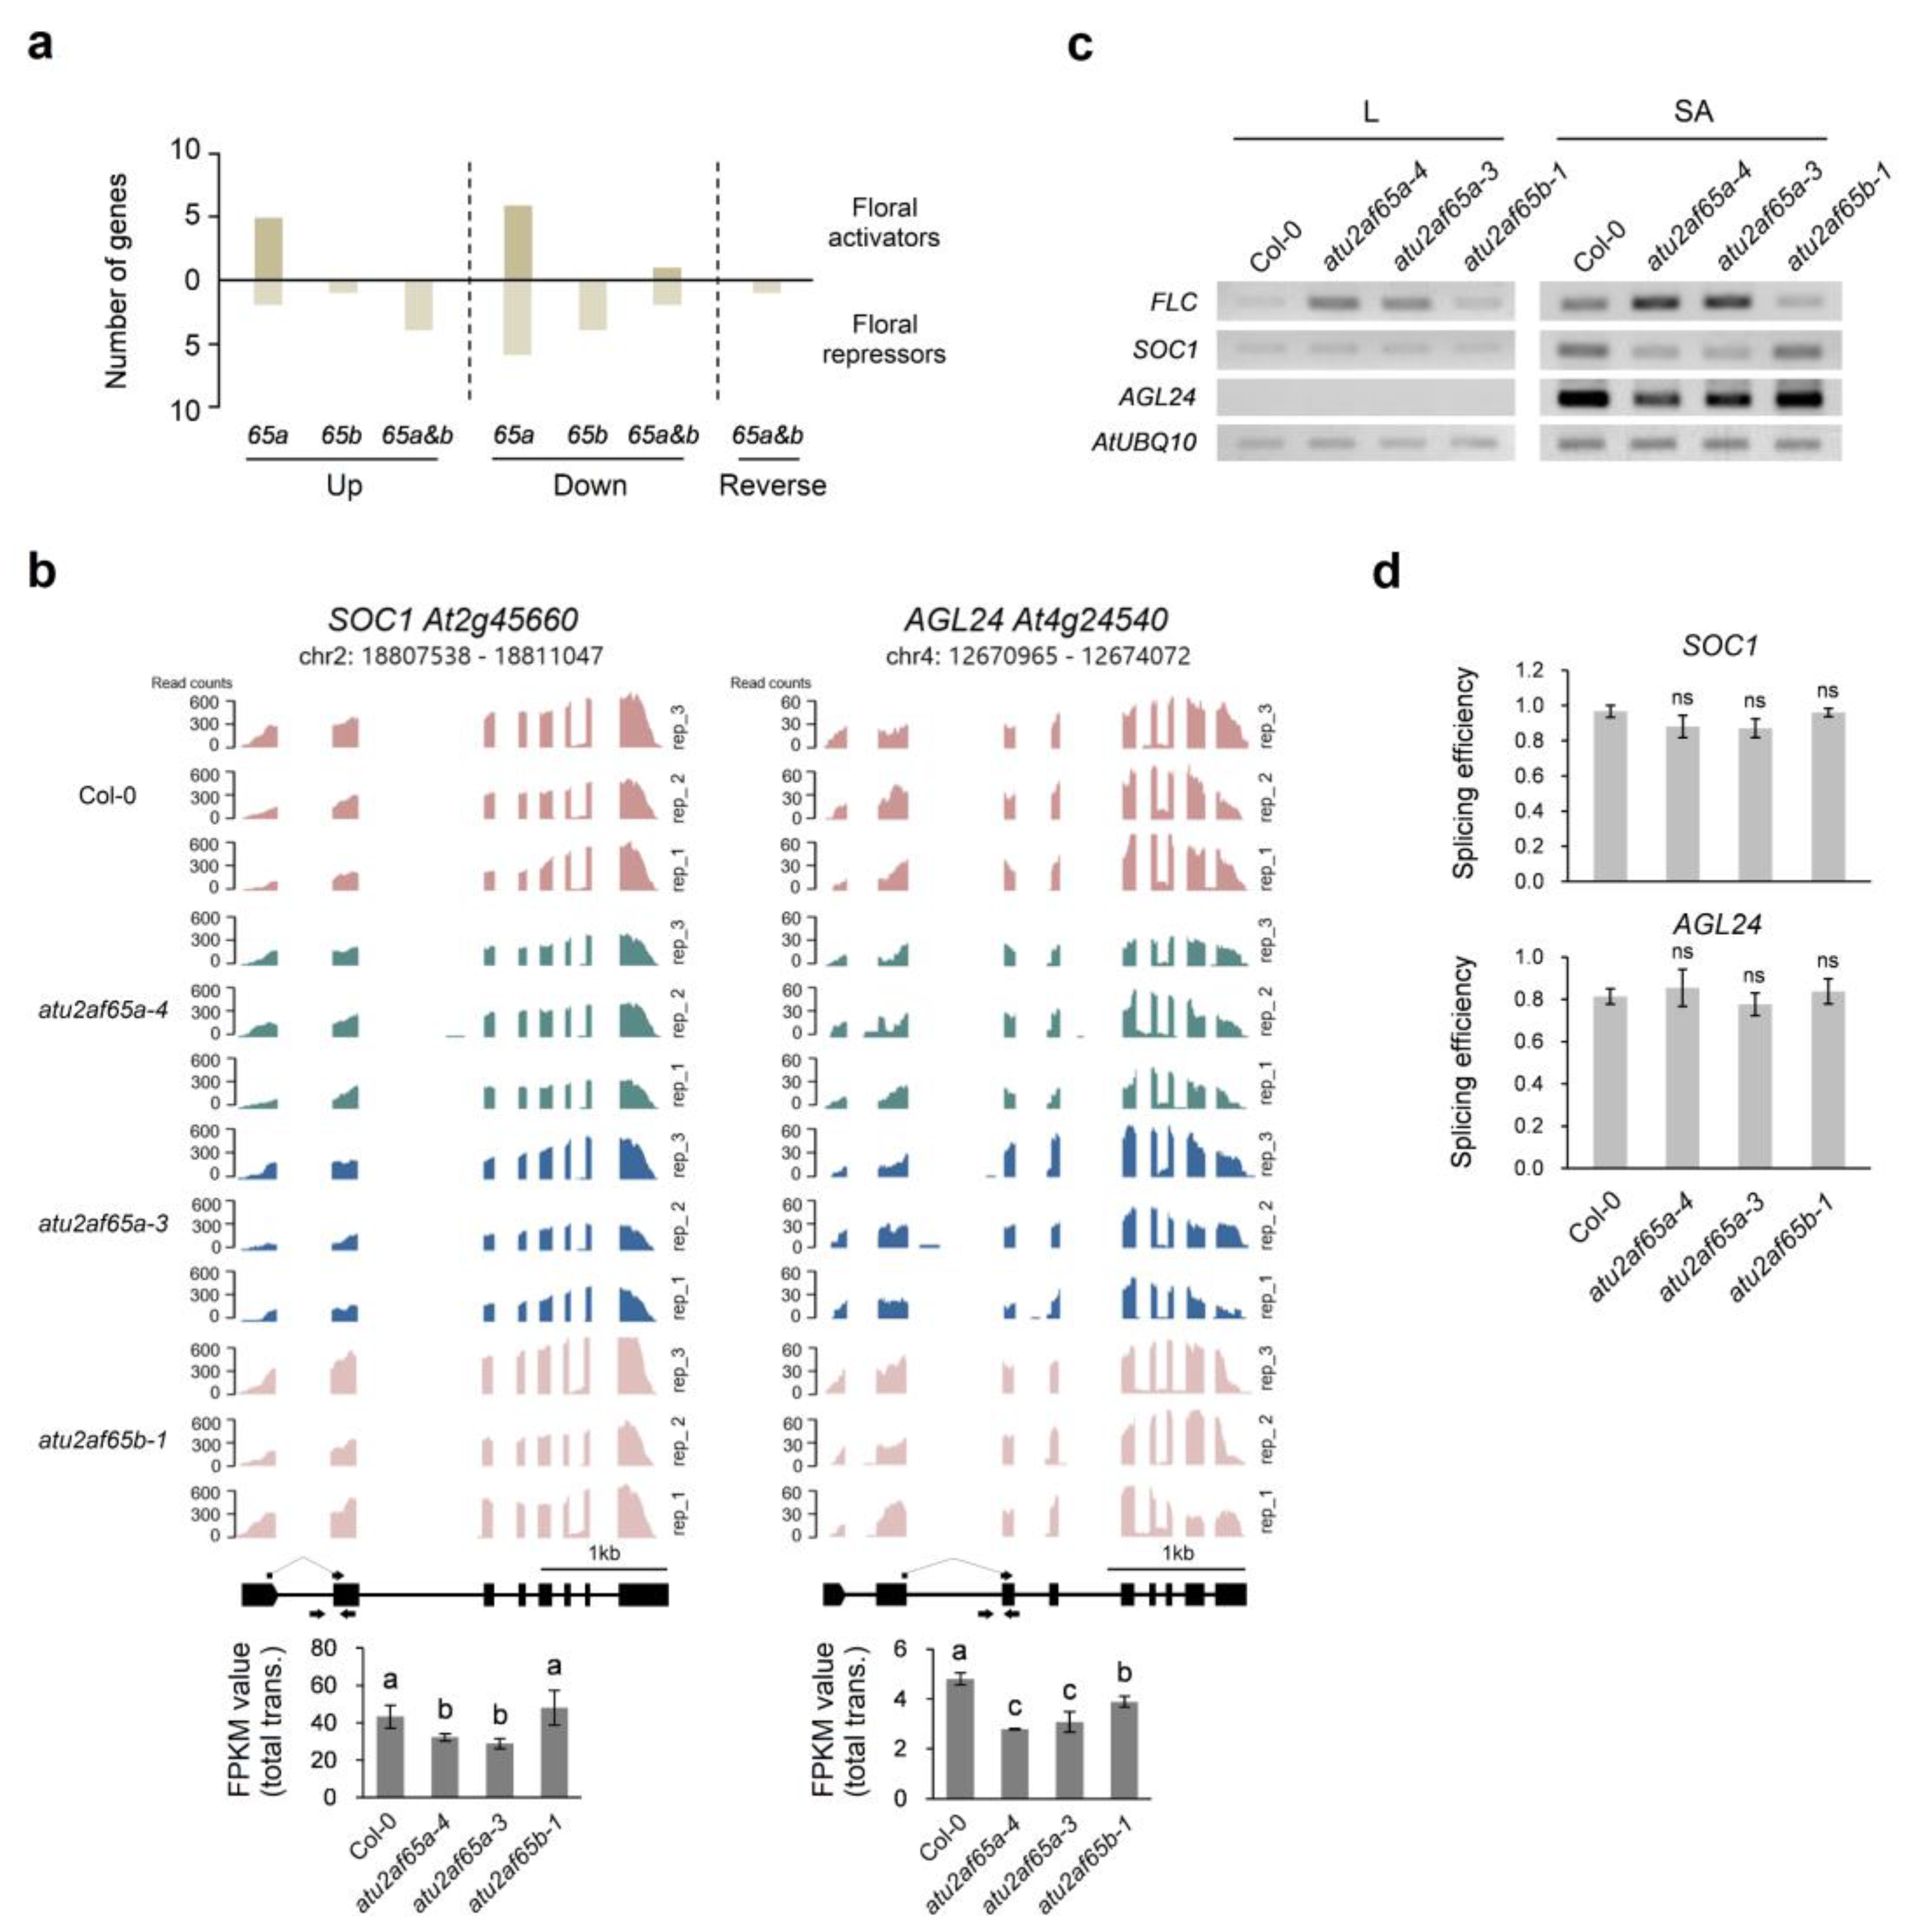
2.2. Downregulation of SOC1 and AGL24 Expression in the Shoot Apices of the atu2af65a Mutants Is Due to Upregulation of FLC Expression

Because FLC was the only flowering time gene showing a clear reverse regulation pattern in atu2af65a and atu2af65b mutants (Figure 1c,d and Figure S2c), we examined 306 genes known for flowering time control in the Flowering Interactive Database (FLOR-ID, http://www.phytosystems.ulg.ac.be/florid accessed on 10 April 2023) to identify the genes responsible for opposite FLC expression in these two mutants (Figure 2a). A total of 33 genes were found to be significantly misregulated, of which 12 and 20 were involved in promoting and suppressing flowering, respectively (Figure 2a, Tables S2 and S3). We could not find the interaction of these genes accountable for the flowering phenotype of both mutants, except in a few cases. For example, the downregulation of the SOC1 and AGL24 genes could be due to the upregulation of FLC in the atu2af65a mutants (Figure 2b). However, concomitant upregulation of SOC1 and AGL24 was not observed in the atu2af65b mutants (Figure 2b), although FLC expression was decreased (Figure 1c,d and Figure S2c). We also confirmed these expression patterns in the leaves (L) and shoot apices (SA) using semiquantitative RT-PCR analysis (Figure 2c). Downregulation of SOC1 and AGL24 was clearly detected in the shoot apices of the atu2af65a mutants. However, the upregulation of these two genes was not observed in the atu2af65b mutants, suggesting that the downregulation of FLC may differently regulate its downstream genes in the atu2af65b mutants. We found that other flowering time genes, such as SHORT VEGETATIVE PHASE (SVP), FLOWERING LOCUS M (FLM), and FLOWERING LOCUS D (FD), were not affected by either atu2af65a or atu2af65b mutation (Figure S5).
Since AtU2AF65 proteins are splicing factors, we also examined pre-mRNA splicing defects at the chromatin-bound (CB)-RNA level in the nuclear RNA fraction, which is known to detect co-transcriptional splicing defects [26]. We established the isolation method of total RNA first, and then isolated the cytoplasmic and nuclear RNA fractions from 7-d-old wild-type (Col-0) whole seedlings. The 28S and 18S rRNA bands were confirmed to be much less enriched in nuclear RNA but unspliced FLC RNA and the highest enrichment of miR167a were found in this fraction (Figure S6). To investigate the expression patterns of the pre-mRNA levels of both SOC1 and AGL24 genes, total RNA and cytoplasmic and nuclear RNA fractions from the shoot apices of 7-d-old wild-type (Col-0), atu2af65a-4, atu2af65a-3, and atu2af65b-1 plants were isolated. However, we could not detect significant changes in the pre-mRNA levels of both SOC1 and AGL24 genes in these two mutants using semi-quantitative RT-PCR and RT-qPCR analyses (Figure 2d and Figure S7), suggesting that the misregulation of these two genes in the atu2af65a mutants is probably due to the upregulation of their direct upstream regulator, FLC, and not splicing defects of SOC1 and AGL24 pre-mRNAs directly by AtU2AF65a. The elevated expression of FLC in whole seedlings of the atu2af65a mutants is mostly due to the upregulation of other FLC-specific regulators such as the FRIGIDA (FRI) complex or autonomous genes [12]. However, the changes in their expression were not detectable in the shoot apices of the atu2af65a mutants (Figure S8), indicating that the FLC expression may be regulated differently in the shoot apex regions.
We have previously shown that the flowering phenotypes of atu2af65a and atu2af65b mutants were maintained at lower growth temperatures [8]. In this study, we have constructed the double mutants with flc-3 mutants to provide genetic evidence that the flowering phenotypes of these two mutants are due to change in their FLC expression. Genetic analysis of the atu2af65a or atu2af65b mutants with flc-3 mutants also indicated that flc mutation suppressed partially the flowering phenotype of atu2af65a or atu2af65b mutants at 10, 16, and 23 °C (Figure 3), suggesting that FLC plays a role in determining the flowering phenotype of these two mutants even at different temperatures.

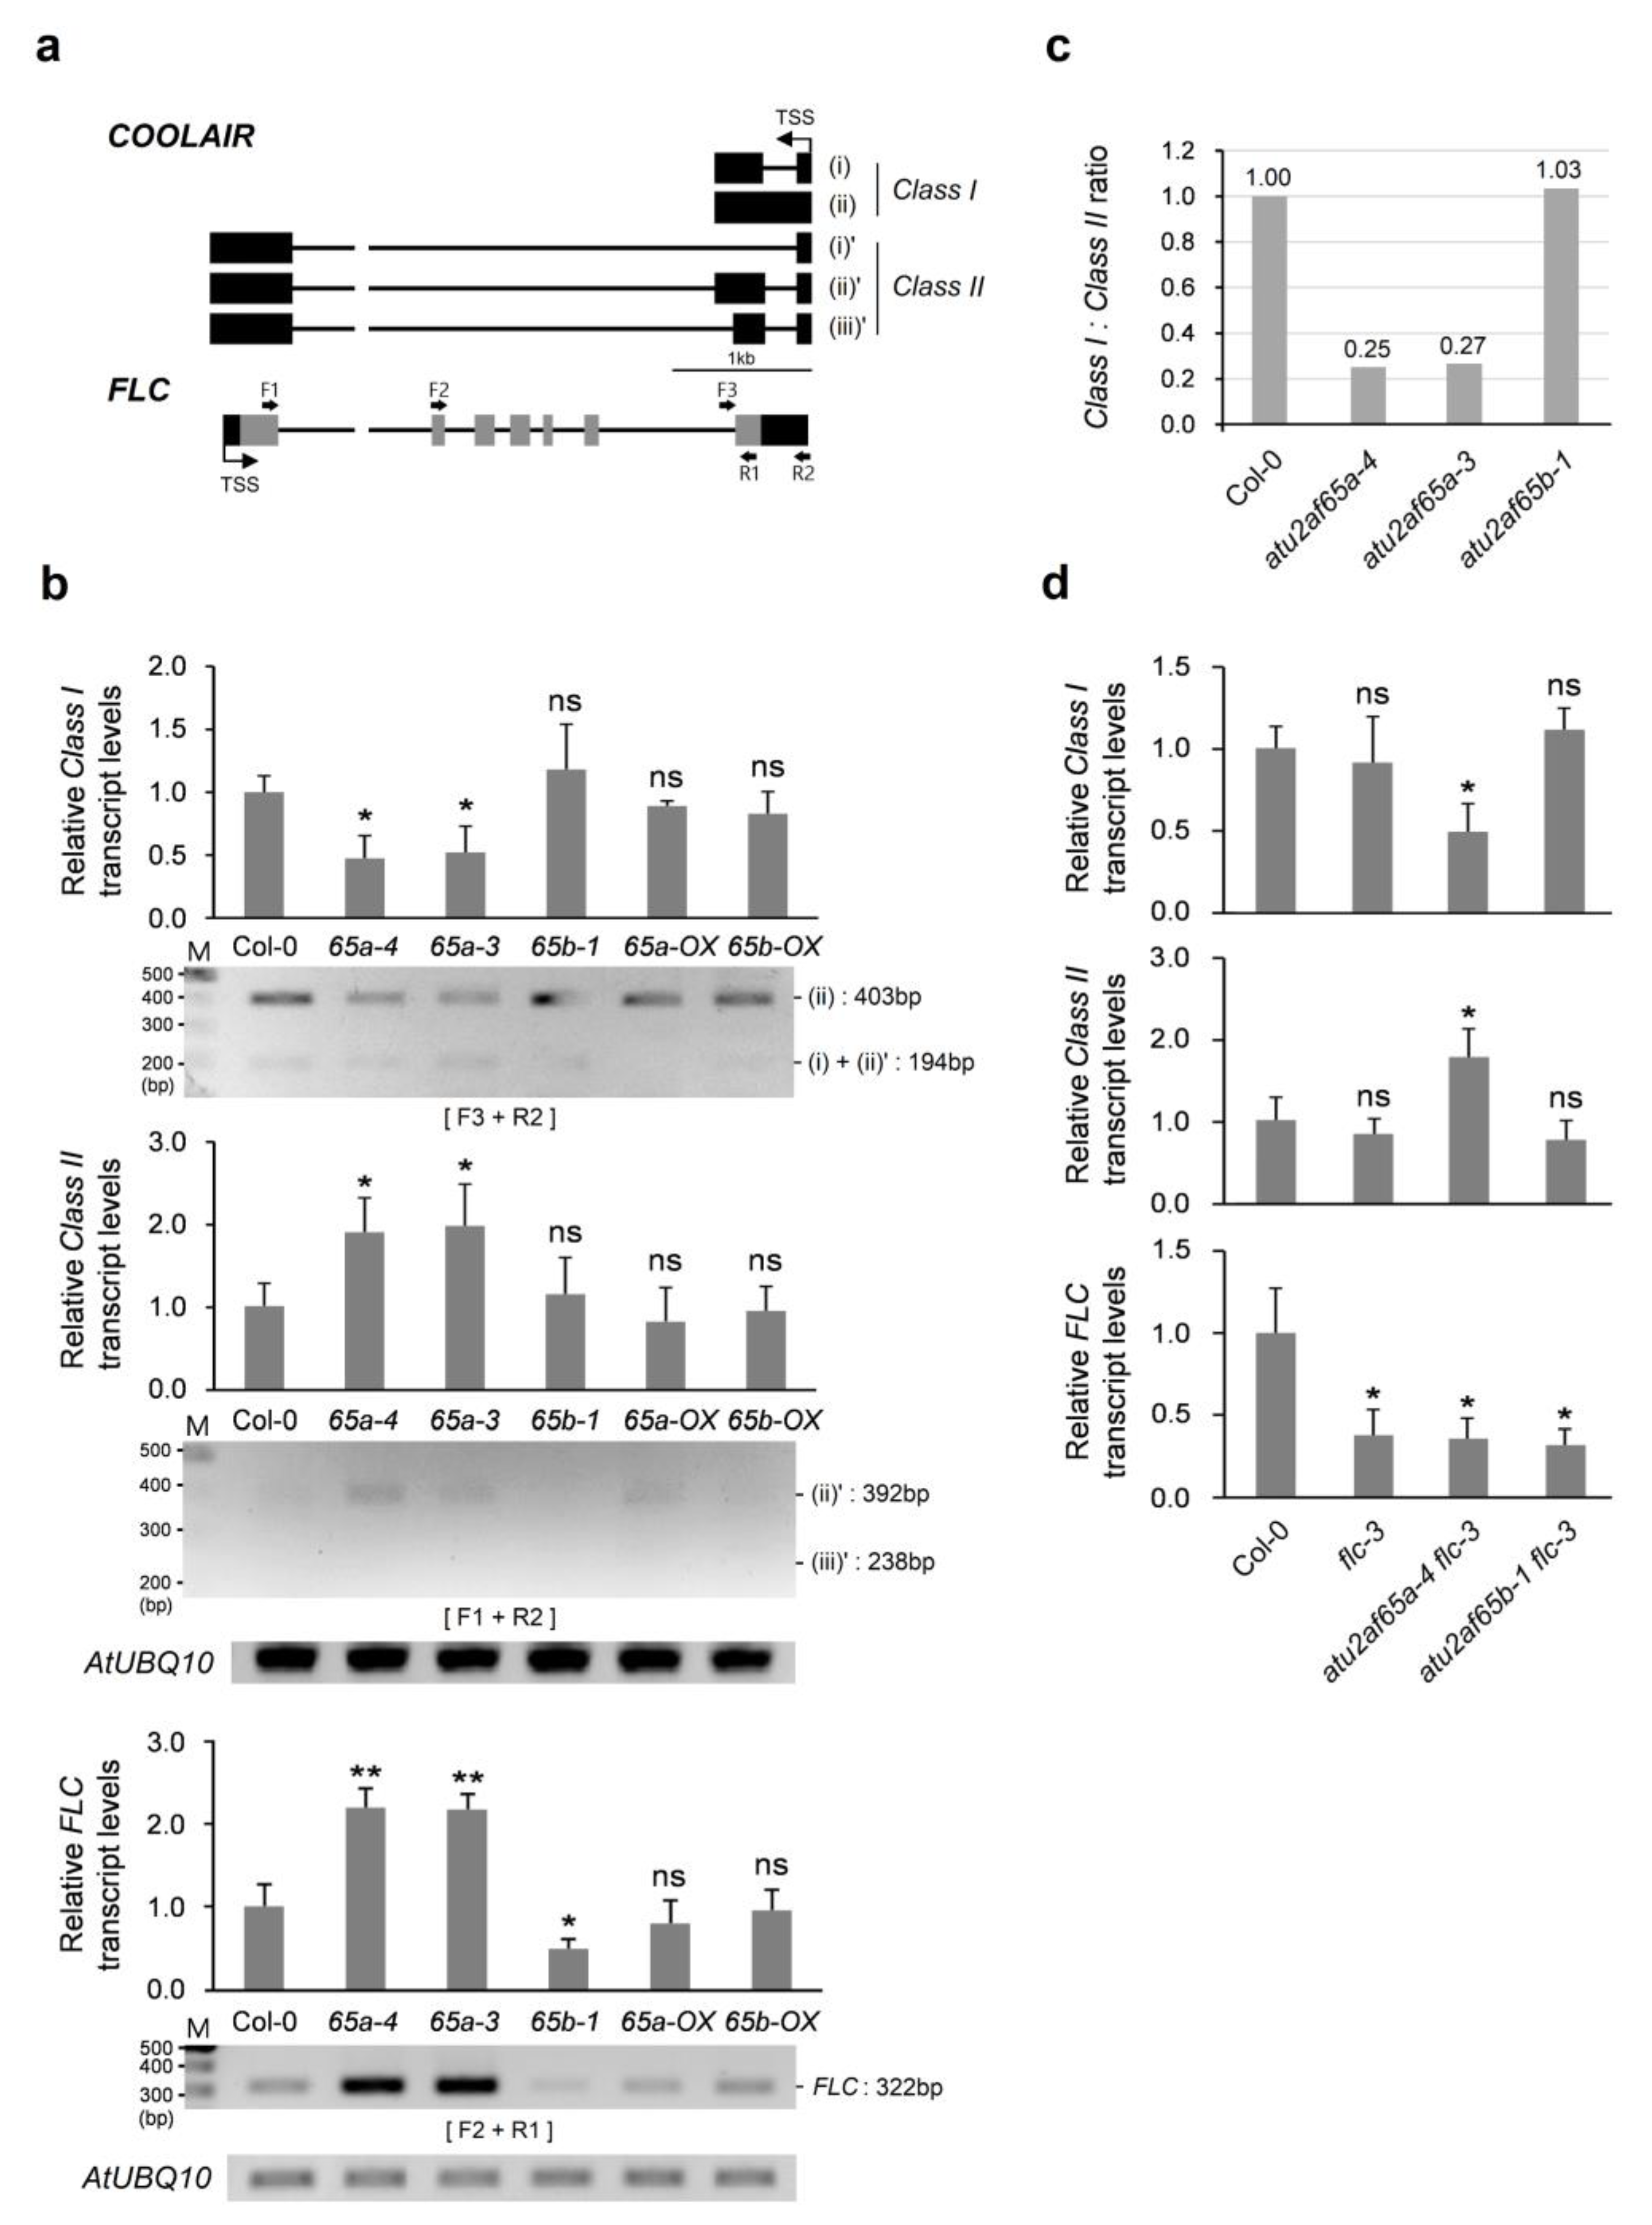
2.3. COOLAIR Is Involved in Misregulation of FLC Expression in the Shoot Apices of the atu2af65a Mutants

Since we could not find significant changes in the expression of the well-known FLC upstream regulators, such as FRIGIDA (FRI) complex genes in the shoot apices of the atu2af65a mutants, other genes were examined as possible causes of FLC expression in the mutants. COOLAIR long non-coding RNAs (lncRNAs), upstream regulators of FLC are antisense transcripts involved in FLC chromatin silencing and transcriptional repression [27,28]. COOLAIR RNAs are classified into Class I (proximal isoforms of COOLAIR) and Class II (distal isoforms of COOLAIR) according to the position where polyadenylation occurs by 3′-end processing factors [27,29,30]. Each Class of COOLAIR consists of alternatively spliced (AS) transcripts (Figure 4a). The expression patterns of COOLAIR Class I and II in atu2af65a and atu2af65b mutants were examined by using semi-quantitative RT-PCR and RT-qPCR analyses. A decrease in COOLAIR Class I (ii) and an increase in COOLAIR Class II (ii)’ were found in atu2af65a-4 and atu2af65a-3 mutants (Figure 4b), suggesting that FLC level changes in the atu2af65a mutants were concomitant with COOLAIR level changes. Furthermore, the ratio of COOLAIR Class I vs. Class II in atu2af65a, but not in atu2af65b, was approximately 0.26, indicating reduced usage of the COOLAIR proximal poly(A) site and increased use of the distal site (Figure 4c). However, there were no significant changes in COOLAIR transcripts (Class I and II) in atu2af65b-1 mutants (Figure 4b,c). Furthermore, overexpression of AtU2AF65a or AtU2AF65b did not affect COOLAIR transcript levels (Figure 4b). We also examined the expression of COOLAIR transcripts (Class I and II) in atu2af65a-4 flc-3 and atu2af65b-1 flc-3 double mutants. The expression patterns of decrease in COOLAIR Class I and increase in COOLAIR Class II were observed in the atu2af65a-4 flc-3 double mutants, but not in the flc-3 single and atu2af65b-1 flc-3 double mutants (Figure 4d), suggesting that AtU2AF65a may affect the regulation of COOLAIR expression.
Other splicing factors, such as PRP8 and NSRa, are known to be involved in COOLAIR-dependent FLC expression [30,31,32]. To examine the possible direct effect of PRP8 and NSRa proteins contributing to the expression pattern changes of COOLAIR transcripts, we examined their expression in atu2af65a and atu2af65b mutants. Only PRP8 expression increased slightly in atu2af65a and atu2af65b mutants (Figure S9), which did not match the decrease in COOLAIR Class I. No differences were observed in the expression of FPA and NSRa (Figure S9). These results suggest that the change in the pattern of COOLAIR expression in atu2af65a mutants is due to the direct effect of AtU2AF65a protein deficiency.

2.4. EDM2 and PP2A-b’ɤ Genes Are Involved in Change in FLC Expression in the atu2af65a or atu2af65b Mutants

Our RNA-seq data revealed that only a limited number of abnormal splicing events were altered in either atu2af65a or atu2af65b mutants (Table S1). This suggests that most of the co-transcriptional splicing defects in these mutants are probably undetected because of degradation by RNA surveillance systems, such as nonsense-mediated decay [33]. Because of the changes detected in the expression of the COOLAIR transcripts in the atu2af65a mutants (Figure 4), the expression of EDM2 (At5g55390) and PP2A-b’ɤ (At4g15415), which are known to be upstream negative regulators of FLC expression, were also examined [34,35]. RT-qPCR analysis revealed a decrease in expression of EDM2 and PP2A-b’ɤ in the atu2af65a mutants, suggesting that the decreased expression of two genes could explain up-regulation of FLC expression in the atu2af65a mutants (Figure 5a). These changes in expression were also observed in atu2af65a-4 flc-3 double mutants (Figure 5b). Furthermore, RNA-seq data revealed that the relative ratio of AS transcripts for each gene was differentially changed in both mutants (Figure 5c). In the atu2af65a mutants, only PP2A-b’ɤ gene showed significant change in AS, whereas both genes showed significant change in the atu2af65b mutants (Figure 5c). AS occurs in the 5′UTR regions of both EDM2 and PP2A-b’ɤ pre-mRNAs, resulting in identical proteins but possibly different translation efficiencies. The AS patterns of these genes were affected by atu2af65a or atu2af65b mutation. In atu2af65a mutant, EDM2 AS is unchanged but PP2A-b’ɤ AS is altered, suggesting that PP2A-b’ɤ AS may influence FLC expression. In atu2af65b mutant, both EDM2 and PP2A-b’ɤ AS were changed, but EDM2 AS change was more significant than PP2A-b’ɤ AS change. However, the total EDM2 transcript level was not affected by atu2af65b mutation, implying that its AS change may have a minor effect on FLC expression (Figure S11). These results suggest that differential expression changes in AS transcripts of two genes in atu2af65a and atu2af65b mutants may affect FLC expression, leading to opposite flowering times in these mutants.

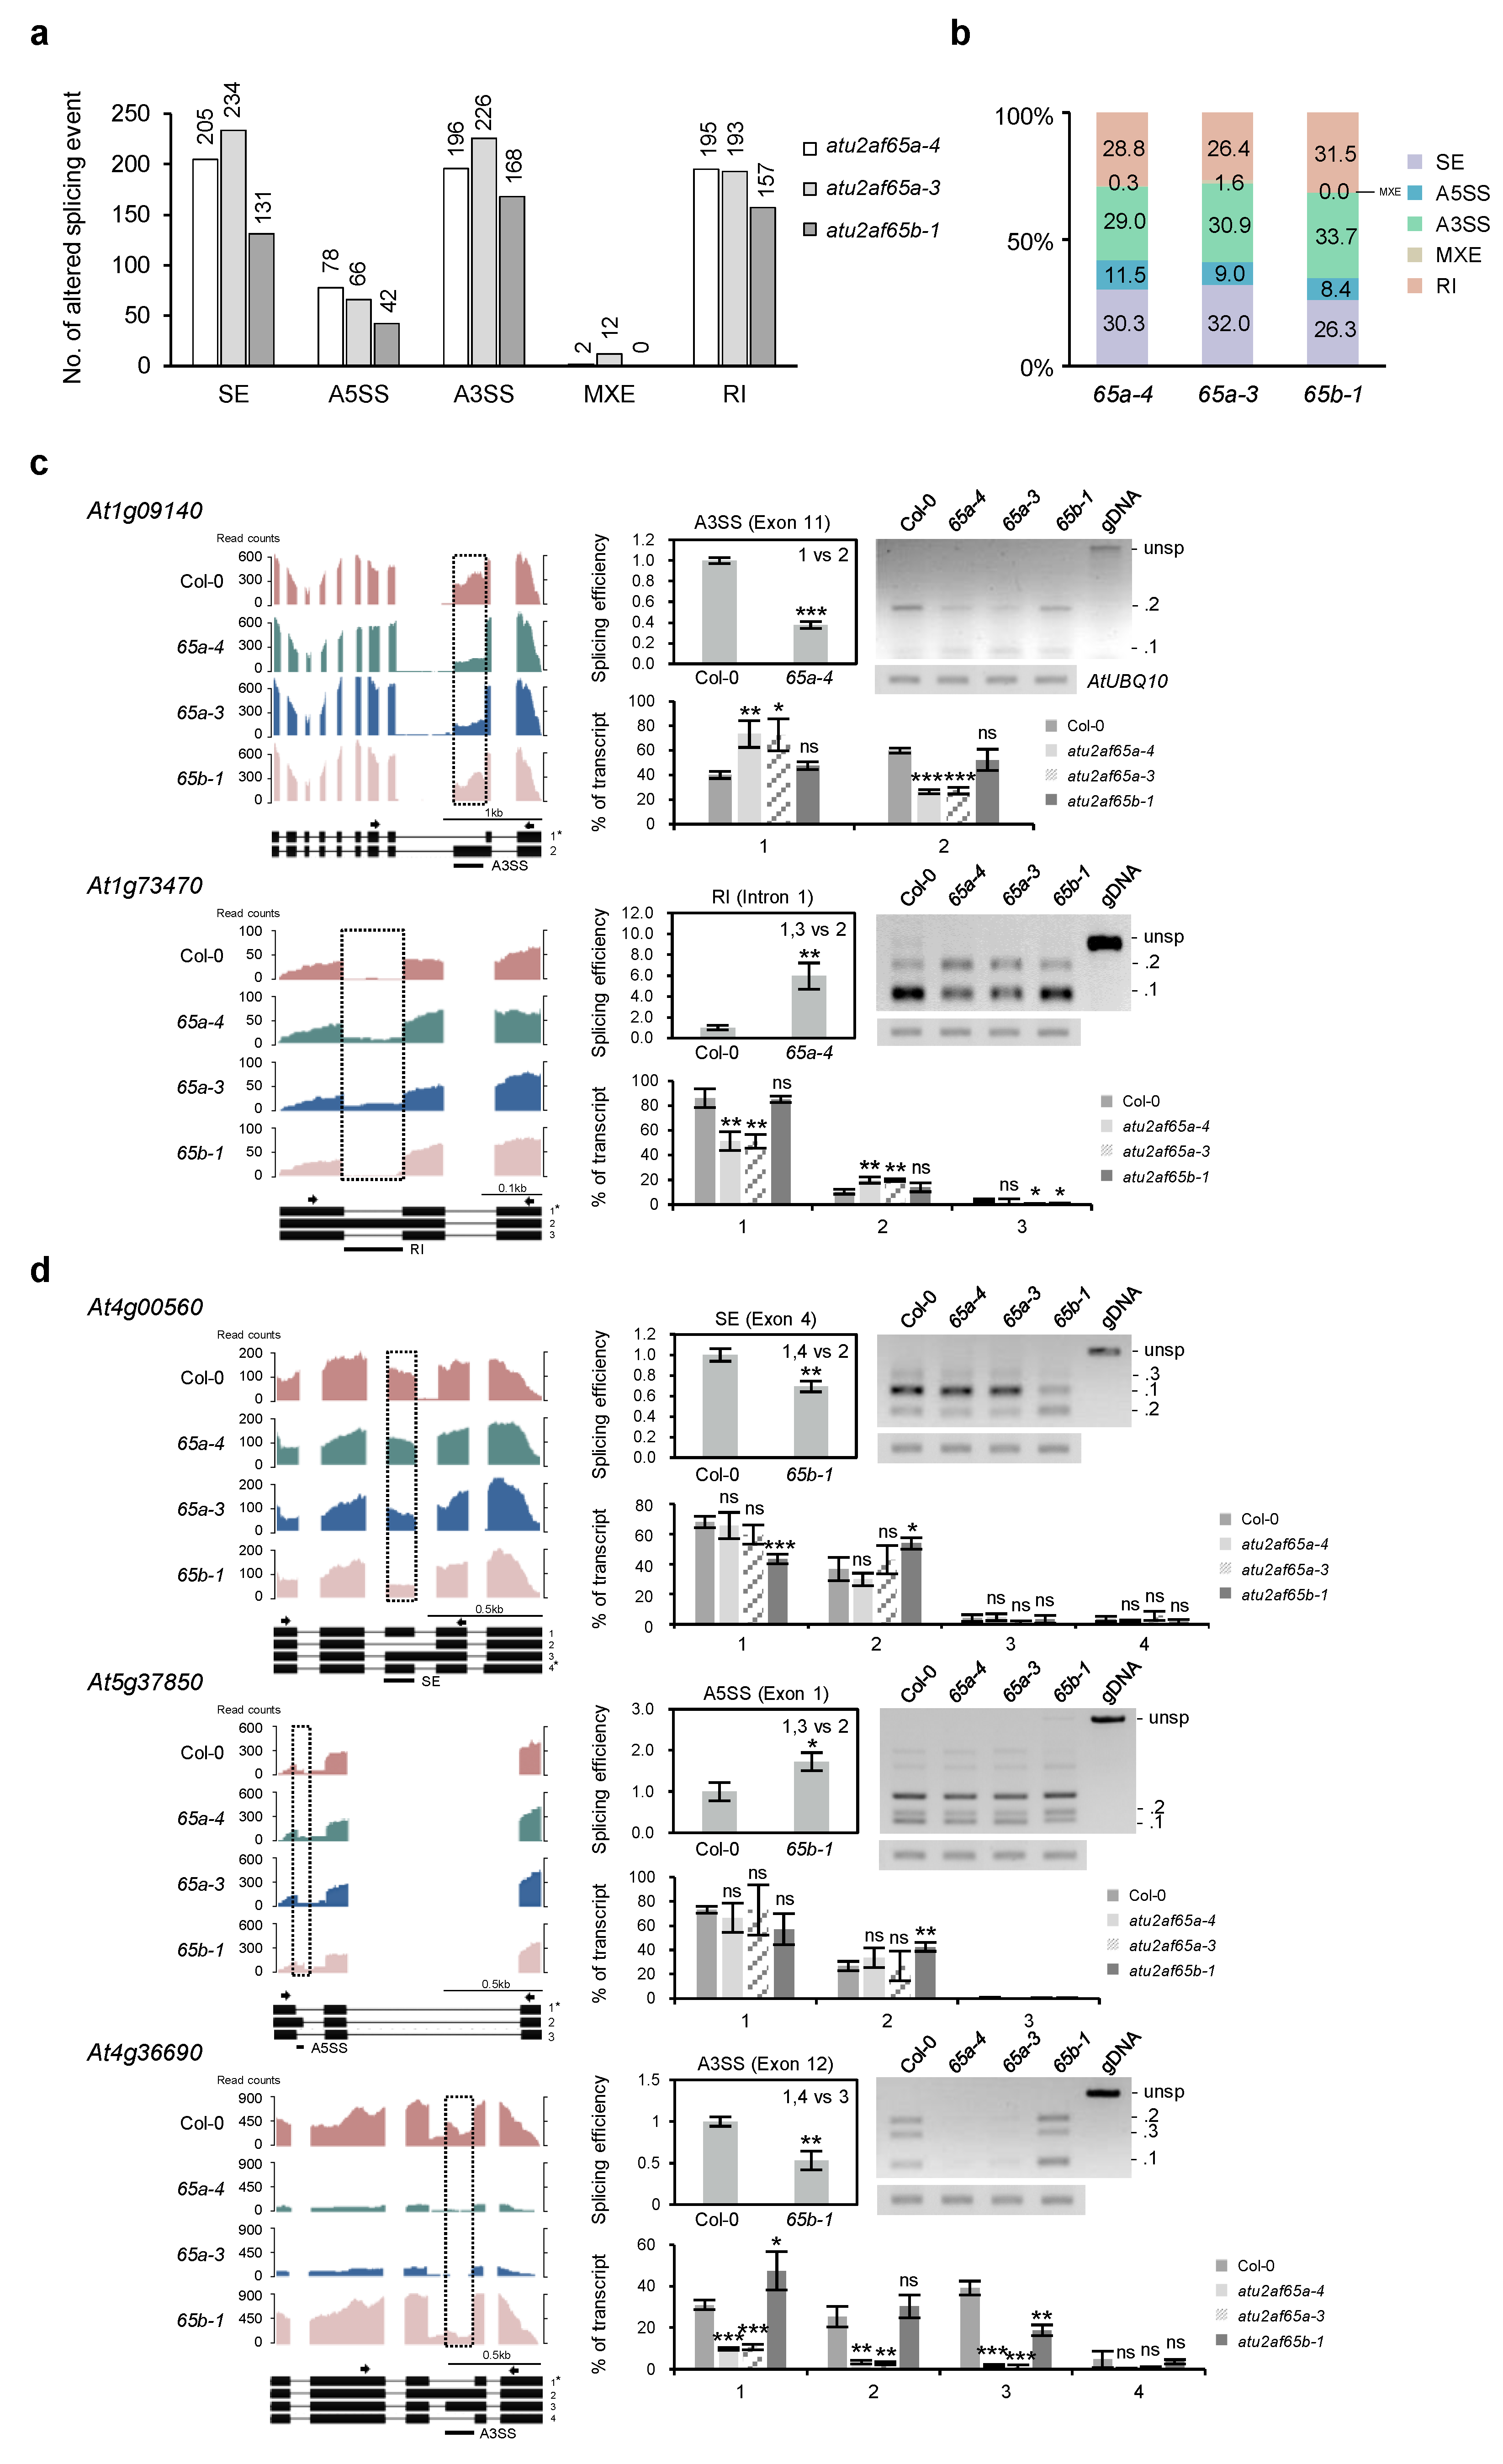
2.5. Global-Scale Changes in Splicing Events in the atu2af65a and atu2af65b Mutants

In addition to the pre-mRNA splicing events of flowering time genes, the global profiling of splicing events in shoot apices of wild-type (Col-0), atu2af65a-4, atu2af65a-3, and atu2af65b-1 plants were also examined. Altered splicing events detected by the statistical program rMAT in RNA-seq data were examined. Compared to Col-0, we found changes in all five types of AS events in atu2af65 mutants (Figure 6a,b): (1) skipped exon (SE), (2) alternative 3′ splice site (A3SS), (3) retained intron (RI), (4) alternative 5′ splice site (A5SS), and (5) mutually exclusive exons (MXE). The number of altered AS events in the mutants ranged from 0 to 234 depending on the AS type (Figure 6a). The number of altered AS events in atu2af65a mutants was higher than that in atu2af65b-1 mutant. For example, there were 205 altered splicing events for the SE type in the atu2af65a-4 mutant but in atu2af65b-1 mutant there were only 131 events. The total number of altered splicing events was 676 in the atu2af65a-4 mutant and 498 in atu2af65b-1 mutant. These results indicate that atu2af65a mutation may affect global-scale splicing events to a greater extent than atu2af65b mutation. However, both atu2af65a and atu2af65b mutations showed similar patterns for the proportion of all altered AS types, indicating that the two mutations have similar impacts on the distribution of altered AS types (Figure 6b).
The differentially expressed genes (DEG, p-value < 0.05) of AS genes affected by either the atu2af65a-4 or atu2af65b-1 mutation were compared. The results of rMAT analysis showed that 37 and 15 genes contained AS transcripts that were significantly affected by atu2af65a or atu2af65b mutations, respectively (Table S4).
To confirm the alterations in splicing events shown in Table S4, we selected five genes (At1g09140, At1g73470, At4g00560, At5g37850, and At4g36690) and examined their expression levels and splicing efficiencies in atu2af65a-4 and atu2af65b-1 mutants using semi-quantitative RT-PCR and RT-qPCR analyses. In atu2af65a-4 mutants, At1g09140 and At1g73470 showed misspliced types of A3SS and RI, respectively (Table S4). We found that the altered A3SS form (At1g09140.2) decreased, and the intron retention (RI) form (At1g73470.2) increased in only atu2af65a-4 mutants (Figure 6c). In atu2af65b-1 mutants, At4g00560, At5g37850, and At4g36690 showed one or two misspliced AS types (Table S4). We found that the SE form (At4g00560.2) and altered A5SS form (At5g37850.2) increased, and the altered A3SS form (At4g36690.3) decreased in only atu2af65b-1 mutants (Figure 6d). These results indicate that atu2af65a and atu2af65b mutations lead to different splicing events at the global scale.

2.6. Alternative Splicing of AtU2AF65a Pre-mRNA could Be Altered Similarly by Mutations in AtU2AF65b and AtSF1 Genes as Well as Lower Ambient Growth Temperature

Global-scale splicing pattern analysis showed that the functional AtU2AF65a form (At4g36690.1) was increased in the shoot apices of atu2af65b mutants. Therefore, the expression of two AtU2AF65a alternatively spliced (AS) forms (At4g36690.1 and At4g36690.3) in whole seedlings of wild-type (Col-0), atu2af6a-4, atu2af65b-1, and atsf1-2 plants were also examined. We found that the functional AtU2AF65a form (At4g36690.1) increased in the atu2af65b-1 and atsf1-2 mutants, whereas the other spliced form (At4g36690.3) decreased (Figure 7a). This suggests that functional deficiency of AtU2AF65b and AtSF1 proteins may cause an increase in AtU2AF65a protein levels to compensate for their loss in pre-mRNA splicing machinery. Because differences in ambient temperature affect the splicing patterns of splicing factors [19], the expression of the three AtU2AF65a spliced forms (At4g36690.1, At4g36690.2, and At4g36690.3) and one AtU2AF65b transcript (At1g60900.1) in whole seedlings of wild-type (Col-0), and atu2af6a-4, atu2af65b-1, and atsf1-2 mutants grown at different ambient temperatures (23 °C and 16 °C) was investigated. A lower temperature (16 °C) induced an increase in the functional AtU2AF65a form (At4g36690.1) and a decrease in the spliced form (At4g36690.3) (Figure 7b). It also decreased AtU2AF65b transcript levels in wild-type (Col-0) (Figure 7b). That is, the lower temperature condition mimicked the effect of the atu2af65b mutation. Similar changes were detected in the relative ratio of the two AtU2AF65a spliced forms (At4g36690.1 and At4g36690.3) in the atu2af65b-1 and atsf1-2 mutants at lower temperatures (Figure 7b). However, no AtU2AF65b splicing alteration (At1g60900.1) was observed in the atu2af65a-4 and atsf1-2 mutants (Figure 7c). These results suggest a shared compensation mechanism under these conditions.

3. Discussion

There are many examples of functional differentiation among members of the plant gene family. For example, FT promotes flowering in Arabidopsis, whereas TERMINAL FLOWER 1 (TFL1), its homolog, inhibits flowering [36]. Likewise, it is known that AtU2AF65a promotes flowering, whereas AtU2AF65b, its homolog, inhibits flowering in Arabidopsis [12,20]. In a previous study, we found that the expression patterns of FLC and FT genes are major factors in determining the flowering phenotypes of the atu2af65a and atu2af65b mutants [12]. In the present study, we performed RNA-seq analysis to compare global gene expression patterns of these two mutants. In the case of atu2af65a mutants, two mutant alleles were investigated, and approximately 77% of all genes showed abnormal expression in both (Figure 1 and Figures S2 and S3). Therefore, we compared the common genes with those abnormally expressed in the atu2af65b mutants. Because these are knock-down mutants, in which their remaining functional transcript levels are extremely low compared to their wild-type (Col-0) levels, the differential expression patterns between these mutants are presumably due to their functional differences rather than their mutational strength differences [12].
On examining the expression of flowering time genes registered in FLOR-ID in our RNA-seq data, only a few genes were found to exhibit expression patterns suitable for explaining the flowering time phenotypes of atu2af65a and atu2af65b mutants (Figure 2, Tables S2 and S3). For example, the atu2af65a mutants showed increased expression of FLC and decreased expression of its downstream target genes, SOC1 and AGL24, whereas there was a decrease in FLC expression, but no increase in SOC1 and AGL24 expression in the atu2af65b mutants (Figure 2). We also found a decrease in MAF2 and MAF3 expression, which is also reported in atu2af65b mutants by other laboratories [20]. We could not find any change in ABA signaling involved genes such as ABI5 identified in another study [20]. This discrepancy may be attributable to the use of different atu2af65b mutant alleles for this study and seedling samples grown under different growth conditions.
We previously found that FRI complex genes were activated when FLC expression increased in the whole seedlings of atu2af65a mutants [12]. However, we could not find this kind of concomitant increase in the expression of FRI complex genes in the shoot apices of the atu2af65a mutants in this study (Figure S8), suggesting that the increase in FLC expression in the atu2af65a mutants may be regulated differently in shoot apex regions. Therefore, we examined the expression of other genes that were not found in our initial search for flowering time genes listed in the FLOR-ID (Tables S2 and S3). COOLAIR, EDM2, and PP2A-b’ɤ are known to be negative regulators of FLC expression [29,34,35,37]. It is known that Arabidopsis splicing factors AtPRP8 (SUS2) and NSRa are involved in COOLAIR-dependent FLC expression [30,32]. These two splicing factors play opposite roles in FLC gene regulation and only one isoform of each splicing factor functions in COOLAIR expression. Similarly, we also found that only the AtU2AF65a protein affected COOLAIR regulation (Figure 4 and Figure 5). Changes in COOLAIR and FLC transcripts were observed in atu2af65a flc-3 double mutants (Figure 4d). Furthermore, flc-3 mutation completely suppressed the late-flowering phenotype of atu2af65a mutants (Figure 3). These results suggest that FLC and the FLC upstream regulators are important for the regulation of flowering time in atu2af65a mutants.
The coupling of splicing and 3′-end processing of pre-mRNAs is mediated by the interaction between U2AF65 and one of the 3′-end processing factors in humans [38,39]. Similar coupling might also have resulted in the observations in this study (Figure 4). Unlike animal 3′-end processing machinery, plants have a unique RNA-binding protein, FCA, which interacts with the FY 3′-end processing factor to promote poly(A) site selection [40,41]. In Arabidopsis, FCA binding of COOLAIR transcript is essential for regulating FLC expression [42]. It will be interesting to know whether any interaction could occur between AtU2AF65a and 3′-end processing factor such as FCA in Arabidopsis as well. Further study is needed to clarify involvement of AtU2AF65a in the AS of EDM2 and PP2A-b’ɤ pre-mRNAs observed in this study.
RNA-seq using chromatin-bound RNA samples is known to identify defects in co-transcriptional splicing in Arabidopsis [26,43]. Since we used total RNA samples, we were able to identify a much smaller number of pre-mRNA splicing defects (Figure 6a,b). For example, the relative ratio of four AS transcripts of AtU2AF65a pre-mRNA changed in the atu2af65b mutant such that isoform 1 increased and isoform 3 decreased (Figure 6e or Figure 7a, Table S4). The amino acid sequence difference between isoform 1 and isoform 3 protein products is mainly in the UHM domain, which is used for interaction with the AtSF1 protein. In the isoform 1 protein, this UHM domain is damaged, so it is unlikely to function (Figure S10). Therefore, the increase in the functional AtU2AF65a isoform 1 in the atu2af65b mutants could be due to a compensation mechanism for the defect in AtU2AF65b by increasing AtU2AF65a. The mechanism to compensate for the AtU2AF65b defect by increasing AtU2AF65a through AS regulation could be advantageous over transcriptional regulation because it could be a faster response to stress [44].
AS types in plants are characterized by a higher proportion of intron retention types compared to those in animals. An interpretation of these features was proposed by Jia et al., 2020 [44]. In this proposal, they claim that this “retained intron” can be advantageous in cases where a quick response to stress is required immediately by making a translatable mature mRNA without nascent transcription. This type of regulation at the post-transcriptional splicing level may be applicable for the regulation of AS of AtU2AF65a pre-mRNAs, although the switch from isoform 1 to isoform 3 of AtU2AF65a AS transcripts was not an intron retention type, but an alternative 3′ splice site type (Figure 6e or Figure 7a, Table S4). Recently, it was proposed that AtU2AF65a, but not AtU2AF65b, interacts with an RNA-binding protein (CIS) to regulate AS of FLM pre-mRNA in ambient temperature-modulated flowering of Arabidopsis [45]. Further study on this aspect is required to obtain better insight into the significance of this interaction.

4. Materials and Methods

4.1. Plant Material and Growth Conditions

All mutants and wild-type Arabidopsis plants used in this study were from the Columbia-0 (Col-0) ecotype background. T-DNA insertion mutants such as atu2af65a (SALK_144790 and SALK_075828), atu2af65b (SALK_055049c), and atsf1 (SALK_062177) were obtained from the Arabidopsis Biological Resource Center (ABRC) [12,13]. The p35S::AtU2AF65 transgenic lines, such as AtU2AF65a-OX (35S:: AtU2AF65a in Col-0) and AtU2AF65b-OX (35S::AtU2AF65b in Col-0), have been described previously [12]. The atu2af65a-4 flc-3 and atu2af65b-1 flc-3 double mutants used in this study were generated by crossing between atu2af65a-4 or atu2af65b-1 mutants with flc-3 mutants. Seeds were surface-sterilized three times with 70% (v/v) ethanol added 0.5% (v/v) triton X-100, and two times with 95% (v/v) ethanol. Sterilized seeds were stratified at 4 °C for 3 d prior to germination. Plants were grown on 1/2 strength Murashige and Skoog (MS) medium or in soil (Sunshine Mix 5, Sun Gro Horticulture, Agawam, MA, USA) at 23, 16, or 10 °C under long-day (16-h light/8-h dark) conditions at a light intensity of 120 μmol m−2 s−1.

4.2. RNA Extraction, RT-PCR and Real-Time Quantitative PCR

Total RNA was extracted from 7 d-old whole seedlings using the TRIzol Reagent (Invitrogen, Carlsbad, CA, USA). RNA was quantified using a Nanodrop ND-2000 spectrophotometer (Thermo Scientific, Waltham, MA, USA) and its integrity was checked. Complementary DNA (cDNA) was synthesized using M-MLV Reverse Transcriptase (Invitrogen) with 1 μg of RNA and 1 μg of oligo(dT15) primers according to the manufacturer’s instructions. The reaction was performed at 42 °C for 90 min, with preincubation at 72 °C for 5 min and enzyme inactivation at 72 °C for 15 min. For semi-quantitative reverse transcription polymerase chain reaction (RT-PCR) analysis, cDNA was amplified with Taq polymerase using gene-specific primers under the following thermal cycling conditions: pre-incubation at 95 °C for 5 min, 22 cycles of 95 °C for 30 s, 59 °C for 30 s, and 72 °C for 30 s; and a final extension at 72 °C for 5 min. Real-Time Quantitative PCR (RT-qPCR) was performed in 384-well plates of a LightCycler 480 using a LightCycler 480 SYBR Green I Master mixture (Roche Applied Science, Madison, WI, USA). All semi-quantitative RT-PCR or RT-qPCR experiments were conducted in three biological replicates (independently harvested samples), with three technical replicates each. The primers used in this study are listed in Tables S5 and S6.

4.3. Preparation of Shoot Apices and RNA-seq

Shoot apices were sampled from stem-root cuttings of seven-day-old whole seedlings using micro vannas scissors (Figure S1). RNA-seq libraries were constructed for 12 RNA samples according to the instructions for TruSeq RNA library preparation Illumina (https://www.illumina.com, accessed on 10 April 2023, 1000000040498 v00). In these preparations, poly(A)-containing mRNA molecules were purified using poly T oligo-attached magnetic beads, RNA was fragmented at elevated temperatures, and random hexamers were used for first-strand cDNA synthesis. The 48 libraries had an average insert size of 120–200 bp with a median size of 150 bp, and each library was sequenced on Illumina sequencing platforms to generate paired-end reads. The total number of mapped reads generated in the RNA-seq data was approximately 53 million paired-end reads per sample (Table S1). Read coverage was calculated as the read number per million total sequencing reads per base pair. Genes with a log2 fold change (log2 FC) were considered to be DEGs between each sample and the control (q-value < 0.05). Genes with multiple transcripts were considered alternatively spliced when they exhibited a transcript change in more than one of the transcript DEGs (p-value < 0.05). Variations in splice isoform expression were examined by comparing differential expression at gene and transcript levels. Differential AS events such as major categories (i.e., SE, A5SS, A3SS, MXE, and RI) in RNA-seq data (FDR < 0.05) were detected using rMATS. Each mapped splice junction read required at least 8 bp (anchor length) from each side of the splice junction [18], and all AS events, including duplicate reads, were identified based on rMATS (Table S4). Considering the association between transcript expression and AS events for partial reads, two or more transcripts and rMATS were compared (Table S4). GO analysis was performed online using ShinyGO 0.76.3 (http://bioinformatics.sdstate.edu/go/ accessed on 10 April 2023) [46]. These data have been submitted to Experiment ArrayExpress (https://www.ebi.ac.uk/fg/annotare/edit/7612/ accessed on 10 April 2023) (accession: E-MTAB-12648).

4.4. Nuclear/Cytoplasmic Fractionation and Isolation of Nuclear Extracts

Nuclear extraction from seven-day-old Arabidopsis seedlings was performed using a previously proposed method [26]. Approximately 0.5 g of plant tissues per 2 mL tube was ground with liquid nitrogen in the tube and gently mixed with 800 μL of Honda buffer (0.5% (v/v) Triton X-100, 1× protease inhibitor mixture (Roche), 20 U/mL RNase inhibitor (Thermo Scientific), 50 ng/μL yeast tRNA (Invitrogen) and syringe filtered mixture of 20 mM Hepes, 0.44 M sucrose, 1.25% (w/v) Ficoll, 2.5% (w/v) Dextran T40, 5 mM dithiothreitol (DTT), 10 mM MgCl2). Tissue homogenates were filtered through two layers of Miracloth and centrifuged at 11,000× g for 10 min. The supernatant was used as cytoplasmic fraction, and pellet was resuspended in 1 mL of resuspension buffer (50% (v/v) glycerol, 0.5 mM EDTA, 25 mM Tris-HCl (pH 7.5), 100 mM NaCl, 1 mM DTT, 0.4 U/mL RNasin RNase inhibitor (Promega, WI, USA), 100 ng/mL yeast tRNA). The nuclear suspension was resuspended by adding 400 μL of urea buffer (1 M urea, 0.5 mM EDTA, 25 mM Tris-HCl (pH 7.5), 300 mM NaCl, 1 mM DTT, 1% (v/v) Tween 20) and then centrifuged at 2000× g for 15 min. The supernatant was removed carefully and washing with urea buffer was repeated. The cytoplasmic nuclear fractions were vortexed in 600 μL TRIzol reagent for 30 s. The extracted RNA was quantified using a Nanodrop spectrophotometer and checked for integrity. Later, when RNA was used, miR167a, which enriched in the nuclear fraction compared to the total fraction [47], was used as the nuclear extract control. For very small quantities of samples, similar results were obtained by RNA extraction using the Cytoplasmic and Nuclear RNA Purification Kit (Norgenbiotek, Thorold, ON, Canada).

4.5. Statistical Analysis

To reveal statistical differences in RNA expression experiments, one-way analysis of variance (ANOVA) was performed using the Duncan method with SPSS software (version 25, IBM, Armonk, NY, USA) or two-tailed paired Student’s t-tests of variances in Microsoft Excel.

5. Conclusions

In this study, we performed RNA sequencing (RNA-seq) of shoot apices from atu2af65a and atu2af65b mutants and compared their transcriptomes. Among the genes with opposite expression patterns in the two mutants, FLC and a non-coding RNA (At4g04223) were the most significant. We also observed changes in the expression or alternative splicing (AS) of some FLC upstream regulators, such as COOLAIR, EDM2, or PP2A-b’ɤ, in the shoot apices of these mutants. Moreover, we discovered that atu2af65b mutation, atsf1 mutation, and low temperature conditions increased the levels of a functional AtU2AF65a isoform, suggesting a possible compensation mechanism involving the AS of AtU2AF65a pre-mRNA. Our results indicate that AtU2AF65a and AtU2AF65b splicing factors modulate FLC expression by affecting the expression or AS of a subset of FLC upstream regulators in the shoot apex, leading to opposite flowering phenotypes.

Supplementary Materials

The following supporting information can be downloaded at: https://www.mdpi.com/article/10.3390/plants12081655/s1, Figure S1. Shoot apex regions and whole seedling parts of Arabidopsis seedlings used for RNA-seq analysis; Figure S2. Differentially expressed genes (DEGs) regulated by AtU2AF65a and AtU2AF65b; Figure S3. Comparisons of differentially expressed genes regulated by two different mutant alleles of AtU2AF65a or AtU2AF65b; Figure S4. Gene ontology (GO) enrichment analysis in atu2af65a and atu2af65b mutants; Figure S5. Expression patterns of flowering time genes in shoot apex regions of wild-type (Col-0) and two mutant plants; Figure S6. Quality control of nuclear RNA fraction; Figure S7. Detection of unspliced and spliced SOC1 and AGL24 forms in shoot apices’ nuclear fractions of 7-d-old wild-type (Col-0), atu2af65a-4, atu2af65a-3, and atu2af65b-1 plants; Figure S8. Expression patterns of FRI complex and autonomous genes in shoot apex regions of wild-type (Col-0) and two mutant plants; Figure S9. Expression patterns of PRP8 (At1g80070.1), FPA (At2g43410.2) and NSRa (At1g76940.1) based on FPKM values; Figure S10. Comparison between AtU2AF65a Isoform 1, 2, 3 and AtU2AF65b; Figure S11. Proposed model for the roles of AtU2AF65a and AtU2AF65b in the alternative splicing of COOLAIR, EDM2, and PP2A-b’ɤ pre-mRNAs. Table S1. Summary of reads per sample and replicates; Table S2. List of misregulated floral activator genes in atu2af65a and atu2af65b mutants; Table S3. List of misregulated floral repressor genes in atu2af65a and atu2af65b mutants; Table S4. List of genes from comparison between transcript DEGs and rMAT in atu2af65a and atu2af65b mutants; Table S5. Oligonucleotides used in this study; Table S6. Oligonucleotides used in this study.

Author Contributions

J.-K.K. conceived of and designed the study. H.T.L. conducted the experiments. J.-K.K., H.-Y.P., K.C.L., and J.H.L. analyzed the data. J.-K.K. and H.T.L. wrote this manuscript. All authors have read and agreed to the published version of the manuscript.

Funding

This research was supported by the Basic Science Research Program of the National Research Foundation (NRF) funded by the Ministry of Education of the Republic of Korea (2019R1F1A1060009 to J.-K.K. and 2021R1I1A3050195 to J.H.L.). This study was funded by a grant from Korea University to J.-K.K.

Data Availability Statement

RNA-seq data was deposited in E-MTAB-12648.

Acknowledgments

We are grateful to Ji Hoon Ahn (Korea University) for providing the flc-3 mutant seeds.

Conflicts of Interest

The authors declare no conflict of interest.

References

  1. Barton, M.K.; Poething, R.S. Formation of the shoot apical meristem in Arabidopsis thaliana: An analysis of development in the wild type and in the shoot meristemless mutant. Development 1993, 119, 823–831. [Google Scholar] [CrossRef]
  2. Aida, M.; Ishida, T.; Tasaka, M. Shoot apical meristem and cotyledon formation during Arabidopsis embryogenesis: Interaction among the cup–shaped cotyledon and shoot meristemless genes. Development 1999, 126, 1563–1570. [Google Scholar] [CrossRef] [PubMed]
  3. Long, J.A.; Barton, M.K. The development of apical embryonic pattern in Arabidopsis. Development 1998, 125, 3027–3035. [Google Scholar] [CrossRef] [PubMed]
  4. Simpson, G.G.; Gendall, A.R.; Dean, C. When to switch to flowering. Annu. Rev. Cell Dev. Biol. 1999, 99, 519–550. [Google Scholar] [CrossRef] [PubMed]
  5. Boss, P.K.; Bastow, R.M.; Mylne, J.S.; Dean, C. Multiple pathways in the decision to flower: Enabling, promoting, and resetting. Plant Cell 2004, 16 (Suppl. S1), S18–S31. [Google Scholar] [CrossRef] [Green Version]
  6. Yu, H.; Xu, Y.; Tan, E.L.; Kumar, P.P. Agamous–like 24, a dosage–dependent mediator of the flowering signals. Porc. Natl. Acad. Sci. USA 2002, 99, 16336–16341. [Google Scholar] [CrossRef] [Green Version]
  7. Liu, C.; Chen, H.; Er, H.L.; Soo, H.M.; Kumar, P.P.; Han, J.H.; Liou, Y.C.; Yu, H. Direct interaction of AGL24 and SOC1 integrates flowering signals in Arabidopsis. Development 2008, 135, 1481–1491. [Google Scholar] [CrossRef] [Green Version]
  8. Baralle, F.E.; Giudice, J. Alternative splicing as a regulator of development and tissue identity. Nat. Rev. Mol. Cell Biol. 2017, 18, 437–451. [Google Scholar] [CrossRef]
  9. Kadam, U.S.; Schulz, B.; Irudayaraj, J. Detection and quantification of alternative splice sites in Arabidopsis genes AtDCL2 and AtPTB2 with highly sensitive surface enhanced Raman spectroscopy (SERS) and gold nanoprobes. FEBS Lett. 2014, 588, 1637–1643. [Google Scholar] [CrossRef] [Green Version]
  10. Kadam, U.S.; Schulz, B.; Irudayaraj, J.M.K. Multiplex single–cell quantification of rare RNA transcripts from protoplasts in a model plant system. Plant J. 2017, 90, 1187–1195. [Google Scholar] [CrossRef] [Green Version]
  11. Martín, G.; Márquez, Y.; Mantica, F.; Duque, P.; Irimia, M. Alternative splicing landscapes in Arabidopsis thaliana across tissues and stress conditions highlight major functional differences with animals. Genome Biol. 2021, 22, 35. [Google Scholar] [CrossRef]
  12. Park, H.-Y.; Lee, H.T.; Lee, J.H.; Kim, J.-K. Arabidopsis U2AF65 Regulates Flowering Time and the Growth of Pollen Tubes. Front. Plant Sci. 2019, 10, 569. [Google Scholar] [CrossRef] [Green Version]
  13. Jang, Y.H.; Park, H.-Y.; Lee, K.C.; Thu, M.P.; Kim, S.-K.; Suh, M.C.; Kang, H.; Kim, J.-K. A homolog of splicing factor SF1 is essential for development and is involved in the alternative splicing of pre–mRNA in Arabidopsis thaliana. Plant J. 2014, 78, 591–603. [Google Scholar] [CrossRef]
  14. Wang, B.B.; Brendel, V. Molecular characterization and phylogeny of U2AF35 homologs in plants. Plant Physiol. 2006, 140, 624–636. [Google Scholar] [CrossRef] [Green Version]
  15. Zuo, P.; Maniatis, T. The splicing factor U2AF35 mediates critical protein–protein interactions in constitutive and enhancer–dependent splicing. Genes Dev. 1996, 10, 1356–1368. [Google Scholar] [CrossRef] [Green Version]
  16. Tholen, J.; Razew, M.; Weis, F.; Galej, W.P. Structural basis of branch site recognition by the human spliceosome. Science 2022, 375, 50–57. [Google Scholar] [CrossRef] [PubMed]
  17. Peled–Zehavi, H.; Berglund, J.A.; Rosbash, M.; Frankel, A.D. Recognition of RNA branch point sequences by the KH domain of splicing factor 1 (mammalian branch point binding protein) in a splicing factor complex. Mol. Cell. Biol. 2001, 21, 5232–5241. [Google Scholar] [CrossRef] [PubMed] [Green Version]
  18. Koncz, C.; Dejong, F.; Villacorta, N.; Szakonyi, D.; Koncz, Z. The spliceosome–activating complex: Molecular mechanisms underlying the function of a pleiotropic regulator. Front. Plant Sci. 2012, 3, 9. [Google Scholar] [CrossRef] [PubMed] [Green Version]
  19. Verhage, L.; Severing, E.I.; Bucher, J.; Lammers, M.; Busscher–Lange, J.; Bonnema, G.; Rodenburg, N.; Proveniers, M.C.; Angenent, G.C.; Immink, R.G. Splicing–related genes are alternatively spliced upon changes in ambient temperatures in plants. PLoS ONE 2017, 12, e0172950. [Google Scholar] [CrossRef] [Green Version]
  20. Xiong, F.; Ren, J.J.; Yu, Q.; Wang, Y.Y.; Lu, C.C.; Kong, L.J.; Otegui, M.S.; Wang, X.L. AtU2AF65b functions in abscisic acid mediated flowering via regulating the precursor messenger RNA splicing of ABI5 and FLC in Arabidopsis. New Phytol. 2019, 223, 277–292. [Google Scholar] [CrossRef]
  21. Zhang, X.N.; Mount, S.M. Two alternatively spliced isoforms of the Arabidopsis SR45 protein have distinct roles during normal plant development. Plant Physiol. 2009, 150, 1450–1458. [Google Scholar] [CrossRef] [Green Version]
  22. Michaels, S.D.; Amasino, R.M. Flowering locus cencodes a novel MADS domain protein that acts as a repressor of flowering. Plant Cell 1999, 5, 949–956. [Google Scholar] [CrossRef] [PubMed] [Green Version]
  23. Shen, S.; Park, J.W.; Lu, Z.X.; Lin, L.; Henry, M.D.; Wu, Y.N.; Zhou, Q.; Xing, Y. rMATS: Robust and flexible detection of differential alternative splicing from replicate RNA–Seq data. Porc. Natl. Acad. Sci. USA 2014, 111, E5593–E5601. [Google Scholar] [CrossRef] [Green Version]
  24. Sun, J.; Jiang, H.; Xu, Y.; Li, H.; Wu, X.; Xie, Q.; Li, C. The CCCH–type zinc finger proteins AtSZF1 and AtSZF2 regulate salt stress responses in Arabidopsis. Plant Cell Physiol. 2007, 48, 1148–1158. [Google Scholar] [CrossRef] [PubMed] [Green Version]
  25. Ding, F.; Elowitz, M.B. Constitutive splicing and economies of scale in gene expression. Nat. Struct. Mol. Biol. 2019, 26, 424–432. [Google Scholar] [CrossRef] [PubMed] [Green Version]
  26. Zhu, D.; Mao, F.; Tian, Y.; Lin, X.; Gu, L.; Gu, H.; Qu, L.J.; Wu, Y.; Wu, Z. The Features and Regulation of Co–transcriptional Splicing in Arabidopsis. Mol. Plant 2020, 13, 278–294. [Google Scholar] [CrossRef] [PubMed]
  27. Qi, H.D.; Lin, Y.; Ren, Q.P.; Wang, Y.Y.; Xiong, F.; Wang, X.L. RNA Splicing of FLC Modulates the Transition to Flowering. Front. Plant Sci. 2019, 10, 1625. [Google Scholar] [CrossRef]
  28. Csorba, T.; Questa, J.I.; Sun, Q.; Dean, C. Antisense coolair mediates the coordinated switching of chromatin states at FLC during vernalization. Porc. Natl. Acad. Sci. USA 2014, 111, 16160–16165. [Google Scholar] [CrossRef] [Green Version]
  29. Liu, F.; Marquardt, S.; Lister, C.; Swiezewski, S.; Dean, C. Targeted 3’ processing of antisense transcripts triggers Arabidopsis FLC chromatin silencing. Science 2010, 327, 94–97. [Google Scholar] [CrossRef]
  30. Marquardt, S.; Raitskin, O.; Wu, Z.; Liu, F.; Sun, Q.; Dean, C. Functional consequences of splicing of the antisense transcript COOLAIR on FLC transcription. Mol. Cell 2014, 54, 156–165. [Google Scholar] [CrossRef] [Green Version]
  31. Hornyik, C.; Terzi, L.C.; Simpson, G.G. The spen family protein FPA controls alternative cleavage and polyadenylation of RNA. Dev. Cell 2010, 18, 203–213. [Google Scholar] [CrossRef] [PubMed] [Green Version]
  32. Bazin, J.; Romero, N.; Rigo, R.; Charon, C.; Blein, T.; Ariel, F.; Crespi, M. Nuclear Speckle RNA Binding Proteins Remodel Alternative Splicing and the Non–coding Arabidopsis Transcriptome to Regulate a Cross–Talk Between Auxin and Immune Responses. Front. Plant Sci. 2018, 9, 1209. [Google Scholar] [CrossRef] [PubMed]
  33. Kalyna, M.; Simpson, C.G.; Syed, N.H.; Lewandowska, D.; Marquez, Y.; Kusenda, B.; Marshall, J.; Fuller, J.; Cardle, L.; McNicol, J.; et al. Alternative splicing and nonsense–mediated decay modulate expression of important regulatory genes in Arabidopsis. Nucleic Acids Res. 2012, 40, 2454–2469. [Google Scholar] [CrossRef] [Green Version]
  34. Heidari, B.; Nemie–Feyissa, D.; Kangasjarvi, S.; Lillo, C. Antagonistic Regulation of Flowering Time through Distinct Regulatory Subunits of Protein Phosphatase 2A. PLoS ONE 2013, 8, e67987. [Google Scholar] [CrossRef]
  35. Tsuchiya, T.; Eulgem, T. The Arabidopsis defense component EDM2 affects the floral transition in an FLC–dependent manner. Plant J. 2010, 62, 518–528. [Google Scholar] [CrossRef] [PubMed]
  36. Kardailsky, I.; Shukla, V.K.; Ahn, J.H.; Dagenais, N.; Christensen, S.K.; Nguyen, J.T.; Chory, J.; Harrison, M.J.; Weigel, D. Activation tagging of the floral inducer FT. Science 1999, 286, 1962–1965. [Google Scholar] [CrossRef] [Green Version]
  37. Swiezewski, S.; Liu, F.; Magusin, A.; Dean, C. Cold–induced silencing by long antisense transcripts of an Arabidopsis Polycomb target. Nature 2009, 462, 799–802. [Google Scholar] [CrossRef]
  38. Vagner, S.; Ruegsegger, U.; Gunderson, S.I.; Keller, W.; Mattaj, I.W. Position–dependent inhibition of the cleavage step of pre–mRNA 3’–end processing by U1 snRNP. RNA 2000, 6, 178–188. [Google Scholar] [CrossRef] [Green Version]
  39. Millevoi, S.; Loulergue, C.; Dettwiler, S.; Karaa, S.Z.; Keller, W.; Antoniou, M.; Vagner, S. An interaction between U2AF 65 and CF I(m) links the splicing and 3’ end processing machineries. EMBO J. 2006, 25, 4854–4864. [Google Scholar] [CrossRef] [PubMed] [Green Version]
  40. Macknight, R.; Bancroft, I.; Page, T.; Lister, C.; Schmidt, R.; Love, K.; Westphal, L.; Murphy, G.; Sherson, S.; Cobbett, C.; et al. FCA, a gene controlling flowering time in Arabidopsis, encodes a protein containing RNA–binding domains. Cell 1997, 89, 737–745. [Google Scholar] [CrossRef] [Green Version]
  41. Lee, J.H.; Cho, Y.S.; Yoon, H.S.; Suh, M.C.; Moon, J.; Lee, I.; Weigel, D.; Yun, C.H.; Kim, J.K. Conservation and divergence of FCA function between Arabidopsis and rice. Plant Mol. Biol. 2005, 58, 823–838. [Google Scholar] [CrossRef]
  42. Tian, Y.; Zheng, H.; Zhang, F.; Wang, S.; Ji, X.; Xu, C.; He, Y.; Ding, Y. PRC2 recruitment and H3K27me3 deposition at FLC require FCA binding of coolair. Sci. Adv. 2019, 5, 7246. [Google Scholar] [CrossRef] [PubMed] [Green Version]
  43. Drexler, H.L.; Choquet, K.; Merens, H.E.; Tang, P.S.; Simpson, J.T.; Churchman, L.S. Revealing nascent RNA processing dynamics with nano–COP. Nat. Protoc. 2021, 16, 1343–1375. [Google Scholar] [CrossRef] [PubMed]
  44. Jia, J.; Long, Y.; Zhang, H.; Li, Z.; Liu, Z.; Zhao, Y.; Lu, D.; Jin, X.; Deng, X.; Xia, R.; et al. Post–transcriptional splicing of nascent RNA contributes to widespread intron retention in plants. Nat. Plants 2020, 6, 780–788. [Google Scholar] [CrossRef] [PubMed]
  45. Zhao, Z.; Dent, C.; Liang, H.; Lv, J.; Shang, G.; Liu, Y.; Feng, F.; Wang, F.; Pang, J.; Li, X.; et al. CRY2 interacts with CIS1 to regulate thermosensory flowering via FLM alternative splicing. Nat. Commun. 2022, 13, 7045. [Google Scholar] [CrossRef]
  46. Ge, S.X.; Jung, D.; Yao, R. ShinyGO: A graphical gene–set enrichment tool for animals and plants. Bioinformatics 2020, 36, 2628–2629. [Google Scholar] [CrossRef]
  47. Moro, B.; Kisielow, M.; Borrero, V.B.; Bouet, A.; Brosnan, C.A.; Bologna, N.G. Nuclear RNA purification by flow cytometry to study nuclear processes in plants. STAR Protoc. 2021, 2, 100320. [Google Scholar] [CrossRef]
Figure 1. Identification and analysis of differentially expressed genes (DEGs) in shoot apices of wild-type (Col-0), atu2af65a-4, atu2af65a-3, and atu2af65b-1 plants. (a) Heatmap showing the hierarchical clustering for the genes expressed in Col-0, two atu2af65a, and one atu2af65b plants. (b) Venn diagrams showing the total number of DEGs regulated by AtU2AF65a and AtU2AF65b (top), and the number of up, down, and reverse DEGs (bottom). Reverse indicates opposite DEGs between atu2af65a and atu2af65b mutants. Numbers in parentheses indicate the genes (|log2 FC| ≥ 1). q-value (q < 0.05) provides a means to control the positive false discovery rate. (c) Five genes that were reversely regulated in atu2af65a and atu2af65b mutants. Asterisks indicate the genes (|log2 FC| ≥ 1). (d) Coverage plot and gene expression (measured as fragments per kilobase of transcript per million mapped reads [FPKM]) showing reads mapping to the FLC locus in shoot apices of Col-0, atu2af65a-4, atu2af65a-3, and atu2af65b-1 plants. Wiggle plots were generated for three biological replicates for sequencing data in the integrative genomics viewer (IGV). The letters shown in FPKM value graph indicate statistically significant differences (p < 0.05) based on the Duncan method. The gene structures below the wiggle plots represent four different FLC isoforms. One major FLC isoform (1) is indicated with an asterisk and its FPKM value is 100%.
Plants 12 01655 g001
Figure 2. AtU2AF65a positively regulates SOC1 and AGL24 via FLC in shoot apex regions. (a) Comparison between 306 flowering time genes in FLOR-ID and differentially expressed genes (DEGs) from our RNA sequencing analysis. 65a, DEGs of atu2af65a mutants only; 65b, DEGs of atu2af65b mutants only; 65a&b, overlapped DEGs of atu2af65a and atu2af65b mutants. (b) Coverage plot and gene expression (measured as FPKM) showing reads mapping to the SOC1 and AGL24 loci in shoot apices of wild-type (Col-0), atu2af65a-4, atu2af65a-3, and atu2af65b-1 plants. Wiggle plots were generated for three biological replicates for sequencing data in the IGV. The letters indicate statistically significant differences (p < 0.05) based on Duncan method. (c) Expression of FLC, SOC1, and AGL24 in leaves (L) and shoot apices (SA) of Col-0, atu2af65a-4, atu2af65a-3, and atu2af65b-1 plants using semi-quantitative RT-PCR analysis. AtUBQ10 (At4g05320) gene was used as an internal control. (d) Splicing efficiency of SOC1 or AGL24 in nuclear RNA fraction of shoot apex regions measured by RT-qPCR analysis. Splicing efficiency was calculated according to Ding and Elowitz [25]. The primer positions are indicated in black arrows shown in (b). Student’s t-test was used for statistical analysis. ns, not significant.
Plants 12 01655 g002
Figure 3. Flowering time of wild-type (Col-0), atu2af65a-4, atu2af65b-1, flc-3, atu2af65a-4 flc-3, and atu2af65b-1 flc-3 plants at different temperatures under long-day (LD) conditions. The letters indicate statistically significant differences (p < 0.05) based on the Duncan method. Numbers in the bars represent the plants measured.
Plants 12 01655 g003
Figure 4. Alteration in AtU2AF65a affects COOLAIR transcripts in shoot apices. (a) Schematic representation for COOLAIR and FLC at the FLC genomic region. The grey and black rectangles indicate coding and noncoding regions, respectively. TSS, transcription start site; F1 to 3, forward primers; R1 to 2, reverse primers. (b) Expression of COOLAIR Class I, COOLAIR Class II, and FLC in shoot apices of wild-type (Col-0), atu2af65a-4, atu2af65a-3, atu2af65b-1, AtU2AF65a-OX, and AtU2AF65b-OX plants. IPP2 (At3g02780) and AtUBQ10 (At4g05320) genes were used as internal controls for RT-qPCR and semi-quantitative RT-PCR analyses, respectively. The primers used for semi-quantitative RT-PCR analysis denoted by (a). (c) The ratio of COOLAIR Class I to COOLAIR Class II isoforms of COOLAIR transcripts relative to Col-0 from RT-qPCR data. (d) Expression of COOLAIR Class I, COOLAIR Class II, and FLC in shoot apices of each genotype as measured by RT-qPCR analysis. Asterisks indicate statistically significant differences (* p < 0.05, ** p < 0.01) based on Student’s t-test. ns, not significant.
Plants 12 01655 g004
Figure 5. AtU2AF65a or AtU2AF65b control the expression or alternatively spliced transcripts of EDM2 or PP2A-b’ɤ in shoot apex regions. (a) Expression of EDM2 and PP2A-b’ɤ in shoot apices of wild-type (Col-0), atu2af65a-4, atu2af65a-3, and atu2af65b-1 plants. IPP2 (At3g02780) gene was used as an internal control for RT-qPCR analysis. (b) Expression of EDM2 and PP2A-b’ɤ in shoot apices of atu2af65a-4 flc-3 and atu2af65b-1 flc-3 double mutants using RT-qPCR analysis. (c) The ratio of EDM2.1 to EDM2.2 isoforms of EDM2 and PP2A-b’ɤ.1 to PP2A-b’ɤ.2 isoforms of PP2A-b’ɤ transcripts relative to Col-0 as based on FPKM values from RNA sequencing data (top) and measured by semi-quantitative RT-PCR analysis (bottom). Asterisks indicate statistically significant differences (* p < 0.05, ** p < 0.01) based on Student’s t-test. ns, not significant.
Plants 12 01655 g005
Figure 6. AtU2AF65a and AtU2AF65b are required for alternative splicing of pre-mRNAs in shoot apex regions. (a,b) The numbers and proportion of altered splicing events in shoot apices of atu2af65a-4, atu2af65a-3, and atu2af65b-1 mutants compared to wild-type (Col-0) plants. SE, skipped exon; A5SS, alternative 5′ splice site; A3SS, alternative 3′ splice site; MXE, mutually exclusive exons; RI, retained intron. (c) Coverage plot showing the reads mapping to the At1g09140 and At1g73470 loci selected from Table S4 and their splicing efficiencies and gene expression in shoot apices of each genotype. (d) Coverage plot showing the reads mapping to the At4g00560, At5g37850, and At4g36690 loci selected from Table S4 and their splicing efficiencies and gene expression in shoot apices of each genotype. unsp, unspliced. Wiggle plots were generated for one representative out of the three biological replicates for sequencing data in the IGV. Splicing efficiencies were based on rMAT analysis of RNA sequencing, and expression was measured by semi-quantitative RT-PCR analysis. Percentage of transcripts was converted based on one hundred percent of total transcripts in FPKM value of Col-0. Asterisks indicate statistically significant differences (* p < 0.05, ** p < 0.01, *** p < 0.001) based on Student’s t-test. ns, not significant. unsp, unsplicied transcript.
Plants 12 01655 g006
Figure 7. Changes of alternative splicing variants of AtU2AF65a and AtU2AF65b in atu2af65b and atsf1 mutants at different ambient temperatures. (a) Expression of alternatively spliced AtU2AF65a mRNA forms in seven-day-old whole seedlings of wild-type (Col-0), atu2af65a-4, atu2af65b-1, and atsf1-2 plants at 23 °C. IPP2 (At3g02780) gene was used as an internal control for RT-qPCR analysis. Asterisks indicate statistically significant differences (* p < 0.05, ** p < 0.01, *** p < 0.001) based on Student’s t-test. ns, not significant. (b) Expression of alternatively spliced AtU2AF65a mRNA forms in seven-day-old whole seedlings of Col-0, atu2af65a-4, atu2af65b-1, and atsf1-2 at 23 °C and in ten-day-old whole seedlings at 16 °C. The primer positions are indicated by black arrows. (c) Expression of AtU2AF65b in whole seedlings of Col-0, atu2af65a-4, and atu2af65b-1 plants at 23 °C and 16 °C. AtUBQ10 (At4g05320) gene was used as an internal control for semi-quantitative RT-PCR analysis.
Plants 12 01655 g007
Disclaimer/Publisher’s Note: The statements, opinions and data contained in all publications are solely those of the individual author(s) and contributor(s) and not of MDPI and/or the editor(s). MDPI and/or the editor(s) disclaim responsibility for any injury to people or property resulting from any ideas, methods, instructions or products referred to in the content.

