
Comparison of Oil-Seed Shell Biomass-Based Biochar for the Removal of Anionic Dyes—Characterization and Adsorption Efficiency Studies


Abstract
:1. Introduction
2. Results and Discussion
2.1. Effects of Raw Materials and Temperatures on Biochar Yield and Quality
2.2. Biochar Characterizations
2.2.1. FT-IR Analysis
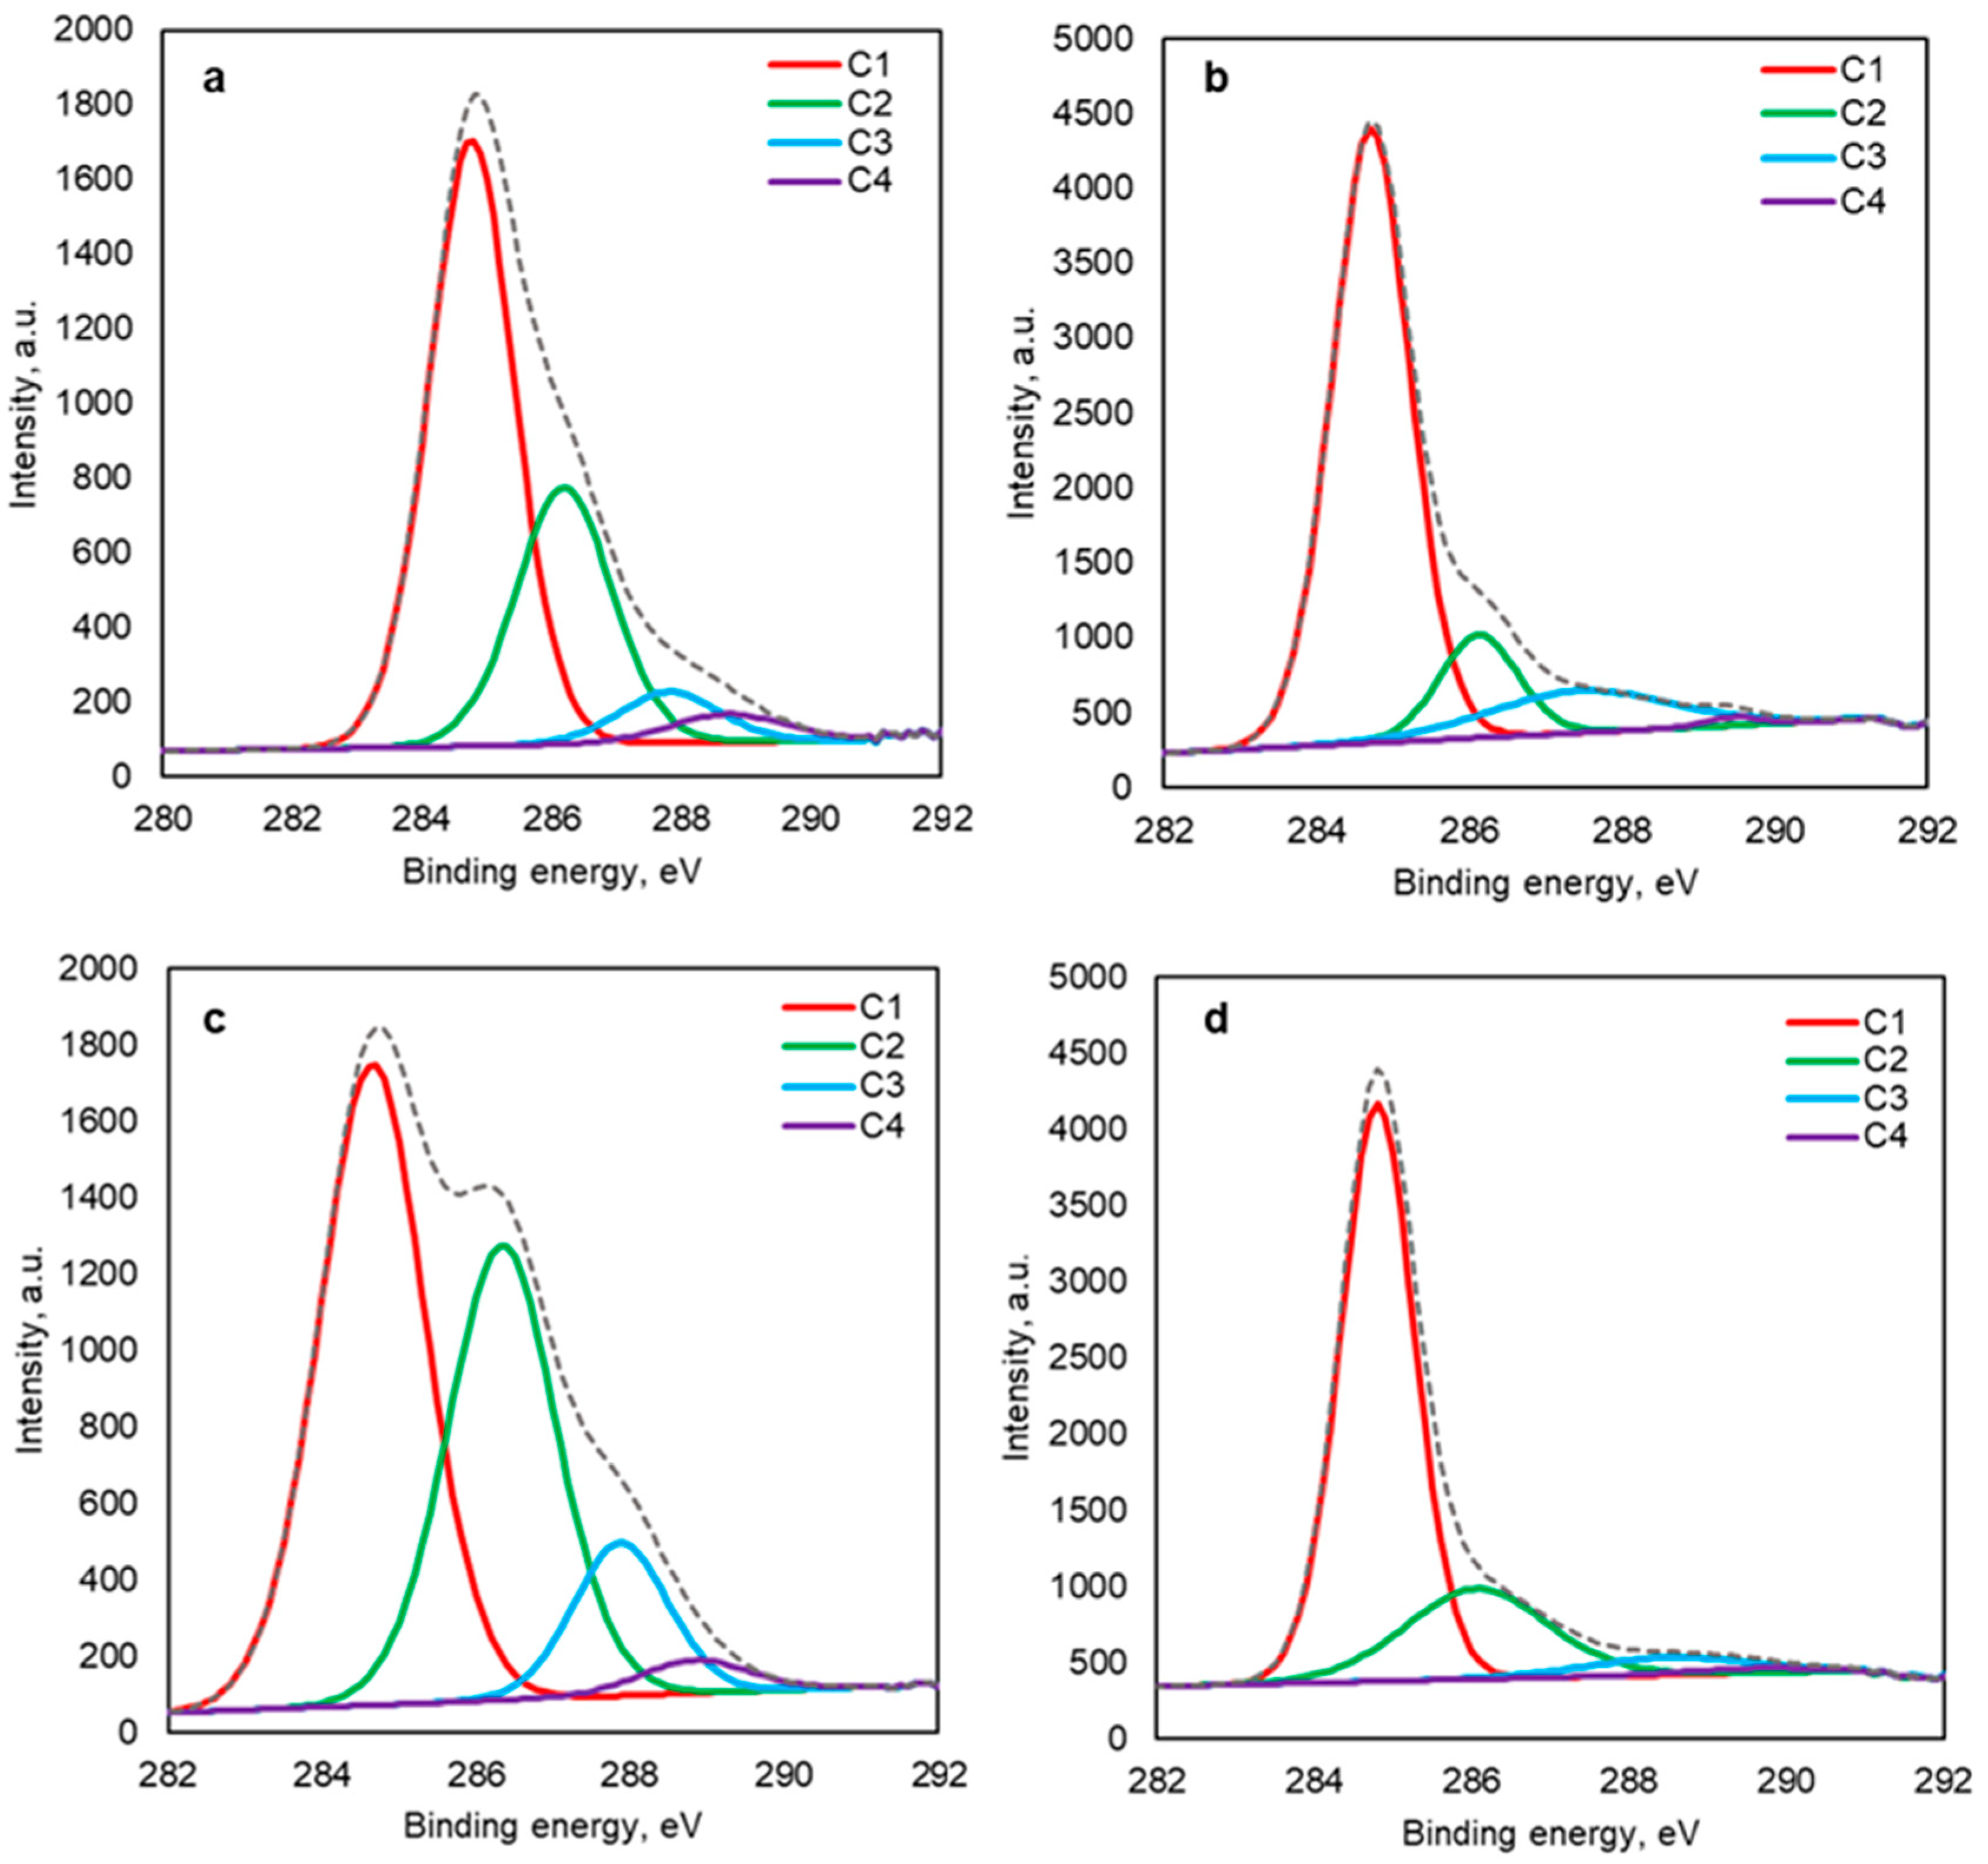
2.2.2. XPS Analysis
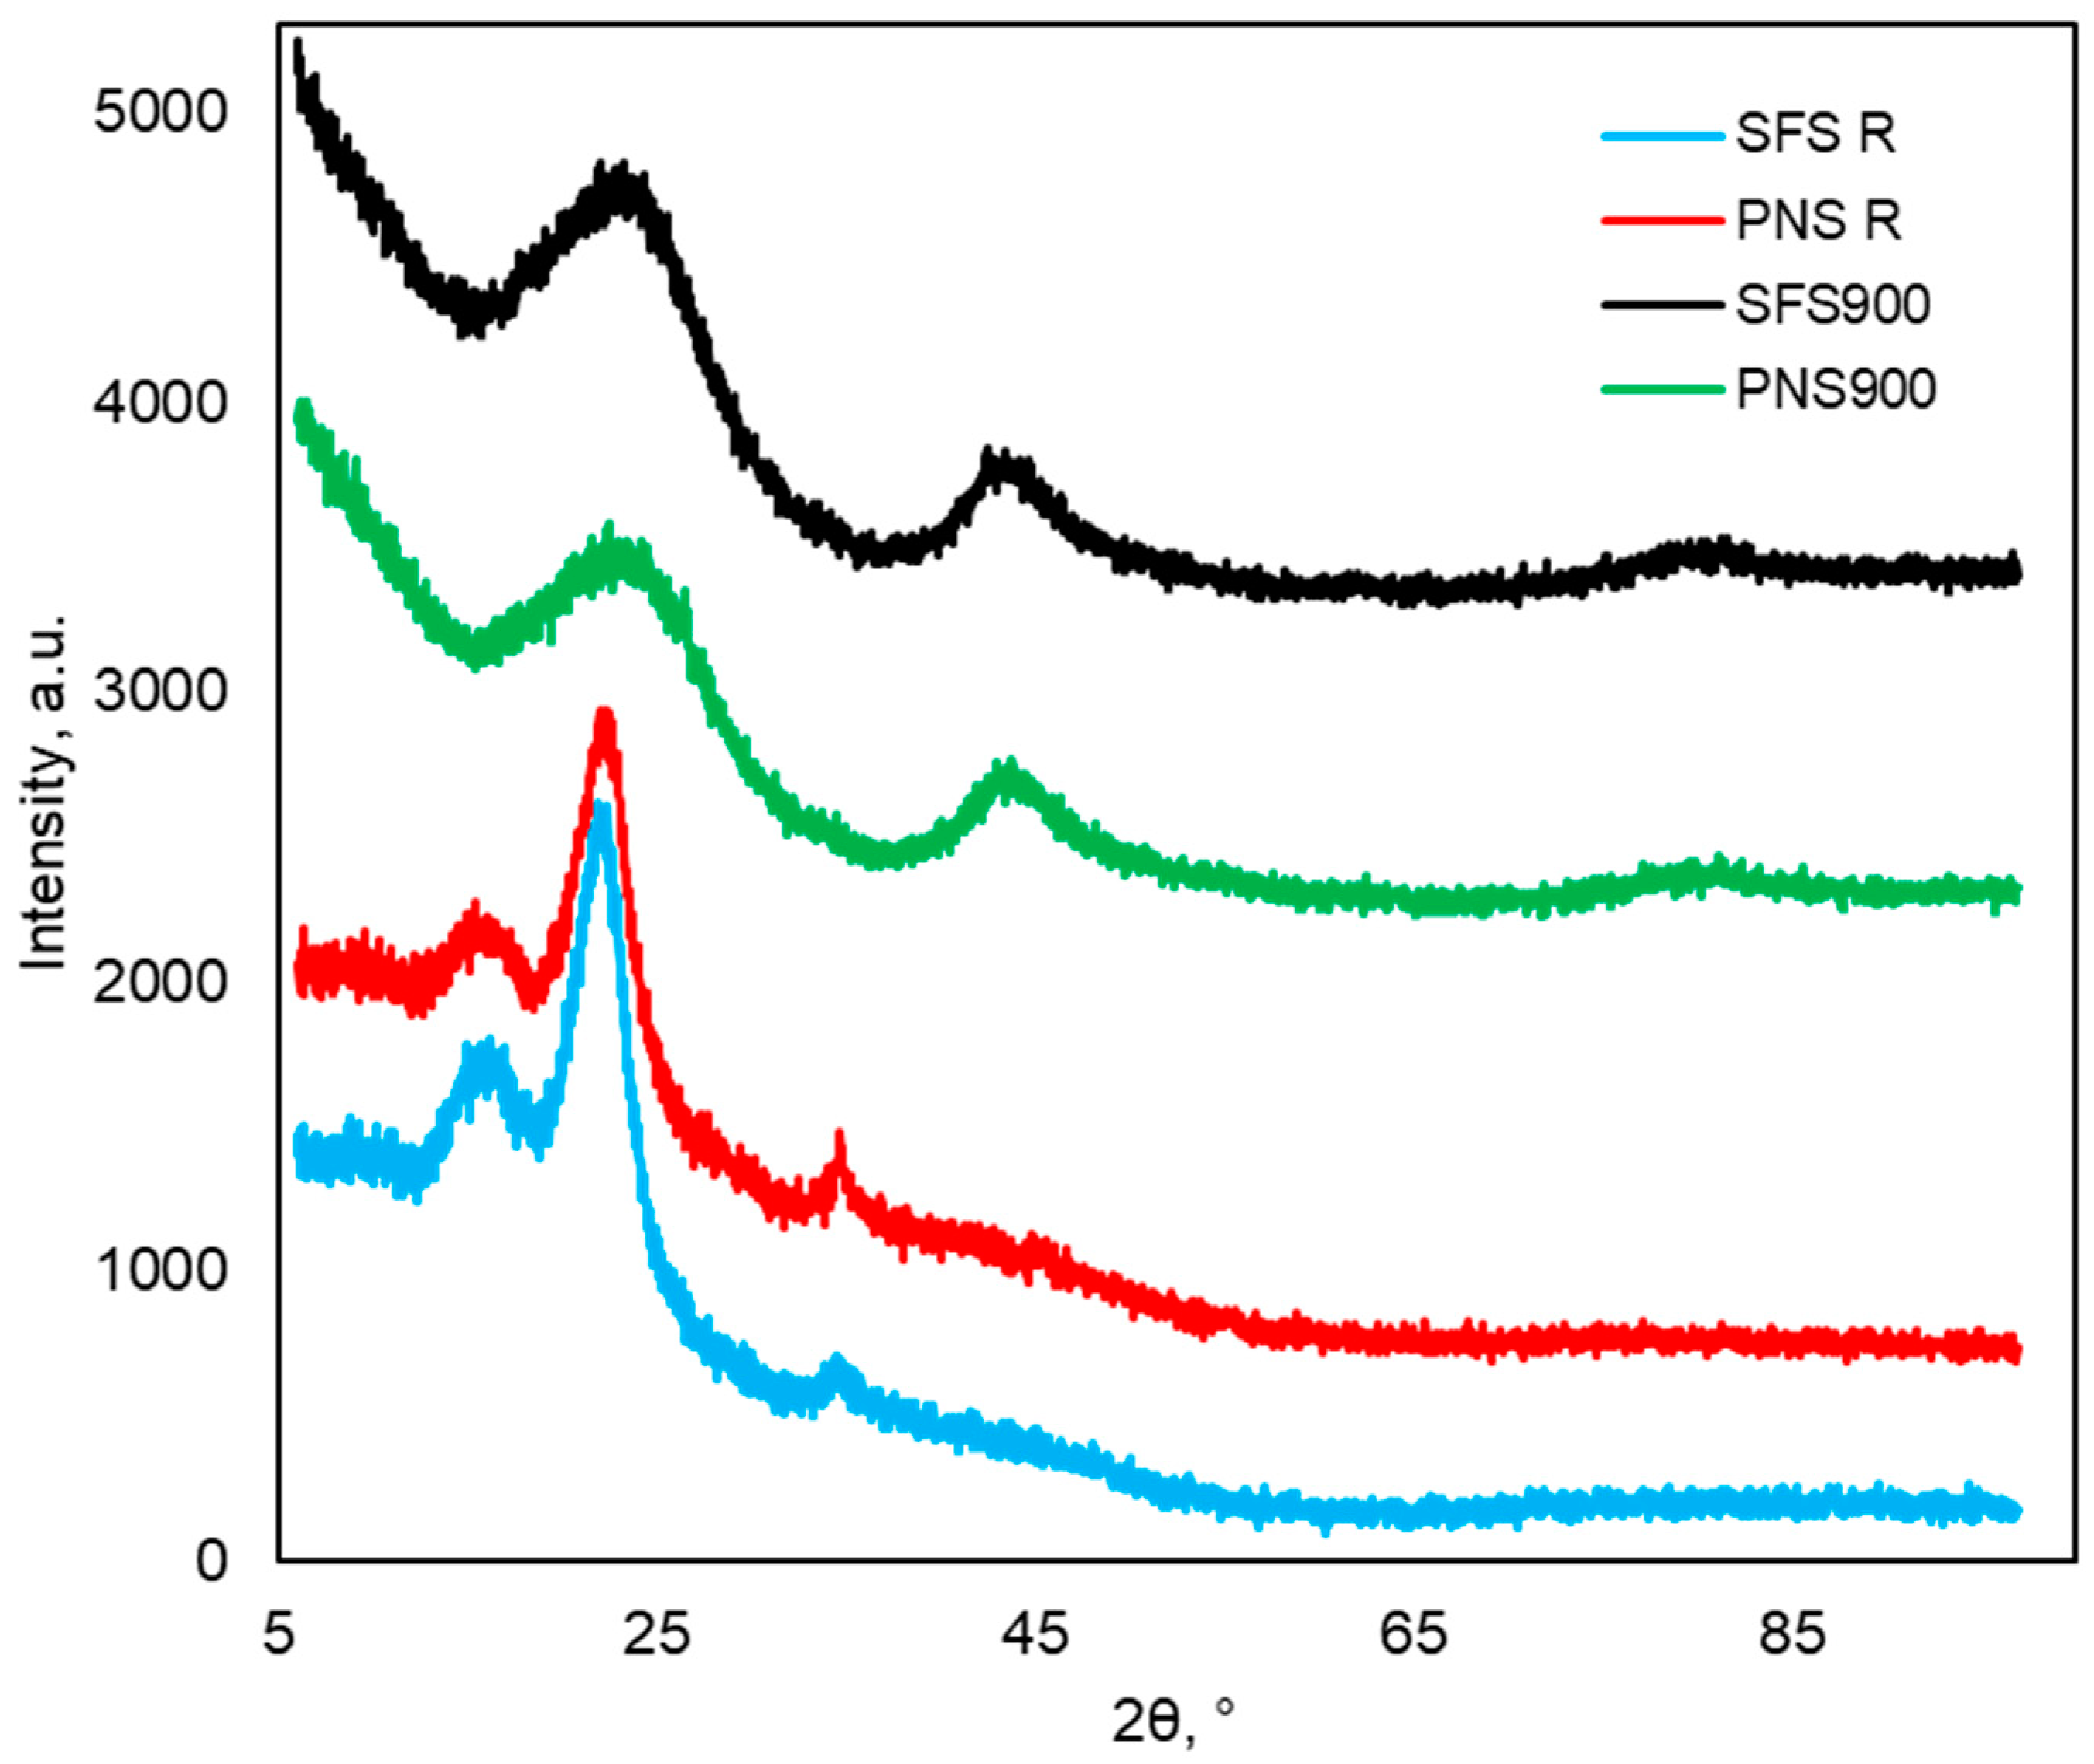
2.2.3. XRD Analysis
2.3. Adsorption Studies
2.3.1. Effects of Biochar Preparation, Temperature, and Dosages on Dye Adsorption
2.3.2. Effects of Contact Time on Adsorption
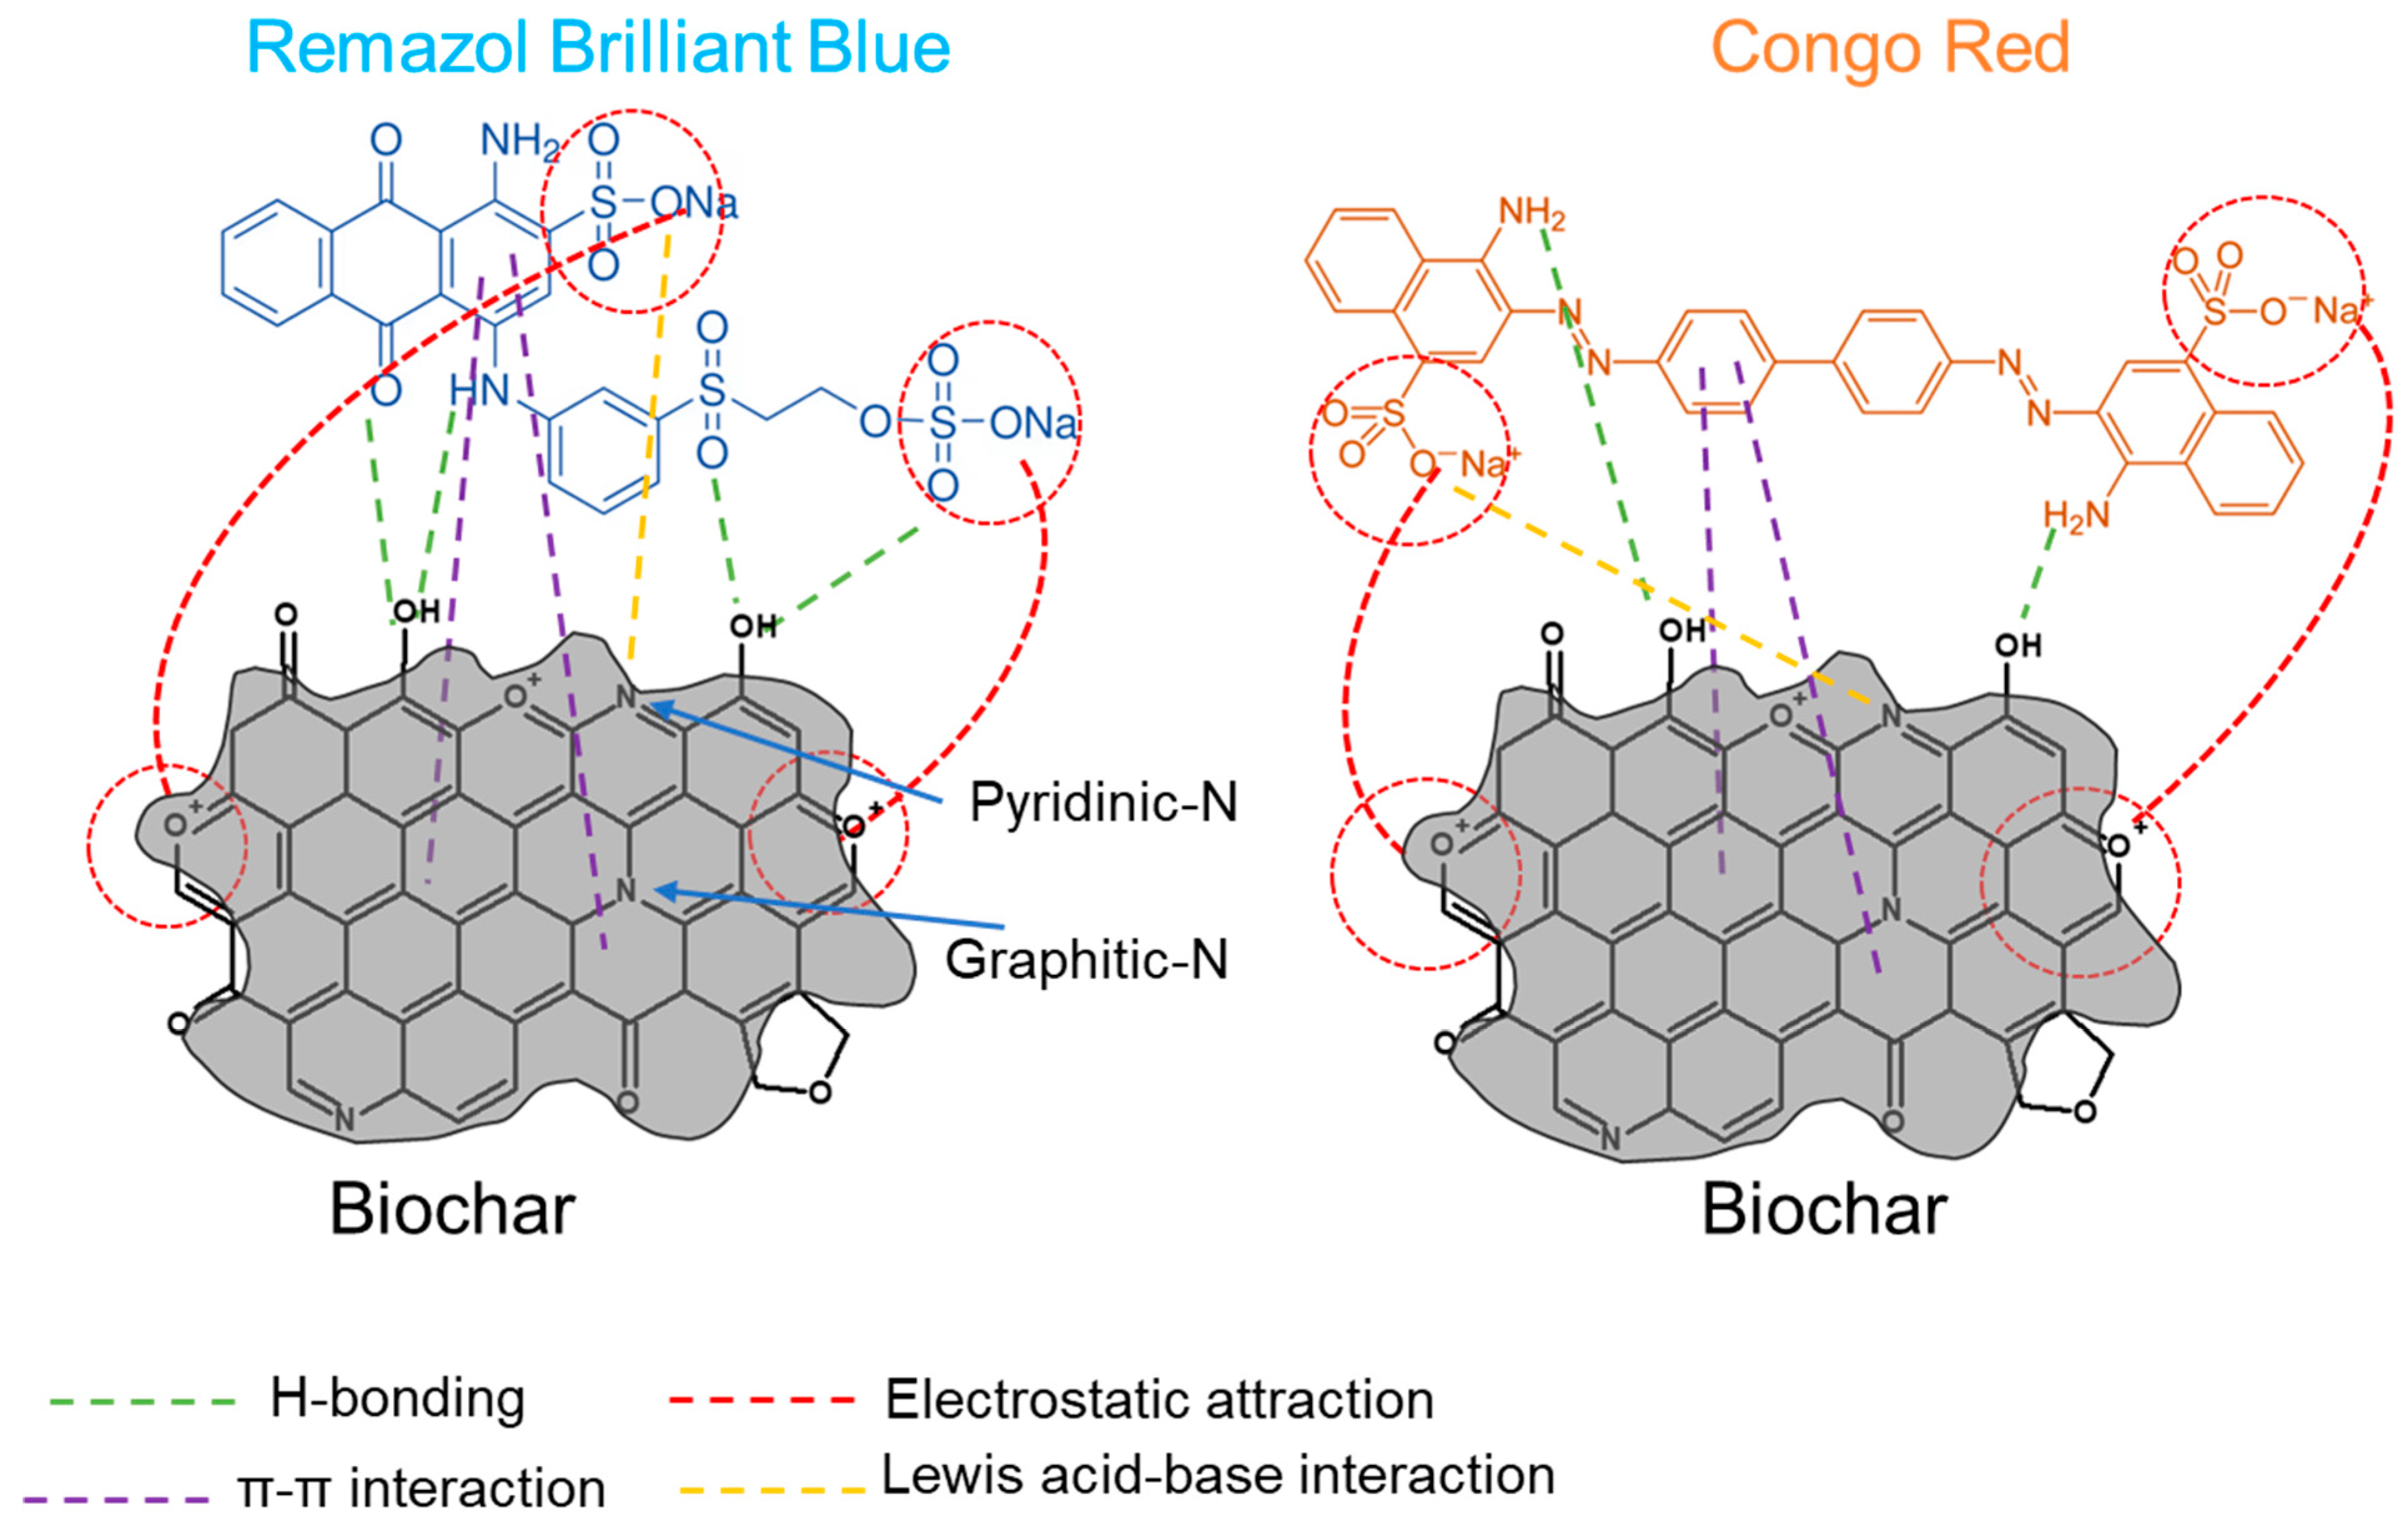
2.4. Adsorption Mechanism of the Dyes
3. Comparison of Recent Studies on Dye Removal
4. Materials and Methods
4.1. Materials
4.2. Pretreatment of the Raw Materials and Biochar Production
4.3. Characterizations of the Biochar
4.3.1. Elemental Analysis
4.3.2. Fourier-Transform Infrared Spectroscopy (FT-IR)
4.3.3. X-ray Photoelectron Spectroscopy (XPS)
4.3.4. X-ray Diffraction (XRD) Analysis
4.3.5. Brunauer, Emmett, and Teller (BET) Analysis
4.4. Adsorption Tests
5. Conclusions
Author Contributions
Funding
Data Availability Statement
Acknowledgments
Conflicts of Interest
References
- Kumar, R.; Qureshi, M.; Vishwakarma, D.K.; Al-Ansari, N.; Kuriqi, A.; Elbeltagi, A.; Saraswat, A. A Review on Emerging Water Contaminants and the Application of Sustainable Removal Technologies. Case Stud. Chem. Environ. Eng. 2022, 6, 100219. [Google Scholar] [CrossRef]
- Zhang, H.; Zhang, T.; Ding, S.; Wang, X. Development of Loose Thin Film Nanofibrous Composite Nanofiltration Membrane with Modified G-C3n4 Nanosheets Barrier Layer for Efficient Separation of Salt/Dye Mixtures. Sep. Purif. Technol. 2023, 306, 122661. [Google Scholar] [CrossRef]
- Ahmed, M.J.K.; Ahmaruzzaman, M.J. A Review on Potential Usage of Industrial Waste Materials for Binding Heavy Metal Ions from Aqueous Solutions. J. Water Process Eng. 2016, 10, 39–47. [Google Scholar] [CrossRef]
- Sadegh, H.; Ali, G.A. Potential Applications of Nanomaterials in Wastewater Treatment: Nanoadsorbents Performance. In Advanced Treatment Techniques for Industrial Wastewater; Hussain, A., Ahmed, S., Eds.; IGI Global: Hershey, PA, USA, 2019; pp. 51–61. [Google Scholar]
- Zare, K.; Sadegh, H.; Shahryari-Ghoshekandi, R.; Asif, M.; Tyagi, I.; Agarwal, S.; Gupta, V.K. Equilibrium and Kinetic Study of Ammonium Ion Adsorption by Fe3O4 Nanoparticles from Aqueous Solutions. J. Mol. Liq. 2016, 213, 345–350. [Google Scholar] [CrossRef]
- Qiu, H.; Lv, L.; Pan, B.C.; Zhang, Q.J.; Zhang, W.M.; Zhang, Q.X. Critical Review in Adsorption Kinetic Models. J. Zhejiang Univ. Sci. A 2009, 10, 716–724. [Google Scholar] [CrossRef]
- Al-Rumaihi, A.; Shahbaz, M.; Mckay, G.; Mackey, H.; Al-Ansari, T. A Review of Pyrolysis Technologies and Feedstock: A Blending Approach for Plastic and Biomass Towards Optimum Biochar Yield. Renew. Sustain. Energy Rev. 2022, 167, 112715. [Google Scholar] [CrossRef]
- Wang, J.; Wang, S. Preparation, Modification and Environmental Application of Biochar: A Review. J. Clean. Prod. 2019, 227, 1002–1022. [Google Scholar] [CrossRef]
- Jia, G.; Zhou, Z.; Wang, Q.; Innocent, M.T.; Wang, S.; Hu, Z.; Wang, X.; Xiang, H.; Zhu, M. Effect of Pre-Oxidation Temperature and Heating Rate on the Microstructure of Lignin Carbon Fibers. Int. J. Biol. Macromol. 2022, 216, 388–396. [Google Scholar] [CrossRef]
- Kang, K.; Hu, Y.; Khan, I.; He, S.; Fatehi, P. Recent Advances in the Synthesis and Application of Magnetic Biochar for Wastewater Treatment. Bioresour. Technol. 2023, 390, 129786. [Google Scholar] [CrossRef]
- International Biochar Initiative. International Biochar Initiative—Standardized Product Definition and Product Testing Guidelines for Biochar That Is Used in Soil (Aka Ibi Biochar Standards) Version 2.0; International Biochar Initiative: Westerville, OH, USA, 2014. [Google Scholar]
- Wijitkosum, S. Biochar Derived from Agricultural Wastes and Wood Residues for Sustainable Agricultural and Environmental Applications. Int. Soil Water Conserv. Res. 2022, 10, 335–341. [Google Scholar] [CrossRef]
- De’Nobili, M.D.; Bernhardt, D.C.; Basanta, M.F.; Rojas, A.M. Sunflower (Helianthus annuus L.) Seed Hull Waste: Composition, Antioxidant Activity, and Filler Performance in Pectin-Based Film Composites. Front. Nutr. 2021, 8, 777214. [Google Scholar] [CrossRef]
- Fermanelli, C.S.; Chiappori, A.; Pierella, L.B.; Saux, C. Towards Biowastes Valorization: Peanut Shell as Resource for Quality Chemicals and Activated Biochar Production. Sustain. Environ. Res. 2022, 32, 3. [Google Scholar] [CrossRef]
- Duc, P.A.; Dharanipriya, P.; Velmurugan, B.K.; Shanmugavadivu, M. Groundnut Shell—A Beneficial Bio-Waste. Biocatal. Agric. Biotechnol. 2019, 20, 101206. [Google Scholar] [CrossRef]
- Seiler, G.J.; Gulya, T.J. Sunflower: Overview. In Reference Module in Food Science; Elsevier: Amsterdam, The Netherlands, 2016. [Google Scholar]
- Ge, Q.; Li, P.; Liu, M.; Xiao, G.M.; Xiao, Z.Q.; Mao, J.W.; Gai, X.K. Removal of Methylene Blue by Porous Biochar Obtained by Koh Activation from Bamboo Biochar. Bioresour. Bioprocess. 2023, 10, 51. [Google Scholar] [CrossRef]
- Ghzal, Q.; Javed, T.; Batool, M. Potential of Easily Prepared Low-Cost Rice Husk Biochar and Burnt Clay Composite for the Removal of Methylene Blue Dye from Contaminated Water. Environ. Sci. Water Res. Technol. 2023, 9, 2925–2941. [Google Scholar] [CrossRef]
- Arya, M.C.; Bafila, P.S.; Mishra, D.; Negi, K.; Kumar, R.; Bughani, A. Adsorptive Removal of Remazol Brilliant Blue R Dye from Its Aqueous Solution by Activated Charcoal of Thuja Orientalis Leaves: An Eco-Friendly Approach. SN Appl. Sci. 2020, 2, 265. [Google Scholar] [CrossRef]
- Parimelazhagan, V.; Yashwath, P.; Arukkani Pushparajan, D.; Carpenter, J. Rapid Removal of Toxic Remazol Brilliant Blue-R Dye from Aqueous Solutions Using Juglans Nigra Shell Biomass Activated Carbon as Potential Adsorbent: Optimization, Isotherm, Kinetic, and Thermodynamic Investigation. Int. J. Mol. Sci. 2022, 23, 12484. [Google Scholar] [CrossRef]
- Hua, Z.; Pan, Y.; Hong, Q. Adsorption of Congo Red Dye in Water by Orange Peel Biochar Modified with Ctab. RSC Adv. 2023, 13, 12502–12508. [Google Scholar] [CrossRef]
- Rubangakene, N.O.; Elwardany, A.; Fujii, M.; Sekiguchi, H.; Elkady, M.; Shokry, H. Biosorption of Congo Red Dye from Aqueous Solutions Using Pristine Biochar and Zno Biochar from Green Pea Peels. Chem. Eng. Res. Des. 2023, 189, 636–651. [Google Scholar] [CrossRef]
- Glaser, B.; Lehmann, J.; Zech, W. Ameliorating Physical and Chemical Properties of Highly Weathered Soils in the Tropics with Charcoal—A Review. Biol. Fertil. Soils 2002, 35, 219–230. [Google Scholar] [CrossRef]
- Tomczyk, A.; Sokołowska, Z.; Boguta, P. Biochar Physicochemical Properties: Pyrolysis Temperature and Feedstock KinEffects. Rev. Environ. Sci. Bio/Technol. 2020, 19, 191–215. [Google Scholar] [CrossRef]
- Ghani WA WA, K.; Mohd, A.; da Silva, G.; Bachmann, R.T.; Taufiq-Yap, Y.H.; Rashid, U.; Ala’a, H. Biochar Production from Waste Rubber-Wood-Sawdust and Its Potential Use in C Sequestration: Chemical and Physical Characterization. Ind. Crops Prod. 2013, 44, 18–24. [Google Scholar] [CrossRef]
- Ahmad, M.; Rajapaksha, A.U.; Lim, J.E.; Zhang, M.; Bolan, N.; Mohan, D.; Vithanage, M.; Lee, S.S.; Ok, Y.S. Biochar as a Sorbent for Contaminant Management in Soil and Water: A Review. Chemosphere 2014, 99, 19–33. [Google Scholar] [CrossRef]
- Alvear-Daza, J.J.; Cánneva, A.; Donadelli, J.A.; Manrique-Holguín, M.; Rengifo-Herrera, J.A.; Pizzio, L.R. Removal of Diclofenac and Ibuprofen on Mesoporous Activated Carbon from Agro-Industrial Wastes Prepared by Optimized Synthesis Employing a Central Composite Design. Biomass Convers. Biorefinery 2023, 13, 13197–13219. [Google Scholar] [CrossRef]
- Sutradhar, S.; Gao, W.; Fatehi, P. A Green Cement Plasticizer from Softwood Kraft Lignin. Ind. Eng. Chem. Res. 2023, 62, 1676–1687. [Google Scholar] [CrossRef]
- Kasera, N.; Kolar, P.; Hall, S.G. Nitrogen-Doped Biochars as Adsorbents for Mitigation of Heavy Metals and Organics from Water: A Review. Biochar 2022, 4, 17. [Google Scholar] [CrossRef]
- Seredych, M.; Hulicova-Jurcakova, D.; Lu, G.Q.; Bandosz, T.J. Surface Functional Groups of Carbons and the Effects of Their Chemical Character, Density and Accessibility to Ions on Electrochemical Performance. Carbon 2008, 46, 1475–1488. [Google Scholar] [CrossRef]
- Rehrah, D.; Reddy, M.R.; Novak, J.M.; Bansode, R.R.; Schimmel, K.A.; Yu, J.; Watts, D.W.; Ahmedna, M. Production and Characterization of Biochars from Agricultural by-Products for Use in Soil Quality Enhancement. J. Anal. Appl. Pyrolysis 2014, 108, 301–309. [Google Scholar] [CrossRef]
- Li, G.; Zhu, W.; Zhu, L.; Chai, X. Effect of Pyrolytic Temperature on the Adsorptive Removal of P-Benzoquinone, Tetracycline, and Polyvinyl Alcohol by the Biochars from Sugarcane Bagasse. Korean J. Chem. Eng. 2016, 33, 2215–2221. [Google Scholar] [CrossRef]
- Uchimiya, M.; Wartelle, L.H.; Klasson, K.T.; Fortier, C.A.; Lima, I.M. Influence of Pyrolysis Temperature on Biochar Property and Function as a Heavy Metal Sorbent in Soil. J. Agric. Food Chem. 2011, 59, 2501–2510. [Google Scholar] [CrossRef] [PubMed]
- Fodil Cherif, M.; Trache, D.; Brosse, N.; Benaliouche, F.; Fouzi Tarchoun, A. Comparison of the Physicochemical Properties and Thermal Stability of Organosolv and Kraft Lignins from Hardwood and Softwood Biomass for Their Potential Valorization. Waste Biomass Valoriz. 2020, 11, 6541–6553. [Google Scholar] [CrossRef]
- Dehkhoda, A.M.; Ellis, N.; Gyenge, E. Electrosorption on Activated Biochar: Effect of Thermo-Chemical Activation Treatment on the Electric Double Layer Capacitance. J. Appl. Electrochem. 2014, 44, 141–157. [Google Scholar] [CrossRef]
- Jing, F.; Pan, M.; Chen, J. Kinetic and Isothermal Adsorption-Desorption of Paes on Biochars: Effect of Biomass Feedstock, Pyrolysis Temperature, and Mechanism Implication of Desorption Hysteresis. Environ. Sci. Pollut. Res. 2018, 25, 11493–11504. [Google Scholar] [CrossRef] [PubMed]
- Chowdhury, Z.Z.; Karim, M.Z.; Ashraf, M.A.; Khalid, K. Influence of Carbonization Temperature on Physicochemical Properties of Biochar Derived from Slow Pyrolysis of Durian Wood (Durio Zibethinus) Sawdust. BioResources 2016, 11, 3356–3372. [Google Scholar] [CrossRef]
- Li, Z.Q.; Lu, C.J.; Xia, Z.P.; Zhou, Y.; Luo, Z. X-Ray Diffraction Patterns of Graphite and Turbostratic Carbon. Carbon 2007, 45, 1686–1695. [Google Scholar] [CrossRef]
- Yeboah, M.L.; Li, X.; Zhou, S. Facile Fabrication of Biochar from Palm Kernel Shell Waste and Its Novel Application to Magnesium-Based Materials for Hydrogen Storage. Materials 2020, 13, 625. [Google Scholar] [CrossRef]
- Panczyk, T.; Wolski, P.; Jagusiak, A.; Drach, M. Molecular Dynamics Study of Congo Red Interaction with Carbon Nanotubes. RSC Adv. 2014, 4, 47304–47312. [Google Scholar] [CrossRef]
- Alarifi, I.M.; Al-Ghamdi, Y.O.; Darwesh, R.; Ansari, M.O.; Uddin, M.K. Properties and Application of Mos2 Nanopowder: Characterization, Congo Red Dye Adsorption, and Optimization. J. Mater. Res. Technol. 2021, 13, 1169–1180. [Google Scholar] [CrossRef]
- Phuong DT, M.; Loc, N.; Miyanishi, T. Efficiency of Dye Adsorption by Biochars Produced from Residues of Two Rice Varieties, Japanese Koshihikari and Vietnamese Ir50404. Desalin. Water Treat 2019, 165, 333–351. [Google Scholar] [CrossRef]
- Sharma, P.; Kaur, H. Sugarcane Bagasse for the Removal of Erythrosin B and Methylene Blue from Aqueous Waste. Appl. Water Sci. 2011, 1, 135–145. [Google Scholar] [CrossRef]
- Fang, Q.; Chen, B.; Lin, Y.; Guan, Y. Aromatic and Hydrophobic Surfaces of Wood-Derived Biochar Enhance Perchlorate Adsorption Via Hydrogen Bonding to Oxygen-Containing Organic Groups. Environ. Sci. Technol. 2014, 48, 279–288. [Google Scholar] [CrossRef]
- Tan, Z.; Yuan, S.; Hong, M.; Zhang, L.; Huang, Q. Mechanism of Negative Surface Charge Formation on Biochar and Its Effect on the Fixation of Soil Cd. J. Hazard. Mater. 2020, 384, 121370. [Google Scholar] [CrossRef]
- Banik, C.; Lawrinenko, M.; Bakshi, S.; Laird, D.A. Impact of Pyrolysis Temperature and Feedstock on Surface Charge and Functional Group Chemistry of Biochars. J. Environ. Qual. 2018, 47, 452–461. [Google Scholar] [CrossRef]
- Wang, L.; Yan, W.; He, C.; Wen, H.; Cai, Z.; Wang, Z.; Chen, Z.; Liu, W. Microwave-Assisted Preparation of Nitrogen-Doped Biochars by Ammonium Acetate Activation for Adsorption of Acid Red 18. Appl. Surf. Sci. 2018, 433, 222–231. [Google Scholar] [CrossRef]
- Thomas, T.; Thalla, A.K. Nutmeg Seed Shell Biochar as an Effective Adsorbent for Removal of Remazol Brilliant Blue Reactive Dye: Kinetic, Isotherm, and Thermodynamic Study. Energy Sources Part A Recovery Util. Environ. Eff. 2022, 44, 893–911. [Google Scholar] [CrossRef]
- Raj, A.; Yadav, A.; Rawat, A.P.; Singh, A.K.; Kumar, S.; Pandey, A.K.; Sirohi, R.; Pandey, A. Kinetic and Thermodynamic Investigations of Sewage Sludge Biochar in Removal of Remazol Brilliant Blue R Dye from Aqueous Solution and Evaluation of Residual Dyes Cytotoxicity. Environ. Technol. Innov. 2021, 23, 101556. [Google Scholar] [CrossRef]
- Zhang, W.; Wang, Y.; Fan, L.; Liu, X.; Cao, W.; Ai, H.; Wang, Z.; Liu, X.; Jia, H. Sorbent Properties of Orange Peel-Based Biochar for Different Pollutants in Water. Processes 2022, 10, 856. [Google Scholar] [CrossRef]
- Yusop MF, M.; Abdullah, A.Z.; Ahmad, M.A. Adsorption of Remazol Brilliant Blue R Dye onto Jackfruit Peel Based Activated Carbon: Optimization and Simulation for Mass Transfer and Surface Area Prediction. Inorg. Chem. Commun. 2023, 158, 111721. [Google Scholar] [CrossRef]
- Sutradhar, S.; Alam, N.; Christopher, L.P.; Fatehi, P. KOH Catalyzed Oxidation of Kraft Lignin to Produce Green Fertilizer. Catal. Today 2022, 404, 49–62. [Google Scholar] [CrossRef]


| Raw Materials | Temperature, °C | Yield, % | N, % | C, % | H, % | H/C, Molar Ratio | O, % | O/C, Molar Ratio | BET Surface Area, m2/g |
|---|---|---|---|---|---|---|---|---|---|
| SFS | Raw | NA | 0.4 | 41.8 | 7.1 | 2.0 | 50.5 | 0.9 | ND |
| 300 | 49.2 | 0.9 | 56.7 | 6.9 | 1.4 | 35.3 | 0.5 | 7.2 | |
| 600 | 36.7 | 0.7 | 64.1 | 5.7 | 1.0 | 29.3 | 0.3 | ND | |
| 900 | 30.2 | 0.8 | 72.3 | 5.5 | 0.9 | 21.2 | 0.2 | 85.7 | |
| PNS | Raw | NA | 0.4 | 47.7 | 2.3 | 0.6 | 49.4 | 0.8 | ND |
| 300 | 56.1 | ND | ND | ND | ND | ND | ND | ND | |
| 600 | 32.4 | ND | ND | ND | ND | ND | ND | ND | |
| 900 | 30.2 | 1.2 | 83.7 | 2.9 | 0.42 | 12 | 0.11 | 2.1 |
| Mass Concentration, % | |||||
|---|---|---|---|---|---|
| Bond Types | Assignments | SFS-R | PNS-R | SFS900 | PNS900 |
| C1 | C-H, C-C, C=C | 60.9 | 50.2 | 74.7 | 72.8 |
| C2 | C-OH/C-O-C | 29.1 | 36.5 | 12.6 | 21.8 |
| C3 | C=O, carbonyl | 6.1 | 10.7 | 12 | 4.9 |
| C4 | C=O, carboxylic | 3.9 | 2.7 | 0.7 | 1.0 |
| Biomass | Pyrolysis Condition Temperature | Dyes | Dye Concentration, mg/L | Biochar Dosages, g/L | Max. Removal Efficiency | Contact Time, min | pH | References |
|---|---|---|---|---|---|---|---|---|
| Walnut | 700 | RBB | 200 | 5 | 65 | 720 | 2 | [20] |
| Swege sludge | 450 | RBB | 30 | 100 | 67 | 20 | 10 | [49] |
| Orange Peels | 800 | MB | 10 | 10 | 99 | 30 | 7 | [50] |
| Jack fruit peel (Activated) | 550 | RBB | 25 | 1 | 90 | 420 | 4 | [51] |
| Nutmeg seed shells | 500 | RBB | 52.5 | 3 | 93.7 | 110 | 12 | [48] |
| Green pea peels | 700 | CR | 100 | 1 | 40 | 90 | 7 | [22] |
| Peanut shell | 900 | RBB | 25 | 8.3 | 100 | 30 | 6.5 | Current study |
Disclaimer/Publisher’s Note: The statements, opinions and data contained in all publications are solely those of the individual author(s) and contributor(s) and not of MDPI and/or the editor(s). MDPI and/or the editor(s) disclaim responsibility for any injury to people or property resulting from any ideas, methods, instructions or products referred to in the content. |
© 2024 by the authors. Licensee MDPI, Basel, Switzerland. This article is an open access article distributed under the terms and conditions of the Creative Commons Attribution (CC BY) license (https://creativecommons.org/licenses/by/4.0/).
Share and Cite
Sutradhar, S.; Mondal, A.; Kuehne, F.; Krueger, O.; Rakshit, S.K.; Kang, K. Comparison of Oil-Seed Shell Biomass-Based Biochar for the Removal of Anionic Dyes—Characterization and Adsorption Efficiency Studies. Plants 2024, 13, 820. https://doi.org/10.3390/plants13060820
Sutradhar S, Mondal A, Kuehne F, Krueger O, Rakshit SK, Kang K. Comparison of Oil-Seed Shell Biomass-Based Biochar for the Removal of Anionic Dyes—Characterization and Adsorption Efficiency Studies. Plants. 2024; 13(6):820. https://doi.org/10.3390/plants13060820
Chicago/Turabian StyleSutradhar, Shrikanta, Arijit Mondal, Felix Kuehne, Oliver Krueger, Sudip K. Rakshit, and Kang Kang. 2024. "Comparison of Oil-Seed Shell Biomass-Based Biochar for the Removal of Anionic Dyes—Characterization and Adsorption Efficiency Studies" Plants 13, no. 6: 820. https://doi.org/10.3390/plants13060820