Article

Phenotypic and Physiological Evaluation of Two and Six Rows Barley under Different Environmental Conditions

1
Crop Science Department, Faculty of Agriculture, Damanhour University, 22516 Damanhour, Egypt
2
Barley Research Department, Field Crops Research Institute, Agricultural Research Center, 22571 Nubaria, Egypt
*
Author to whom correspondence should be addressed.
Plants 2018, 7(2), 39; https://doi.org/10.3390/plants7020039
Submission received: 5 April 2018 / Revised: 2 May 2018 / Accepted: 2 May 2018 / Published: 4 May 2018

Abstract

:
In recent years, barley has attracted more interest as a food and feed source because of its high soluble dietary fiber and β-glucan content compared with other small grains. Twenty-five barley genotypes (20 imported genotypes and five check cultivars) were grown in three environments for two successive seasons: 2015/2016 and 2016/2017. The first environment was in El-Nubaria, Alexandria, Egypt during 2015/2016, while the second and third environments were in El-Bostan, Elbhera, Egypt during 2015/2016 and 2016/2017. The experiments were conducted in a randomized complete block design with the three replicates. The primary objectives of the current study were to evaluate the performance of 20 imported barley genotypes under several environmental conditions. The imported materials were superior to the local commercial cultivars for several traits, including grain yield. Therefore, the superior genotypes will be further evaluated and used in barley breeding programs. Our future work will focus on creating several crosses among the selected superior genotypes to improve yield and other important traits, while applying marker-assisted selection.

1. Introduction

Climate change and fluctuation in the environmental conditions imposed several abiotic and biotic stress conditions on field crops. Abiotic stress-tolerant field crops are the ultimate solution to cope with the projected climatic changes. Barley (Hordeum vulgare L.) proved to be one of the crops that can provide a source of abiotic stress tolerance genes, and thus grow under a wide range of environmental conditions [1]. Barley is the fourth most important cereal crop after wheat, rice, and maize [2]. Barley can be used as a nutritional source for both humans and livestock [3]. Moreover, barley grain contains about 20% of dietary fiber and β-glucan, which varies between 3–7% [4]. Martinez et al. [5] have shown that barley β-glucan has significant blood cholesterol-lowering effects. Barley β-glucan increases the viscosity of digestion in the intestine, slowing down the rate of starch digestion and absorption [6], which is beneficial to people with diabetes [7].
Barley has the potential to grow under limited water conditions and saline soils. Salinity-affected soils in Egypt account for about 33% of the total cultivated land [8]. Additionally, barley was found to be moderately tolerant to drought stress, which is useful because of the limited amount of water that is available for irrigation in Egypt [9]. Furthermore, rainfall in Egypt is less than 130 mm/year on average, while it exceeds 200 mm in some parts of the world; albeit, the productivity of rainfed barley in Egypt is higher than the average worldwide productivity [10]. Adverse environmental conditions in Egypt force barley breeders to import genotypes to cope with such low-input conditions. In addition to the limited water that is available for irrigation combined with the low precipitation in Egypt, there are other low-input conditions, such as poor soil fertility [10]. Overall, the harvested barley area was doubled during the last couple of years, in which it increased from 30.39 thousand hectares in 2000/2001 to 77.57 thousand hectares in 2015/2016. The total barley production increased from 93.9 thousand tons in 2000/2001 to 120.1 thousand ton in 2015/2016. Furthermore, barley production decreased from 3.03 tons/ha in the 2000/2001 growing season to 1.55 tons/ha in the 2015/2016 growing season [11]. The decline in barley productivity in Egypt might be attributed to adverse environmental conditions such as drought, salinity, reduced soil fertility, and high temperature, as well as certain biotic stresses such as leaf rust, powdery mildew, net blotch, and viral diseases. The lack of adequate genetic variability aggravated the adverse effect of previously mentioned biotic and abiotic stresses [10].
Therefore, it is necessary to increase the genetic variability of barley in Egypt in order to allow breeders to select new genotypes with high yield potential and more adaptability to climate change. On the other hand, the lack of phenotypic evaluation remains one of the serious constraints that limit the use of available plant collections across plant-breeding programs [12,13]. Therefore, pre-breeding became one of the essential steps to utilize plant genetic resources conserved in several comprehensive worldwide seed collections [13]. Pre-breeding is also one of the most effective approaches that can be used to improve cultivated genotypes using genes or traits from exotic materials [14]. The Global Crop Diversity Trust defined pre-breeding as “the art of identifying desired qualities and integrating them into modern breeding materials” [15]. Overall, pre-breeding refers to specific activities that are designed to identify desirable traits and genes from wild or exotic germplasm. Identifying such traits or genes is usually followed by transferring it into an intermediate set of plant materials that plant breeders could incorporate in his or her breeding efforts to develop improved genotypes [16,17].
The genetic base of the current cultivated barley materials in Egypt is limited [10], which raises a critical question about the resilience of the Egyptian barley-breeding programs to biotic outbreaks or anticipated fluctuations in the environmental conditions. In the current study, we evaluated imported barley genotypes under several environmental conditions side by side with locally adapted cultivars. Our future work will focus on crossing the superior exotic genotypes with local cultivars to form several families, giving that our ultimate goal is to increase yield production and maintain adequate genetic diversity for future improvements.

2. Materials and Methods

2.1. Plant Materials and Experimental Conditions

The present study was conducted in three environments (two locations in 2015/2016 and a single location in 2016/2017). The two locations were El-Nubaria, Alexandria, Egypt (30°53′36′′ N, 30°04′35′′ E), and El-Bostan Experimental Farm, Faculty of Agriculture, Damanhour University, Egypt (30°46′46′′ N, 30°82′32′′ E). During 2015/2016, the plant materials were planted in El-Bostan (E2) and El-Nubaria (E1). However, in 2016/2017, the studied materials were planted in El-Bostan only (E3).
The plant materials contained a collection of 20 barley lines that were obtained from the University of Minnesota, Minnesota, United States (USA) (Table 1) in addition to five check cultivars (“Giza123”, “Giza127”, “Giza132”, “Giza134”, and “Giza136”) obtained from the Agriculture Research Center (ARC), Egypt (Table 1). A randomized complete block design with three replicates was used in each environment. The plot size (experimental unit) was 3.75 m2 (4 rows ×1.5 m × 2.5 m). Seeding rate was 119 kg ha−1. Sowing dates were during the first half of November in the two growing seasons. Soil analysis was conducted on soil samples collected from 30-cm depth from each location according to Black et al. [18] (Supporting Information, Table S1). Additionally, the meteorological data are presented in the Supporting Information, Table S2.

2.2. Studied Traits

The number of days to flowering (DF) was recorded when 50% of the spikes in a plot had extruded anthers (noted as days from 1 January). Plant height (PH) was measured on a random sample of five plants in each plot as the length from the soil surface to the tip of the spike at harvest time. A random sample of 10 spikes was collected from each plot, and the mean number of grains per spike (NG/S) for each plot was calculated. For the measurement of 1000-grain weight (TGW), 1000 seeds were taken randomly from each genotype grain yield and weighed. The grain yield (GY) was determined by harvesting the four rows of each plot, and expressed as tons/ha. Leaf chlorophyll content (CHL) was estimated using a spad-502 chlorophyll meter (Minolta, Japan). Leaf area (LA) was estimated according to [19] the equation as follows:
Leaf   area   ( LA ) = L × W × 0.75
where L and W are the length and width of the flag leaf, respectively.
Leaf rust was visually scored as a percentage of leaf area infected for each barley plot under open field conditions. Leaf rust severity (%) was recorded for each genotype across the three environments using the modified Cobb’s scale [20]. Plant reaction (infection type) expressed in five types were: immune = O, resistant = R, moderately resistant = MR, moderately susceptible = MS, and susceptible = S [21]. The coefficient of infection for leaf rust has been calculated on the infection type after replacing the infection types with 0, 0.2, 0.4, 0.8, and 1 scores for immune, resistant, moderately resistant, moderately susceptible, and susceptible, respectively. Net blotch (Pyrenophora teres f. teres, NB) and powdery mildew (Blumeria graminis f. sp. hordei, PM) were visually scored as a percentage of leaf area infected for each plot under open field conditions. Plants with disease scores of 0 were classified as immune, plants that scored 1 and 2 were classified as resistant, plants that scored 3 and 4 were classified as moderately resistant, plants that scored 5 and 6 were classified as moderately susceptible, and plants with a score of 7 to 9 were classified as susceptible [22].

2.3. Statistical Analysis

Data were statistically analyzed using the analysis of variance procedures by SAS 9.2 (SAS v9.2; SAS Institute Inc., Cary, NC, USA) for a randomized complete block design as follows:
Y i j = μ + B j + G i + e i j
where Yij is the traits; μ is a population mean; Gi is the effect of genotype i; Bj is the effect of block j; and eij is the experimental error.
The linear model for an across environments combined analysis of variance was conducted as follows:
Y i j k = μ + E i + B k ( E i ) + G j + ( G E ) i j + e i j k
where μ is a population mean; Ei is the effect of environment i; Gj is the effect of genotype j; (GE)ij is the interaction effect of j genotype × i environment; Bk is the effect of block k in environmental i; and eijk is the experimental error.
Means were compared using the Lsd test (p-value ≤ 0.05), according to Gomez et al. [23]. The homogeneity of variance in different environments was tested following Bartlett’s test [24]. Combined analyses of variance were performed among environments with homogeneous variance, as outlined by Cochran et al. [25]. Correlation coefficients were conducted using the Pearson correlation coefficient. A cluster analysis of the genotypes for all of the traits across the three environments was carried out using Ward’s method on the Euclidian distance [26]. A biplot for genotypes and traits was used to visualize the interaction between genotypes and environments using R software [27] and the FactoMineR package [28].

3. Results

The Bartlett’s test [24] results indicated homogeneous variance across environments for the number of days to flowering, plant height, number of grains/spike, leaf area, and grain yield. Whereas there was a non-homogeneous variance for 1000-grain weight, total chlorophyll content, leaf rust disease, net blotch disease, and powdery mildew disease. Therefore, a combined analysis of variance was conducted for only traits with homogeneous variance across the three environments.

3.1. Analysis of Variance

All of the morphological, physiological, and pathological traits that were measured (Table 2 and Table 3) revealed significant statistical differences among genotypes under the three environments except resistance to net blotch and powdery mildew diseases. There were non-significant differences among genotypes in E1 and E2 for net blotch resistance, while non-significant differences were observed among genotypes for powdery mildew resistance under E1 and E3.
The results of combined analysis of variance (Table 3) indicated highly significant (p-value ≤ 0.01) differences among the three environments for traits such as number of days to flowering, plant height, number of grains/spike, grain yield, and leaf area. The interaction between environment × genotypes was highly significant (p-value ≤ 0.01) for number of days to flowering, plant height, number of grains/spike, grain yield, and leaf area.

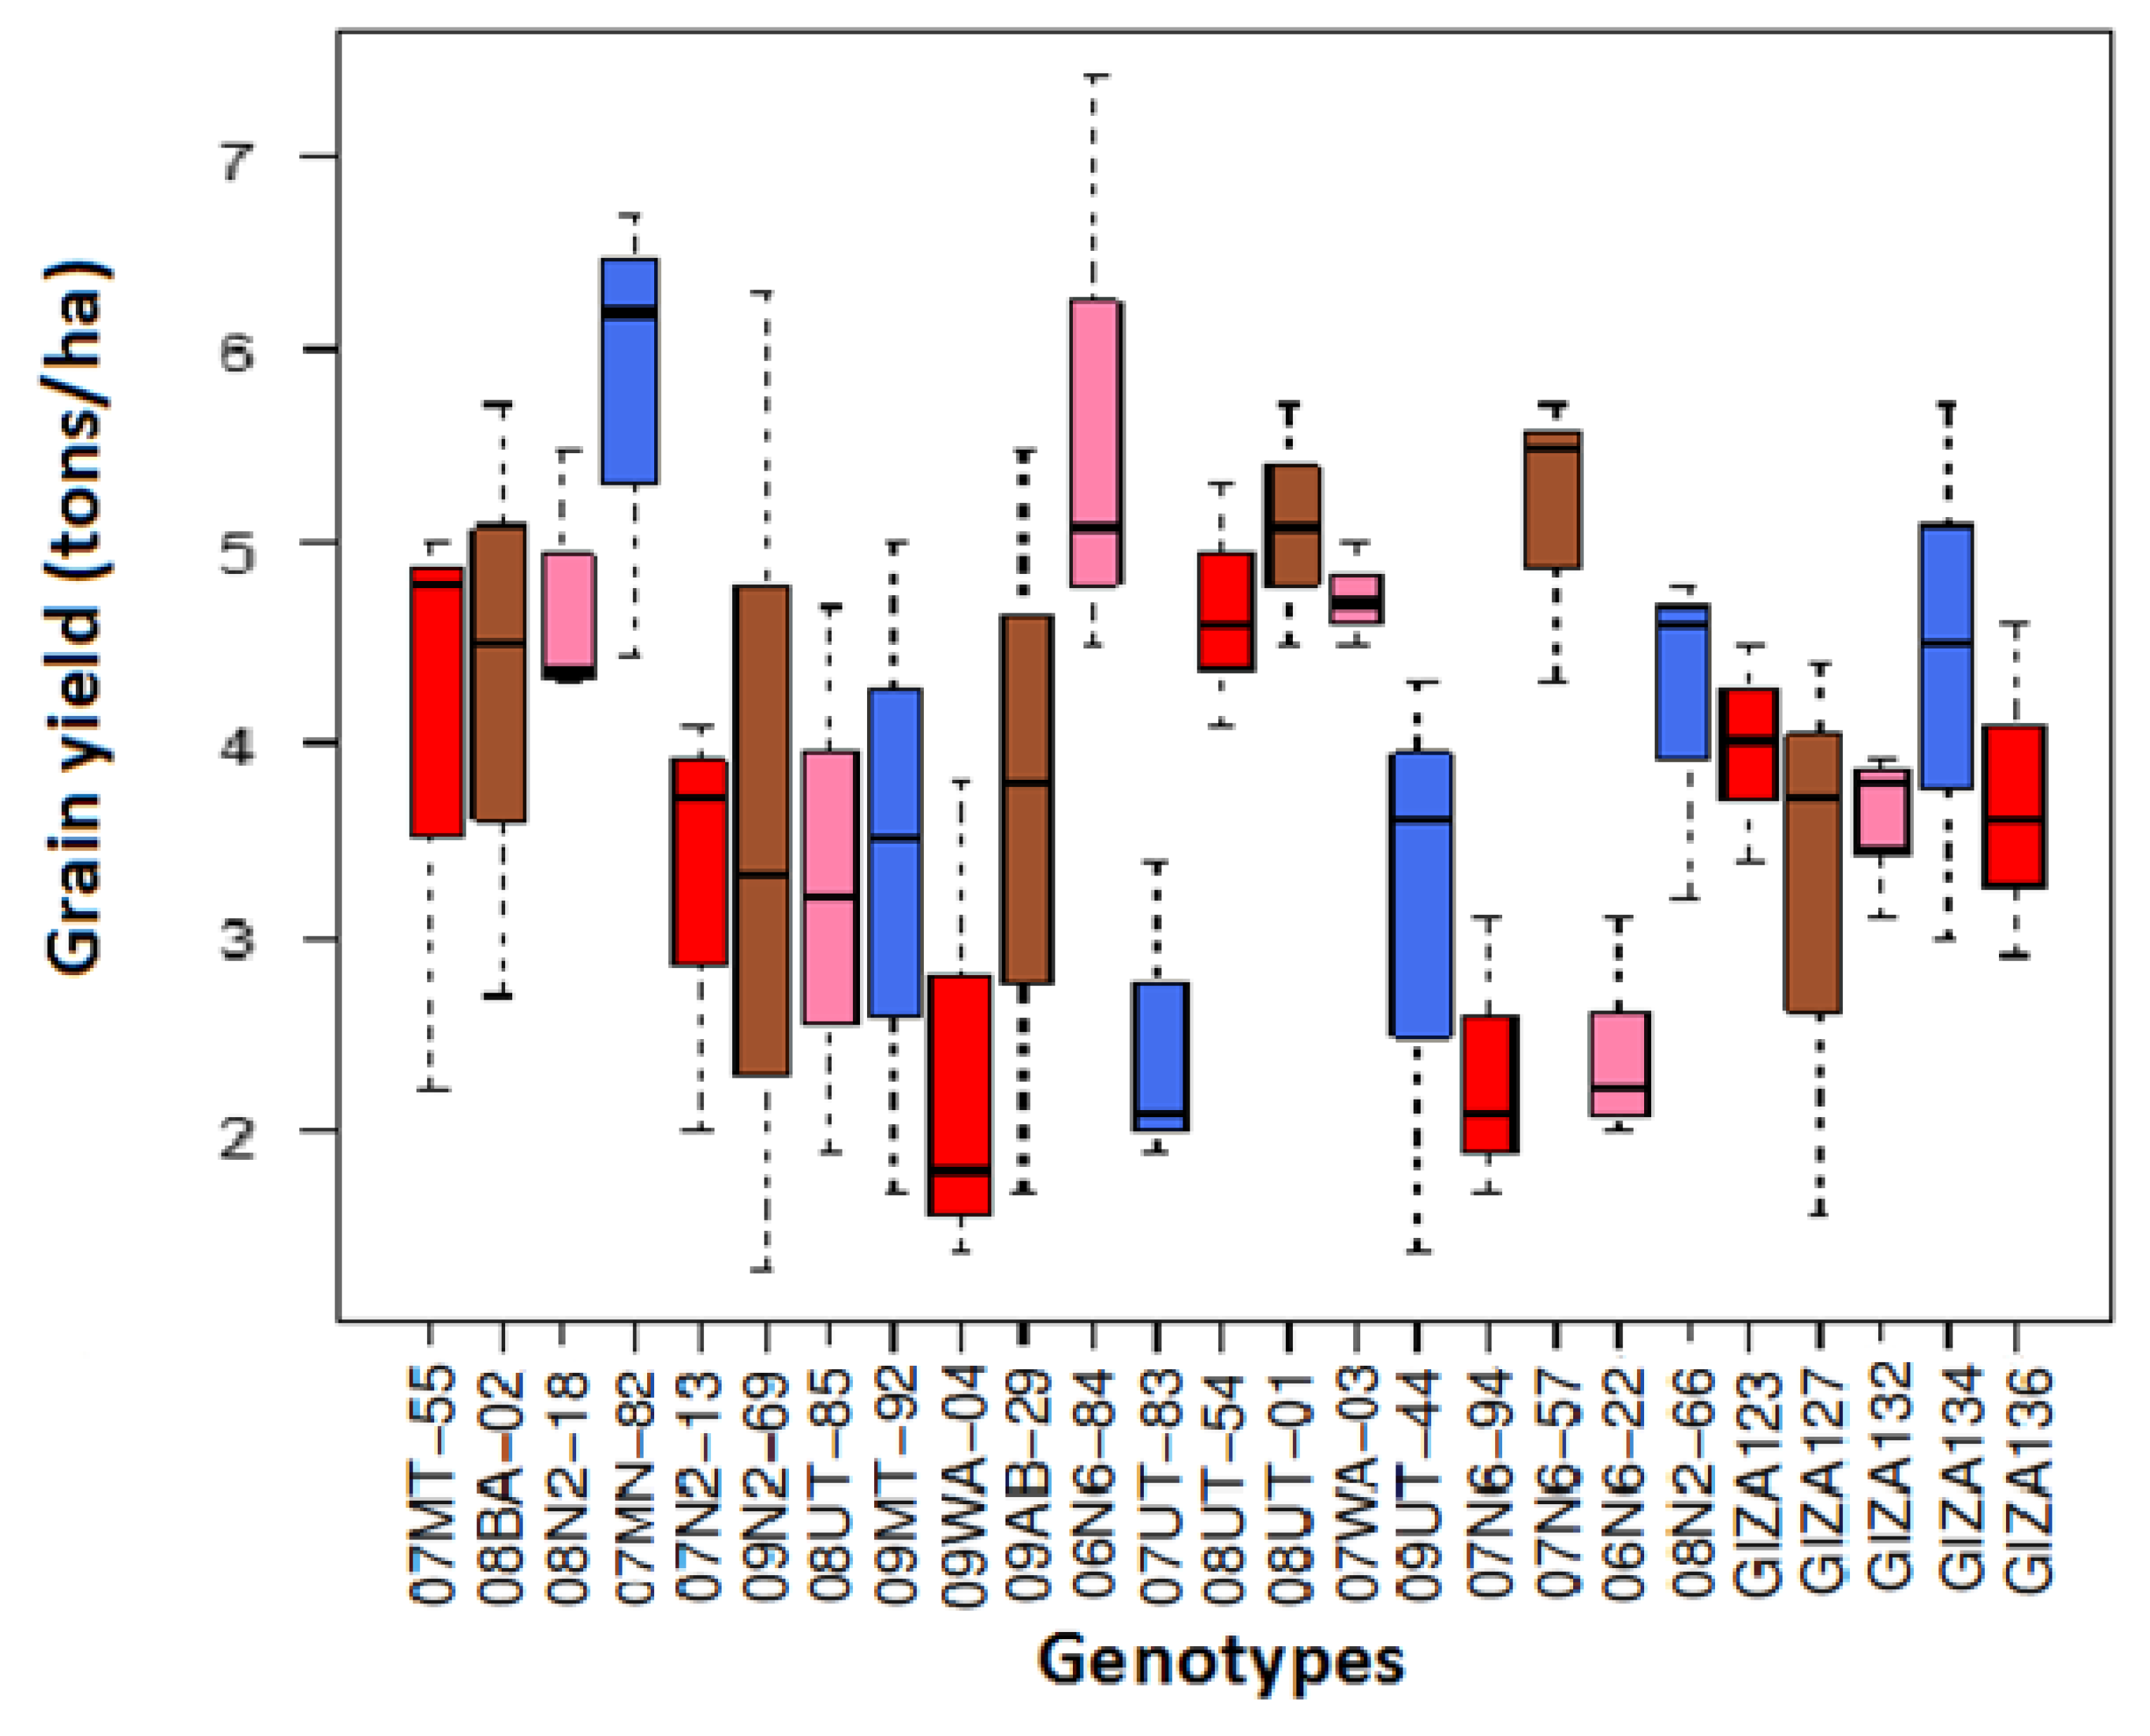
3.2. Traits Mean Across Genotypes and Environments

Mean values for the number of days to flowering (DF) was 66.24 days in E1, 70.4 days under E2, and 64.7 days in E3, with an overall mean of 67.1 days. The earliest genotype under the three environments was 07MN-82, with an average number of days of 56.2, while the latest genotype was 09WA-04, which flowered after 78.8 days (Supporting Information, Table S3). Furthermore, the mean of the plant height among the three environments was 89.8 cm in E1, 87.3 cm under E2, and 80.3 cm in E3, with an overall mean of 85.7 cm. The tallest genotype across three environments was 07N6-94 (96.1 cm), while the shortest genotype was 08N2-66, where it recorded 72 cm (Supporting Information, Table S3). The mean for the number of grains/spike (NG/S) among the three environments was 44.85 grains/spike in E1, and 47.09 grains/spike in E2, while it was 49 grains/spike in E3, with an overall mean of 46.98 grains/spike (Supporting Information, Table S4). Genotype 08UT-01 had the highest NG/S (78.1 grains/spike), but genotype 07N2-13 produced the lowest number of grains/spike (23.8 grains/spike) under the three environments.
Means of the 1000-grain weight (TGW) for the 25 genotypes under the three environments were 48.4 g, 34.9 g, and 37.2 g in E1, E2, and E3, respectively (Supporting Information, Table S4). In E1, the highest genotype in TGW was Giza 136 (68.3 g), while the lowest genotype was Giza 127 (28 g). In E2, the imported genotypes produced the highest and the lowest TGW, where the highest genotype was 08N2-18 (47 g), and the lowest genotypes were 08UT-85, 07UT-83, and 09UT-44, where they recorded 20 g. In E3, the highest genotype was 08N2-18 (52 g), while the lowest genotype was 07UT-83, where it recorded 24g.
The highest mean grain yield was 4.7 tons/ha in E3, while it was 3.7 tons/ha and 3.3 tons/ha in E1 and E2, respectively. The imported genotypes exceeded the Egyptian cultivars in grain yield (GY), where the highest imported genotype was 07MN-82 with 5.7 tons/ha. Moreover, the highest Egyptian cultivar was Giza 134 (4.4 tons/ha), and the lowest genotype in GY was 07N6-94, where it recorded 2.3 tons/ha (Figure 1 and Supporting Information, Table S4).
The mean total chlorophyll content for the 25 genotypes across the three environments were 48.4 SPAD units, 45.96 SPAD units and 50.3 SPAD units under E1, E2 and E3, respectively (Supporting Information, Table S5). In E1, the highest genotype in total chlorophyll content was Giza 132 (74.3 SPAD units), while the lowest genotype was 09AB-29 (39.4 SPAD units). In E2, the highest genotype in regard to total chlorophyll content was 06N6-84 (72.7 SPAD units), while the lowest genotype was 07UT-83 (38 SPAD units). In the E3, the highest genotype was 07N2-13 (55.5 SPAD units), while the lowest genotype was 07UT-83 (37.7 SPAD units). Leaf area (LA) means were 15.83 cm2, 18.97 cm2, and 22.1 cm2 under E1, E2, and E3, respectively (Supporting Information, Table S5). The highest genotype for LA across the three environments was 09UT-44 (31.9 cm2), while the lowest genotype was 08N2-66 (9.7 cm2).
The mean coefficient values of infection for leaf rust (LR) across the three environments conditions were 25.6, 32 and 25 for E1, E2, and E3, respectively (Supporting Information, Table S6). In E1, the most resistant genotypes to leaf rust were Giza 134, followed by Giza 132, where they recorded 2, while the most susceptible genotypes were 08UT-85 and 09N2-69, where they recorded 63.3.
In E2, the most resistant genotypes to leaf rust disease were 07N2-13, 09N2-69, 09AB-29, 08UT-85, 09MT-92, and 08N2-66, where they recorded 4, while the most susceptible genotype to leaf rust was 07UT-83, where it recorded 63 (Supporting Information, Table S6). In E3, the most resistant genotypes were 07N2-13, 09N2-69, 09WA-04, 09AB-29, 08UT-85, 07WA-03, 08N2-66, Giza132, Giza134, Giza127, and Giza136, where they recorded 2, while the most susceptible genotype was 09UT-44, where it recorded 85 (Supporting Information, Table S6). Overall, the most resistant genotype under the three environments to leaf rust disease was Giza 136, where it recorded 5.1, while the most susceptible genotype was 07UT-83, where it recorded 58.2 (Figure 2).
The mean values of the net blotch resistance scores (NB) were 1.2, 1, and 2 for E1, E2, and E3, respectively. In E3, among the 20 imported genotypes tested, 14 genotypes (08BA-02, 07MN-82, 09N2-69, 08UT-85, 09WA-04, 09AB-29, 06N6-84, 07UT-83, 08UT-01, 09UT-44, 07N6-94, 07N6-57, 06N6-22, and 08N2-66) exhibited a high resistance response to NB disease, where they recorded 1, while two genotypes (08N2-18 and 09MT-92) exhibited a moderately resistant response for NB disease, where they recorded 3 and 4, respectively. Two genotypes—08UT-54 and 07WA-03—exhibited a moderate susceptibility response for NB disease, where they recorded 5.6 and 5.3, respectively. Furthermore, two genotypes (07N2-13 and 07MT-55) exhibited a susceptible response for NB disease (6.6 and 6.5 respectively). Additionally, the Egyptian cultivars (Giza123, Giza 127, Giza 132, Giza 134, and Giza 136) exhibited a high resistance response for NB disease, where they recorded 1 (Supporting Information, Table S6).
On the other hand, the mean values of the powdery mildew resistance scores (PM) were 1, 3.5, and 1 for E1, E2, and E3, respectively (Supporting Information, Table S6). In E2, among the 20 imported genotypes tested, seven genotypes (08BA-02, 08N2-18, 07MN-82, 09N2-69, 09WA-04, 06N6-84, and 06N6-22) exhibited a high resistance response to PM, where they recorded 2, 2.6, 2.6, 2.6, 1.6, 2.6, and 2.6, respectively. Five genotypes (07MT-55, 08UT-85, 07WA-03, 07N6-57, and 08N2-66) exhibited a moderately resistant response for PM, where they recorded 3. Another five genotypes (07N2-13, 09MT-92, 09AB-29, 08UT-01, and 07N6-94) exhibited a moderately susceptible response for PM disease, where they recorded 5, 4.3, 5, 5.6, and 5, respectively.
Three genotypes (07UT-83, 08UT-54, and 09UT-44) exhibited a susceptible response for PM disease, where they recorded 6, 6, and 8, respectively. The Egyptian cultivars (Giza134 and Giza127) exhibited a high resistance response for PM, where they recorded 0.66 and 1.6, respectively. Cultivars Giza132, Giza136, and Giza123 exhibited a moderately resistant response for PM, where they recorded 2.6, 2, and 3, respectively (Supporting Information, Table S6).

3.3. Relationships among the Studied Traits

The first two principal components accounted for 31.69% and 23.01% of the total variability (Figure 3). The correlation coefficients among all of the traits under the three environments are shown in Table 4. The results revealed a significant positive correlation (p-value ≤ 0.05) among total chlorophyll content, leaf area, and plant height. Moreover, our results indicate non-significant correlation (p-value > 0.05) between total chlorophyll content and grain yield, number of grains/spike, 1000-grain weight, leaf rust, net blotch, and powdery mildew. Meanwhile, the correlation was significant and negative among the number of days to flowering, 1000-grain weight, and grain yield (Table 4). Furthermore, the correlation between the number of days to flowering and total chlorophyll content was significant and negative. Our results also indicate non-significant correlation for the number of days to flowering with plant height, number of grains/spike, leaf rust, net blotch, powdery mildew, and leaf area. Correlations of plant height with the number of grains/spike, leaf rust, and leaf area were significant and positive. Meanwhile, the correlation of plant height with 1000-grain weight, net blotch, powdery mildew, and grain yield were non-significant. The number of grains/spike was positive and significantly correlated with leaf rust and leaf area, but it was non-significantly correlated with 1000-grain weight, net blotch, powdery mildew, and grain yield. 1000-grain weight was significantly and positively correlated with grain yield, while it was non-significantly correlated with leaf rust, net blotch, powdery mildew, and leaf area. Leaf rust was significantly and positively correlated with leaf area, but it was not significantly correlated with net blotch, powdery mildew, and grain yield. The correlation between net blotch and powdery mildew was positive and significant, while it was not significantly correlated with leaf area and grain yield. Powdery mildew was not significantly correlated with leaf area and grain yield. Finally, the correlation between leaf area and grain yield was not significant.

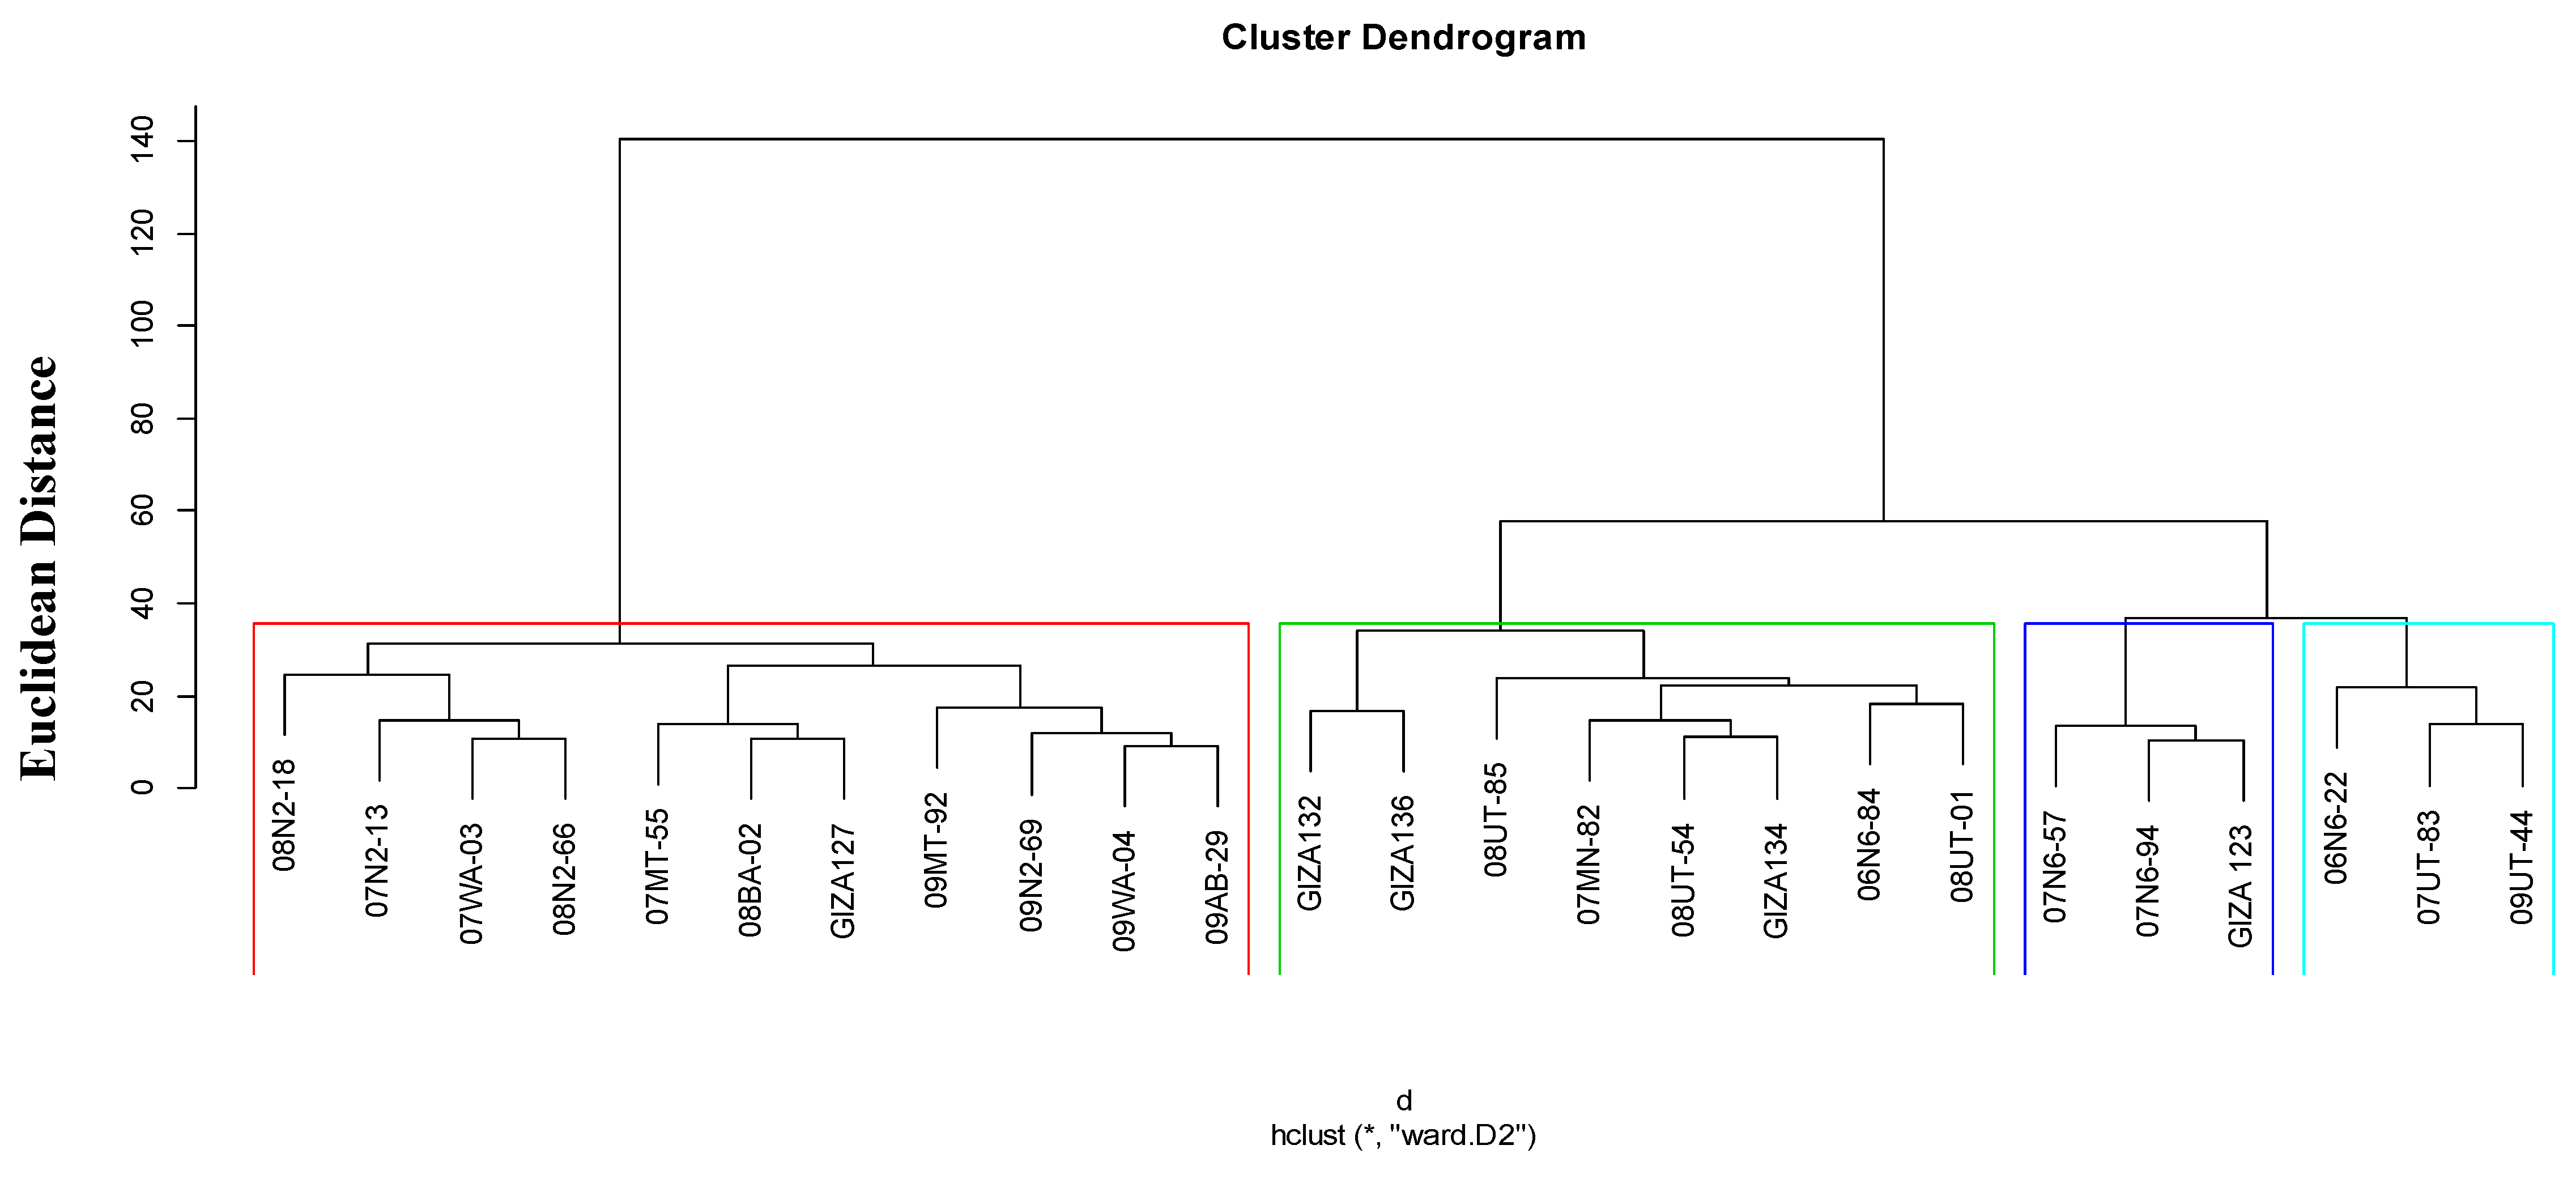
3.4. Relationships among Barley Genotypes

A cluster analysis for the 25 barley genotypes based on the phenotypic, physiological, and pathological traits using Ward’s method is depicted in Figure 4. Across the three environments, conditions cluster analysis assigned the genotypes into four clusters. The first cluster consisted of 11 genotypes (08N2-18, 07MT-55, 08BA-02, 07N2-13, 09N2-69, 09MT-92, 09WA-04, 09AB-29, 07WA-03, 08N2-66, and Giza127) and represented 44% of the total genotypes; this group represented mainly the two-row genotypes. The second group contained 32% of the total genotypes (08UT-85, 07MN-82, 08UT-54, 06N6-84, 08UT-01, Giza132, Giza134, and Giza136). Meanwhile, genotypes 07N6-94, Giza123, and 07N6-57 were classified in the third cluster, which represented 12% of the total genotypes. Furthermore, the fourth cluster contained 06N6-22, 07UT-83, and 09UT-44, and accounted for 12% of the total genotypes.

4. Discussion

Twenty barley genotypes were imported from the University of Minnesota, which were evaluated under the field conditions in Egypt. Our results indicated superior performance for the imported genotypes in grain yield, number of days to flowering, plant height, number of grains/spike, 1000-grain weight, and leaf area. Our ultimate objective was to identify potential genotypes suitable to the Egyptian growth conditions (Supporting Information, Table S2). The imported barley genotypes outperformed the Egyptian cultivars in traits such as grain yield, number of grains/spike, 1000-grain weight, and leaf area, which agrees with previous reports [10,25]. Meanwhile, the Egyptian cultivars outperformed the imported genotypes for total chlorophyll content and resistance to leaf rust, net blotch, and powdery mildew diseases. These results could be due to the higher adaptability in the local cultivars compared with the imported materials [29,30]. The three environments used in this study were selected on the basis of their differences in agro-ecological, soil texture, and pathological features. The different response that was observed among genotypes within the same environment may be attributed to the different origin and genetic background [31]. As a result, the cluster analysis assigned the genotypes into four clusters that were similar in morphological, physiological, and pathological traits. On the other hand, genotype × environment interaction was observed among genotypes in which genotypes responded differently across the three environments. These results were in agreement with previous studies [32,33,34] where the variation in the environmental and soil conditions was found to contribute to differences in morphological traits such as grain yield, number of grains/spike, leaf area, chlorophyll content, plant height, and grain weight for the same genotypes. Additionally, the third environment (E3) was more suitable for most of the barley genotypes due to exposing the genotypes to favorable growth conditions, which resulted in the better overall performance of the genotypes under this environment [35,36]. The results of barley resistance to leaf rust, net blotch, and powdery mildew diseases indicated a correlation between these diseases and the eco-geographical characteristics of the locations used, including average annual rainfall, altitude, and average annual temperature [37,38]. Our results highlighted the importance of testing genotypes under different environmental conditions to identify the best genotypes for a particular environment [29]. The 25 genotypes used in this study were evaluated for morphological traits, grain yield, some yield components, and physiological and pathological traits. The importance of these traits comes from using them to identify the most adapted genotypes. Also, these traits are essential and useful for plant breeders seeking to increase genetic variability and yield production [30,31,39,40,41]. Furthermore, our results indicated that the number of days to flowering, plant height, number of grains/spike, leaf area, and grain yield were less affected by the environmental conditions, which agree with previous reports [40,42,43], and might explain the homogeneity of variance across the environments for those traits. The combined analysis of variance for homogeneous traits indicated that the genotypic variance explained 57.9%, 38%, 91%, 41.9%, and 54,6% of the total variance for traits such as the number of days to flowering, plant height, number of grains/spike, grain yield, and leaf area, respectively. The obtained results were in agreement with previous reports in which the kernel weight, grain yield, number of days to flowering, leaf area, number of kernels per main spike, biological yield per plant, and plant height were found to have high to moderate genotypic variance [3,40,43,44,45]; therefore, selection can be based on these characters. The determination of correlation coefficients among traits helps obtain the best combinations of attributes for obtaining a higher yield per unit area [46]. In the current study, the correlation between grain yield and number of days to flowering was negative and significant. These results are compatible with Ismail and Khokhar et al. [47,48]. On the other hand, the correlation between grain yield and 1000-grain weight was positive and significant, which agrees with previously reported results [49,50]. Our overall results indicated the superiority of some of the imported barley genotypes (07MN-82, 06N6-84, 08UT-01, 07N6-57, 08N2-18, 07WA-03 and 08UT-54) compared with the local commercial cultivars for grain yield and other important traits.

5. Conclusions

The results reported indicate the possibility of cultivating these genotypes directly in Egypt and exploiting their genetic backgrounds via crosses with the local cultivars. We expect that crossing the selected barley materials with the local cultivars might enhance the genetic variability of the Egyptian barley, while improving yield potentials. Our future work will focus on creating several crosses among the selected superior genotypes to improve yield and other important traits, while applying marker-assisted selection.

Supplementary Materials

The following are available online at https://www.mdpi.com/2223-7747/7/2/39/s1, Table S1: Physical and chemical soil properties for E1 (El-Nubaria station 2015/2016), E2 (El-Bostan 2015/2016) and E3 (El-Bostan 2016/2017). Table S2: Meteorological parameters for E1 (El-Nubaria station 2015/2016), E2 (El-Bostan 2015/2016) and E3 (El-Bostan 2016/2017). Table S3: Genotypes means for the number of days to flowering (days) and plant height (cm), under three environments, E1 (El-Nubaria station 2015/2016), E2 (El-Bostan 2015/2016) and E3 (El-Bostan 2016/2017). Table S4: Genotypes means for number of grains/spike, 1000- grain weight (g) and grain yield (tons/ha), across E1 (El-Nubaria station 2015/2016), E2 (El-Bostan 2015/2016) and E3 (El-Bostan 2016/2017). Table S5: Genotypes means for total chlorophyll (Spad unit) and leaf area (cm2), under three environments, E1 (El-Nubaria station 2015/2016), E2 (El-Bostan 2015/2016) and E3 (El-Bostan 2016/2017). Table S6: Genotypes means for leaf rust, net blotch, and powdery mildew, across E1 (El-Nubaria station 2015/2016), E2 (El-Bostan 2015/2016) and E3 (El-Bostan 2016/2017).

Author Contributions

Mahmoud Naser: Collecting the phenotypic data, data analysis, drafting the article, final approval of the version to be published. Mohamed Badran: Review the first draft, final approval of the version to be published. Hanaa Abouzied: Review the first draft, final approval of the version to be published. Heba Ali: Providing seeds for the local cultivars, helping in planting and data collection, review of the first draft, final approval of the version to be published. Ibrahim Elbasyoni: Design the study, Collecting the phenotypic data, help in the statistical analysis, review of the first draft, final approval of the version to be published.

Funding

This study received no direct funding from any organization.

Acknowledgments

The authors of this paper sincerely appreciate all technical support we received from the wheat breeding laboratory (STDF grant: 14935), Damanhour university, in which we were allowed to use all necessary tools and equipment needed to conducted this work. We would like also to thank Kevin P. Smith, Department of Agronomy and Plant Genetics, University of Minnesota, USA for providing the seeds for the imported barley lines.

Conflicts of Interest

The authors declare no conflict of interest.

References

  1. Katja, W.; Weidner, A.; Surabhi, G.K.; Börner, A.; Mock, H.P. Salt Stress-Induced Alterations in the Root Proteome of Barley Genotypes with Contrasting Response towards Salinity. J. Exp. Bot. 2009, 60, 3545–3557. [Google Scholar]
  2. Reddy, M.; Reddy, P.; Prasad, B.N.; Munilakshmi, U. Grain and Milling Quality of Barley and Their Suitability for Preparation of Traditional South Indian Products. Int. Organ. Sci. Res. J. Pharm. 2014, 4, 23–27. [Google Scholar]
  3. Wosene, G.A.; Berhane, L.; Bettina, I.G.H.; Karl, J.S. Ethiopian Barley Landraces Show Higher Yield Stability and Comparable Yield to Improved Varieties in Multi-Environment Field Trials. J. Plant Breed. Crop Sci. 2015, 7, 275–291. [Google Scholar] [CrossRef]
  4. Oscarsson, M.; Andersson, R.; Salomonsson, A.C.; Åman, P. Chemical composition of barley samples focusing on dietary fibre components. J. Cereal Sci. 1996, 24, 161–170. [Google Scholar] [CrossRef]
  5. Martinez, V.M.; Newman, K.; Newman, C.W. Barley diets with different fat sources have hypocholesterolemic effects in chickens. J. Nutr. 1991, 122, 1070–1076. [Google Scholar] [CrossRef] [PubMed]
  6. Anderson, J.W.; Deakins, D.A.; Floore, T.L.; Smith, B.M.; Whitis, S.E. Dietary fibre and coronary heart disease. Crit. Rev. Food Sci. Nutr. 1990, 29, 95–147. [Google Scholar] [CrossRef] [PubMed] [Green Version]
  7. Gosain, K. Long-Term Effects of Barley Bread Products on Metabolic Control of Non-Insulin-Dependent Diabetes Mellitus. Master’s Thesis, University of Alberta, Edmonton, AB, Canada, 1996. [Google Scholar]
  8. Ghassemi, F.; Jakeman, A.J.; Nix, H.A. Salinisation of Land and Water Resources: Human Causes, Extent, Management and Case Studies; UNSW Press: Sydney, Australia; CAB International: Wallingford, UK, 1995. [Google Scholar]
  9. Ouda, S.A.; Gaballah, M.S. Effect of Using Stabilizing Agents on Increasing Yield and Water Use Efficiency in Barley Grown under Water Stress. Aust. J. Basic Appl. Sci. 2007, 1, 571–577. [Google Scholar]
  10. El-Banna, M.N. Evaluation of 16 Barley Genotypes under Calcareous Soil Conditions in Egypt. J. Agric. Sci. 2012, 3, 105–121. [Google Scholar]
  11. FAO (Food and Agriculture Organization). Available online: http://www.fao.org/faostat/en/#data/QC.2016 (accessed on 5 October 2017).
  12. Davies, M.S.; Brown, A.H.D.; Marshall, D.R.; Frankel, O.H.; Williams, J.T. The Use of Plant Genetic Resources. J. Ecol. 1989, 77, 1175. [Google Scholar] [CrossRef]
  13. Moore, G. Strategic pre-breeding for wheat improvement. Nat. Plants 2015, 1, 1–3. [Google Scholar] [CrossRef] [PubMed]
  14. Nass, L.L.; Paterniani, E. Pre-Breeding: A Link between Genetic Resources and Maize Breeding. Sci. Agric. 2000, 57, 581–587. [Google Scholar] [CrossRef]
  15. The Global Crop Diversity Trust. Available online: http://www.croptrust.org/main/sharingknowled.php?itemid =299 (accessed on 20 January 2012).
  16. Shimelis, H.; Laing, M. Timelines in conventional crop improvement: Pre-breeding and breeding procedures. AJCS 2012, 6, 1542–1549. [Google Scholar]
  17. Sharma, S.; Upadhyaya, H.D.; Varshney, R.K.; Gowda, C.L.L. Pre-breeding for diversification of primary gene pool and genetic enhancement of grain legumes. Front. Plant Sci. 2013. [Google Scholar] [CrossRef] [PubMed] [Green Version]
  18. Black, C.A. (Ed.) Method of Soil Analysis, Part 2, Chemical and Microbiological Properties; American Society of Agronomy Inc.: Madison, WI, USA, 1965. [Google Scholar]
  19. Chanda, S.V.; Singh, Y.D. Estimation of Leaf Area in Wheat Using Linear Measurements. Plant Breed. Seed Sci. 2002, 46, 75–79. [Google Scholar]
  20. Peterson, R.F.; Campbell, A.B.; Hannah, A.E. A diagrammatic scale of estimating rust intensity on leaves and stems of cereals. Can. J. Res. 1948, 26, 496–500. [Google Scholar] [CrossRef]
  21. Stakman, E.C.; Stewart, D.M.; Loegering, W.Q. Identification of Physiologic Races of Puccinia Graminis var. Tritici; United State Department of Agriculture: Washington, DC, USA, 1962.
  22. Negassa, M. Possible new genes for resistance to powdery mildew, Septoria glume blotch and leaf rust of wheat. Plant Breed. 1987, 98, 37–46. [Google Scholar] [CrossRef]
  23. Gomez, K.A.; Gomez, A.A. Statistical Procedures for Agricultural Research; John Wiley & Sons: New York, NY, USA, 1984. [Google Scholar]
  24. Steel, R.G.; Torrie, T.H. Principles and Procedures of Statistics, 2nd ed.; Mc. Graw-Hill Book Co.: New York, NY, USA, 1980. [Google Scholar]
  25. Cochran, W.G.; Cox, G.M. Experimental Designs, 2nd ed.; John Wiley& Sons Inc.: New York, NY, USA, 1957. [Google Scholar]
  26. Murtagh, F.; Legendre, P. Ward’s Hierarchical Clustering Method: Clustering Criterion and Agglomerative Algorithm. arXiv, 2011; arXiv:1111.6285. [Google Scholar]
  27. R Core Team. The R Project for Statistical Computing CRAN-Mirrors. Available online: http://www.rproject.org/ (accessed on 7 September 2017).
  28. Husson, F.; Josse, J.; Le, S.; Maintainer, J.M. Facto MineR: An R Package for Multivariate Analysis. J. Stat. Softw. 2008, 25, 1–18. [Google Scholar]
  29. Gutie´ Rrez-Rodri´Guez, M.; Reynolds, M.P.; Larque-Saavedra, A. Photosynthesis of wheat in a warm, irrigated environment. II. Traits associated with genetic gains in yield. Field Crops Res. 2000, 66, 51–62. [Google Scholar] [CrossRef]
  30. Labuschagne, M.T.; Verhoeven, R.; Nkouanessi, M. Drought tolerance assessment of African cowpea accessions based on stomatal behaviour and cell membrane stability. J. Agric. Sci. 2008, 146, 689–694. [Google Scholar] [CrossRef]
  31. Hamam, K.A.; Khaled, A.S.G.A. Stability of Wheat Genotypes under Different Environments and Their Evaluation under Sowing Dates and Nitrogen Fertilizer Levels. Aust. J. Basic Appl. Sci. 2009, 3, 206–217. [Google Scholar]
  32. Abdul, A.; Altuhaish, K. Field Adaptation of Some Introduced Wheat (Triticum Aestivum L.) Genotypes in Two Altitudes of Tropical Agro-Ecosystem Environment of Indonesia. HAYATI J. Biosci. 2014, 21, 31–38. [Google Scholar]
  33. Ali, F.; Ahsan, M.; Ali, Q.; Kanwal, N. Phenotypic Stability of Zea Mays Grain Yield and Its Attributing Traits under Drought Stress. Front. Plant Sci. 2017, 8, 1397. [Google Scholar] [CrossRef] [PubMed]
  34. Mutwali, N.I.A.; Mustafa, A.I.; Gorafi, Y.S.A.; Mohamed Ahmed, I.A. Effect of Environment and Genotypes on the Physicochemical Quality of the Grains of Newly Developed Wheat Inbred Lines. Food Sci. Nutr. 2016, 4, 508–520. [Google Scholar] [CrossRef] [PubMed]
  35. Creissen, H.E.; Jorgensen, T.H.; Brown, J.K.M. Increased Yield Stability of Field-Grown Winter Barley (Hordeum Vulgare L.) Varietal Mixtures through Ecological Processes. Crop Prot. 2016, 85, 1–8. [Google Scholar] [CrossRef] [PubMed] [Green Version]
  36. Dimova, D.; Krasteva, L.; Panayotov, N.; Svetleva, D.; Dimitrova, M. Evaluation of the Yield and the Yield Stability of Perspective Lines of Barley. Agroznanje 2012, 13, 55–60. [Google Scholar] [CrossRef]
  37. Adel, A.G.; Al-Ameiri, N.S.; Karajeh, M.R. Resistance of Barley Landraces and Wild Barley Populations to Powdery Mildew in Jordan. Phytopathol. Mediterr. 2008, 47, 92–97. [Google Scholar]
  38. Adawy, S.S.; Saker, M.M.; Haggag, W.M.; El-Itriby, H.A. Amplified Fragment Length Polymorphism (ALFP) Based Molecular Analysis of Egyptian Barley Lines and Landraces Differing in Their Resistance and Susceptibility to Leaf Rust and Net Blotch Diseases. Landbauforsch. Volkenrode 2008, 58, 125–134. [Google Scholar]
  39. Najaphy, A.; Ashrafi Parchin, R.; Farshadfar, E. Comparison of phenotypic and molecular characterization of some important wheat cultivars and advanced breeding lines. Aust. J. Crop Sci. 2012, 6, 326–332. [Google Scholar]
  40. Ribot, G.G.; Silva, P.; Acevedo, E. Morphological and Physiological Traits of Assistance in the Selection of High Yielding Varieties of Durum Wheat (Triticum Turgidum L. Spp. Durum) for the Rainfed Mediterranean Environments of Central Chile. Am. J. Plant Sci. 2012, 3, 1809–1819. [Google Scholar] [CrossRef]
  41. Rahman, M.; Barma, N.C.D.; Biswas, B.K.; Khan, A.A.; Rahman, J. Study on morpho-physiological traits in spring wheat (Triticum Aestivum L.) under rainfed condition m. Pakistan. J. Biosci. 2016, 7122, 235–250. [Google Scholar]
  42. Ajalli, J.; Salehi, M. Evaluation of Drought Stress Indices in Barley (Hordeum Vulgare L.). Ann. Biol. Res. 2012, 3, 5515–5520. [Google Scholar]
  43. Al-Tabbal, J.A.; Al-Fraihat, H.; Genetic Variation, A. Heritability, Phenotypic and Genotypic Correlation Studies for Yield and Yield Components in Promising Barley Genotypes. J. Agric. Sci. 2011, 4, 193–210. [Google Scholar] [CrossRef]
  44. Aina, O.O.; Dixon, A.G.O.; Akirinde, E.A. Additive Main Effects and Multiplicative Interaction (AMMI) Analysis for Yield of Cassava in Nigeria. J. Biol. Sci. 2007, 7, 796–800. [Google Scholar]
  45. Singh, N. Study of heritability and genetic advance in barley (Hordeum Vulgare L.) on affected soil. Int. J. Food Agric. Vet. Sci. 2012, 2, 35–39. [Google Scholar]
  46. Leilah, A.A.; Al-Khateeb, S.A. Statistical analysis of wheat yield under drought conditions. J. Arid Environ. 2005, 61, 483–496. [Google Scholar] [CrossRef]
  47. Ismail, A.A. Identification of selection traits for yield improvement of bread wheat using path analysis. Assiut J. Agric. Sci. 2001, 32, 63–84. [Google Scholar]
  48. Khokhar, M.I.; Hussain, M.; Zulkiffal, M.; Ahmad, N.; Sabar, W. Correlation and path analysis for yield and yield contributing characters in wheat (Triticum aestivum L.). Afr. J. Plant Sci. 2010, 4, 464–466. [Google Scholar]
  49. Ashraf, A.; El-Mohsen, A. Correlation and Regression Analysis. Sci. Res. Rev.-J. 2012, 1, 88–100. [Google Scholar]
  50. Ruzdik, N.M.; Valcheva, D.; Vulchev, D.; Mihajlov, L.; Karov, I.; Ilieva, V. Correlation between grain yield and yield components in winter barley varieties. Agric. Sci. Technol. 2015, 7, 40–44. [Google Scholar]
Figure 1. Boxplots for mean grain yield (GY) for 25 genotypes across the three environments.
Plants 07 00039 g001
Figure 2. Boxplots for the mean coefficient of infection for leaf rust (LR) for 25 genotypes across the three environments.
Plants 07 00039 g002
Figure 3. Biplot showing the correlation among total chlorophyll content (CHL), number of days to flowering (DF), plant height (PH), number of grains/spike(NG/S),1000-grain weight (TGW), leaf rust (LR), net blotch (NB), powdery mildew (PM), grain yield (GY), and leaf area (LA).
Plants 07 00039 g003
Figure 4. Dendrogram of cluster analysis of 25 barley genotypes based on morphological, physiological, and pathological traits across the three environments.
Plants 07 00039 g004
Table 1. Identification and pedigree of the studied barley genotypes: 20 imported genotypes from the United States (USA), and five Egyptian cultivars.
NOGenotypeSynonymRow TypePedigreeOrigin
1MT07010707MT-552RMT970148/HaxbyUSA
2Z155U012V08BA-022RZ010C020E/Z011L088L
32ND2734408N2-182RND24289/ND22996//CONLON
4NEG2-0307MN-826RM119/M99-106 NB
52ND2631807N2-132RND21957-2/ND23024
62ND2767809N2-692R2ND24175/TR05285
72159-9008UT-856RAB 11469 × Aquila
8MT09023409MT-922RMT910189/MT910189/Lk644/Eslick BC3F3 7-L
907WA-605.1709WA-042RWA 9004-99/Merit
102AB08-X05M046-2109AB-292R2AB08-X05M046-21
11ND2336606N6-846RND19656/ND19703
122142-6907UT-836RSDB11009/M72395/3/Short2//ID633019/Woodvale/4/Steptoe/M27//Gusto/5/WA11825-95/6//Harrington
132155-5408UT-546RGoldeneye × UT97B1556-5344
142152-308UT-016RMorex × Goldeneye
1505WA-319.1207WA-032RBob/Merit//CDC Select
16UT2170-14609UT-446RHarrington/3/Kombar/SF8623//Maranna
17ND2573607N6-946RND19474/ND20477
18ND2569707N6-576RSTELLAR-ND/ND20603
19ND2354106N6-226RDrummond/ND20414
202ND2739208N2-662RND24519/CONLON
21Giza123-6RGIZA117/FAO86Egypt
22Giza127-2RW12291/Bags//Harmal-02
23Giza132-6RRihane-05//AS 46/Aths*2Athe/Lignee 686
24Giza134-6R-
25Giza136-6R-
*: Refer to backcrossing.
Table 2. Analysis of variance for 1000-grain weight (g), leaf chlorophyll content, leaf rust, net blotch and powdery mildew of 25 barley genotypes that across E1 (El-Nubaria station 2015/2016), E2 (El-Bostan 2015/2016) and E3 (El-Bostan 2016/2017).
TraitSource of Variance dfMean Squares
E1E2E3
1000-grain weightGenotypes24326.8 **179.52 **6.99 **
Replicates22.8917.330.64
Leaf chlorophyll contentGenotypes24249.5 **136.46 **54.61 **
Replicates210.68124.49.488
Leaf rustGenotypes2425.60 **20.694 **2321.01 **
Replicates20.0930.287.413
Net blotchGenotypes241 ns1 ns11.32 **
Replicates2110.56
Powdery mildewGenotypes241 ns12.97 **1 ns
Replicates210.771
ns: non-significant and **: Significant at p-value = 0.01.
Table 3. Combined analysis of variance for the number of days to flowering, plant height (cm), number of grains/spike, grain yield (tons/ha), and leaf area (cm2) of 25 barley genotypes (G) across three environments (E).
TraitSource of VariancedfS.SMS
Number of days to floweringE21281.7640.87 **
Replicates (E)616.682.78
G249618.4400.76 **
E × G48384680.12 **
Plant heightE24567.12283.5 **
Replicates (E)685.5514.26
G2413,262.9552.6 **
E × G4810,347.7215.58 **
Number of grains/spikeE2675337.5 **
Replicates (E)6123.220.5
G24667962783.2 **
E × G48376478.42 **
Grain yieldE286.2843.14 **
Replicates (E)63.010.50
G24250.4310.43 **
E × G48177.653.70 **
Leaf areaE21508.8754.4 **
Replicates (E)691.8515.31
G248292.6345.5 **
E × G482335.348.7 **
**: Significant at 0.01.
Table 4. Correlation coefficients among the studied traits across the three environments.
CHLDFPHNG/STGWLRNBPMLAGY
CHL1
DF−0.4 *1
PH0.41 *−0.331
NG/S0.25−0.260.76 **1
TGW0.23−0.42 *−0.10−0.171
LR−0.0010.200.43 *0.50 *−0.331
NB0.12−0.15−0.33−0.22−0.07−0.141
PM0.02−0.11−0.190.02−0.170.020.88 **1
LA0.43 *−0.180.56 *0.77 **−0.070.44 *0.070.291
GY0.27−0.55 **0.210.220.54 **−0.25−0.01−0.10.261
* and **: Significant at p-value = 0.05 and 0.01. CHL: total chlorophyll content, DF: number of days to flowering, PH: plant height, NG/S: number of grains/spike, TGW: 1000-grain weight, LR: leaf rust, NB: net blotch, PM: powdery mildew, GY: grain yield, and LA: leaf area.

