Article

Water Regime and Nitrogen Management to Cope with Wheat Yield Variability under the Mediterranean Conditions of Southern Portugal

1
Escola Superior Agrária - Instituto Politécnico de Beja, R. Pedro Soares S/N, 7800-295 Beja, Portugal
2
GeoBioTec, Universidade Nova de Lisboa, Campus da Caparica, 2829-516 Caparica, Portugal
3
Centro Operativo e de Tecnologia de Regadio, Quinta da Saúde, 7801-904 Apartado Beja 354, Portugal
*
Author to whom correspondence should be addressed.
Plants 2019, 8(10), 429; https://doi.org/10.3390/plants8100429
Submission received: 26 July 2019 / Revised: 15 October 2019 / Accepted: 18 October 2019 / Published: 19 October 2019
(This article belongs to the Special Issue Plants Reacts to the Changing Environment)

Abstract

:
Global climate change accentuates the seasonal and interannual irregularity of temperature and precipitation of the Mediterranean climate. The consequences of this variability on wheat production are felt on its development cycle and productivity, making the production chain of this crop vulnerable to the occurrence of years with abnormal distributions of precipitation and with extreme temperatures. Adaptation strategies like irrigation or fertilization can help to cope with the negative impacts of climate uncertainty. This study evaluated the effects of water regime and nitrogen (N) fertilization techniques on wheat production in southern Portugal based on the results of three trials conducted in two agricultural years (2016/2017 and 2017/2018) with contrasting climate conditions. Phenology and yield were evaluated by comparing water regimes (R1, full irrigation; R2, supplemental irrigation at four stages: start of stem extension, booting, anthesis, grain filling; R0, rainfed (in 2017/2018)) and N fertilization splitting/timing and type (conventional and enhanced efficiency fertilizers (EEFs): controlled-release N, stabilized with nitrification inhibitor, and stabilized with urease inhibitor). Significant effects of water regime on grain yield were obtained in 2016/2017, a year with extreme aridity and high water requirements felt from the tillering stage, in the trial with conventional fertilizers. In 2017/2018, when a beneficial seasonal rainfall distribution occurred, water regime did not influence grain yield, pointing to the feasibility of supplementary irrigation to maximize water productivity. Nitrogen fertilization influenced yield and its components, with the highest values of grain yield being obtained with conventional fertilizer. Regardless of the possible effects on grain quality, the use of EEF did not prove to have an indisputable effect on wheat yield in the conditions under which the trials were conducted. Comparison of the results in the two years accentuates the need to continue the evaluation of the influence of agronomic management in wheat production in the context of adaptation to the climatic uncertainty in Mediterranean regions.

1. Introduction

According to [1], the contribution of Portugal to common wheat (Triticum aestivum L.) production in the EU-28 represented in 2017 only 0.04% in a production area of 0.11%. Therefore, Portugal is an importer of common wheat, and this situation is difficult to overcome given the market fluctuations and the less than optimal Mediterranean climate conditions for wheat production, particularly high rainfall irregularity and growing drought trends caused by climate change [2,3,4].
The Mediterranean and other South European regions are especially vulnerable to climate change, facing increased competition for water resources between different sectors (agriculture, industry, or domestic uses) [4]. Climate change accentuates the seasonal and interannual irregularity of temperature and precipitation, traits of the Mediterranean climate, making periods with high temperatures and water limitations more pronounced [2,3,4]. The projections for the Mediterranean area are a gradual increase of temperature and a decrease in rainfall. Moreover, an increase in the frequency and magnitude of extreme events of heat waves is also predicted [2,3,4,5,6]. These trends will promote sharp declines in the production of rainfed crops, leading to the escalation in irrigation needs [4,7]. Under these conditions, wheat (Triticum aestivum L.) is one of the crops that will suffer the greatest reduction in productivity as a result of the expected extreme environments [8,9]. The consequences of this climatic uncertainty in Mediterranean environments on wheat production will potentially lead to yield losses that may reach one-third of the current value [8].
In Mediterranean regions, the interannual yields of wheat are irregular and influenced by water availability and heat stress, and their occurrence in certain periods of the development cycle [5,6]. Sensitivity to high temperatures is higher during reproductive stages than in vegetative stages [10], the most sensitive periods being anthesis and grain filling [11,12,13]. According to [14], heat stress, as well as limited water availability, can significantly reduce the rate of photosynthesis, reducing the amount of assimilates available to the grain, therefore affecting mean grain weight and water use efficiency (WUE) [15,16]. Other stages, like stem elongation and booting, are reported as being susceptible to water stress due to reductions in potential grain number per unit area [16,17,18,19]. Furthermore, water shortages combined with nitrogen (N) deficiency can also concur with the reduction in grain number [16,20]. In fact, crop responses to N depend on available water in soil, rainfall amount, and distribution during the growth cycle [21,22]. Grain yield and N use efficiency (NUE) decrease under water deficit conditions and elevated temperatures, particularly if they occur around anthesis [16,23,24]. Nitrogen content is widely considered as the main factor that affects storage proteins and grain quality in wheat [25]. Therefore, the productivity and grain quality of wheat in response to N availability is also dependent on growth stage. Authors in [26] state that approximately 40% to 90% of grain nitrogen in wheat originates from the remobilization of N stored in vegetative tissues before anthesis, so that N remobilization depends on these nutrient sources.
Strategies to increase NUE include management practices, like rate, time, or method of application, and the development of new technologies, like the use of alternative fertilization techniques with the so-called enhanced efficiency fertilizers (EEFs) [27,28]. These kinds of fertilizers that delay the bioavailability of nitrogen in the soil, matching its release with the crops’ higher needs periods, are classified as [29]: (i) slow-release fertilizers (obtained as condensation products of urea and urea aldehydes); (ii) controlled-release fertilizers (products containing a conventional fertilizer whose nutrient release in the soil is regulated by sulfur or/and polymer coatings); (iii) stabilized fertilizers (which are modified during the production process with a nitrification inhibitor or an urease inhibitor). Several studies have shown that the use of such fertilizers has been successful in nurseries [30] or in conditions of high rainfall and in sandy soils [28]. In irrigated crops, where N fertilizers are partially applied through the irrigation water, EFFs have the potential to contribute to the increase of resource-use efficiency by promoting higher yields, higher grain quality, and reducing leaching risks [28,31,32].
The overlapping of key climate variables and the critical stages of the wheat development cycle, along with the climate uncertainty associated with Mediterranean conditions, implies that the success of the crop depends, to a large extent, on the combination of appropriate management strategies. Adaptation to climate change and climatic variability must take place through introduction of short-run field adjustments and/or long-term adaptations [5,8,15,33,34,35]. While the latter refer to major structural transitions involving changes in land allocation, substitution of crops, or breeding of crop cultivars [8,15], the former include efforts to optimize production without major system changes, such as use of species and/or cultivars resistant to heat and drought, alteration of sowing dates and planting densities, improved irrigation techniques, improved fertilizers use, and other different soil or crop management practices (e.g., mulching, crop rotation, intercropping) [36,37,38,39,40,41]. In wheat production, providing water through supplemental irrigation and appropriate rate and time of N fertilizer application can be integral to stabilize yields, increase productivity, and to enhance the industrial quality of the grain [19,25,26,42,43].
Many crop simulation studies have been conducted recently using climate change scenarios and cropping systems models to estimate crop productivity under different agronomic practices [9,34,44,45,46]. However, field studies designed to evaluate wheat adaptation to optimized irrigation or fertilization are also very important. These studies should aim to contribute to the increase of WUE and NUE and, thus, to the strengthening and adaptation of the wheat production chain under the typical variability of Mediterranean climate.
Taking the above into consideration, this study aimed to evaluate the effects of water regime and nitrogen fertilization type/splitting/timing under the Mediterranean environment of southern Portugal on common wheat phenology, yield, and yield components. Understanding whether the use of supplemental irrigation and “special N fertilizers”, as opposed to water comfort irrigation and conventional fertilizers as technical options that will maximize productivity, may contribute to the selection of more suitable agronomic practices. These options could allow the stabilization and maximization of wheat production, adjusting to the typical constraints and risks of the climatic uncertain conditions of the Mediterranean regions.

2. Results and Discussion

2.1. Climate, Irrigation, and Phenology

2016/2017 and 2017/2018 were paradigmatic examples of the climatic uncertainty characteristic of southern Portugal. The average of the maximum temperatures recorded differed by 10 °C in the two wheat growth cycles (Figure 1). The spring of 2017 registered several daily temperature peaks above 35 °C since May. In fact, the year 2017 in Portugal was classified as extremely hot and dry, being the third driest and the second warmest year since 1931 [47]. Through the year, there were long periods of high temperatures and low precipitation so that by the end of October, mainland Portugal was under extreme drought, the severest class according to the Palmer drought severity index (PDSI) [48]. These conditions gave rise to extreme aridity, and high water requirements were felt from the beginning of March, when crops were entering the tillering stage, until the end of the crop cycle (Figure 1). In the R1 treatment (full irrigation with 100% of crop evapotranspiration (ETc) throughout the cycle), the first irrigation took place on 11 March 2017, while in R2 (supplemental irrigation with 100% of ETc at four stages: beginning of stem extension, booting, heading, and grain filling), irrigation began on 17 March 2017. Irrigation became more frequent after April, as temperature and evapotranspiration increased. As defined in the schedule criteria of the treatments, R1 irrigation aimed at replenishing the total soil water storage capacity every time the soil water balance showed an oncoming water deficit, with intervals of 2 to 15 d; in R2, irrigation took place every 15–20 d until May. At flowering and grain filling, given the increased water requirements of the crops in these stages, irrigation was applied weekly.
In 2017/2018, the cumulative rainfall during the wheat development cycle was 291 mm higher than in the previous year, mostly concentrated during the spring. Therefore, there were considerable differences in irrigation needs in the two years: in the full irrigation water regime, R1 (100% of crop evapotranspiration (ETc) throughout the growing cycle), the total irrigation volumes in 2016/2017 and 2017/2018 were 2527 and 1440 m3 ha−1, respectively. In other words, there was a difference of 1087 m3 ha−1 between the irrigation requirements in the two crop cycles.
In 2016/2017, the total irrigation volume in the full irrigation treatment (R1) was 804 m3 ha−1 higher than the volume applied in supplemental irrigation treatment (R2). In contrast, in 2017/2018, as a result of the abundant spring rains coincident with some of the phases where wheat had greater water sensitivity (such as booting or grain filling), the difference between R1 and R2 was only of 80 m3 ha−1, about 90% less than the preceding year. Therefore, in the 2017/2018 growth cycle, the availability of soil water provided by the spring precipitation distribution meant that a true differentiation between the volumes and irrigation dates in the R1 and R2 water regimes was not possible. The total number of irrigation events was 10, and the first and last irrigations took place, respectively, on 03/02/2018 and on 02/06/2018, with an average interval of 13 d. This implied that the phenological phases in different irrigation treatments occurred generally on very similar dates (Table 1). Although there were different sowing dates in the trials conducted in the two years, it is possible that the high temperatures felt in the spring of 2016/2017 were an additional cause for the difference in the phenology progress, with the end of the crop cycle in 2016/2017 being anticipated 1 month as a result of a shorter grain filling and ripening period (from heading to harvest).
The temporal evolution of soil water content in the different irrigation regimes tested in both years can be observed in Figure 2. In 2016/2017, despite the physical properties of the soils in the study area, like high water-holding capacity, a trait of vertisols, as the season advanced, soil water content (SWC) in the supplemental irrigation water regime (R2) only approached SWC in R1 whenever irrigation was applied; furthermore, SWC in R2 decreased with time, at times reaching values below the offset of crop stress (beneath maximum depletion (MD)) in the final stages of the growth cycle.
In 2017/2018, SWC was influenced not only by the irrigation applied but also by the occurrence of late spring precipitation and by the high water-holding capacity of the soil, leading to periods with a growing trend in available soil water, even in the rainfed treatment, in the final stages of the crop growth cycle. The offset of crop water stress was momentarily reached in early May in the supplemental irrigation plots.

2.2. Grain Yield and Yield Components

Interannual and seasonal climatic variability, well evidenced in these two years, can have implications either at the phenology level—with cycles of different duration, fruit of the anticipation, or delay in the final phenological states—or at yield [6,9] and even at the level of grain [18,49]. For example, looking at the average yields in each of the trials (Table 2 and Table 3), in 2016/2017, average values were 4268 and 4551 kg ha−1, respectively, in Trial 1 (to evaluate the effect of two irrigation regimes, R1 and R2, and six nitrogen fertilization treatments of splitting/timing with enhanced efficiency N fertilizers, E1 to E6, on grain yield and grain yield components) and Trial 2 (to evaluate the effect of two irrigation regimes, R1 and R2, and five nitrogen fertilization treatments of splitting/timing with conventional N fertilizers, C1 to C5, on grain yield and grain yield components), while in the 2017/2018 experiment (to evaluate the effect of three irrigation regimes—R1, R2, and rainfed (R0)—and eight nitrogen fertilization treatments of type/splitting/timing with enhanced efficiency N fertilizers and conventional fertilizers, N1 to N8, on grain yield and grain yield components), the average yield reached 7100 kg ha−1, which was, respectively, 1.7 and 1.6 times higher than the previous years.
In Trial 1, only the number of spikes per m−2 showed significant influence of the irrigation regime, the highest value being registered in the R1 irrigation regime (396 spikes per m−2) (Table 2a). These results, with no significant differences in wheat yield between water regimes, may point to a greater efficiency in irrigation water use in the irrigation strategy, R2, suggesting that supplemental water applied at the defined critical periods is used more efficiently by the crop. These results are in agreement with [38] where, when studying different supplemental irrigation strategies at different growth stages and application of different rates of nitrogen fertilizer on yield and water productivity (WP) of wheat cultivars, they reported improved yield and WP when using supplemental irrigation at the beginning of stem elongation. There was a significant effect of N fertilization in yield, the highest value being obtained in the 75% sowing +25% stem extension splitting/timing (E5) at 4564 kg ha−1. This result indicates that early N applications with this type of fertilizer does not compromise N availability throughout the wheat growth cycle and, therefore, the grain production. Nevertheless, it is important to ascertain whether the N availability throughout the wheat cycle that these ‘special’ fertilizers seemingly provide is also suitable for a fair quality of grain and flour.
In Trial 2, with conventional N fertilizer, significantly higher 1000-grain weights (41.56 g) and yield (5614 kg ha−1) were obtained in the R1 treatment (Table 2b), a result in accordance with [23] that observed a significant, positive effect of irrigation in comparison with no irrigation, in wheat grain yield and root weight density. Similar results were found by [39] when comparing two irrigation strategies with rainfed condition in winter wheat produced in the North China Plain. No significant effect of N fertilization was determined in Trial 2. No interaction between factors (water regime × N fertilizer splitting/timing) was felt in yield and its components.
The year 2017/2018 was characterized by a beneficial distribution of precipitation for wheat development (Figure 1). There was a statistically significant effect of water regime both in the number of grains per m−2 and 1000-grain weight (g), showing a compensation effect in these yield components that lead to no statistical differences in grain yield (Table 3). Authors in [16] in a study on the interactive effects of water and nitrogen on durum wheat (Triticum durum Desf.) grown in a Mediterranean environment found similar results, with the crop response being mostly influenced by nitrogen fertilization as a consequence of the occurrence of abundant rainfall during the experiment period.
The effect of the water regime on the main yield components seemed to be stronger on the 1000-grain weight, since the values obtained were statistically different in the three treatments, with R1 having the advantage (47.57 g) followed by R2 (46.14 g). The occurrence of precipitation throughout the crop cycle, favorably distributed and concentrated during heading and initial grain filling, attenuated and/or eliminated the differences between the different water regimes and highlights the influence of water supply during the grain filling stage. This attenuating effect is even more pronounced when soils present a high water storage capacity, as is the case of vertisols (Figure 2).
Nitrogen fertilizer splitting/timing had no significant effect on the number of spikes (m−2). Regarding the effect of nitrogen fertilization on yield components, the results were as follows: (i) there was an effect on the number of grains, with the highest values occurring in the treatments with conventional fertilizer, N1 (16,158 grains per m−2) and N2 (16,145 grains per m−2), and the lowest value registered in the N5 treatment (15,091 grains per m−2) with controlled-release fertilizer; (ii) the N5 treatment also presented the lowest grain weight value (45.13 g); (iii) N1 and N2 were the nitrogen fertilizer treatments with the highest yields (7378 and 7337 Kg ha−1, respectively). This set of results in 2017/2018 indicates that the use of ”special” fertilizers, as opposed to using conventional fertilizers, had no distinguishing effect on wheat productivity, and it is in accordance to [25] and [31], where the application of slow-release and controlled-release polymer-coated nitrogen fertilizers, respectively, in wheat and maize (Zea mays L.) resulted in no observed differences in grain yield. Additionally, when comparing treatments with the same type of fertilizer, results indicate a positive effect on wheat yield resulting from fertilizer splitting in the case of controlled-release (N5 and N6) and urease inhibitor (N7 and N8) fertilizer. In the case of the nitrification inhibitor fertilizer, a higher yield was obtained in the treatment where total N was applied at sowing (N3, when comparing with N4). No interaction water regime × N splitting/timing was felt in yield and its components.

3. Materials and Methods

3.1. Site Description

The study took place during the agricultural years 2016/2017 and 2017/2018 in Beja (Baixo Alentejo, Southern Portugal) with the cultivar of common wheat Antequera, classified as “improver” by the milling industry and included in the list of recommended varieties of common wheat in both agricultural years [51].
The climate in the study area is Mediterranean (Csa, in Köppen classification) with climate normals (1981–2010) for annual precipitation and average mean daily temperature of, respectively, 558 mm and 16.9 °C [52]. Soils are predominantly pellic vertisols associated with calcic cambisols [53,54,55]; that is, they are heavy-textured soils with high moisture-holding capacity and possible accumulation of secondary carbonates.
Meteorological data were recorded in an automatic weather station belonging to the Agrometeorological System for Irrigation Management in Alentejo region (SAGRA-Sistema Agrometeorológico para a Gestão da Rega no Alentejo, [56]).
Irrigation was performed by a center-pivot system. The irrigation amounts and schedules were evaluated using the Irrigation Management Model for the Alentejo region (MOGRA—Modelo de Gestão da Rega para o Alentejo, [57]) This model performs daily soil water balancing, based on the FAO methodology for computing crop water requirements [58], using meteorological data, the crop’s specific information, and soil water content (SWC) data registered in the main plots with capacitance probes (PR1 Profile Probe, Delta-T Devices, Ltd.) with 45 cm depth and four sensors with a 10 cm step. In order to evaluate the soil’s available water dynamics, continuous monitoring capacitance probes (Enviroscan, Sentek Technologies, Ltd.) were also installed each year in the main plots.

3.2. Study Design

3.2.1. Trials in 2016/2017

Two trials (Trial 1 and Trial 2) were carried out during the 2016/2017 agricultural year. In both trials, wheat was sown on 24 January 2017 and harvested on 24 June 2017. The experimental design was split-plot with two irrigation treatments as main plots: R1, full irrigation with 100% of crop evapotranspiration (ETc) throughout the cycle; R2, supplemental irrigation with 100% of ETc only at four critical stages (according to the decimal code of the Zadoks scale [59]: 30, beginning of stem extension; 40 to 49, booting; 50 to 59, heading or inflorescence emergence; 70 to 89, grain filling). The total irrigation volumes during the 2017 crop cycle were 2527 and 1723 m3 ha−1, respectively, in R1 and R2 treatments.
The subplots (9.6 m2) were N fertilizer splitting and timing of application treatments. More specifically, plots included six treatments in Trial 1, with enhanced efficiency fertilizers applied at sowing-stabilized (with the nitrification inhibitor DMPP (3,4-phosphate dimetilpyrazol)) (E1 to E5) and controlled-release (i.e., with a polymer that coats the fertilizer granules, protecting nutrients from leaching losses, and ensuring their availability for plant uptake throughout the cycle) (E6), with three replications (Table 4); and five treatments in Trial 2 (C1 to C5), with conventional N fertilizer with three replications (Table 5). The applied N fertilizer dose was 165 kg N ha−1, following the recommendations of the Ordinance 259/2012 [60] that establishes the Portuguese action program for vulnerable areas to nitrates pollution caused by agricultural practices (implemented after the Decree-Law 235/97 [61] that transposes into national law the EEC Council Directive 91/676 [62] concerning the protection of water against pollution caused by nitrates from agricultural sources). According to [60], for a potential wheat yield of 5 ton ha−1, an application rate of 165 N ha−1 is recommended. To ensure equal phosphorus (P) and potassium (K) rates in all treatments, a binary P-K fertilizer (Amicote CV 44 0-27–17) was applied at sowing. Topdressing N fertilization was applied at tillering, with urea (Ureia 46%), and with ammonium nitrate (Nitrolusal 27%) at the remaining stages.

3.2.2. Trial in 2017/2018

The experimental design was split-plot with three water regime treatments as main plots: R0, rainfed; R1 and R2, as described in Section 3.1. The subplots, with four replications, were the nitrogen (N) fertilizer type used at sowing, splitting (% of N total), and timing (phenological stage) treatments (Table 6). The total dose applied was 180 kg N ha−1, following the recommendations of [60] for a wheat expected yield of 5.5 ton ha−1 in the study area (due to the earliest sowing date, an expected yield increase of 0.5 ton ha−1 was considered, and the fertilization rate was adjusted). Fertilization treatments were N1 and N2, conventional fertilizer; N3 and N4, stabilized fertilizer (with nitrification inhibitor); N5 and N6, controlled-release fertilizer (polymer coating); N7 and N8, stabilized fertilizer (with urease inhibitor MCDHS (mono carbamide dihydrogen sulphate), a chemical additive that acts on urease, inhibiting the transformation of urea nitrogen into ammonia nitrogen). Each pair is distinguished by N splitting over the crop cycle. In N treatments numbered with even numbers, topdressing N fertilization was applied with urea (Ureia 46%) and ammonium nitrate (Nitrolusal 27%), respectively, at tillering and/or at stem extension and booting stages to ensure the 180 Kg ha−1 rate of N fertilization. As described in Section 3.2.1., a binary P–K fertilizer (Amicote CV 44 0–27–17) was applied at sowing to warrant a fertilization rate equivalence between treatments.
Wheat was sown on 22 December 2017, and the harvest took place between 18–25 July 2018. The total irrigation volumes applied during the growth cycle were 1440 and 1350 m3 ha−1, in treatments R1 and R2, respectively, distributed thought 10 irrigations beginning on 03 February 2018 and ending on 02 June 2018.

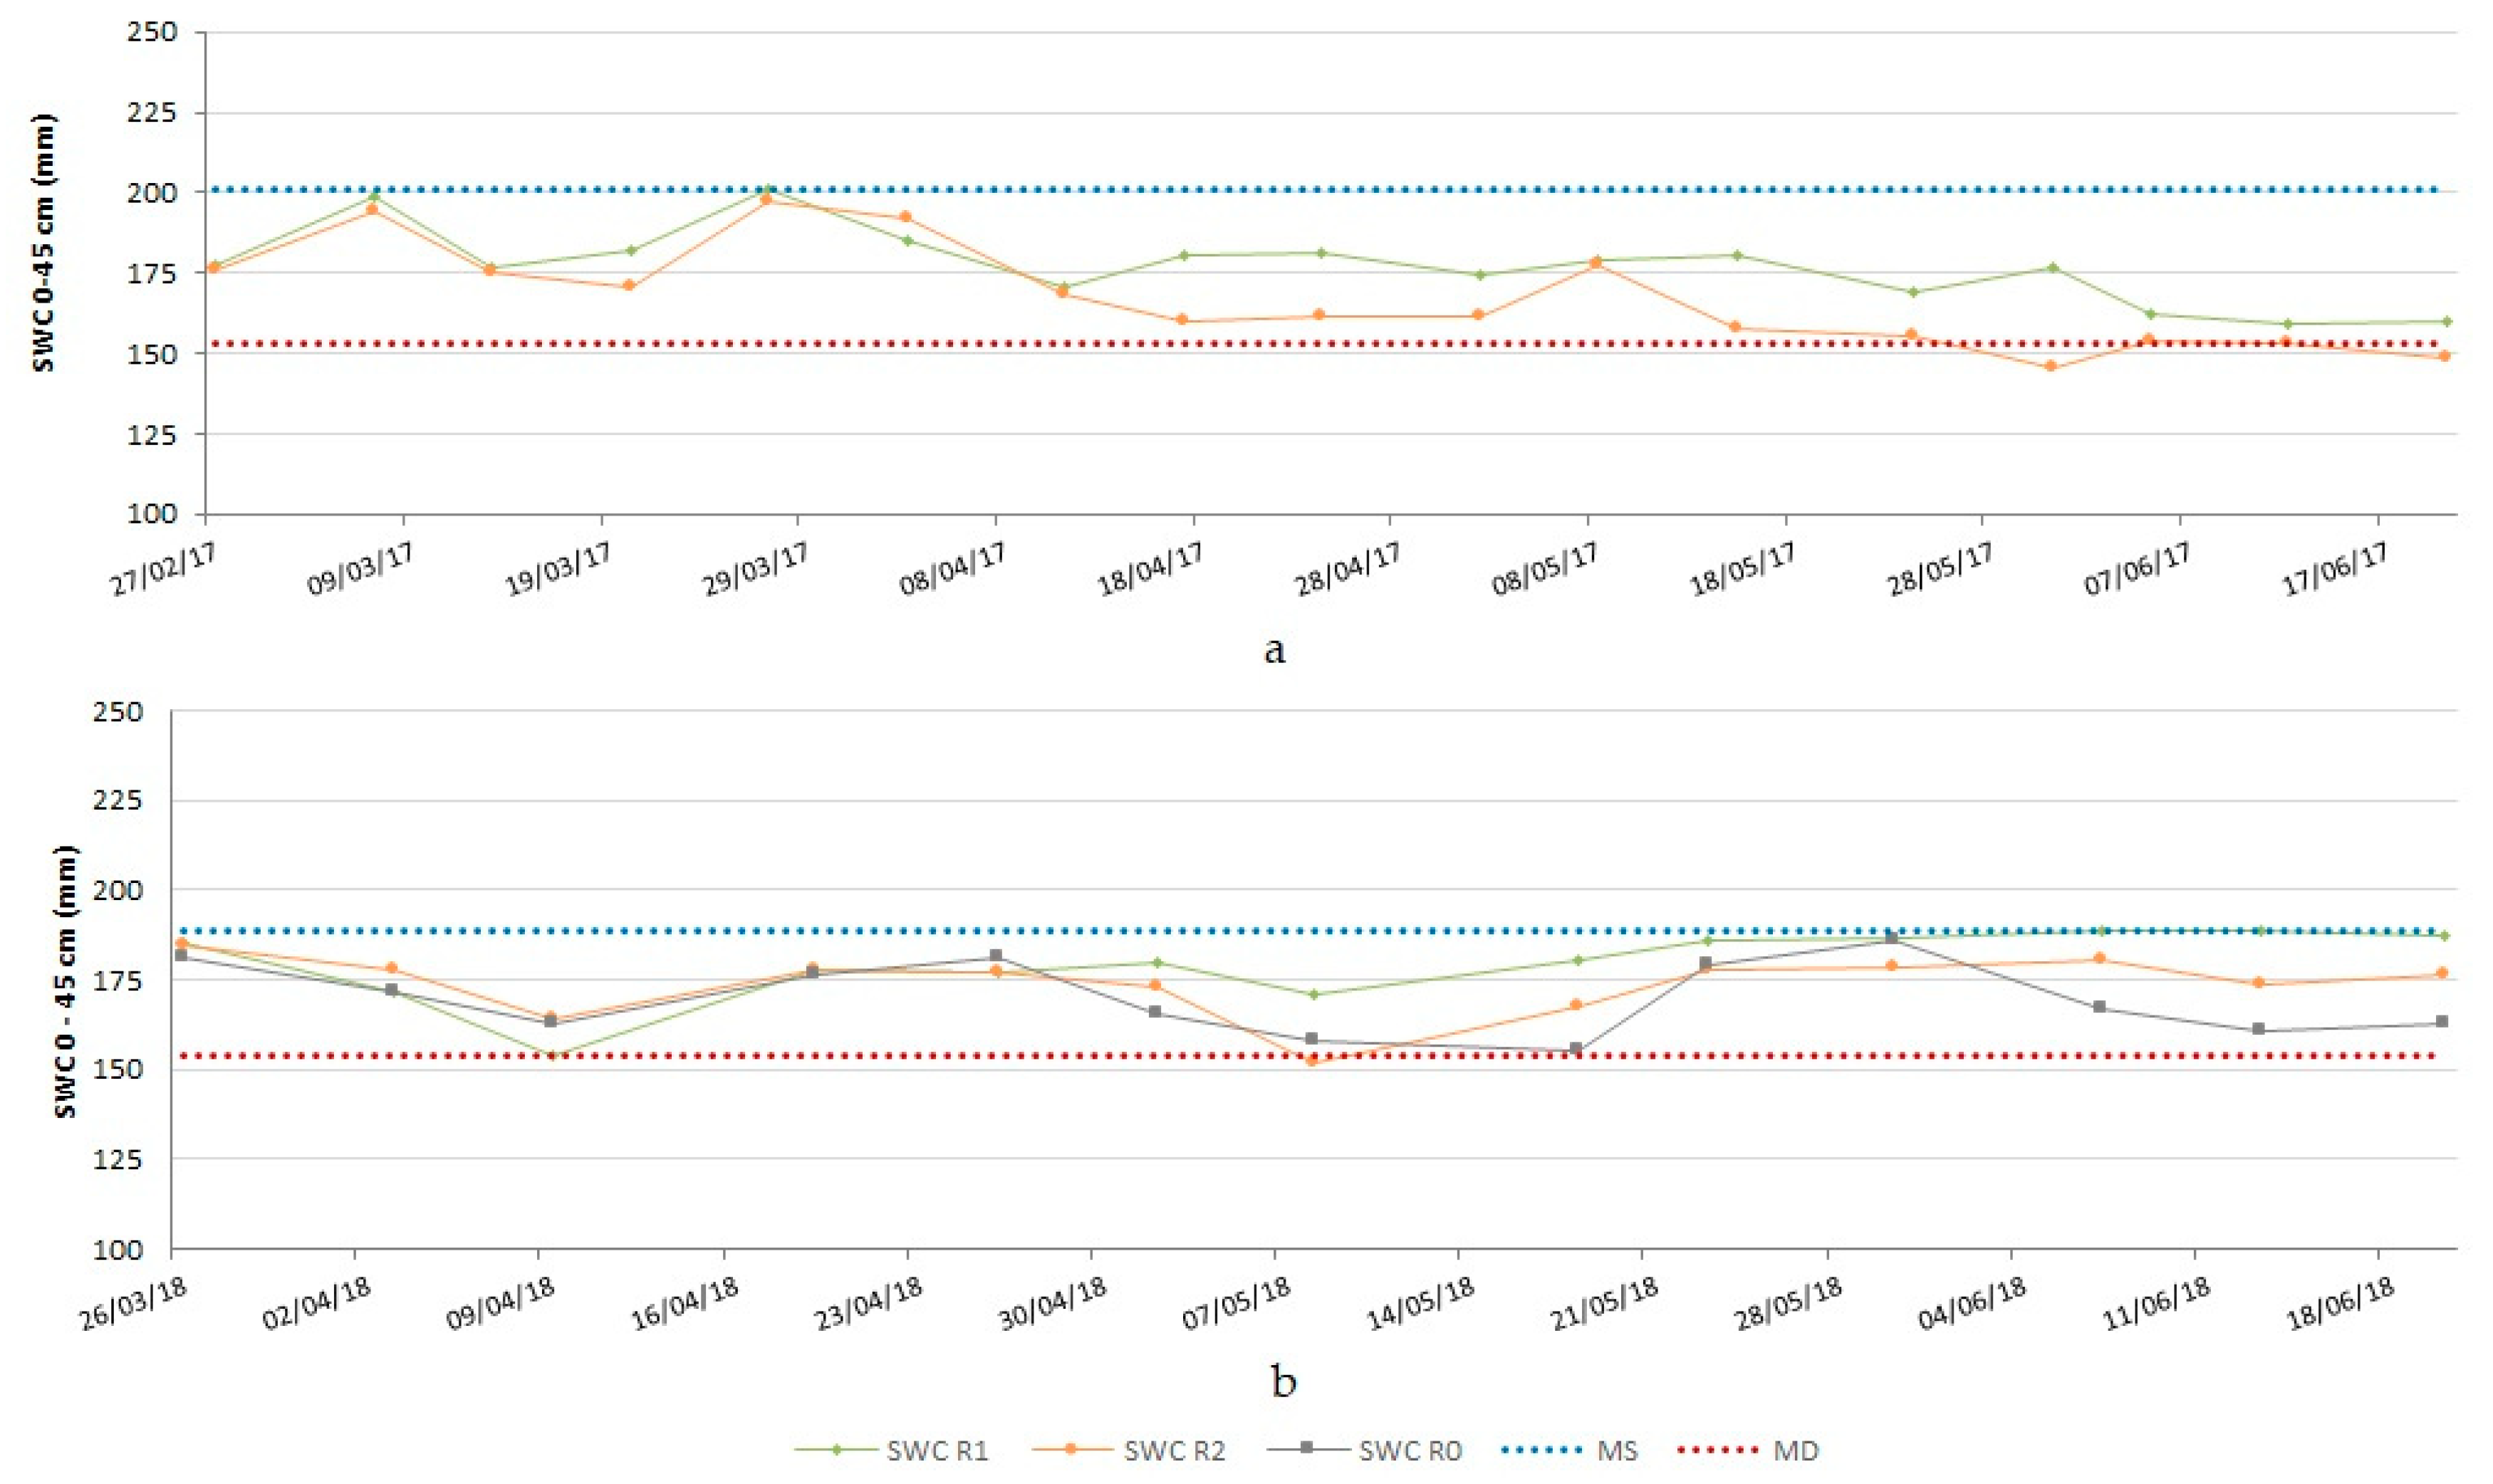
3.3. Soil Water Content

Based on the soil water volumetric content (θV) registered by the capacitance probes, the soil water content (SWC; mm) in each day of monitoring was computed using:
S W C z , i = θ v z , i · z ,
where SWCz,i is the available soil water in each soil layer on day i (mm); θvz,,i is the soil water volumetric content in each soil layer on day i; and z is the depth (in mm) of the soil layer covered by the sensor (15 cm in the first layer, in order to take into account the superficial layer from 0 to 5 cm plus the 10 cm diameter of the sensor range, and 10 cm in the remaining three sensors).
The total SWC in the 0–45 cm profile on each day of monitoring, SWCi, is the sum of the SWCz,i of the n layers covered by the probe (in this case, n = 4):
S W C i = z = 1 n S W C z , i
Each year, the maximum storage (MS) and maximum depletion (MD) were evaluated from the values of SWCi throughout the cycle to evaluate readily available water (RAW) [58]. In this case:
RAW = MS MD ,
where MS corresponds to field capacity (mm), and MD is the management-allowed depletion or lower threshold of soil water content below which water stress develops (mm). MS and MD were obtained based on the methodology described in [63,64] through observation of the soil water dynamics during each year in the full irrigation treatment (R1) plots. Field capacity is the steady SWC value recorded 24 (light textured soils) to 48 h (heavy textured soils) after probe installation and all gravitational water is drained from the soil, while the offset of crop water stress occurs when there is a marked reduction in the slope of the soil water content curve, denoting the difficulties experienced by plants in extracting water from the soil. Values found for the 0–45 cm soil profile were: MS = 201 mm and MD = 153 mm, in 2016/2017; and MS = 189 mm and MD = 154 mm, in 2017/2018.

3.4. Phenology and Yield Evaluation

The main phenological stages in each water regime treatment were registered throughout the crop cycle. Yield and yield components evaluated were grain yield (kg ha−1), obtained in each sublot, corrected to 12% moisture, and extrapolated to the hectare; number of spikes per m−2, obtained by counting in two areas of 0.2 m2 in each subplot and extrapolating to the square meter; 1000-grain weight (g), obtained by electronic counting on a seed counter (Pfeuffer GmbH) of 100 grains, according to ISO 520:1977, followed by weighing and multiplication by 10; and number of grains per m−2, determined from dividing grain yield (kg ha−1) by 1000-grain weight (g), multiplied by 100.
For the statistical analysis of the data (Analytical Software Statistix 8.0.), a two-way ANOVA was performed (water regime and nitrogen fertilization). Differences between means were compared using Tukey’s test (p < 0.05).

4. Conclusions

The results highlight the determining influence of the climatic variability typical of the Mediterranean climate on the agronomic yield of common wheat. The extreme aridity and high water requirements felt in 2016/2017 resulted in lower yields and in a differentiation between irrigation treatments in the trial with conventional fertilizer. More precisely, significantly higher values were observed in the full irrigation regime (R1), both in grain weight and in grain yield. However, in the EEF trial, no significant differences between water regimes were observed in grain yield.
The availability of soil water provided by the spring precipitation distribution in 2017/2018, coupled with the large capacity of soil water storage, meant that a true differentiation between the volumes and dates of irrigation in the irrigated treatments was not possible. In this year, the water regime did not influence grain yield, with statistically similar values for the rainfed and the two irrigation regimes. Also, the highest values of grain yield were obtained in treatments with conventional fertilizers indicating that, not considering the possible effects on grain quality, the use of ‘special’ fertilizers had no positive effect on wheat productivity.

Author Contributions

Conceptualization, M.P. and A.T.; Formal analysis, M.P., A.T., T.R., and P.O.; Funding acquisition, M.P. and A.T.; Investigation, M.P., A.T., T.R., P.O., L.B., and J.D.; Methodology, M.P. and A.T.; Project administration, M.P.; Resources, M.P., L.B., and J.D.; Supervision, M.P.; Visualization, M.P. and A.T.; Writing—original draft, M.P. and A.T.; Writing—review & editing, A.T.

Funding

This research was supported by the Project INTERATrigo (Yield and quality evaluation in wheat as a function of water-nitrogen interactions), funded by FEDER through the COMPETE2020 and PORLisboa Programs and the FCT/MCTES through national funds (PIDDAC), grant numbers POCI-01-0145-FEDER-023262, LISBOA-01-0145-FEDER-023262, and SAICT-POL/23262/2016. The APC was funded by FCT—Fundação para a Ciência e a Tecnologia, Portugal, grant number UID/GEO/04035/2013.

Conflicts of Interest

The authors declare no conflicts of interest.

References

  1. EUROSTAT. Wheat and Spelt by Area, Production and Humidity; Eurostat: Brussels, Belgium, 2019. [Google Scholar]
  2. Páscoa, P.; Gouveia, C.M.; Russo, A.; Trigo, R.M. Drought Trends in the Iberian Peninsula over the Last 112 Years. Adv. Meteorol. 2017, 2017, 4653126. [Google Scholar] [CrossRef]
  3. Vicente-Serrano, S.M.; Lopez-Moreno, J.-I.; Beguería, S.; Lorenzo-Lacruz, J.; Sanchez-Lorenzo, A.; García-Ruiz, J.M.; Azorin-Molina, C.; Morán-Tejeda, E.; Revuelto, J.; Trigo, R.; et al. Evidence of increasing drought severity caused by temperature rise in southern Europe. Env. Res. Lett. 2014, 9, 044001. [Google Scholar] [CrossRef]
  4. Kovats, R.S.; Valentini, R.; Bouwer, L.M.; Georgopoulou, E.; Jacob, D.; Martin, E.; Rounsevell, M.; Soussana, J.F. Europe. In Climate Change 2014: Impacts, Adaptation, and Vulnerability; Part B: Regional Aspects. Contribution of Working Group II to the Fifth Assessment Report of the Intergovernmental Panel on Climate Change; Barros, V.R., Field, C.B., Dokken, D.J., Mastrandrea, M.D., Mach, K.J., Bilir, T.E., Chatterjee, M., Ebi, K.L., Estrada, Y.O., Genova, R.C., et al., Eds.; Cambridge University Press: Cambridge, UK; New York, NY, USA, 2014; pp. 1267–1326. [Google Scholar]
  5. Olesen, J.E.; Trnka, M.; Kersebaum, K.C.; Skjelvåg, A.O.; Seguin, B.; Peltonen-Sainio, P.; Rossi, F.; Kozyra, J.; Micale, F. Impacts and adaptation of European crop production systems to climate change. Eur. J. Agron. 2011, 34, 96–112. [Google Scholar] [CrossRef]
  6. Olesen, J.E.; Bindi, M. Consequences of climate change for European agricultural productivity, land use and policy. Eur. J. Agron. 2002, 16, 239–262. [Google Scholar] [CrossRef]
  7. Trnka, M.; Olesen, J.E.; Kersebaum, K.C.; Skjelvåg, A.O.; Eitzinger, J.; Seguin, B.; Peltonen-Sainio, P.; Rötter, R.; Iglesias, A.; Orlandini, S.; et al. Agroclimatic conditions in Europe under climate change. Glob. Chang. Biol. 2011, 17, 2298–2318. [Google Scholar] [CrossRef] [Green Version]
  8. Trnka, M.; Hlavinka, P.; Semenov, M.A. Adaptation options for wheat in Europe will be limited by increased adverse weather events under climate change. J. R. Soc. Interface 2015, 12, 20150721. [Google Scholar] [CrossRef] [PubMed] [Green Version]
  9. Mäkinen, H.; Kaseva, J.; Balek, J.; Kersebaum, K.; Nendel, C.; Gobin, A.; Olesen, J.; Bindi, M.; Ferrise, R.; Moriondo, M.; et al. Sensitivity of European wheat to extreme weather. Field Crop. Res. 2018, 222, 209–217. [Google Scholar] [CrossRef]
  10. Prasad, P.V.V.; Maduraimuthu, D. Response of floret fertility and individual grain weight of wheat to high temperature stress: Sensitive stages and thresholds for temperature and duration. Funct. Plant Biol. 2014, 41, 1261–1269. [Google Scholar] [CrossRef]
  11. Porter, J.R.; Semenov, M.A. Crop responses to climatic variation. Philos. Trans. R. Soc. Lond. B Biol. Sci. 2005, 360, 2021–2035. [Google Scholar] [CrossRef]
  12. Porter, J.R.; Gawith, M. Temperatures and the growth and development of wheat: A review. Eur. J. Agron. 1999, 10, 23–36. [Google Scholar] [CrossRef]
  13. Luo, Q. Temperature thresholds and crop production: A review. Clim. Chang. 2011, 109, 583–598. [Google Scholar] [CrossRef]
  14. Barnabás, B.; Jäger, K.; Féhér, A. The effect of drought and heat stress on reproductive processes in cereals. Plant Cell Environ. 2008, 31, 11–38. [Google Scholar] [CrossRef] [PubMed]
  15. Jovanovic, Z.; Stikic, R. Strategies for Improving Water Productivity and Quality of Agricultural Crops in an Era of Climate Change. In Irrigation Systems and Practices in Challenging Environments; Lee, T.S., Ed.; InTech: Rijeka, Croatia, 2012; ISBN 978-953-51-0420-9. [Google Scholar] [Green Version]
  16. Albrizio, R.; Todorovic, M.; Matic, T.; Stellacci, A.M. Comparing the interactive effects of water and nitrogen on durum wheat and barley grown in a Mediterranean environment. Field Crop. Res. 2010, 115, 179–190. [Google Scholar] [CrossRef]
  17. Boteta, L. Gestão da rega do trigo. Gd. Cult. 2013, 1, 18–21. [Google Scholar]
  18. Patanita, M.; Tomaz, A.; Dôres, J. Ainda a rega dos cereais de sementeira outono-invernal. Agrotec 2019, 30, 60–61. [Google Scholar]
  19. Alghory, A.; Yazar, A. Evaluation of net return and grain quality characteristics of wheat for various irrigation strategies under the Mediterranean climatic conditions. Agric. Water Manag. 2018, 203, 395–404. [Google Scholar] [CrossRef]
  20. Acevedo, E.; Silva, P.S.; Silva, H. Wheat Growth and Physiology. In Bread Wheat. Improvement and Production; FAO Plant Production and Protection Series; Food and Agriculture Organization of the United Nations: Rome, Italy, 2002. [Google Scholar]
  21. Pala, M.; Matar, A.; Mazid, A. Assessment of the effects of environmental factors on the response of wheat to fertilizer in on-farm trials in a Mediterranean Type environment. Exp. Agric. 1996, 32, 339–349. [Google Scholar] [CrossRef]
  22. Tomaz, A.; Patanita, M.; Guerreiro, I.; Boteta, L.; Ferro Palma, J. Efficient use of water and nutrients in irrigated cropping systems in the Alqueva region. Span. J. Soil Sci. 2018, 8, 12–23. [Google Scholar]
  23. Liu, W.; Wang, J.; Wang, C.; Ma, G.; Wei, Q.; Lu, H.; Xie, Y.; Ma, D.; Kang, G. Root growth, water and nitrogen use efficiencies in winter wheat under different irrigation and nitrogen regimes in North China Plain. Front. Plant Sci. 2018, 9, 1798. [Google Scholar] [CrossRef]
  24. Plaut, Z.; Butow, B.J.; Blumenthal, C.S.; Wrigley, C.W. Transport of dry matter into developing wheat kernels and its contribution to grain yield under post-anthesis water deficit and elevated temperature. Field Crop. Res. 2004, 86, 185–198. [Google Scholar] [CrossRef]
  25. Blandino, M.; Marinaccio, F.; Vaccino, P.; Reyneri, A. Nitrogen Fertilization Strategies Suitable to Achieve the Quality Requirements of Wheat for Biscuit Production. Agron. J. 2015, 107, 1584–1594. [Google Scholar] [CrossRef] [Green Version]
  26. Yu, Z.; Islam, S.; She, M.; Diepeveen, D.; Zhang, Y.; Tang, G.; Zhang, J.; Juhasz, A.; Yang, R.; Ma, W. Wheat grain protein accumulation and polymerization mechanisms driven by nitrogen fertilization. Plant J. 2018, 96, 1160–1177. [Google Scholar] [CrossRef] [PubMed]
  27. Trenkel, M.E. Improving Fertilizer Use Efficiency. Controlled-Release and Stabilized Fertilizers in Agriculture; IFA: Paris, France, 1997. [Google Scholar]
  28. Chen, D.; Suter, H.C.; Islam, A.; Edis, R.; Freney, J.; N Walker, C. Prospects of improving efficiency of fertiliser nitrogen in Australian agriculture: A review of enhanced efficiency fertilisers. Aust. J. Soil Res. 2008, 46, 289–301. [Google Scholar] [CrossRef]
  29. Trenkel, M.E. Special Fertilizers. In Ullmann’s Agrochemicals; Wiley-VCH Verlag GmbH: Weinheim, Germany, 2007; Volume 1, pp. 42–70. ISBN 978-3-527-31604-5. [Google Scholar]
  30. Arrobas, M.; Parada, M.; Magalhães, P.; Rodrigues, M. Nitrogen-use efficiency and economic efficiency of slow-release N fertilisers applied to irrigated turfs in a Mediterranean environment. Nutr. Cycl. Agroecosyst. 2011, 89, 329–339. [Google Scholar] [CrossRef]
  31. Maharjan, B.; Venterea, R.; Rosen, C. Fertilizer and Irrigation Management Effects on Nitrous Oxide Emissions and Nitrate Leaching. Agron. J. 2014, 106, 703–714. [Google Scholar] [CrossRef] [Green Version]
  32. Tomaz, A.; Ferro Palma, J.; Guerreiro, I.; Patanita, M.I.; Penacho, J.; Dôres, J.; Costa, M.N.; Rosa, E.; Patanita, M. An Overview on the Use of Enhanced Efficiency Nitrogen Fertilizers in Irrigated Mediterranean Agriculture. BJSTR 2017, 1, 1938–1940. [Google Scholar] [CrossRef]
  33. Porter, J.R.; Xie, L.; Challinor, A.J.; Cochrane, K.; Howden, S.M.; Iqbal, M.M.; Lobell, D.B.; Travasso, M.I. Food Security and Food Production Systems. In Climate Change 2014: Impacts, Adaptation, and Vulnerability; Part A: Global and Sectoral Aspects. Contribution of Working Group II to the Fifth Assessment Report of the Intergovernmental Panel on Climate, Change; Field, C.B., Barros, V.R., Dokken, D.J., Mach, K.J., Mastrandrea, M.D., Bilir, T.E., Chatterjee, M., Ebi, K.L., Estrada, Y.O., Genova, R.C., et al., Eds.; Cambridge University Press: Cambridge, UK; New York, NY, USA, 2014; pp. 485–533. [Google Scholar]
  34. Ventrella, D.; Charfeddine, M.; Moriondo, M.; Rinaldi, M.; Bindi, M. Agronomic adaptation strategies under climate change for winter durum wheat and tomato in southern Italy: Irrigation and nitrogen fertilization. Reg. Environ. Chang. 2012, 12, 407–419. [Google Scholar] [CrossRef]
  35. Raza, A.; Razzaq, A.; Mehmood, S.; Zou, X.; Zhang, X.; Lv, Y.; Xu, J. Impact of Climate Change on Crops Adaptation and Strategies to Tackle Its Outcome: A Review. Plants 2019, 8, 34. [Google Scholar] [CrossRef]
  36. Paymard, P.; Bannayan, M.; Haghighi, R.S. Analysis of the climate change effect on wheat production systems and investigate the potential of management strategies. Nat. Hazards 2018, 91, 1237–1255. [Google Scholar] [CrossRef]
  37. Carvalho, M.; Serralheiro, R.; Corte-Real, J.; Valverde, P. Implications of climate variability and future trends on wheat production and crop technology adaptations in southern regions of Portugal. Water Util. J. 2015, 9, 13–18. [Google Scholar]
  38. Tadayon, M.R.; Ebrahimi, R.; Tadayyon, A. Increased Water Productivity of Wheat under Supplemental Irrigation and Nitrogen Application in a Semi-arid Region. J. Agric. Sci. Technol. 2012, 14, 995–1003. [Google Scholar]
  39. Zhang, X.; Qin, W.; Chen, S.; Shao, L.; Sun, H. Responses of yield and WUE of winter wheat to water stress during the past three decades—A case study in the North China Plain. Agric. Water Manag. 2017, 179, 47–54. [Google Scholar] [CrossRef]
  40. Tomaz, A.; Patanita, M.; Guerreiro, I.; Boteta, L.; Palma, J.F. Water use and productivity of maize-based cropping systems in the Alqueva region (Portugal). Cereal Res. Commun. 2017, 45, 711–721. [Google Scholar] [CrossRef]
  41. Nasseri, A.; Ali Fallahi, H.; Siadat, A.; Eslami-Gumush Tappeh, K. Protein and N-use efficiency of rainfed wheat responses to supplemental irrigation and nitrogen fertilization. Arch. Agron. Soil Sci. 2009, 55, 315–325. [Google Scholar] [CrossRef]
  42. Fallahi, H.; Nasseri, A.; Siadat, A. Wheat Yield Components are Positively Influenced by Nitrogen Application under Moisture Deficit Environments. Int. J. Agric. Biol. 2008, 10, 1560–8530. [Google Scholar]
  43. Ul-Allah, S.; Iqbal, M.; Maqsood, S.; Naeem, M.; Ijaz, M.; Ashfaq, W.; Hussain, M. Improving the performance of bread wheat genotypes by managing irrigation and nitrogen under semi-arid conditions. Arch. Agron. Soil Sci. 2018, 64, 1678–1689. [Google Scholar] [CrossRef]
  44. Garofalo, P.; Ventrella, D.; Kersebaum, K.C.; Gobin, A.; Trnka, M.; Giglio, L.; Dubrovský, M.; Castellini, M. Water footprint of winter wheat under climate change: Trends and uncertainties associated to the ensemble of crop models. Sci. Total Environ. 2019, 658, 1186–1208. [Google Scholar] [CrossRef]
  45. Ruiz-Ramos, M.; Mínguez, M. Evaluating uncertainty in climate change impacts on crop productivity in the Iberian Peninsula. Clim. Res. 2010, 44, 69–82. [Google Scholar] [CrossRef] [Green Version]
  46. Palosuo, T.; Kersebaum, K.C.; Angulo, C.; Hlavinka, P.; Moriondo, M.; Olesen, J.E.; Patil, R.H.; Ruget, F.; Rumbaur, C.; Takáč, J.; et al. Simulation of winter wheat yield and its variability in different climates of Europe: A comparison of eight crop growth models. Eur. J. Agron. 2011, 35, 103–114. [Google Scholar] [CrossRef] [Green Version]
  47. IPMA (Instituto Português do Mar e da Atmosfera). Boletim Climatológico Anual de Portugal Continental 2017; Instituto Português do Mar e da Atmosfera, IP: Lisboa, Portugal, 2017. [Google Scholar]
  48. Palmer, W.C. Meteorological Drought; Weather Bureau: Washington, DC, USA, 1965. [Google Scholar]
  49. Costa, N.; Bagulho, A.; Patanita, M. Qualidade dos Trigos. Parte III/III: Fatores que afetam a qualidade do trigo. Gd. Culturas 2017, 9, 11–15. [Google Scholar]
  50. Oliveira, P.; Patanita, M.; Dôres, J.; Boteta, L.; Palma, J.F.; Patanita, M.I.; Guerreiro, I.; Penacho, J.; Costa, M.N.; Rosa, E.; et al. Combined effects of irrigation management and nitrogen fertilization on soft wheat productive responses under Mediterranean conditions. E3S Web Conf. 2019, 86, 19. [Google Scholar] [CrossRef] [Green Version]
  51. ANPOC (Associação Nacional de Produtores de Oleaginosas, Proteaginosas e Cereais); LVR (Lista de Variedades Recomendadas). Lista de Variedades Recomendadas de Trigo Mole; Apoio à decisão das sementeiras 2017/18; Assoociação Nacional de Produtores de Oleaginosas, Proteaginosas e Cereais: Évora, Portugal, 2017. [Google Scholar]
  52. IPMA (Instituto Português do Mar e da Atmosfera). Normais Climatológicas; Instituto Português do Mar e da Atmosfera, IP: Lisboa, Portugal, 2019. [Google Scholar]
  53. IUSS. Working Group WRB World Reference Base for Soil Resources 2014, Update 2015; FAO: Rome, Italy, 2014. [Google Scholar]
  54. SROA—Serviço de Reconhecimento e Ordenamento Agrário. Carta de Solos de Portugal; Ministério da Economia, Secretaria de Estado da Agricultura: Lisboa, Portugal, 1961. [Google Scholar]
  55. Virmani, S.M.; Sahrawat, K.L.; Burford, J.R. Physical and Chemical Properties of Vertisols and their Management. In Proceedings of the Twelfth International Congress of Soil Science, New Delhi, India, 8–16 February 1982; p. 14. [Google Scholar]
  56. COTR (Centro Operativo e de Tecnologia do Regadio). SAGRA—Sistema Agrometeorológico para a Gestão da Rega no Alentejo. 2018. Available online: http://www.cotr.pt/servicos/sagranet.php (accessed on 19 October 2019).
  57. COTR (Centro Operativo e de Tecnologia do Regadio). MOGRA—Modelo de Gestão da Rega para o Alentejo. 2018. Available online: http://www.cotr.pt/servicos/mogra.php (accessed on 19 October 2019).
  58. Allen, R.G. , Pereira L.S., Raes D., Smith M. Crop Evapotranspiration—Guidelines for Computing Crop Water Requirements; FAO: Rome, Italy, 1998. [Google Scholar]
  59. Zadoks, J.C.; Chang, T.T.; Konzak, C.F. A decimal code for the growth stages of cereals. Weed Res. 1974, 14, 415–421. [Google Scholar] [CrossRef]
  60. Ministério da Agricultura, do Mar, do Ambiente e do Ordenamento do Território. Ordinance 259/2012 that Establishes the Action Program for Areas Vulnerable to Nitrates from Agricultural Sources, Diary of the Portuguese Republic, 1st serie, N.º 166. 28 August 2012.
  61. Ministério do Ambiente. Decree-Law 235/97 Implementing Council Directive 91/676/EEC of Concerning the Protection of Waters Against Pollution Caused by Nitrates from Agricultural Sources, Diary of the Portuguese Republic, 1st serie-A, N.º 203. 3 September 1997.
  62. EEC. The Nitrates Directive—Council Directive Concerning the Protection of Waters against Pollution Caused by Nitrates from Agricultural Sources; EEC (European Economic Community): Brussels, Belgium, 1991. [Google Scholar]
  63. Dias, P. Monitorização de Água no Solo: Sonda Profile Probe PR1; COTR (Centro Operativo e de Tecnologia do Regadio): Beja, Portugal, 2003. [Google Scholar]
  64. Sentek. Calibration Manual for Sentek Soil Moisture Sensors; Revision 2.0; Sentek Pty Ltd.: Stepney, Australia, 2011. [Google Scholar]
Figure 1. Irrigation depths (R1 and R2), precipitation (P), maximum daily temperature (Tmax), and minimum daily temperature (Tmin) in Beja. a-2016/2017 crop cycle; b-2017/2018 crop cycle. R1, 100% of crop evapotranspiration (ETc); R2, 100% of ETc at the critical stages of beginning of stem extension, booting, heading, and grain filling.
Plants 08 00429 g001
Figure 2. Soil water content (SWC; mm of water in the 0–45 cm soil profile) in the different water regime treatments. a-2016/2017 crop cycle; b-2017/2018 crop cycle. R1, irrigation with 100% of ETc; R2, irrigation with 100% of ETc at critical stages of beginning of stem extension, booting, heading, and grain filling. MS, maximum storage during the growth cycle (mm of water in the 0–45 cm soil profile); MD, maximum allowed depletion during the growth cycle (mm of water in the 0–45 cm soil profile).
Plants 08 00429 g002
Table 1. Phenological states and their dates in the different water regimes in the 2016/2017 and 2017/2018 trials.
Wheat Phenological Stages2016/20172017/2018
R1 and R2R0R1R2
Sowing24/0122/1222/1222/12
Emergence05/0203/0103/0103/01
Tillering01/0315/0215/0215/02
Stem elongation25/0307/0310/0307/03
Booting14/0409/0409/0409/04
Heading24/0424/0422/0424/04
Harvest23/0625/0725/0718/07
Crop cycle (d)153216214209
R0, rainfed; R1, irrigation with 100% of ETc throughout the cycle; R2, irrigation with 100% of ETc at beginning of stem extension, booting, heading, and grain filling.
Table 2. Effect of the water regime and nitrogen fertilizer splitting/timing on number of spikes per m−2, 1000-grains weight (g) and yield (kg ha−1; corrected to 12% moisture) with Enhanced Efficiency N fertilizers (Trial 1) and with Conventional N fertilizers (Trial 2) in 2016/2017 (adapted from [50]).
a-Trial 1 (2016/2017)b-Trial 2 (2016/2017)
Source of VariationNumber of Spikes per m−21000-Grains Weight (g)Yield (kg ha−1)Source of VariationNumber of Spikes per m−21000-Grains Weight (g)Yield (kg ha−1)
Water regime*N.s.N.s.Water regimeN.s.**
R1396 a42.524594R139341.56 a5614 a
R2354 b40.033942R237139.00 b3488 b
N splitting/timingN.s.N.s.*N splitting/timingN.s.N.s.N.s.
E133541.044170 abC140040.054694
E239742.443929 bC239040.794688
E337340.674126 abC338640.994686
E437342.144458 abC438138.714535
E540041.664564 aC535440.864154
E637139.714361 ab-___
InteractionN.s.N.s.N.s.InteractionN.s.N.s.N.s.
General average37541.284268General average38240.284551
Different letters indicate statistically significant differences (p < 0.05) by the Tukey test; *, significance for p < 0.05; N.s., no significance for p < 0.05. R1, 100% of ETc throughout the cycle; R2, 100% of ETc at stages beginning of stem extension, booting, heading, and grain filling. E1 to E5, stabilized (with nitrification inhibitor) fertilizer splitting/timing treatments; E6, controlled-release (polymer coating) fertilizer splitting/timing treatment (Table 2a). C1 to C5, conventional N fertilizers splitting/timing treatment.
Table 3. Effect of the water regime and nitrogen fertilizer type/splitting/timing on number of spikes per m−2, number of grains per m−2, 1000-grain weight (g), and yield (kg ha−1; corrected to 12% moisture) in 2017/2018.
Source of VariationNumber of Spikes per m−2Number of Grains per m−21000-grain Weight (g)Yield (kg ha−1)
Water regime
R0
R1
R2
N.s.
511
467
463
*
16182 a
15814 ab
14583 b
*
43.82 c
47.57 a
46.14 b
N.s.
7083
7286
6932
N splitting/timing
N1
N2
N3
N4
N5
N6
N7
N8
N.s.
460
490
510
476
461
477
496
475
*
16158 a
16145 a
15991 ab
15236 ab
15091 b
15138 ab
15219 ab
15242 ab
*
45,72 ab
45,51 ab
45,42 ab
46,69 a
45,13 b
46,33 ab
45,27 ab
46,66 a
*
7378 a
7337 a
7244 ab
7091 abc
6793 c
6999 abc
6873 bc
7089 abc
InteractionN.s.N.s.N.s.N.s.
General average3101552745.847100
Different letters indicate statistically significant differences (p < 0.05) by the Tukey test; *, significance for p < 0.05; N.s., no significance for p < 0.05. R0, rainfed; R1, 100% of ETc throughout the cycle; R2, 100% of ETc at the stages of beginning of stem extension, booting, heading, and grain filling. N1 and N2, conventional fertilizer; N3 and N4, stabilized (with nitrification inhibitor) fertilizer; N5 and N6, controlled-release fertilizer (polymer coating); N7 and N8, stabilized (with urease inhibitor) fertilizer. Each pair is distinguished by N splitting over the crop cycle.
Table 4. Nitrogen fertilizer type, splitting (% of N total) and timing (phenological stage) treatments through the wheat cycle in Trial 1 (2016/2017), with Enhanced Efficiency N fertilizers. Crop stages dates between brackets. N – Nitrogen; P – Phosphorus; K – Potassium.
Treatment (N Type/Splitting/Timing)Type of Fertilizer at Sowing (Name and NPK rating)% N total
SowingTilleringStem ExtensionBootingHeading
E1Stabilized, with nitrification inhibitor (Entec 20-10-10)100
E250 50
E350 25 25
E475 25
E575 25
E6Controlled release, with polymer coating (Nergetic 20-8-6)100
Top dressing N fertilizer---Ammonium nitrate (Nitrolusal 27%)
Table 5. Nitrogen fertilizer splitting (% of N total) and timing (phenological stage) treatments through the wheat cycle in Trial 2 (2016/2017), with Conventional N fertilizers. Crop stages dates between brackets.
Treatment (N Splitting/Timing)Type of Fertilizer at Sowing (Name and NPK rating)% N total
SowingTilleringStem ExtensionBootingHeading
C1Conventional (Foskamonio 12–24–12)333333
C2252525 25
C325252525
C4 50 2525
C550 2525
Top dressing N fertilizer--Urea (Ureia 46%)Ammonium nitrate (Nitrolusal 27%)
Table 6. Nitrogen fertilizer type and name, splitting (% of N total), and timing (phenological stage) treatments through the wheat cycle.
Treatment (N Type/Splitting/Timing)Type of Fertilizer at Sowing (Name and NPK rating)% of N Total Applied at Phenological Stages
SowingTilleringStem ExtensionBooting
N1Conventional (Foskamonio 12–24–12)2550 25
N225252525
N3Stabilized, with nitrification inhibitor (Entec 20–10–10)100
N450 50
N5Controlled release, with polymer coating (Nergetic 20–8–6)100
N650 50
N7Stabilized, with urease inhibitor (Renovation Fuerza Plus 20–5–5)100
N850 50
Top dressing N fertilizer--Urea (Ureia 46%)Ammonium nitrate (Nitrolusal 27%)

