Molecular Characterisation of a Supergene Conditioning Super-High Vitamin C in Kiwifruit Hybrids

 , , , ,
  ,
,
Abstract
1. Introduction
2. Results
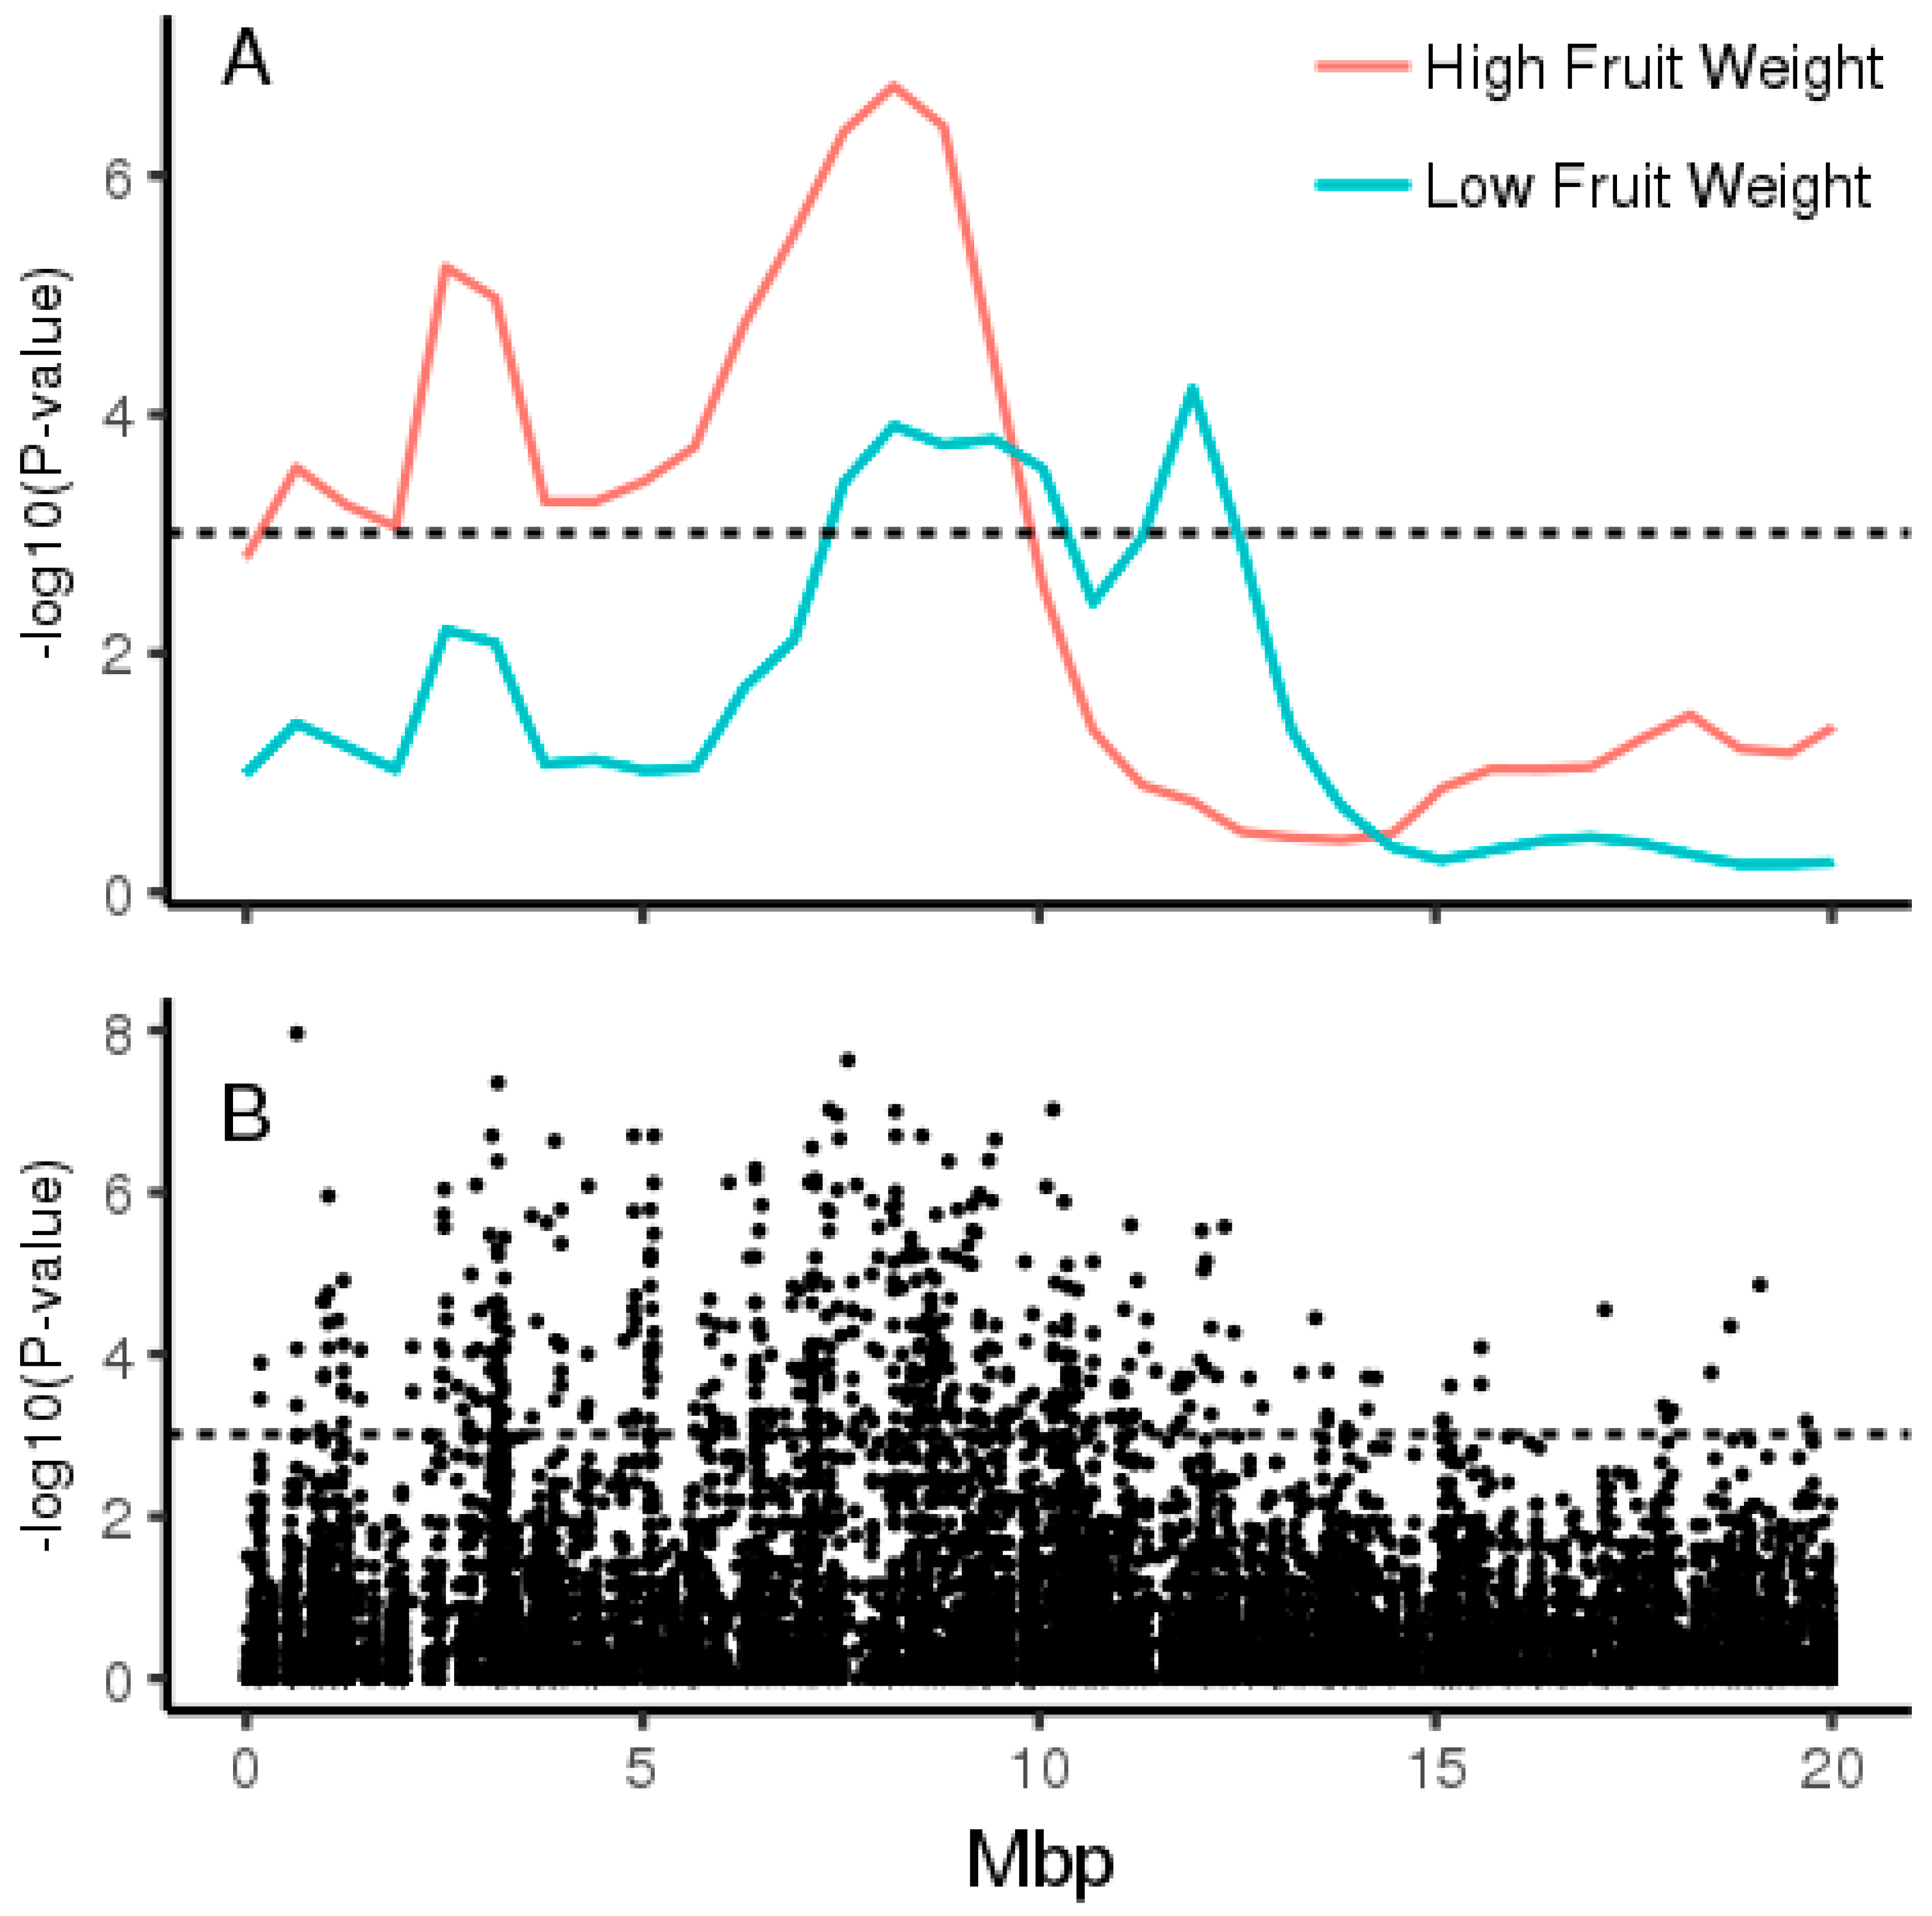
2.1. Pooled Whole-Genome Sequencing and Genome-Wide Association Study (GWAS)
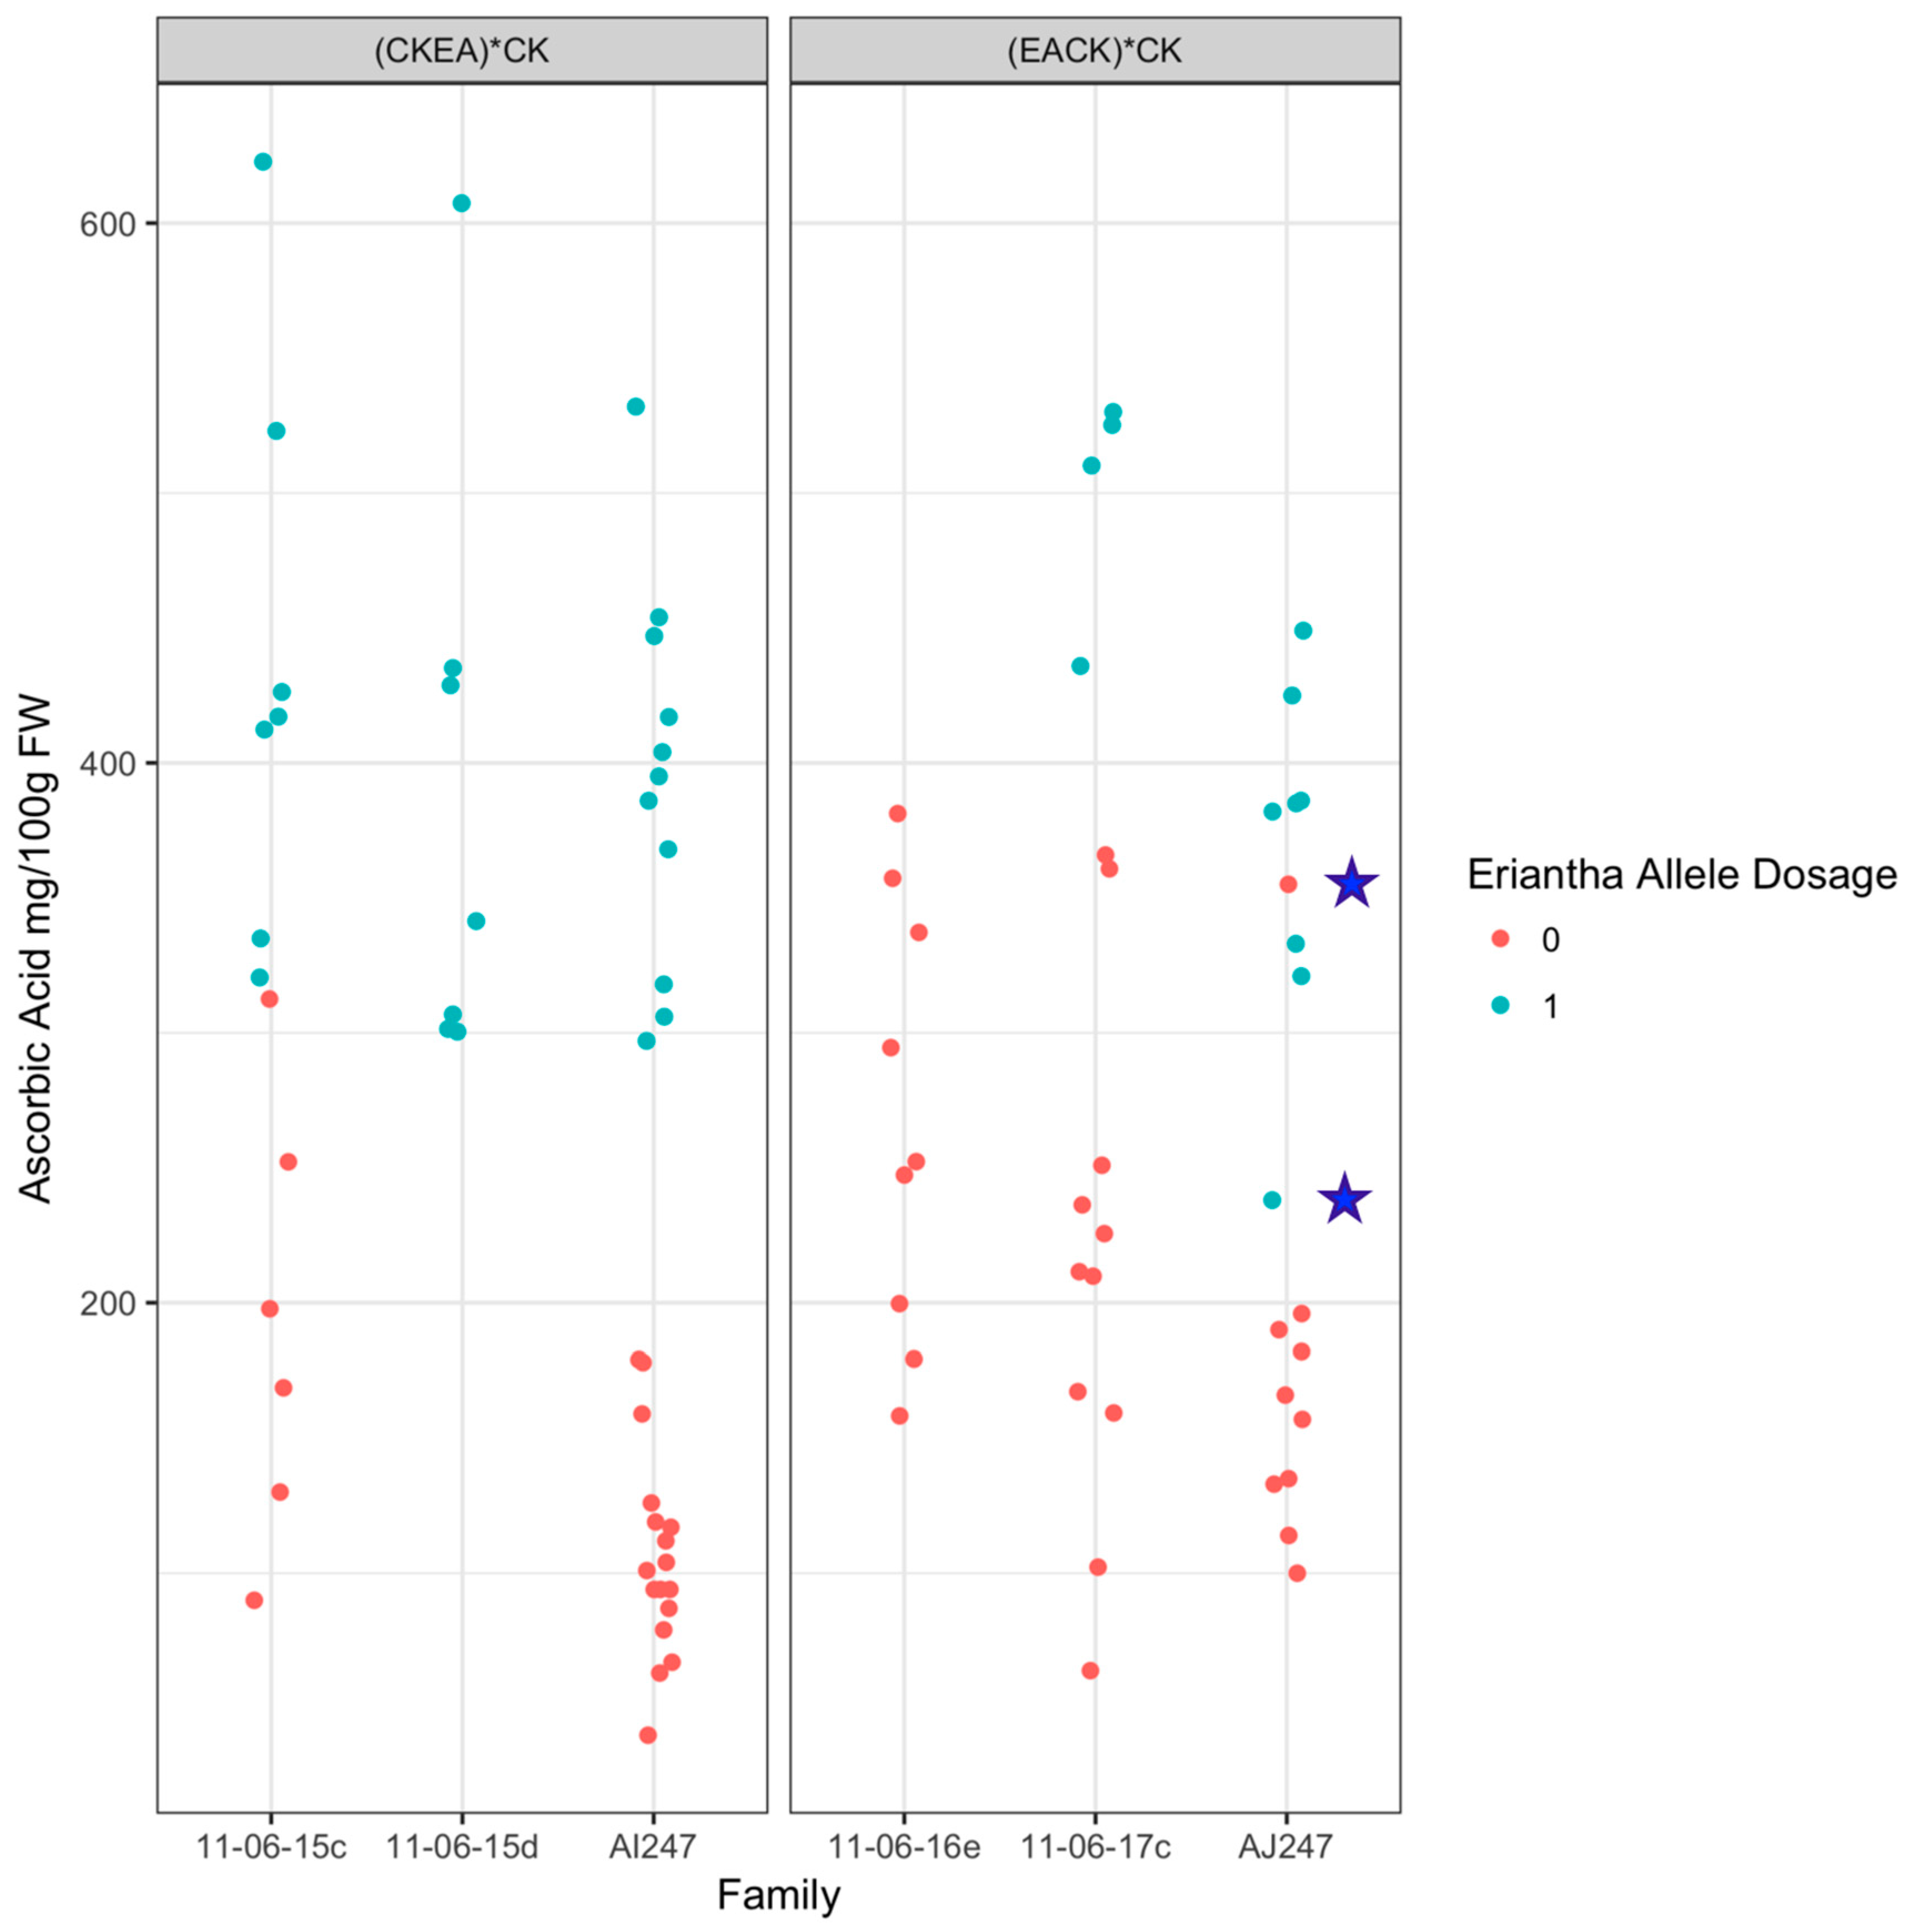
2.2. Validation in Diploid Backcross Populations
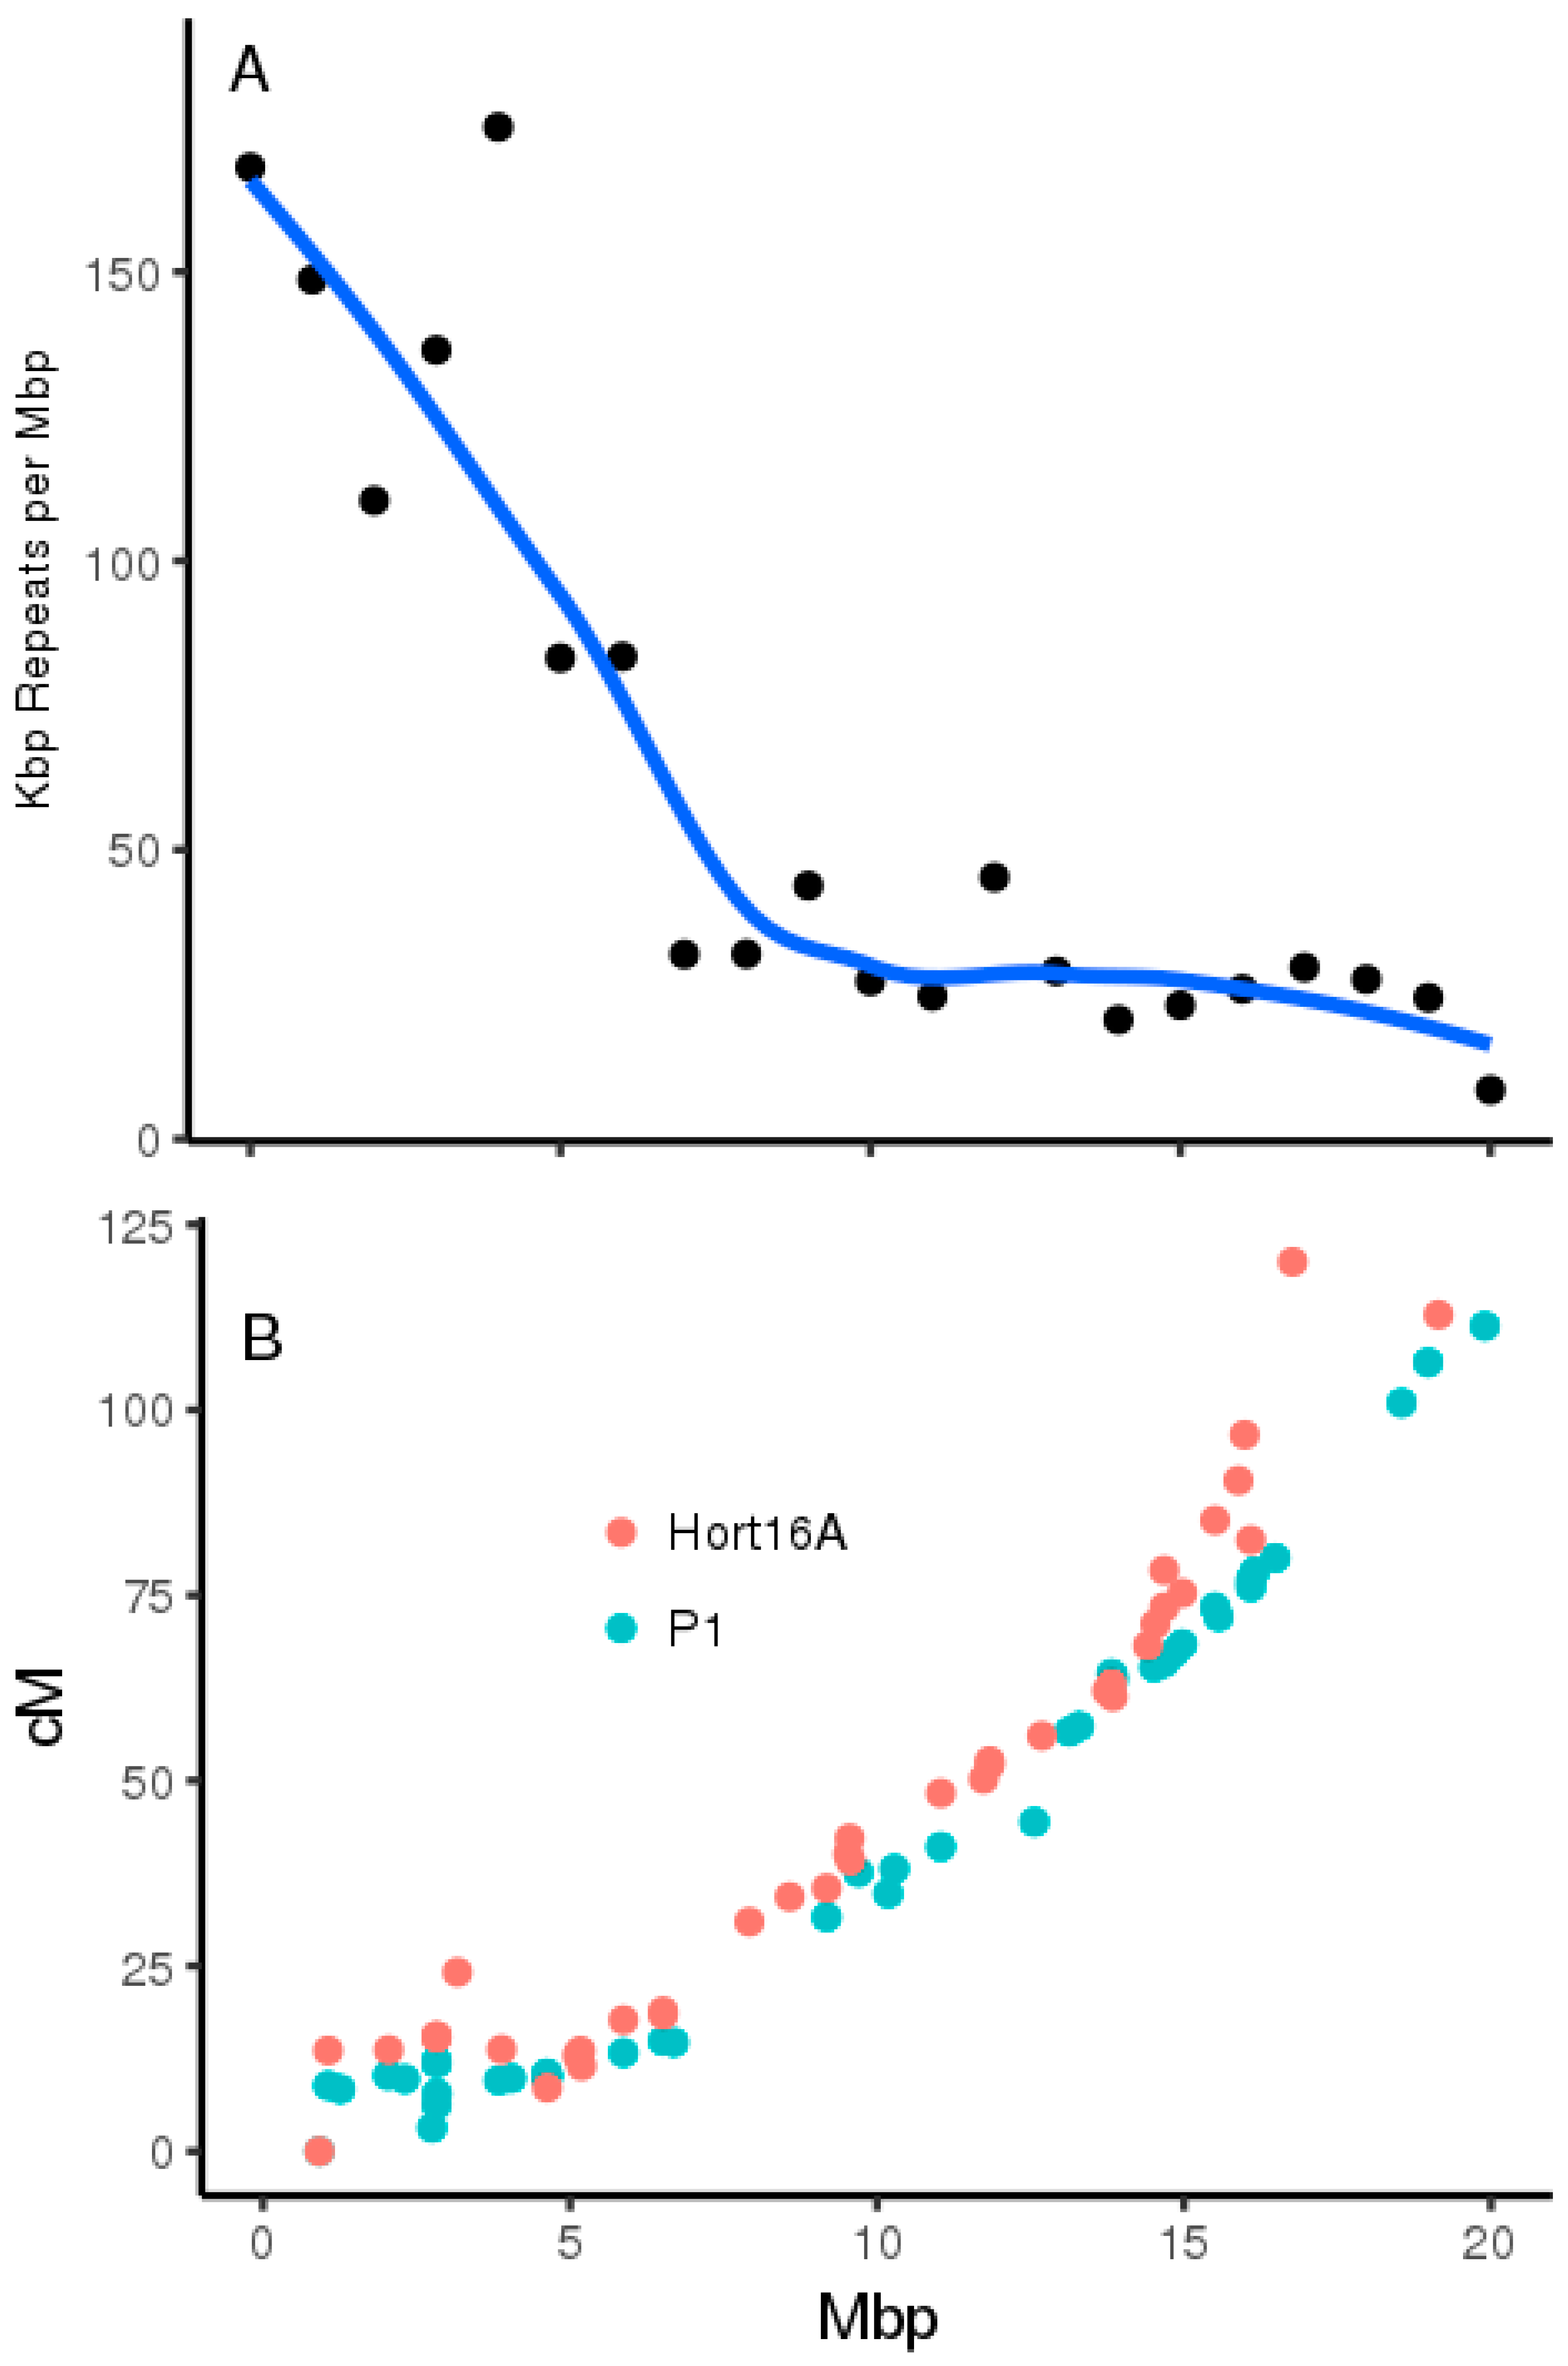
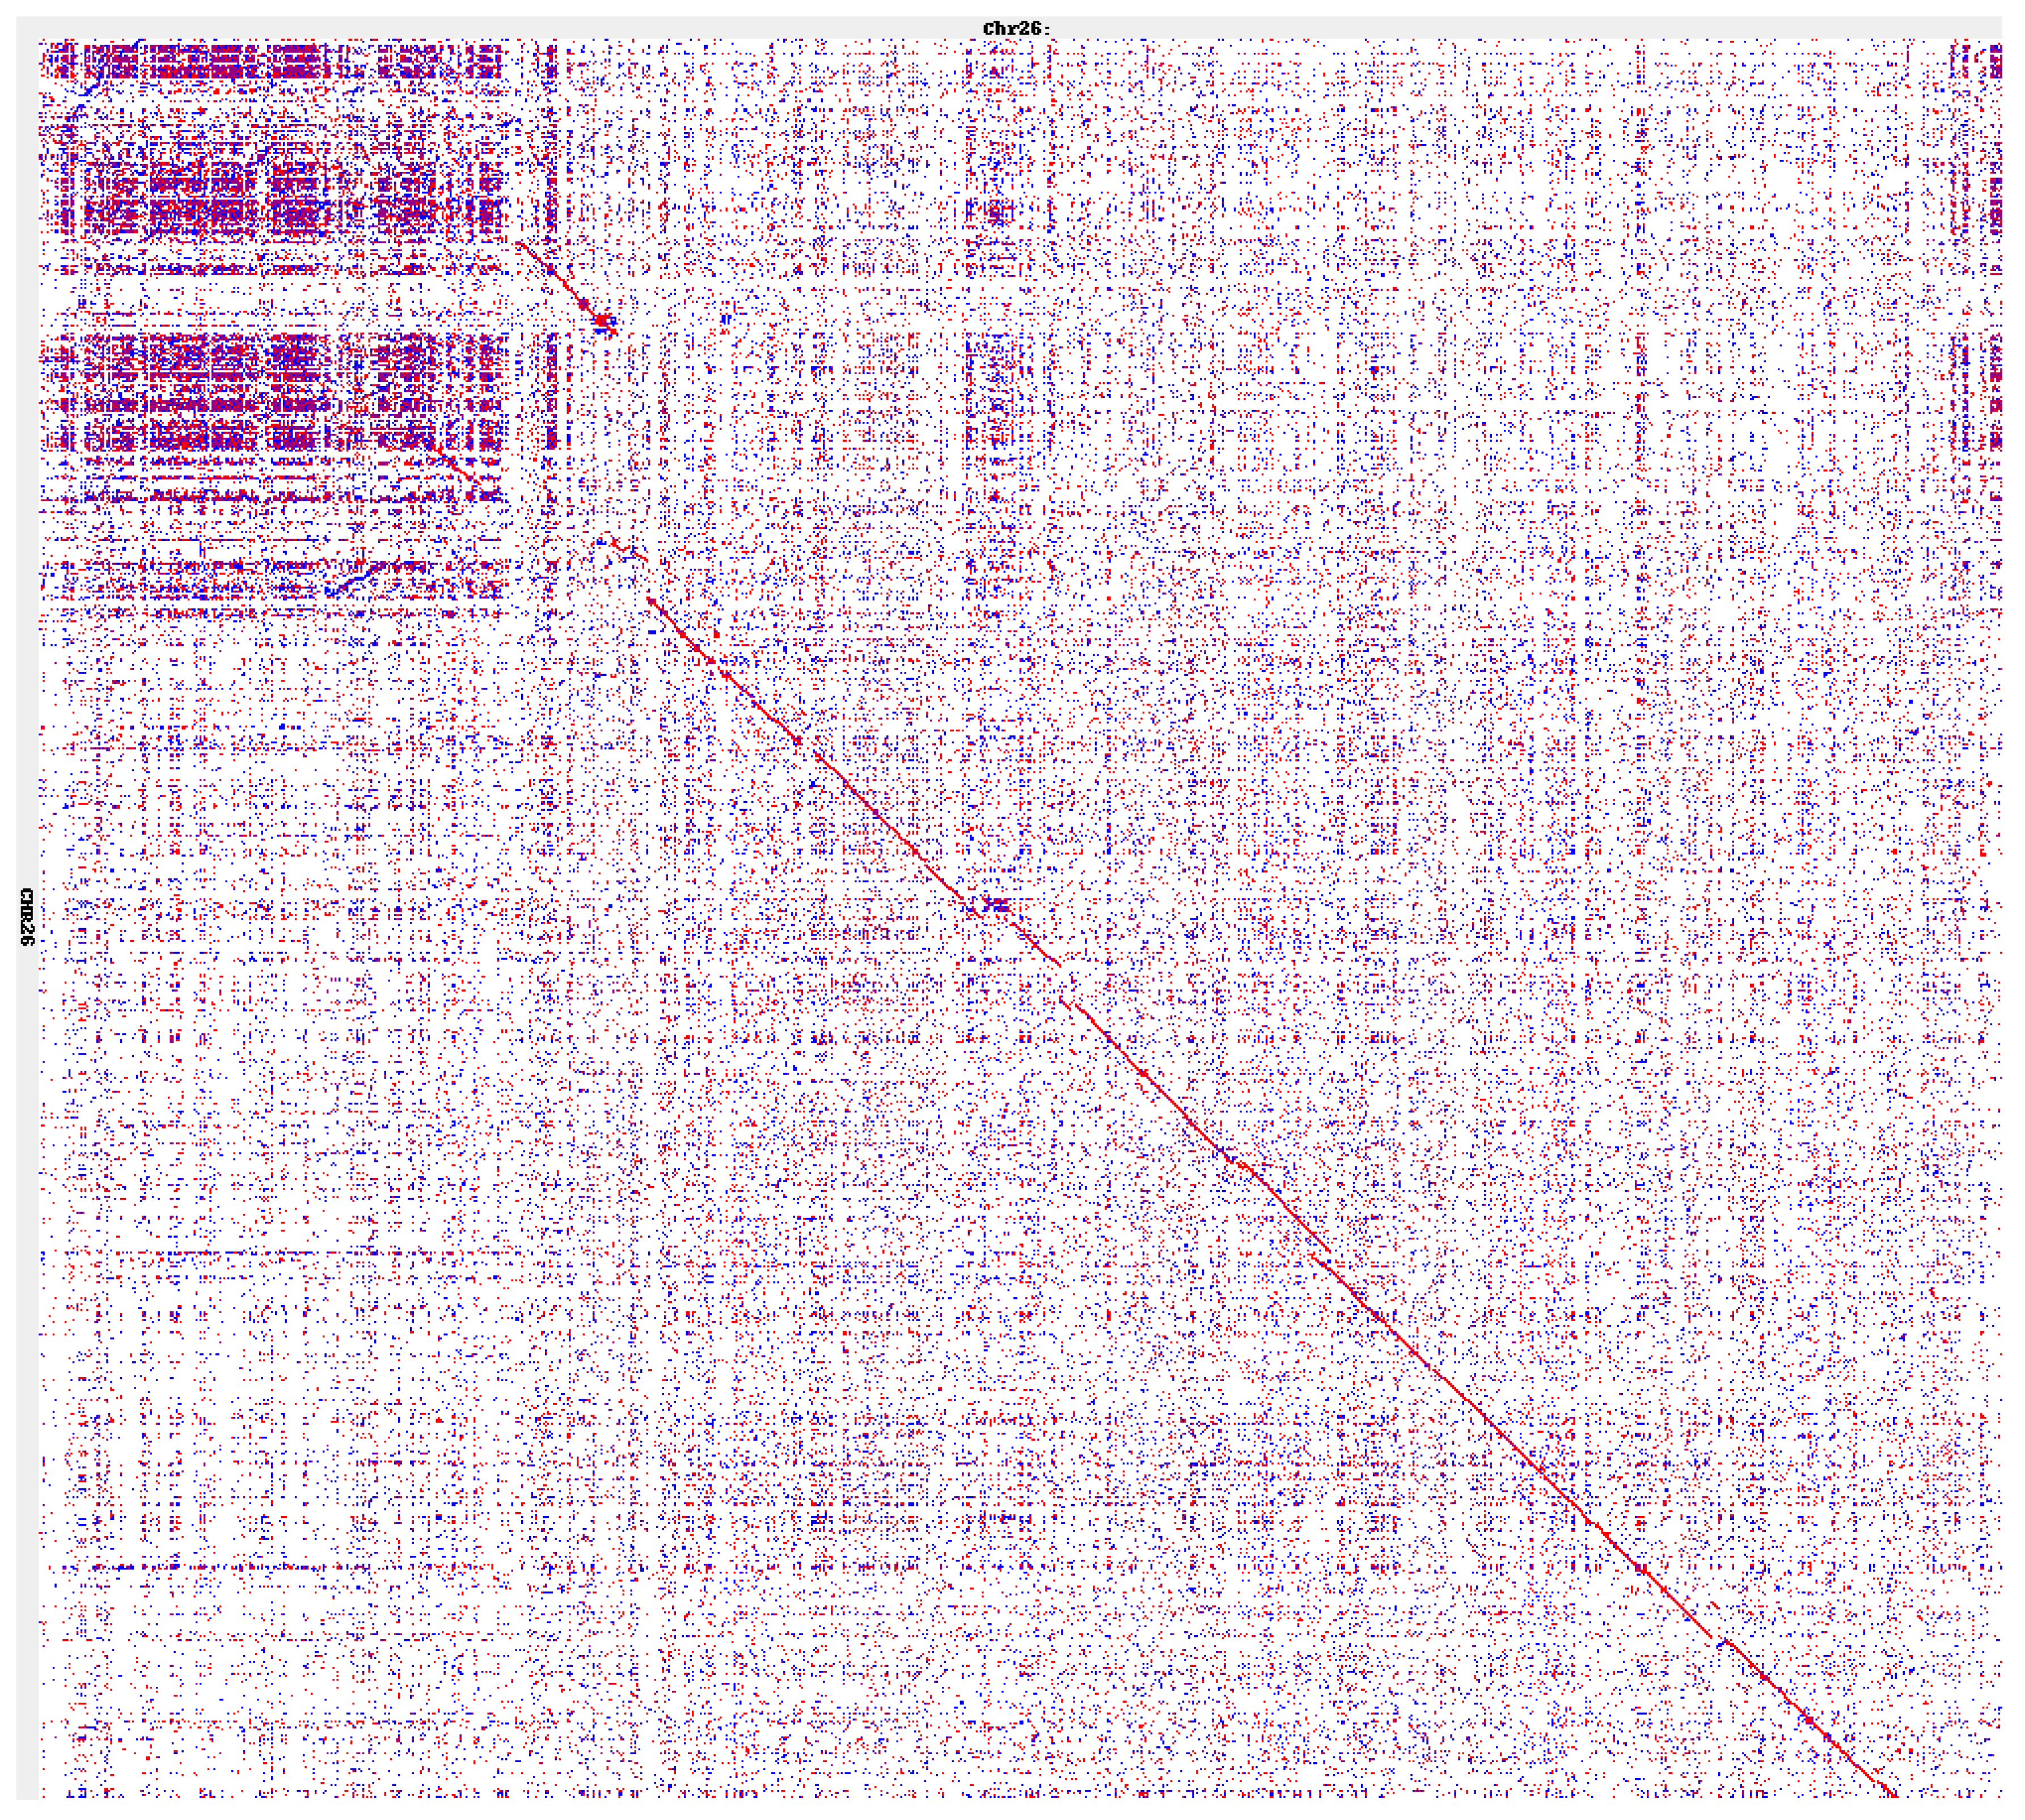
2.3. Genome Architecture of Actinidia Chromosome 26
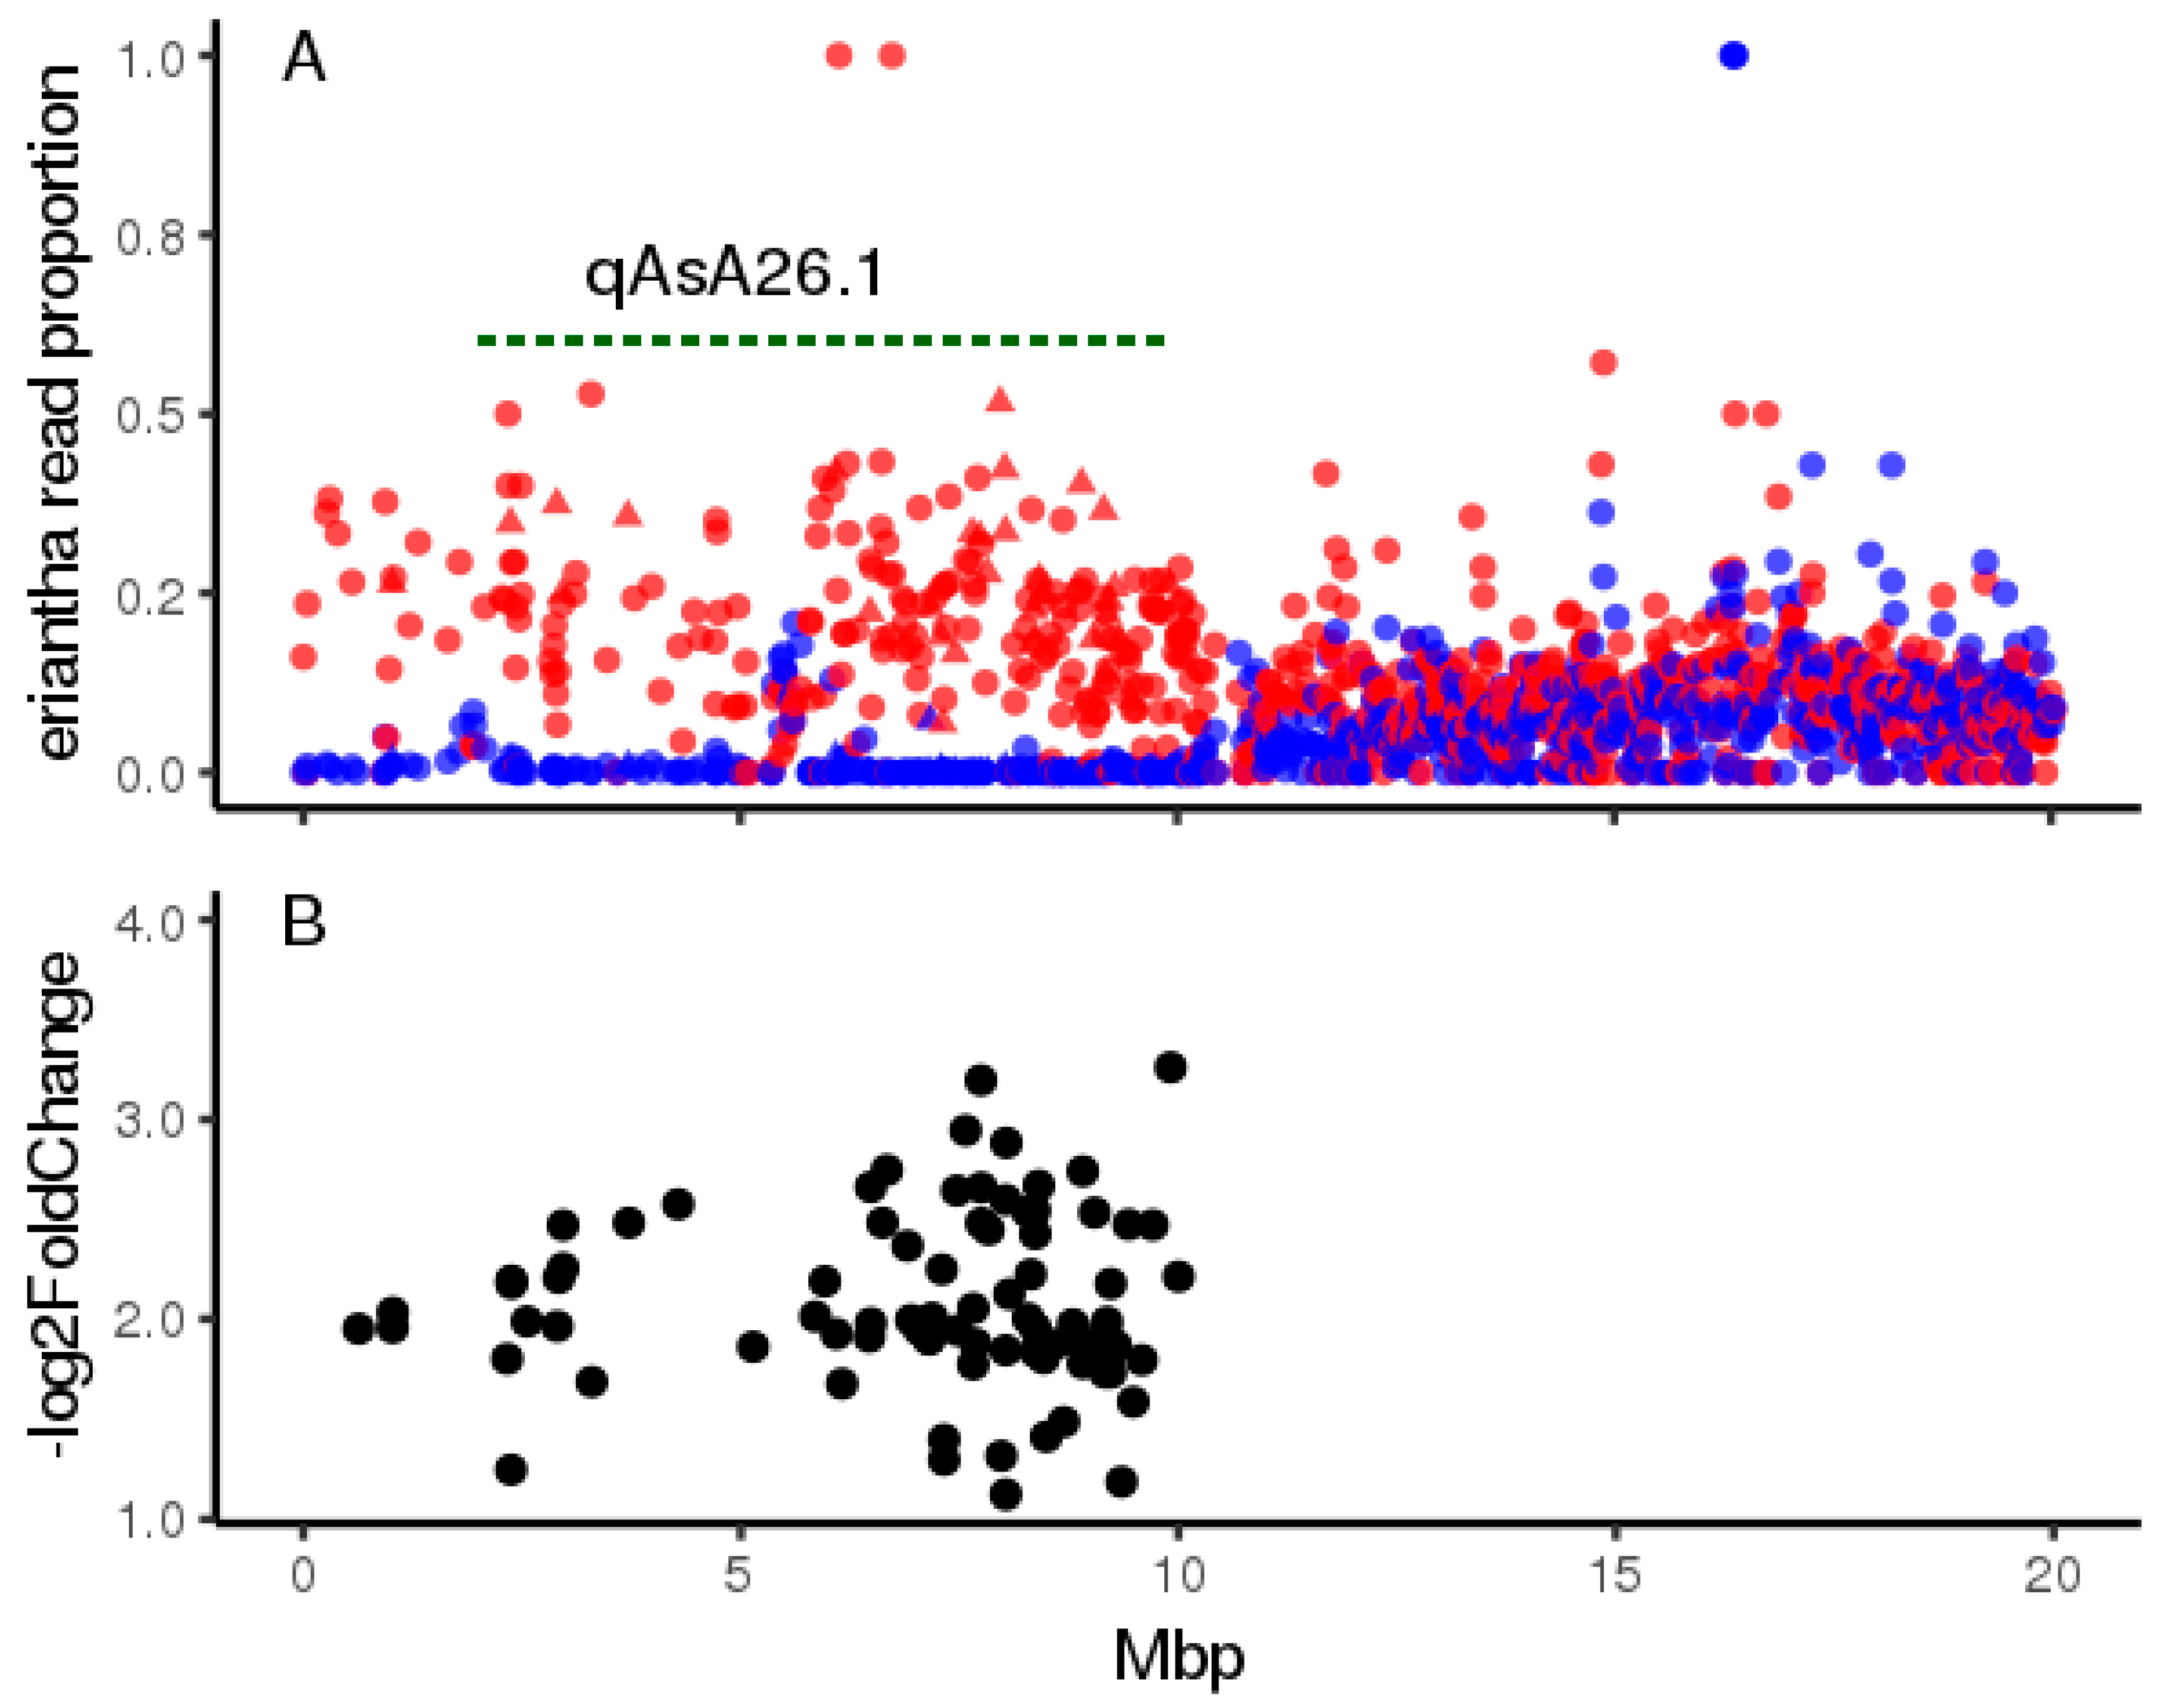
2.4. Characterising the qAsA26.1 Introgression in Leaf Tissues
2.4.1. Pooled RNASEQ
2.4.2. Untargetted Metabolomics
3. Discussion
4. Materials and Methods
4.1. Plant Materials and Phenotyping
4.1.1. Tetraploid Populations
4.1.2. Diploid Populations
4.1.3. Ascorbate Analyses
4.2. Pooled DNA Sequencing
4.2.1. Library Preparation
4.2.2. Sequencing Data Processing
4.2.3. Pooled GWAS and Variant Analysis
4.2.4. Chromosomal Analyses
4.2.5. PCR Marker Design for Validation
4.3. RNASEQ and Untargetted Metabolomic Analysis
4.3.1. Sample Collection and Processing
4.3.2. RNASEQ Read Assignment
4.3.3. RNASEQ Transcript Analysis
Supplementary Materials
Author Contributions
Funding
Acknowledgments
Conflicts of Interest
Appendix A

| Chr | Pos | Ref | Pool 1 Counts | Pool 1 B | Pool 2 Counts | Pool 2 B | Pool 3 Counts | Pool 3 B | Pool4 Counts | Pool 4 B | Padj | Odds Ratio | Gene Model |
|---|---|---|---|---|---|---|---|---|---|---|---|---|---|
| CHR26 | 703957 | A | 45:59:0:0:0:0 | 0.3 | 45:52:0:0:0:0 | 0.3 | 70:14:0:0:0:0 | 0.2 | 59:0:0:0:0:0 | 0 | 1.77 × 10⁻¹⁰ | 12.4 | |
| CHR26 | 703959 | T | 0:47:59:0:0:0 | 0.3 | 0:49:52:0:0:0 | 0.3 | 0:70:14:0:0:0 | 0.2 | 0:59:0:0:0:0 | 0 | 6.89 × 10⁻¹⁰ | 11.8 | |
| CHR26 | 703960 | T | 54:52:0:0:0:0 | 0.3 | 49:50:0:0:0:0 | 0.3 | 12:72:0:0:0:0 | 0.18 | 0:59:0:0:0:0 | 0 | 6.07 × 10⁻⁹ | 11.8 | |
| CHR26 | 703962 | T | 0:46:63:0:0:0 | 0.3 | 0:49:53:0:0:0 | 0.3 | 0:71:14:0:0:0 | 0.19 | 0:59:0:0:0:0 | 0 | 1.63 × 10⁻¹⁰ | 12.8 | |
| CHR26 | 704022 | G | 64:0:0:58:0:0 | 0.3 | 42:0:0:45:0:0 | 0.3 | 11:0:0:65:0:0 | 0.18 | 0:0:0:38:0:0 | 0 | 8.99 × 10⁻⁷ | 10.5 | |
| CHR26 | 704029 | T | 64:54:0:0:0:0 | 0.3 | 40:42:0:0:0:0 | 0.3 | 11:65:0:0:0:0 | 0.18 | 0:43:0:0:0:0 | 0 | 1.33 × 10⁻⁷ | 11.5 | |
| CHR26 | 955933 | T | 0:19:22:0:0:0 | 0.3 | 0:17:18:0:0:0 | 0.3 | 0:40:2:0:0:0 | 0.08 | 0:57:0:0:0:0 | 0 | 3.44 × 10⁻⁷ | 47.5 | Acc29265 |
| CHR26 | 2453803 | C | 0:14:20:0:0:0 | 0.29 | 0:20:19:0:0:0 | 0.3 | 0:0:50:0:0:0 | 0 | 0:0:44:0:0:0 | 0 | 2.13 × 10⁻⁶ | Inf | Acc29296 |
| CHR26 | 2453811 | A | 13:0:14:0:0:0 | 0.3 | 21:0:18:0:0:0 | 0.3 | 49:0:0:0:0:0 | 0 | 45:0:0:0:0:0 | 0 | 8.99 × 10⁻⁷ | Inf | |
| CHR26 | 3001514 | G | 19:0:0:12:0:0 | 0.29 | 15:0:0:10:0:0 | 0.29 | 0:0:0:34:0:0 | 0 | 0:0:0:27:0:0 | 0 | 5.0 × 10⁻⁶ | Inf | |
| CHR26 | 5096282 | A | 38:24:0:0:0:0 | 0.29 | 45:22:0:0:0:0 | 0.28 | 68:2:0:0:0:0 | 0.06 | 76:0:0:0:0:0 | 0 | 8.99 × 10⁻⁷ | 41.8 | Acc29359 |
| CHR26 | 5136827 | A | 80:0:0:35:0:0 | 0.27 | 69:0:0:36:0:0 | 0.28 | 82:0:0:8:0:0 | 0.13 | 104:0:0:0:0:0 | 0 | 2.72 × 10⁻⁶ | 10.2 | |
| CHR26 | 6431391 | A | 18:0:0:15:0:0 | 0.3 | 16:0:0:23:0:0 | 0.29 | 39:0:0:0:0:0 | 0 | 37:0:0:0:0:0 | 0 | 2.74 × 10⁻⁶ | Inf | |
| CHR26 | 6431400 | A | 17:0:0:13:0:0 | 0.3 | 12:0:0:23:0:0 | 0.28 | 37:0:0:0:0:0 | 0 | 41:0:0:0:0:0 | 0 | 5.39 × 10⁻⁷ | Inf | |
| CHR26 | 6432735 | G | 15:0:0:12:0:0 | 0.3 | 21:0:0:15:0:0 | 0.3 | 2:0:0:40:0:0 | 0.08 | 0:0:0:37:0:0 | 0 | 3.28 × 10⁻⁶ | 55.6 | |
| CHR26 | 6433469 | G | 33:0:0:32:0:0 | 0.3 | 21:0:0:49:0:0 | 0.27 | 2:0:0:48:0:0 | 0.07 | 0:0:0:74:0:0 | 0 | 1.19 × 10⁻⁶ | 44.1 | |
| CHR26 | 6516587 | C | 0:22:19:0:0:0 | 0.3 | 0:29:15:0:0:0 | 0.28 | 0:4:44:0:0:0 | 0.13 | 0:0:39:0:0:0 | 0 | 2.03 × 10⁻⁷ | 28.7 | |
| CHR26 | 7647158 | T | 0:12:13:0:0:0 | 0.3 | 0:19:18:0:0:0 | 0.3 | 0:43:0:0:0:0 | 0 | 0:45:0:0:0:0 | 0 | 1.69 × 10⁻⁶ | Inf | Acc29482 |
| CHR26 | 7647167 | T | 0:12:13:0:0:0 | 0.3 | 0:22:20:0:0:0 | 0.3 | 0:38:0:0:0:0 | 0 | 0:45:0:0:0:0 | 0 | 4.35 × 10⁻⁶ | Inf | Acc29482 |
| CHR26 | 8214875 | T | 0:39:0:0:0:0 | 0 | 0:37:6:0:0:0 | 0.18 | 0:16:21:0:0:0 | 0.3 | 0:18:30:0:0:0 | 0.29 | 4.92 × 10⁻⁶ | 19.4 | Acc29512 |
| CHR26 | 8414723 | C | 11:0:16:0:0:0 | 0.29 | 20:0:14:0:0:0 | 0.29 | 0:0:40:0:0:0 | 0 | 0:0:40:0:0:0 | 0 | 5.77 × 10⁻⁶ | Inf | Acc29527 |
| CHR26 | 8571426 | G | 20:0:0:12:0:0 | 0.29 | 17:0:0:14:0:0 | 0.3 | 0:0:0:34:0:0 | 0 | 0:0:0:33:0:0 | 0 | 1.73 × 10⁻⁶ | Inf | Acc29540 |
| CHR26 | 9081448 | G | 0:16:0:13:0:0 | 0.3 | 0:16:0:22:0:0 | 0.3 | 0:1:0:46:0:0 | 0.05 | 0:0:0:47:0:0 | 0 | 3.28 × 10⁻⁶ | 108.3 | |
| CHR26 | 9263130 | G | 18:0:0:18:0:0 | 0.3 | 14:0:0:18:0:0 | 0.3 | 39:0:0:0:0:0 | 0 | 35:0:0:0:0:0 | 0 | 4.2 × 10⁻⁶ | Inf | |
| CHR26 | 9436328 | A | 18:0:0:18:0:0 | 0.3 | 12:0:0:28:0:0 | 0.27 | 32:0:0:2:0:0 | 0.1 | 43:0:0:0:0:0 | 0 | 2.18 × 10⁻⁷ | 44.2 | Acc29619 |

Appendix B. Untargeted Metabolomics Analysis Methodology
Appendix B.1. LC-MS Data Acquisition
Appendix B.1.1. LCMS System
Appendix B.1.2. Aqueous Normal Phase Conditions
Appendix B.1.3. Reverse Phase Conditions
Appendix B.2. Data Processing
References
- Bulley, S.M.; Rassam, M.; Hoser, D.; Otto, W.; Schünemann, N.; Wright, M.; MacRae, E.; Gleave, A.; Laing, W. Gene expression studies in kiwifruit and gene over-expression in Arabidopsis indicates that GDP-L-galactose guanyltransferase is a major control point of vitamin C biosynthesis. J. Exp. Bot. 2009, 60, 765–778. [Google Scholar] [CrossRef] [PubMed]
- Jiang, Z.-Y.; Zhong, Y.; Zheng, J.; Ali, M.; Liu, G.-D.; Zheng, X.-L. L-ascorbic acid metabolism in an ascorbate-rich kiwifruit (Actinidia eriantha Benth.) cv. ‘White’ during postharvest. Plant Physiol. Biochem. 2018, 124, 20–28. [Google Scholar] [CrossRef] [PubMed]
- Tang, W.; Sun, X.; Yue, J.; Tang, X.; Jiao, C.; Yang, Y.; Niu, X.; Miao, M.; Zhang, D.; Huang, S.; et al. Chromosome-scale genome assembly of kiwifruit Actinidia eriantha with single-molecule sequencing and chromatin interaction mapping. Gigascience 2019, 8. [Google Scholar] [CrossRef] [PubMed]
- Pilkington, S.M.; Crowhurst, R.; Hilario, E.; Nardozza, S.; Fraser, L.; Peng, Y.; Gunaseelan, K.; Simpson, R.; Tahir, J.; Deroles, S.C.; et al. A manually annotated Actinidia chinensis var. chinensis (kiwifruit) genome highlights the challenges associated with draft genomes and gene prediction in plants. BMC Genom. 2018, 19, 257. [Google Scholar] [CrossRef] [PubMed]
- Huang, S.; Ding, J.; Deng, D.; Tang, W.; Sun, H.; Liu, D.; Zhang, L.; Niu, X.; Zhang, X.; Meng, M.; et al. Draft genome of the kiwifruit Actinidia chinensis. Nat. Commun. 2013, 4. [Google Scholar] [CrossRef]
- Bulley, S.M.; Laing, W. Ascorbic Acid-Related Genes. In Compendium of Plant Genomes; Springer International Publishing: Berlin/Heidelberg, Germany, 2016; pp. 163–177. [Google Scholar]
- Bulley, S.; Laing, W. The regulation of ascorbate biosynthesis. Curr. Opin. Plant Biol. 2016, 33, 15–22. [Google Scholar] [CrossRef]
- Bulley, S.; Wright, M.; Rommens, C.; Yan, H.; Rassam, M.; Lin-Wang, K.; Andre, C.; Brewster, D.; Karunairetnam, S.; Allan, A.C.; et al. Enhancing ascorbate in fruits and tubers through over-expression of the l-galactose pathway gene GDP-l-galactose phosphorylase. Plant Biotechnol. J. 2012, 10, 390–397. [Google Scholar] [CrossRef]
- Laing, W.A.; Martínez-Sánchez, M.; Wright, M.A.; Bulley, S.M.; Brewster, D.; Dare, A.P.; Rassam, M.; Wang, D.; Storey, R.; Macknight, R.C.; et al. An Upstream Open Reading Frame Is Essential for Feedback Regulation of Ascorbate Biosynthesis in Arabidopsis. Plant Cell 2015, 27, 772–786. [Google Scholar] [CrossRef]
- Mellidou, I.; Chagne, D.; Laing, W.A.; Keulemans, J.; Davey, M.W. Allelic Variation in Paralogs of GDP-l-Galactose Phosphorylase Is a Major Determinant of Vitamin C Concentrations in Apple Fruit. PLANT Physiol. 2012, 160, 1613–1629. [Google Scholar] [CrossRef]
- Truffault, V.; Gest, N.; Garchery, C.; Causse, M.; Duboscq, R.; Riqueau, G.; Sauvage, C.; Gautier, H.; Baldet, P.; Stevens, R. Variation in tomato fruit ascorbate levels and consequences of manipulation of ascorbate metabolism on drought stress tolerance. Acta Hortic. 2014, 75–84. [Google Scholar] [CrossRef]
- Kofler, R.; Pandey, R.V.; Schlotterer, C. PoPoolation2: Identifying differentiation between populations using sequencing of pooled DNA samples (Pool-Seq). Bioinformatics 2011, 27, 3435–3436. [Google Scholar] [CrossRef] [PubMed]
- Mansfeld, B.N.; Grumet, R. QTLseqr: An R Package for Bulk Segregant Analysis with Next-Generation Sequencing. Plant Genome 2018, 11. [Google Scholar] [CrossRef] [PubMed]
- Fraser, L.G.; Seal, A.G.; Montefiori, M.; McGhie, T.K.; Tsang, G.K.; Datson, P.M.; Hilario, E.; Marsh, H.E.; Dunn, J.K.; Hellens, R.P.; et al. An R2R3 MYB transcription factor determines red petal colour in an Actinidia (kiwifruit) hybrid population. BMC Genom. 2013, 14, 28. [Google Scholar] [CrossRef] [PubMed]
- Tahir, J.; Gardiner, S.E.; Hoyte, S.; Bassett, H.; Brendolise, C.; Chatterjee, A.; Templeton, K.; Deng, C.; Crowhurst, R.; Montefiori, M.; et al. Multiple quantitative trait loci contribute tolerance to bacterial canker incited by Pseudomonas syringae pv. actinidiae in kiwifruit (Actinidia chinensis). BioRxiv 2019. [Google Scholar] [CrossRef]
- Zhang, L.; Li, Z.; Wang, Y.; Jiang, Z.; Wang, S.; Huang, H. Vitamin C flower color and ploidy variation of hybrids from a ploidy-unbalanced Actinidia interspecific cross and SSR characterization. Euphytica 2010, 175, 133–143. [Google Scholar] [CrossRef]
- Page, J.T.; Gingle, A.R.; Udall, J.A. PolyCat: A resource for genome categorization of sequencing reads from allopolyploid organisms. G3 (Bethesda) 2013, 3, 517–525. [Google Scholar] [CrossRef] [PubMed]
- Bonin, C.P.; Reiter, W.-D. A bifunctional epimerase-reductase acts downstream of the MUR1 gene product and completes the de novo synthesis of GDP-l-fucose in Arabidopsis. Plant J. 2000, 21, 445–454. [Google Scholar] [CrossRef] [PubMed]
- Jadid, N.; Mialoundama, A.S.; Heintz, D.; Ayoub, D.; Erhardt, M.; Mutterer, J.; Meyer, D.; Alioua, A.; Dorsselaer, A.V.; Rahier, A.; et al. Dolichol Phosphate Mannose Synthase1 Mediates the Biogenesis of Isoprenyl-Linked Glycans and Influences Development Stress Response, and Ammonium Hypersensitivity in Arabidopsis. Plant Cell 2011, 23, 1985–2005. [Google Scholar] [CrossRef]
- Rigano, M.M.; Lionetti, V.; Raiola, A.; Bellincampi, D.; Barone, A. Pectic enzymes as potential enhancers of ascorbic acid production through the d-galacturonate pathway in Solanaceae. Plant Sci. 2018, 266, 55–63. [Google Scholar] [CrossRef] [PubMed]
- Gao, C.; Ju, Z.; Li, S.; Zuo, J.; Fu, D.; Tian, H.; Luo, Y.; Zhu, B. Deciphering Ascorbic Acid Regulatory Pathways in Ripening Tomato Fruit Using a Weighted Gene Correlation Network Analysis Approach. J. Integr. Plant Biol. 2013, 55, 1080–1091. [Google Scholar] [CrossRef]
- Page, M.; Sultana, N.; Paszkiewicz, K.; Florance, H.; Smirnoff, N. The influence of ascorbate on anthocyanin accumulation during high light acclimation in Arabidopsis thaliana: Further evidence for redox control of anthocyanin synthesis. Plant Cell Environ. 2012, 35, 388–404. [Google Scholar] [CrossRef] [PubMed]
- Scortichini, M.; Marcelletti, S.; Ferrante, P.; Petriccione, M.; Firrao, G. Pseudomonas syringae pv. actinidiae: A re-emerging, multi-faceted, pandemic pathogen. Mol. Plant Pathol. 2012, 13, 631–640. [Google Scholar] [PubMed]
- Zhang, H.; Yi, H.; Wu, M.; Zhang, Y.; Zhang, X.; Li, M.; Wang, G. Mapping the Flavor Contributing Traits on Fengwei Melon (Cucumis melo L.) Chromosomes Using Parent Resequencing and Super Bulked-Segregant Analysis. PLoS ONE 2016, 11, e0148150. [Google Scholar] [CrossRef] [PubMed]
- Wei, Q.-Z.; Fu, W.-Y.; Wang, Y.-Z.; Qin, X.-D.; Wang, J.; Li, J.; Lou, Q.-F.; Chen, J.-F. Rapid identification of fruit length loci in cucumber (Cucumis sativus L.) using next-generation sequencing (NGS)-based QTL analysis. Sci. Rep. 2016, 6. [Google Scholar] [CrossRef] [PubMed]
- Love, M.I.; Soneson, C.; Patro, R. Swimming downstream: Statistical analysis of differential transcript usage following Salmon quantification. F1000Research 2018, 7, 952. [Google Scholar] [CrossRef] [PubMed]
- Davey, M.W. Genetic Control of Fruit Vitamin C Contents. PLANT Physiol. 2006, 142, 343–351. [Google Scholar] [CrossRef]
- Stevens, R.; Buret, M.; Duffe, P.; Garchery, C.; Baldet, P.; Rothan, C.; Causse, M. Candidate Genes and Quantitative Trait Loci Affecting Fruit Ascorbic Acid Content in Three Tomato Populations. PLANT Physiol. 2007, 143, 1943–1953. [Google Scholar] [CrossRef] [PubMed]
- Thompson, M.J.; Jiggins, C.D. Supergenes and their role in evolution. Heredity 2014, 113, 1–8. [Google Scholar] [CrossRef]
- Schwander, T.; Libbrecht, R.; Keller, L. Supergenes and Complex Phenotypes. Curr. Biol. 2014, 24, R288–R294. [Google Scholar] [CrossRef]
- Pilkington, S.M.; Tahir, J.; Hilario, E.; Gardiner, S.E.; Chagné, D.; Catanach, A.; McCallum, J.; Jesson, L.; Fraser, L.G.; McNeilage, M.A.; et al. Genetic and cytological analyses reveal the recombination landscape of a partially differentiated plant sex chromosome in kiwifruit. BMC Plant Biol. 2019, 19, 172. [Google Scholar] [CrossRef]
- Ferguson, A.R. Botanical Description. In Compendium of Plant Genomes; Springer International Publishing: Berlin/Heidelberg, Germany, 2016; pp. 1–13. [Google Scholar]
- Gest, N.; Gautier, H.; Stevens, R. Ascorbate as seen through plant evolution: The rise of a successful molecule? J. Exp. Bot. 2012, 64, 33–53. [Google Scholar] [CrossRef] [PubMed]
- Nijhout, H.F. Developmental Perspectives on Evolution of Butterfly Mimicry. BioScience 1994, 44, 148–157. [Google Scholar] [CrossRef]
- Locato, V.; Cimini, S.; Gara, L.D. Strategies to increase vitamin C in plants: From plant defense perspective to food biofortification. Front. Plant Sci. 2013, 4. [Google Scholar] [CrossRef] [PubMed]
- Macknight, R.C.; Laing, W.A.; Bulley, S.M.; Broad, R.C.; Johnson, A.A.T.; Hellens, R.P. Increasing ascorbate levels in crops to enhance human nutrition and plant abiotic stress tolerance. Curr. Opin. Biotechnol. 2017, 44, 153–160. [Google Scholar] [CrossRef] [PubMed]
- Dellaporta, S. Plant DNA Miniprep and Microprep: Versions 2.12.3. In The Maize Handbook; Springer: New York, NY, USA, 1994; pp. 522–525. [Google Scholar]
- Yao, X.; Tang, P.; Li, Z.; Li, D.; Liu, Y.; Huang, H. The First Complete Chloroplast Genome Sequences in Actinidiaceae: Genome Structure and Comparative Analysis. PLoS ONE 2015, 10, e0129347. [Google Scholar] [CrossRef] [PubMed]
- Auwera, G.A.; Van der Carneiro, M.O.; Hartl, C.; Poplin, R.; Del Angel, G.; Levy-Moonshine, A.; Jordan, T.; Shakir, K.; Roazen, D.; Thibault, J.; et al. From FastQ data to high-confidence variant calls: The genome analysis toolkit best practices pipeline. Curr. Protoc. Bioinform. 2013, 11.10.1–11.10.33. [Google Scholar] [CrossRef]
- Li, H.; Durbin, R. Fast and accurate short read alignment with Burrows-Wheeler transform. Bioinformatics 2009, 25, 1754–1760. [Google Scholar] [CrossRef] [PubMed]
- Crowhurst, R.; Liu, Y.; Scaglione, D. The Kiwifruit Genome. In The Kiwifruit Genome; Springer International: Berlin/Heidelberg, Germany, 2016; pp. 101–114. [Google Scholar]
- Li, H.; Handsaker, B.; Wysoker, A.; Fennell, T.; Ruan, J.; Homer, N.; Marth, G.; Abecasis, G.; Durbin, R. The Sequence Alignment/Map format and SAMtools. Bioinformatics 2009, 25, 2078–2079. [Google Scholar] [CrossRef] [PubMed]
- Takagi, H.; Abe, A.; Yoshida, K.; Kosugi, S.; Natsume, S.; Mitsuoka, C.; Uemura, A.; Utsushi, H.; Tamiru, M.; Takuno, S.; et al. QTL-seq: Rapid mapping of quantitative trait loci in rice by whole genome resequencing of DNA from two bulked populations. Plant J. 2013, 74, 174–183. [Google Scholar] [CrossRef] [PubMed]
- Page, J.T.; Liechty, Z.S.; Huynh, M.D.; Udall, J.A. BamBam: Genome sequence analysis tools for biologists. BMC Res. Notes 2014, 7, 829. [Google Scholar] [CrossRef]
- Benjamini, Y.; Hochberg, Y. Multiple Hypotheses Testing with Weights. Scand. J. Stat. 1997, 24, 407–418. [Google Scholar] [CrossRef]
- Koboldt, D.C.; Zhang, Q.; Larson, D.E.; Shen, D.; McLellan, M.D.; Lin, L.; Miller, C.A.; Mardis, E.R.; Ding, L.; Wilson, R.K. VarScan 2: Somatic mutation and copy number alteration discovery in cancer by exome sequencing. Genome Res. 2012, 22, 568–576. [Google Scholar] [CrossRef] [PubMed]
- Kielbasa, S.M.; Wan, R.; Sato, K.; Horton, P.; Frith, M.C. Adaptive seeds tame genomic sequence comparison. Genome Res. 2011, 21, 487–493. [Google Scholar] [CrossRef] [PubMed]
- Morgulis, A.; Gertz, E.M.; Schaffer, A.A.; Agarwala, R. WindowMasker: Window-based masker for sequenced genomes. Bioinformatics 2005, 22, 134–141. [Google Scholar] [CrossRef] [PubMed]
- Ellinghaus, D.; Kurtz, S.; Willhoeft, U. LTRharvest an efficient and flexible software for de novo detection of LTR retrotransposons. BMC Bioinform. 2008, 9, 18. [Google Scholar] [CrossRef]
- Baldwin, S.; Revanna, R.; Thomson, S.; Pither-Joyce, M.; Wright, K.; Crowhurst, R.; Fiers, M.; Chen, L.; Macknight, R.; McCallum, J.A. A Toolkit for bulk PCR-based marker design from next-generation sequence data: Application for development of a framework linkage map in bulb onion (Allium cepa L.). BMC Genom. 2012, 13, 637. [Google Scholar] [CrossRef] [PubMed]
- Kopylova, E.; Noé, L.; Touzet, H. SortMeRNA: Fast and accurate filtering of ribosomal RNAs in metatranscriptomic data. Bioinformatics 2012, 28, 3211–3217. [Google Scholar] [CrossRef]
- Bolger, A.M.; Lohse, M.; Usadel, B. Trimmomatic: A flexible trimmer for Illumina sequence data. Bioinformatics 2014, 30, 2114–2120. [Google Scholar] [CrossRef]
- Kim, D.; Langmead, B.; Salzberg, S.L. HISAT: A fast spliced aligner with low memory requirements. Nat. Methods 2015, 12, 357–360. [Google Scholar] [CrossRef]
- Haas, B.J.; Papanicolaou, A.; Yassour, M.; Grabherr, M.; Blood, P.D.; Bowden, J.; Couger, M.B.; Eccles, D.; Li, B.; Lieber, M.; et al. De novo transcript sequence reconstruction from RNA-seq using the Trinity platform for reference generation and analysis. Nat. Protoc. 2013, 8, 1494–1512. [Google Scholar] [CrossRef]
- Li, B.; Dewey, C.N. RSEM: Accurate transcript quantification from RNA-Seq data with or without a reference genome. BMC Bioinform. 2011, 12. [Google Scholar] [CrossRef] [PubMed]
- Love, M.I.; Huber, W.; Anders, S. Moderated estimation of fold change and dispersion for RNA-seq data with DESeq2. Genome Biol. 2014, 15. [Google Scholar] [CrossRef] [PubMed]
- Wu, T.D.; Watanabe, C.K. GMAP: A genomic mapping and alignment program for mRNA and EST sequences. Bioinformatics 2005, 21, 1859–1875. [Google Scholar] [CrossRef] [PubMed]
- Quinlan, A.R. BEDTools: The Swiss-Army Tool for Genome Feature Analysis. Curr. Protoc. Bioinform. 2014, 47, 11.12.1–11.12.34. [Google Scholar] [CrossRef] [PubMed]
- Kanehisa, M.; Sato, Y.; Morishima, K. BlastKOALA and GhostKOALA: KEGG Tools for Functional Characterization of Genome and Metagenome Sequences. J. Mol. Biol 2016, 428, 726–731. [Google Scholar] [CrossRef] [PubMed]
- Ewens, W.J. The sampling theory of selectively neutral alleles. Theor. Popul. Biol. 1972, 3, 87–112. [Google Scholar] [CrossRef]


| Contig | Log2Fold Change | Adjusted p-Value | Normalised Read Count High Pool Rep 1 | Normalised Read Count High Pool Rep 2 | Normalised Read Count High Pool Rep 3 | Normalised Read Count Low Pool Rep 1 | Normalised Read Count Low Pool Rep 2 | Normalised Read Count Low Pool Rep 3 | Chromosome | Gene Model | Annotation |
|---|---|---|---|---|---|---|---|---|---|---|---|
| TRINITY_DN125630_c0_g2_i1 | −1.6 | 0.0 | 197.71 | 344.66 | 225.3 | 70.25 | 67.17 | 76.34 | CHR3 | Acc2955.1 | Laccase-7, Precursor (putative) |
| TRINITY_DN125630_c0_g5_i2 | −1.5 | 0.0 | 260.83 | 333.18 | 217.43 | 74.26 | 103.72 | 69.07 | CHR3 | Acc2955.1 | Laccase-7, Precursor (putative) |
| TRINITY_DN125630_c0_g5_i3 | −1.33 | 0.01 | 162.44 | 199.49 | 172.18 | 49.17 | 76.06 | 59.08 | CHR3 | Acc2955.1 | Laccase-7, Precursor (putative) |
| TRINITY_DN129828_c1_g5_i5 | 1.77 | 0.02 | 25.06 | 4.18 | 8.85 | 65.23 | 70.14 | 117.24 | CHR3 | Acc3372.1 | T-complex protein 1 subunit epsilon (TCP-1-epsilon) (putative) |
| TRINITY_DN118492_c0_g1_i4 | 1.87 | 0.0 | 14.85 | 83.55 | 42.31 | 334.19 | 309.19 | 179.05 | CHR3 | Acc3845.1 | Probable beta-glucosidase btgE, Precursor |
| TRINITY_DN118884_c0_g7_i1 | 1.87 | 0.01 | 1.86 | 12.53 | 10.82 | 90.32 | 50.38 | 55.44 | CHR3 | Acc3860.1 | Cytochrome c1 2, heme protein, mitochondrial (Cytochrome c-1 2), Precursor (putative) |
| TRINITY_DN129466_c0_g6_i6 | 2.12 | 1.86 × 10⁻⁵ | 45.48 | 250.66 | 124.95 | 1171.16 | 1034.26 | 664.38 | CHR3 | Acc3864.1 | Magnesium-protoporphyrin IX monomethyl ester (oxidative) cyclase, chloroplastic (Mg) |
| TRINITY_DN117715_c1_g3_i1 | 1.43 | 0.02 | 174.51 | 378.09 | 266.63 | 1407.0 | 832.74 | 500.78 | CHR3 | Acc3890.1 | Tubulin beta-4 chain |
| TRINITY_DN129466_c0_g6_i3 | 1.9 | 0.0 | 65.9 | 237.09 | 94.45 | 1040.7 | 832.74 | 370.82 | CHR5 | Acc5209.1 | Magnesium-protoporphyrin IX monomethyl ester (oxidative) cyclase, chloroplastic (Mg) |
| TRINITY_DN102173_c0_g2_i1 | 1.79 | 0.01 | 36.2 | 22.98 | 25.58 | 350.24 | 108.66 | 65.44 | CHR6 | Acc12049.1 | Polyadenylate-binding protein 8 (PABP-8) (putative) |
| TRINITY_DN129080_c0_g2_i1 | −1.17 | 0.04 | 426.98 | 416.73 | 234.16 | 141.5 | 148.17 | 139.06 | CHR8 | Acc9639.1 | Anthocyanidin reductase ((2S)-flavan-3-ol-forming) (VvANR) (putative) |
| TRINITY_DN121164_c0_g1_i4 | −1.56 | 0.01 | 297.03 | 318.55 | 188.9 | 65.23 | 37.54 | 108.15 | CHR9 | Acc10699.1 | Germin-like protein 5-1, Precursor (putative) |
| TRINITY_DN130940_c2_g1_i1 | −2.87 | 9.73 × 10⁻⁹ | 125.31 | 80.42 | 61.0 | 5.02 | 5.93 | 1.82 | CHR12 | Acc29528.1 | Mitochondrial import inner membrane translocase subunit TIM17-2 (similar to) |
| TRINITY_DN126502_c0_g1_i1 | 2.33 | 1.86 × 10⁻⁵ | 4.64 | 27.16 | 30.5 | 159.57 | 401.06 | 134.51 | CHR13 | Acc14777.1 | Calcium uniporter protein 6, mitochondrial, Precursor (similar to) |
| TRINITY_DN123616_c1_g1_i1 | −2.33 | 8.05 × 10⁻⁶ | 73.33 | 69.98 | 72.81 | 3.01 | 9.88 | 8.18 | CHR16 | Acc18424.1 | CUB and EGF-like domain-containing protein 1 |
| TRINITY_DN126733_c0_g1_i7 | −1.12 | 0.03 | 325.8 | 245.44 | 301.06 | 122.44 | 97.79 | 144.51 | CHR18 | Acc20147.1 | Zinc finger protein CONSTANS-LIKE 5 (probable) |
| TRINITY_DN123292_c0_g2_i2 | −1.65 | 0.0 | 270.11 | 115.93 | 124.95 | 37.13 | 37.54 | 47.26 | CHR18 | Acc20170.1 | Putative GDP-L-fucose synthase 2 (AtGER2) |
| TRINITY_DN116626_c0_g2_i1 | −1.78 | 0.04 | 44.55 | 27.16 | 7.87 | 0 | 0 | 0 | CHR25 | Acc28491.1 | L10-interacting MYB domain-containing protein (probable) |
| TRINITY_DN122105_c0_g1_i1 | −1.37 | 0.01 | 187.5 | 146.22 | 121.01 | 57.2 | 46.43 | 45.44 | CHR25 | Acc28707.1 | Ubiquinol oxidase 1a, mitochondrial, Precursor (putative) |
| TRINITY_DN126144_c0_g3_i6 | −1.83 | 0.02 | 34.34 | 17.76 | 15.74 | 0 | 0 | 0 | CHR25 | Acc29051.1 | COBW domain-containing protein 1 (COBP) (probable) |
| TRINITY_DN117186_c0_g2_i2 | −1.82 | 0.02 | 65.9 | 38.64 | 38.37 | 10.04 | 4.94 | 1.82 | CHR25 | Acc29489.1 | UPF0162 protein PD_0709 (probable) |
| TRINITY_DN128356_c0_g1_i6 | −1.47 | 0.02 | 107.67 | 206.8 | 122.98 | 53.19 | 39.51 | 30.9 | CHR25 | Acc29080.1 | Pectin acetylesterase 8, Precursor (putative) |
| TRINITY_DN113632_c0_g1_i1 | −1.44 | 0.03 | 451.11 | 1051.75 | 476.19 | 107.38 | 263.75 | 209.04 | CHR25 | Acc12497.1 | BURP domain protein RD22, Precursor (similar to) |
| TRINITY_DN130185_c0_g1_i4 | −2.3 | 2.26 × 10⁻⁵ | 47.34 | 67.89 | 82.64 | 4.01 | 8.89 | 5.45 | CHR29 | Acc33009.1 | CRM-domain containing factor CFM3, chloroplastic/mitochondrial (ZmCFM3), Precursor |
| Column | RT (min) | Putative Candidate(s) | Molecular Weight | Formula | Group Area: Eriantha Allele (+) | Group Area: Eriantha Allele (−) | Ratio: +/− | Log2Fold Change | p-Value |
|---|---|---|---|---|---|---|---|---|---|
| C18 | 3.37 | 312.09 | C14 H16 O8 | 7738.38 | 3601.05 | 2.15 | 1.1 | 0.0 | |
| C18 | 3.1 | caffeoyl quinide | 336.08 | C16 H16 O8 | 3969.41 | 1585.49 | 2.5 | 1.32 | 0.01 |
| C18 | 1.09 | 338.06 | C15 H14 O9 | 4282.86 | 2079.64 | 2.06 | 1.04 | 0.0 | |
| C18 | 2.85 | 366.13 | C13 H22 N2 O10 | 3257.78 | 1545.54 | 2.11 | 1.08 | 0.02 | |
| C18 | 4.59 | carbohydrate derivative | 416.21 | C21 H28 N4 O5 | 90,832.77 | 16,046.98 | 5.66 | 2.5 | 0.01 |
| C18 | 4.48 | carbohydrate derivative | 417.09 | C13 H21 N7 O3 P2 S | 3259.7 | 781.94 | 4.17 | 2.06 | 0.0 |
| C18 | 4.76 | carbohydrate derivative | 430.22 | C22 H30 N4 O5 | 121,431.57 | 44,149.79 | 2.75 | 1.46 | 0.01 |
| C18 | 4.59 | carbohydrate derivative | 430.22 | C22 H30 N4 O5 | 13,720.41 | 5974.26 | 2.3 | 1.2 | 0.04 |
| C18 | 4.08 | 436.19 | C19 H28 N6 O4 S | 4271.37 | 1198.71 | 3.56 | 1.83 | 0.01 | |
| C18 | 4.93 | Kaempferol-3-O-glucoside | 448.1 | C21 H20 O11 | 52,765.53 | 8300.52 | 6.36 | 2.67 | 0.0 |
| C18 | 4.35 | carbohydrate derivative | 456.19 | C19 H28 N4 O9 | 2884.91 | 1385.24 | 2.08 | 1.06 | 0.03 |
| C18 | 3.49 | spermidine derivative | 456.2 | C17 H29 N8 O5 P | 7872.29 | 2542.55 | 3.1 | 1.63 | 0.01 |
| C18 | 4.59 | carbohydrate derivative | 476.23 | C19 H28 N10 O5 | 9879.76 | 4216.6 | 2.34 | 1.23 | 0.02 |
| C18 | 4.76 | carbohydrate derivative | 476.23 | C16 H37 N4 O10 P | 100,274.28 | 36,739.65 | 2.73 | 1.45 | 0.01 |
| C18 | 4.99 | Isorhamnetin 3-galactoside | 478.11 | C22 H22 O12 | 46,274.3 | 2049.91 | 22.57 | 4.5 | 0.04 |
| C18 | 3.49 | Fatty acid like | 491.24 | C23 H33 N5 O7 | 12,980.96 | 3197.7 | 4.06 | 2.02 | 0.02 |
| C18 | 3.55 | organic acid | 498.21 | C23 H36 N2 O6 P2 | 11,612.98 | 4222.33 | 2.75 | 1.46 | 0.0 |
| C18 | 4.37 | carbohydrate derivative | 516.15 | C23 H24 N4 O10 | 13,026.27 | 3798.38 | 3.43 | 1.78 | 0.02 |
| C18 | 3.85 | 531.22 | C25 H44 N O3 P3 S | 4708.15 | 1379.95 | 3.41 | 1.77 | 0.0 | |
| C18 | 3.82 | Quercetin-carbohydrate derivative | 549.23 | C21 H32 N11 O5 P | 51,922.7 | 13,083.19 | 3.97 | 1.99 | 0.01 |
| C18 | 5.09 | glutathione derivative | 549.24 | C24 H37 N7 O4 P2 | 22,422.9 | 6422.03 | 3.49 | 1.8 | 0.02 |
| C18 | 4.12 | 561.23 | C20 H37 N9 O6 P2 | 8968.49 | 2888.64 | 3.11 | 1.63 | 0.03 | |
| C18 | 3.91 | 565.13 | C28 H30 N3 O2 P3 S | 3647.66 | 1762.66 | 2.07 | 1.05 | 0.0 | |
| C18 | 3.06 | 581.17 | C27 H27 N5 O10 | 3067.62 | 774.45 | 3.96 | 1.99 | 0.01 | |
| C18 | 3.96 | organic acid | 586.23 | C27 H35 N6 O7 P | 6628.24 | 1273.95 | 5.2 | 2.38 | 0.03 |
| C18 | 4.65 | Luteolin-like | 742.38 | C36 H57 N8 O3 P3 | 40,140.01 | 18,953.97 | 2.12 | 1.08 | 0.03 |
| C18 | 4.33 | glucose derivative | 760.39 | C38 H56 N4 O12 | 11,611.09 | 4014.93 | 2.89 | 1.53 | 0.05 |
| C18 | 3.16 | 771.31 | C28 H60 N3 O13 P3 S | 20,076.74 | 9413.9 | 2.13 | 1.09 | 0.01 | |
| Helic | 1.09 | Organic acid derivative | 145.95 | 303,336.81 | 106,554.16 | 2.85 | 1.51 | 0.02 | |
| Helic | 1.64 | carbohydrate derivative | 192.08 | C11 H12 O3 | 47,978.16 | 20,483.51 | 2.34 | 1.23 | 5.34 × 10⁻⁶ |
| Helic | 1.34 | glycosylated phenylpropanoid | 222.09 | C12 H14 O4 | 33,395.63 | 11,436.95 | 2.92 | 1.55 | 0.02 |
| Helic | 3.54 | 241.98 | C4 H9 N2 O4 P3 | 51,090.99 | 21,734.49 | 2.35 | 1.23 | 0.04 | |
| Helic | 3.53 | 247.97 | C5 H12 O3 S4 | 29,426.88 | 4357.26 | 6.75 | 2.76 | 0.01 | |
| Helic | 1.34 | 266.08 | C13 H14 O6 | 26,764.49 | 10,639.77 | 2.52 | 1.33 | 0.03 | |
| Helic | 5.9 | coumaric acid deriv | 282.07 | C13 H14 O7 | 9,722,985.89 | 4,295,374.34 | 2.26 | 1.18 | 0.05 |
| Helic | 2.0 | coumarin glycoside | 324.08 | C16 H12 N4 O4 | 37,094.1 | 12,640.85 | 2.93 | 1.55 | 1.97 × 10⁻⁵ |
| Helic | 6.99 | 449.04 | C21 H12 N3 O7 P | 8,334,381.62 | 2,709,273.63 | 3.08 | 1.62 | 0.05 | |
| Helic | 6.21 | 534.16 | C21 H31 N2 O12 P | 3488.47 | 1650.29 | 2.11 | 1.08 | 0.04 | |
| Helic | 3.35 | 549.13 | C24 H28 N3 O8 P S | 13,522.12 | 4106.46 | 3.29 | 1.72 | 0.0 |
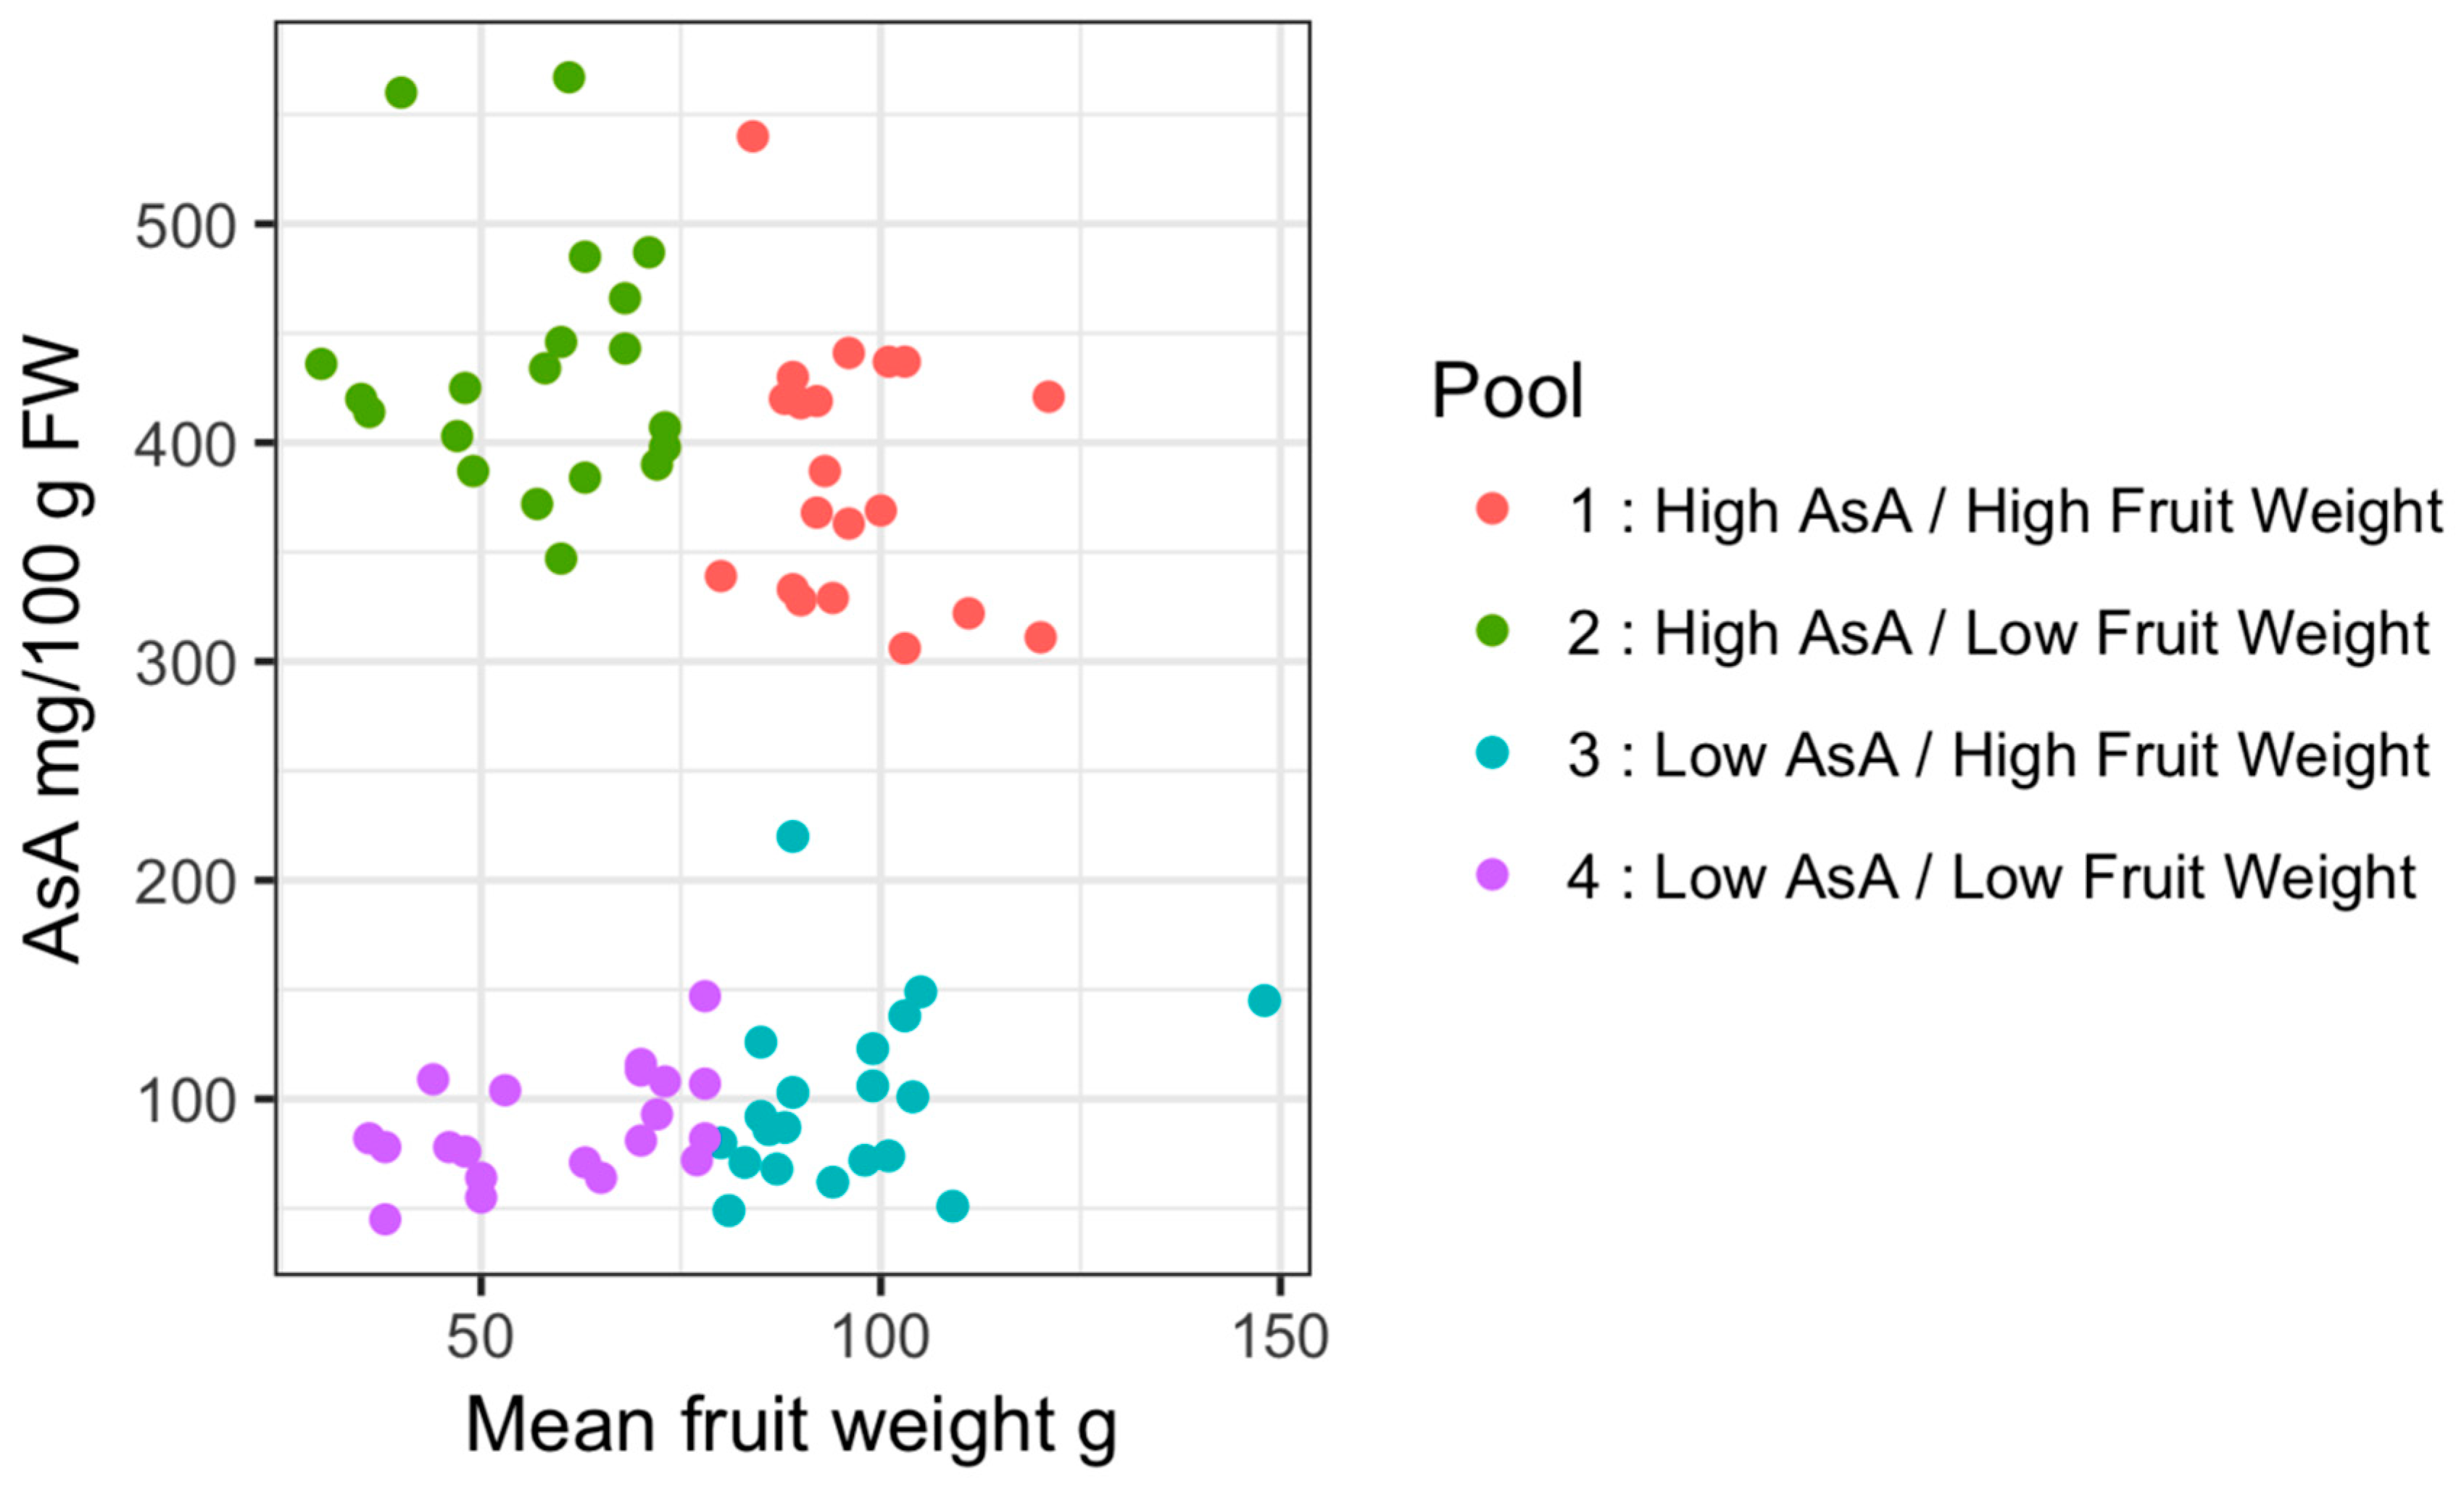
| Pool ID | Description | Mean AsA mg/100 g FW | SD | Mean Fruit Weight g | SD |
|---|---|---|---|---|---|
| 1 | High AsA/High Fruit weight | 385.9 | 59.5 | 96.6 | 10.85 |
| 2 | High AsA/Low Fruit weight | 433.55 | 57.1 | 56.6 | 13.51 |
| 3 | Low AsA/High Fruit weight | 100.15 | 41.12 | 95.65 | 15.13 |
| 4 | Low AsA/Low Fruit weight | 87.25 | 24.56 | 59.85 | 15.04 |
| Primer Set Name | Forward Primer | Reverse Primer | Target Interval (A. eriantha ‘White’) | Target Interval (A. chinensis Red5) |
|---|---|---|---|---|
| KCH00062 | GTGGCATTACTTTCCATATTGGG | TGGGCATTGAGTTGTAACCC | CHR26:8460956-8461055 | CHR26:7836781-7836880 |
| CHR26:8193148 | AGGATAGTTGGCAATTTCCAGG | TGGTAAGCCCAATAGACTATACCC | CHR26:8898197-8898278 | CHR26:8206006-820608 |
| CHR26:8874229 | ACATACCATTCGGAAGCGTG | ACTGTAGGAACTGAATAGTGATCG | CHR26:9597461-9597577 | CHR26:8887032-8887148 |
| CHR26:8453577 | GATAATGCGCCCACAGTTCC | GTTGAACTTTGAAGGAAACCTGC | Not determined | CHR26:8466420-8466503 |
© 2019 by the authors. Licensee MDPI, Basel, Switzerland. This article is an open access article distributed under the terms and conditions of the Creative Commons Attribution (CC BY) license (http://creativecommons.org/licenses/by/4.0/).
Share and Cite
McCallum, J.; Laing, W.; Bulley, S.; Thomson, S.; Catanach, A.; Shaw, M.; Knaebel, M.; Tahir, J.; Deroles, S.; Timmerman-Vaughan, G.; et al. Molecular Characterisation of a Supergene Conditioning Super-High Vitamin C in Kiwifruit Hybrids. Plants 2019, 8, 237. https://doi.org/10.3390/plants8070237
McCallum J, Laing W, Bulley S, Thomson S, Catanach A, Shaw M, Knaebel M, Tahir J, Deroles S, Timmerman-Vaughan G, et al. Molecular Characterisation of a Supergene Conditioning Super-High Vitamin C in Kiwifruit Hybrids. Plants. 2019; 8(7):237. https://doi.org/10.3390/plants8070237
Chicago/Turabian StyleMcCallum, John, William Laing, Sean Bulley, Susan Thomson, Andrew Catanach, Martin Shaw, Mareike Knaebel, Jibran Tahir, Simon Deroles, Gail Timmerman-Vaughan, and et al. 2019. "Molecular Characterisation of a Supergene Conditioning Super-High Vitamin C in Kiwifruit Hybrids" Plants 8, no. 7: 237. https://doi.org/10.3390/plants8070237
APA StyleMcCallum, J., Laing, W., Bulley, S., Thomson, S., Catanach, A., Shaw, M., Knaebel, M., Tahir, J., Deroles, S., Timmerman-Vaughan, G., Crowhurst, R., Hilario, E., Chisnall, M., Lee, R., Macknight, R., & Seal, A. (2019). Molecular Characterisation of a Supergene Conditioning Super-High Vitamin C in Kiwifruit Hybrids. Plants, 8(7), 237. https://doi.org/10.3390/plants8070237