Modeling the Population Dynamics and Management of Italian Ryegrass under Two Climatic Scenarios in Brazil

1
Department of Agronomy, Federal University of Technology–Paraná, Pato Branco 85503-390, Brazil
2
Department of Crop Protection, Institute for Sustainable Agriculture (CSIC), Spain and International Laboratory on Global Change (LINCGlobal) (CSIC), 14005 Córdoba, Spain
*
Author to whom correspondence should be addressed.
Plants 2020, 9(3), 325; https://doi.org/10.3390/plants9030325
Submission received: 30 December 2019
/
Revised: 24 February 2020
/
Accepted: 26 February 2020
/
Published: 4 March 2020
(This article belongs to the Special Issue 2019 Feature Papers by Plants’ Editorial Board Members)
Abstract
:Italian ryegrass (Lolium multiflorum L.) is an annual grass widely distributed in cultivated crops around the world. This weed causes significant yield reduction in many crops and has developed herbicide resistance. The aim of this study was to develop a cohort-based stochastic population dynamics model that integrates both emergence (thermal time) and dynamic population models as a tool to simulate the population dynamics of susceptible and resistant populations of L. multiflorum under the effects of climate change. The current climate scenario and the increase in the average air temperature by 2.5 °C were considered. Chemical and cultural management strategies commonly used in the South Region of Brazil during the winter and summer seasons were incorporated into the model. In the absence of control and under the current climate conditions, the seed bank population grew until reaching an equilibrium density of 19,121 ± 371 seeds m−2 for the susceptible and 20463 ± 363 seeds m−2 for the resistant populations. Considering the second climate scenario, the seed bank reaches an equilibrium density of 24,182 ± 253 seeds m−2 (+26% in relation to the current scenario) for the susceptible population and 24,299 ± 254 seeds m−2 (+18% in relation to the current scenario) for the resistant one. The results showed that the effect of the rise in temperature implies an increase in population in all the management strategies in relation to the current climate scenario. In both climate scenarios, the strategies based on herbicides application controlling cohorts 1 and 2 were the most efficient, and cropping systems including winter oat-soybeans rotation had a smaller impact on the L. multiflorum seed bank than crop rotations including winter wheat or summer corn. Crop rotations including wheat and corn for L. multiflorum management as an adaptive strategy under the future climate change are suggested.
1. Introduction
Lolium multiflorum L. is an annual species widespread in cultivated areas of the world [1]. This species has characteristics that allow it to be used for different purposes in agricultural systems, and it is widely used in intensive systems, like in the South Region of Brazil. This weed causes significant yield reduction in many crops [2] and has developed herbicide resistance. The species has stood out for its development of herbicide resistance, which has hindered management and increased production costs [2]. The first case of resistance to herbicides in Brazil was in 2004 (i.e., to glyphosate) [3]. The intensive and sometimes inappropriate use of ALS-inhibiting herbicides and ACCase in the last few years has led to the evolution of resistance to these mechanisms as well.
Population dynamics models allow future predictions of the behavior of a population. Such models are based on the study of demographic parameters, obtained from evaluations carried out in specific stages of plant development, such as seed mortality in the seed bank, emergence and survival rate of seedlings, and the production and dispersion of seeds. The models permit the simulation of management strategies and their assessment. This is an important feature mainly from an economic perspective, because of the expense of long-term field experiments and the amount of time required to obtain the results. The objective of using mathematical models is not to make an exact representation of the phenomenon, but rather to characterize the problem and extrapolate the consequences of management strategies to population dynamics [4]. The demographic parameters of a model can be attributed to fixed values [5]. However, agricultural systems are constantly undergoing abiotic and biotic disturbances caused by the environment; these disturbances may impact the model parameters. Therefore, randomness can be included through a stochastic model [6] which aims to represent the fluctuations that may occur over the years.
Several studies have already been carried out to assess the long-term population behavior of different weed species, including Lolium rigidum [5,6,7]. To the best of our knowledge, there are no studies of this kind on L. multiflorum. Moreover, there are still few studies comparing the dynamics of susceptible and herbicide-resistant populations [8]; in most cases, projections are made of the evolution of the herbicide-resistant frequency [9,10]. Several studies have shown that plants resistant to herbicides show morphophysiological changes in comparison to susceptible ones [11,12,13].
Studies assessing climate change show that from the years 1850 until 2015, the Earth’s average temperature has increased by approximately 0.8 °C [14], and the projection for the year 2050 is that it will increase by 2.0 °C [15]. The rise in temperature is linked to the elevation of atmospheric CO2, and it has an influence on the distribution of precipitation around the world. These estimates generally suggest that temperature increases and changes in the water regime would reduce the temporal distribution of seedling emergence, which would occur in more specific time-periods [16,17].
Weed population models have proved to be very useful for evaluating weed management strategies and developing decision-making tools [4]. However, they have hardly ever been used to study the impact of climate change on the management of weed populations. This study aimed to develop a cohort-based stochastic population model that integrates both emergence (thermal time) and population dynamics models as a tool to simulate the effect of commonly used management strategies in Brazil on the population dynamics of susceptible and resistant populations of L. multiflorum under the effects of climate change.
2. Results
2.1. Scenario 1 (Average Temperature 2007–2017)
Strategy M1 represents the development of the life-cycle with no controls. In the absence of control practices, the seed bank grew until reaching a population equilibrium of 19,121 ± 371 seeds m−2 and 20,463 ± 363 seeds m−2 for the susceptible and resistant populations, respectively (Figure 1). These values can be considered as the carrying capacities of L. multiflorum.
The most common method of controlling L. multiflorum in Brazil is by using the post-emergence application of herbicides. Our simulations indicate that chemical managements (M2, M3, and M4) had a high impact on the seed bank and were able to reduce the carrying capacity of the system ranging between 88% (M4; 2339 ± 25 seeds m−2; mean ± standard deviation) and 95% (M3; 1009 ± 15 seeds m−2) for susceptible populations and between 83% (M4; 3409 ± 42 seeds m−2) and 95% (M3; 1045 ± 18 seeds m−2) for resistant ones (Figure 1).
The management strategies based on crop rotations were as effective as herbicides in some cases. The control ranged from 59% (M6; 7877 ± 111 seeds m−2) to 94% (M8; 1059 ± 31 seeds m−2) for susceptible populations and between 59% (M6; 8339 ± 108 seeds m−2) and 95% (M8; 1091 ± 15 seeds m−2) for resistant ones (Figure 1).
Considering all the strategies, M3 (based on post-emergence late control in C1 and C2 and post-emergence early control in C3) was the most effective management strategy for both susceptible and resistant populations and the worst one was the strategy based on an oat/soybean rotation (M6).
2.2. Scenario 2 (2.5 °C Increase in Average Temperature)
With the expected elevation in temperature as a consequence of global climate change, an increase in the environment carrying capacity was observed when compared to Scenario 1 (Figure 1). The increase was 26% for the susceptible population (19,121 ± 371 => 24,182 ± 253 seeds m2), 18% for the resistant population (20,463 ± 363 => 24,299 ± 255 seeds m2). Similarly, our results show that the effect of the rise in temperature implies an increase in population in all the management strategies in relation to Scenario 1 (Figure 1). However, the reduction efficiency in relation to the baseline strategy was approximately the same. The control for herbicides application ranged from 58% (M4; 10,067 ± 258) to 95% (M2; 1293± 128 seeds m2) for the susceptible population and from 53% (M4; 11,319 ± 213) to 94% (M3; 1425 ± 18 seeds m2) for resistant ones. With crop rotations, the control varied between 55% (M6; 10,763 ± 149 seeds m2) and 94% (M7; 1335.68 ± 41.21 seeds m2) for susceptible populations and between 54% (M6; 11,036 ± 140 seeds m2) and 94% (M8; 1462 ± 40 seeds m2) for resistant ones.
Strategy M3 with post-emergence late control in cohorts C1 and C2 and post-emergence early control in C3 was the most effective one for resistant populations and strategy M2 with post-emergence late control in C1 and post-emergence early control in C2 was the most effective one for susceptible ones.
3. Discussion
The simulations were performed using the main management strategies deployed by farmers in the South Region of Brazil and involved both winter and summer crops. The stochastic nature of the model allows the effect of the demographic parameter variability to be evaluated [6], describing the effect of biotic and abiotic factors on the system. The seed bank observed in the baseline Scenario 1 (M1) was 19,121 ± 371 seeds m−2 (susceptible population) and 20,463 ± 363 seeds m−2 (resistant population). These results are in agreement with the seed bank observed in farming areas for L. multiflorum [18]. These population levels are high enough to cause severe yield losses if the weeds are not controlled [19].
Strategies exclusively dependent on chemical management (M2 and M3) were highly efficient and were able to suppress the seed bank by roughly 95% with respect to the baseline of each population in both climate scenarios. However, the potential for seed bank reduction by strategy M4 (based on post-emergence late control in C1 and C3) was less than 89% of the control. The expected temperature increase directly influences the speed of soil’s thermal accumulation, which is reflected in the anticipation of the seedling emergence. The soil temperature increase promotes synchronization and reduces the temporal distribution of seedling emergence [16]. As observed, this may have implications for L. multiflorum management, especially for strategy M4, because the increase in temperature (Scenario 2) decreases the strategy’s efficiency, for both the susceptible and herbicide-resistant populations, with respect to the baseline. In Scenario 2, the increase in temperature results in an increase of the seedling emergence speed in relation to Scenario 1. Therefore, the L. multiflorum population increases in the first cohort and reduces in the third one. This circumstance suggests the need for early application of control measures and, in this way, to reduce the population of the first cohort that is the most competitive with the crop [20].
The management strategies based on crop rotations were in some cases slightly less efficient than strategies based on herbicide applications. Management strategies with wheat and corn rotation (M5, M7, and M8) have shown to be very effective in suppressing the seed bank over the long term. In fact, L. multiflorum is controlled with pre- and post-emergence herbicides in wheat and with post-emergence herbicide in corn. The management strategies with oats followed by soybeans (M6, M9, and M10) showed a lesser potential for suppressing the L. multiflorum seed bank. This can be mainly attributed to the absence of post-emergence herbicides for the control of ryegrass in oats [21].
The results show that chemical management was more effective in controlling L. multiflorum, although chemical control measures could become less effective due to a change in the external environment (drier and warmer conditions) or changes in the anatomy, growth physiology, and phenology of the target weed flora as a consequence of climate change [22]. On the other hand, some crop rotation strategies were just as efficient (roughly 95%) as the herbicide application, in both scenarios. Therefore, it is suggested to use crop rotations, including wheat and corn, for L. multiflorum management as an adaptive strategy under the future climate change.
Climate change is one of the most important problems faced by farmers, and the use of models can give an insight into the long-term dynamics of weed populations. Population dynamics approaches can play a key role by filling eco-physiology and climate niche study gaps. Our results show an increase in resistant and susceptible populations, suggesting a future worsening infestation of this species in Brazil. The simulated strategies are commonly used among Brazilian farmers, but despite the high level of control offered in some cases, they do not seem to be sufficient to achieve an efficient control of L. multiflorum under the climate change scenarios considered.
Although susceptible and resistant populations of L. multiflorum differ in the number of seeds produced per plant at low densities, the seed bank’s carrying capacity of susceptible and resistant populations was similar. In fact, with the increase in plant density, a reduction in the difference in seed production capacity per plant between populations was observed [23]. Bassia scoparia populations susceptible and resistant to glyphosate, although differing in emergence rates, show no differences in their seed bank after stabilization [8]. However, differences between populations were observed when considering only the use of glyphosate, by which susceptible plants would be controlled and resistant plants would survive and reproduce.
Further development of the model should include checking its accuracy under field conditions. The models can easily be extended to allow the input of parameters related to the cost of each management, as well as potential grain yield losses due to the presence of Lolium plants. Another possibility is the incorporation of the likelihood of herbicide resistance into different management strategies, allowing future predictions of resistance evolution in the area [24] or be included in a decision support system to develop decision-making tools [25].
4. Materials and Methods
The population dynamics of L. multiflorum was modeled according to a stochastic model that considered three seedling cohorts (March, April, and June) (Figure 2), two populations (glyphosate-resistant and susceptible) and two climate scenarios. Scenario 1: Average air temperature observed over a 10-year period (2007–2017). Scenario 2: The same as Scenario 1 with a temperature increase of 2.5 °C. The three plant cohorts were defined as representing the main seasons of plant establishment in the South Region of Brazil, at the beginning, middle, and end of the season. The pollen flow between susceptible and resistant populations was disregarded, aiming to demonstrate only the behavior of purely susceptible and purely resistant populations.
4.1. Plant Emergence
The number of seedlings emerging in each plant cohort was determined by the accumulated soil thermal time (TT), according to the Gompertz model (Equation (1)) (Pagnoncelli not published).
where yd is the percent of seedlings emerged.
yd = 100 exp(−exp(−0.0151 (TT − 444.20)))
The cumulative thermal time in degrees day was calculated by:
where n is the number of days after sowing, Tmean is the average daily soil temperature (°C) and Tbase is the lowest temperature (°C) at which the seed can germinate. The Tbase temperature was set at 1.9 °C [26].
TT = ∑ni=1(Tmean − Tbase)
The soil TT was estimated based on the average daily air temperature (AT) over a 10-year period (2007–2017) (TT = 0.84AT + 3.81; R2 = 0.91) for the city of Pato Branco (26°10′32”S, 52°41′11”W), Brazil. Air and soil temperature are highly correlated and in the absence of soil temperature, the air temperature can be used to predict the seedling emergence [27]. The thermal accumulation count started on March 10th, the date considered for the emergence of the first cohort. Based on the thermal accumulation observed, Scenario 1 was created.
It is expected that by the year 2050, the average daily temperature for Southern Brazil will have increased by 2.5 °C [28], which may have a direct impact on the seedling emergence flow and, consequently, on the periods of plant establishment in the field (cohorts). The information was incorporated into the model, creating Scenario 2.
The number of seedlings emerging in each cohort was determined by:
and SDLi is the total seedlings emerged (seedlings m−2) in each cohort (i = 1… 3), yd is the percent of seedling emerged until day d, and SDL are the seedlings emerged (seedlings m−2).
SDLi = (yd/100) SDL
The number of seedlings with a potential emergence from the seed bank in year t was obtained by:
where SB is the seed bank (seeds m−2) and e is the emergence rate.
SDL = SB e
4.2. Seedling Survival
Seedlings are exposed to biotic and abiotic factors that can vary in each cohort; this has a direct effect on survival and the number of adult plants. The number of surviving seedlings that reach the adult stage in each cohort is determined by:
where: APi is the number adult plants (plants m−2) in each cohort, sdlsi is the seedling survival in each cohort, and rc is the rate of control by the herbicide.
APi = SDLi sdlsi (1 − rc)
4.3. Seed Production
Seed production per plant is density dependent according to the hyperbolic model [29] and is subject to the cohorts and the pollination rate because the plants are obligatorily cross-pollinating. The seed production per plant was determined by:
where SPi is the seed production plant−1 in each cohort, f is the max seed production for an isolated plant, fr is a factor reduction of fecundity (cohorts have different fecundities), b is the area required for a plant to produce f seeds, and lp (loss in pollination) is reduction in fecundity as a result of a pollination deficit.
SPi = f(1 − fri) (1 − lp) (1 − rc)/(1 + bAPi)
The seeds produced can be lost (removed from the field) in different ways (e.g., predators). The total number of seeds produced (TSPi) in each cohort (seeds m−2) was determined by:
where l is the seed losses.
TSPi = (SPi APi) (1 − l)
The total number of seeds produced in the 3 cohorts (TSP; seeds m−2) returning to the seed bank was obtained by:
TSP = ∑it=1(TSPi)
4.4. Seed Bank
The seed bank (SB; seeds m−2) in time t is given by,
where SBt−1 is the seed bank in the previous year (seeds m−2), et−1 is the emergence rate, sm is the seed bank mortality, TSPt−1 is the total seed production (seeds m−2) in the previous year, and cr is the crop rotation effect when applied.
SBt = SBt−1 (1 − et−1) (1 − sm) + TSPt−1 (1 − cr)
4.5. Model Parameters
Parameters were estimated with data obtained from experiments conducted in Pato Branco (Brazil) [30] and from the literature (Table 1). In all the simulations, an initial seed bank of 2000 seeds m−2 was considered [31].
Demographic and control parameters are subject to variations under field conditions, so they were considered stochastic. We modeled each parameter based on rates (except seed mortality and seed losses) by simulating its value as a random variable with a beta distribution, with a mean of µ and a standard deviation of σ and with a normal distribution for max seed by plants fecundity (f).
The control rates were obtained from published studies for L. multiflorum, and in the absence of information, data from L. perenne were used. The latter being the Lolium species with the highest morphological similarity to L. multiflorum [31]. Management strategies and control rates were the same in both populations. For chemical management, the application of clethodim + glyphosate was considered as they have potential to control 98% of young plants and 91% of adult ones [33].
The simulations were run for a 10-year time period with 100 repetitions each. The model was implemented in Excel® (a copy is available upon request).
4.6. Assessing Management Strategies
Several management strategies (cultural and chemical) were simulated (Table 2).
Strategy M1 does not consider any type of management and is considered as being the baseline for comparison with other management strategies.
The management strategies M2 to M4 rely only on the early post-emergence application of herbicide (before bloom) and late applications (after bloom) in different cohorts. The schematic representation of emergence flow, establishment and development of each cohort, and the management strategies used are shown in Figure 3 (adapted from Galvan et al., 2015) [31].
The cultural strategies are based on crop rotations (M5 to M10) (Table 2). The effect of crop rotation systems was quantified through their direct impact on the seed bank. These cropping systems were chosen because they are representative of what actually occurs in the South Region of Brazil. The combination of crop rotations was chosen because farmers are unlikely to cultivate the same crop in the summer for several consecutive years; in fact, this practice is not recommended by agronomists. In this model, the alternation of different crops in the summer shows with greater accuracy what actually happens in the field and provides the reader with a better understanding of this information in the long term.
Author Contributions
J.L.G.-A. and M.M.T. conceived and supervised the study. F.D.B.P.J. conducted the simulations and data analysis. F.D.B.P.J. and J.L.G.-A. wrote the manuscript. M.M.T. contributed to funding acquisition. All authors contributed critically to the drafts and gave final approval for the publication.
Funding
This research was funded by HRAC-BR (Associação Brasileira de Ação a Resistência de Plantas Daninhas aos Herbicida). FBP acknowledges economic support from the CAPES (Coordenação de Aperfeiçoamento de Pessoal de Ensino Superior). JLG-A was partially funded by the Spanish Ministry of Science, Innovation and Universities (grant AGL2015- 64130-R).
Conflicts of Interest
The authors declare no conflict of interest.
References
- U.S. National Plant Germplasm System. Available online: https://npgsweb.ars-grin.gov/gringlobal/taxonomydetail.aspx?id=22493 (accessed on 29 December 2019).
- Adegas, F.; Vargas, L.; Gazziero, D.; Karam, D. Impacto econômico da resistência de plantas daninhas a herbicidas no Brasil. Circular Técnica 2017, 132, 12. [Google Scholar]
- Vargas, L.; Roman, E.; Rizzardi, M.; Silva, V. Identificação de biótipos de azevém (Lolium multiflorum) resistentes ao herbicida glyphosate em pomares de maçã. Planta Daninha 2004, 22, 617–622. [Google Scholar] [CrossRef] [Green Version]
- Gonzalez-Andujar, J.L. Weed Control Models. In Population Dynamics. Encyclopedia of Ecology; Jørgensen, S., Fath, B., Eds.; Elsevier: Oxford, MS, USA, 2008; Volume 5, pp. 3776–3780. [Google Scholar]
- Gonzalez-Andujar, J.L.; Fernández-Quintanilla, C. Modelling the population dynamics of annual ryegrass (Lolium rigidum) under various weed management systems. Crop Prot. 2004, 23, 723–729. [Google Scholar] [CrossRef] [Green Version]
- Zambrano-Navea, C.; Bastida, F.; Gonzalez-Andujar, J. A cohort-based stochastic model of the population dynamic and long-term management of Conyza bonariensis in fruiting tree crops. Crop Prot. 2016, 80, 15–20. [Google Scholar] [CrossRef]
- Gonzalez-Diaz, L.; Leguizamon, E.; Forcella, F.; Gonzalez-Andujar, J. Integration of emergence and population dynamic models for long term weed management using wild oat (Avena fatua L.) as an example. Span. J. Agric. 2007, 5, 199–203. [Google Scholar] [CrossRef] [Green Version]
- Osipitan, O.; Dille, J.; Bagavathiannan, M.; Knezevic, S. Modeling Population Dynamics of Kochia (Bassia scoparia) in Response to Diverse Weed Control Options. Weed Sci. 2019, 57–67. [Google Scholar] [CrossRef]
- Neve, P.; Norsworthy, J.; Smith, K.; Zelaya, I. Modeling glyphosate resistance management strategies for Palmer amaranth (Amaranthus palmeri) in cotton. Weed Technol. 2011, 25, 335–343. [Google Scholar] [CrossRef]
- Bagavathiannan, M.; Norsworthy, J.; Smith, K.; Neve, P. Modeling the evolution of glyphosate resistance in barnyardgrass (Echinochloa crus-galli) in cotton-based production systems of the midsouthern United States. Weed Technol. 2013, 27, 475–487. [Google Scholar] [CrossRef]
- Vila-Aiub, M.; Goh, S.; Gaines, T.; Han, H.; Busi, R.; Yu, Q.; Powles, S. No fitness cost of glyphosate resistance endowed by massive EPSPS gene amplification in Amaranthus palmeri. Planta 2014, 239, 793–801. [Google Scholar] [CrossRef]
- Yanniccari, M.; Vila-Aiub, M.; Istilart, C.; Acciaresi, H.; Castro, A. Glyphosate resistance in perennial ryegrass (Lolium perenne L.) is associated with a fitness penalty. Weed Sci. 2016, 64, 71–79. [Google Scholar] [CrossRef] [Green Version]
- Fernández-Moreno, P.; Alcántara-de la Cruz, R.; Smeda, R.; De Prado, R. Differential resistance mechanisms to glyphosate result in fitness cost for Lolium perenne and L. multiflorum. Front. Plant Sci. 2017, 8, 1796. [Google Scholar] [CrossRef] [PubMed] [Green Version]
- Rahmstorf, S.; Foster, G.; Cahill, N. Global temperature evolution: Recent trends and some pitfalls. Environ. Res. 2017, 12, 054001. [Google Scholar] [CrossRef]
- Wuebbles, D.; Fahey, D.; Hibbard, K.; DeAngelo, B.; Doherty, S.; Hayhoe, K.; Horton, R.; Kossin, J.; Taylor, P.; Waple, A.; et al. Climate Science Special Report: Fourth National Climate Assessment; Wuebbles, D., Fahey, D., Hibbard, K., Dokken, D., Stewart, B., Maycock, T., Eds.; U.S. Global Change Research Program: Washington, DC, USA, 2017; Volume 1, pp. 12–34.
- Varanasi, A.; Prasad, P.; Jugulam, M. Impact of climate change factors on weeds and herbicide efficacy. Adv. Agron. 2016, 135, 107–146. [Google Scholar]
- Kathiresan, R.; Gualbert, G. Impact of climate change on the invasive traits of weeds. Weed Biol. Manag. 2016, 16, 59–66. [Google Scholar] [CrossRef]
- Maia, F.; Maia, M.; Bekker, R.; Berton, R.; Caetano, L. Lolium multiflorum seeds in the soil: I. Soil seed bank dynamics in a no till system. Revista Brasileira de Sementes 2008, 30, 100–110. [Google Scholar] [CrossRef] [Green Version]
- Nandula, V.K. Italian ryegrass (Lolium perenne ssp. multiflorum) and corn (Zea mays) competition. Am. J. Plant Sci. 2014, 5, 3914. [Google Scholar] [CrossRef] [Green Version]
- Gonzalez-Andujar, J.L.; Fernández-Quintanilla, C. Modelling the population dynamics of Avena sterilis under dry-land cereal cropping systems. J. Appl. Ecol. 1991, 28, 16–27. [Google Scholar] [CrossRef]
- Primavesi, A.C.; Rodrigues, A.; Godoy, R. Recomendações técnicas para o cultivo de aveia; Comunicado Técnico nº 6; Embrapa Pecuaria Sudeste: Sao Carlos, Brazil, 2000; 39p. [Google Scholar]
- Ziska, L.H.; McConnell, L.L. Climate change, carbon dioxide, and pest biology: Monitor, mitigate, management. J. Agric. Food Chem. 2015, 64, 6–12. [Google Scholar] [CrossRef]
- Gregor, J. XXX.—Pollination and Seed Production in the Rye-Grasses (Lolium perenne and Lolium italicum). Earth Environ. Sci. Trans. R. Soc. Edinb. 1928, 55, 773–794. [Google Scholar] [CrossRef]
- Manalil, S.; Renton, M.; Diggle, A.; Busi, R.; Powles, S.B. Simulation modelling identifies polygenic basis of herbicide resistance in a weed population and predicts rapid evolution of herbicide resistance at low herbicide rates. Crop Prot. 2012, 40, 114–120. [Google Scholar] [CrossRef]
- Gonzalez-Andujar, J.L.; Fernandez-Quintanilla, C.; Bastida, F.; Calvo, R.; Izquierdo, J.; Lezaun, J.A. Assessment of a Decision Support System for Chemical Control of Annual Ryegrass (Lolium rigidum) in Winter Cereals. Weed Res. 2011, 51, 304–309. [Google Scholar] [CrossRef]
- Tribouillois, H.; Dürr, C.; Demilly, D.; Wagner, M.; Justes, E. Determination of germination response to temperature and water potential for a wide range of cover crop species and related functional groups. PLoS ONE 2016, 11, e0161185. [Google Scholar] [CrossRef] [PubMed]
- Izquierdo, J.; Bastida, F.; Lezaún, J.; Sánchez del Arco, M.; Gonzalez-Andujar, J. Development and evaluation of a model for predicting Lolium rigidum emergence in winter cereal crops in the Mediterranean area. Weed Res. 2013, 53, 269–278. [Google Scholar] [CrossRef]
- Andersen, L.; Breisinger, C.; Jemio, L.; Mason-D’Croz, D.; Ringler, C.; Robertson, R.; Wiebelt, M. Climate Change Impacts and Household Resilience: Prospects for, 2050 in Brazil, Mexico, and Peru; International Food Policy Research Institute (IFPRI): Washington, DC, USA, 2016; 94p. [Google Scholar]
- Cousens, R.; Mortimer, A.M. Dynamics of Weed Populations; Cambridge University Press: Cambridge, UK, 1995; p. 332. [Google Scholar]
- Pagnoncelli, F.; Trezzi, M.; Salomão, H.; Hartman, K.; Bortolanza, P.; Gonzalez-Andujar, J.L. Demography of Italian ryegrass (Lolium multiflorum) susceptible and resistant to glyphosate. Planta Daninha 2020. manuscript in preparation. [Google Scholar]
- Galvan, J.; Rizzardi, M.; Peruzzo, S.; Ovejero, R. Evolution of Ryegrass Seed Banks Depending on Soil Tillage and Crops. Planta Daninha 2015, 33, 183–191. [Google Scholar] [CrossRef] [Green Version]
- Christoffoleti, P.; Trentin, R.; Tocchetto, S.; Marochi, A.; Galli, A.; López-Ovejero, R.; Nicolai, M. Alternative herbicides to manage Italian ryegrass (Lolium multiflorum Lam) resistant to glyphosate at different phenological stages. J. Environ. Sci. Health C. 2005, 40, 59–67. [Google Scholar] [CrossRef]
- Terrell, E.E. A Taxonomic Revision of the Genus Lolium; Technical Bulletin; US Department of Agriculture: Washington, DC, USA, 1968; p. 1392.
Figure 1.
Average dynamics of Lolium multiflorum seed bank. For Scenario 1, mean temperature between 2007 and 2017 for populations susceptible (a) and resistant to glyphosate (b), and for Scenario 2, with an expected average daily temperature increase in 2.5 °C for populations susceptible (c) and resistant to glyphosate (d). Under different management strategies. M1 = Null, M2 = PosLC1 + PosEC2, M3 = PosLC1 + PosLC2 + PosEC3, M4 = PosEC2 + PosLC3, M5 = Wheat/Soybean, M6 = Oat/Soybean, M7 = Oat/Corn, M8 = Wheat/Soybean/Oat/Corn, M9 = Oat/Soybean/Oat/Corn, M10 = Wheat/Soybean/Oat/Corn/Oat/Soybean.

Figure 2.
Life cycle of Lolium multiflorum with three cohorts (C1, C2, and C3).
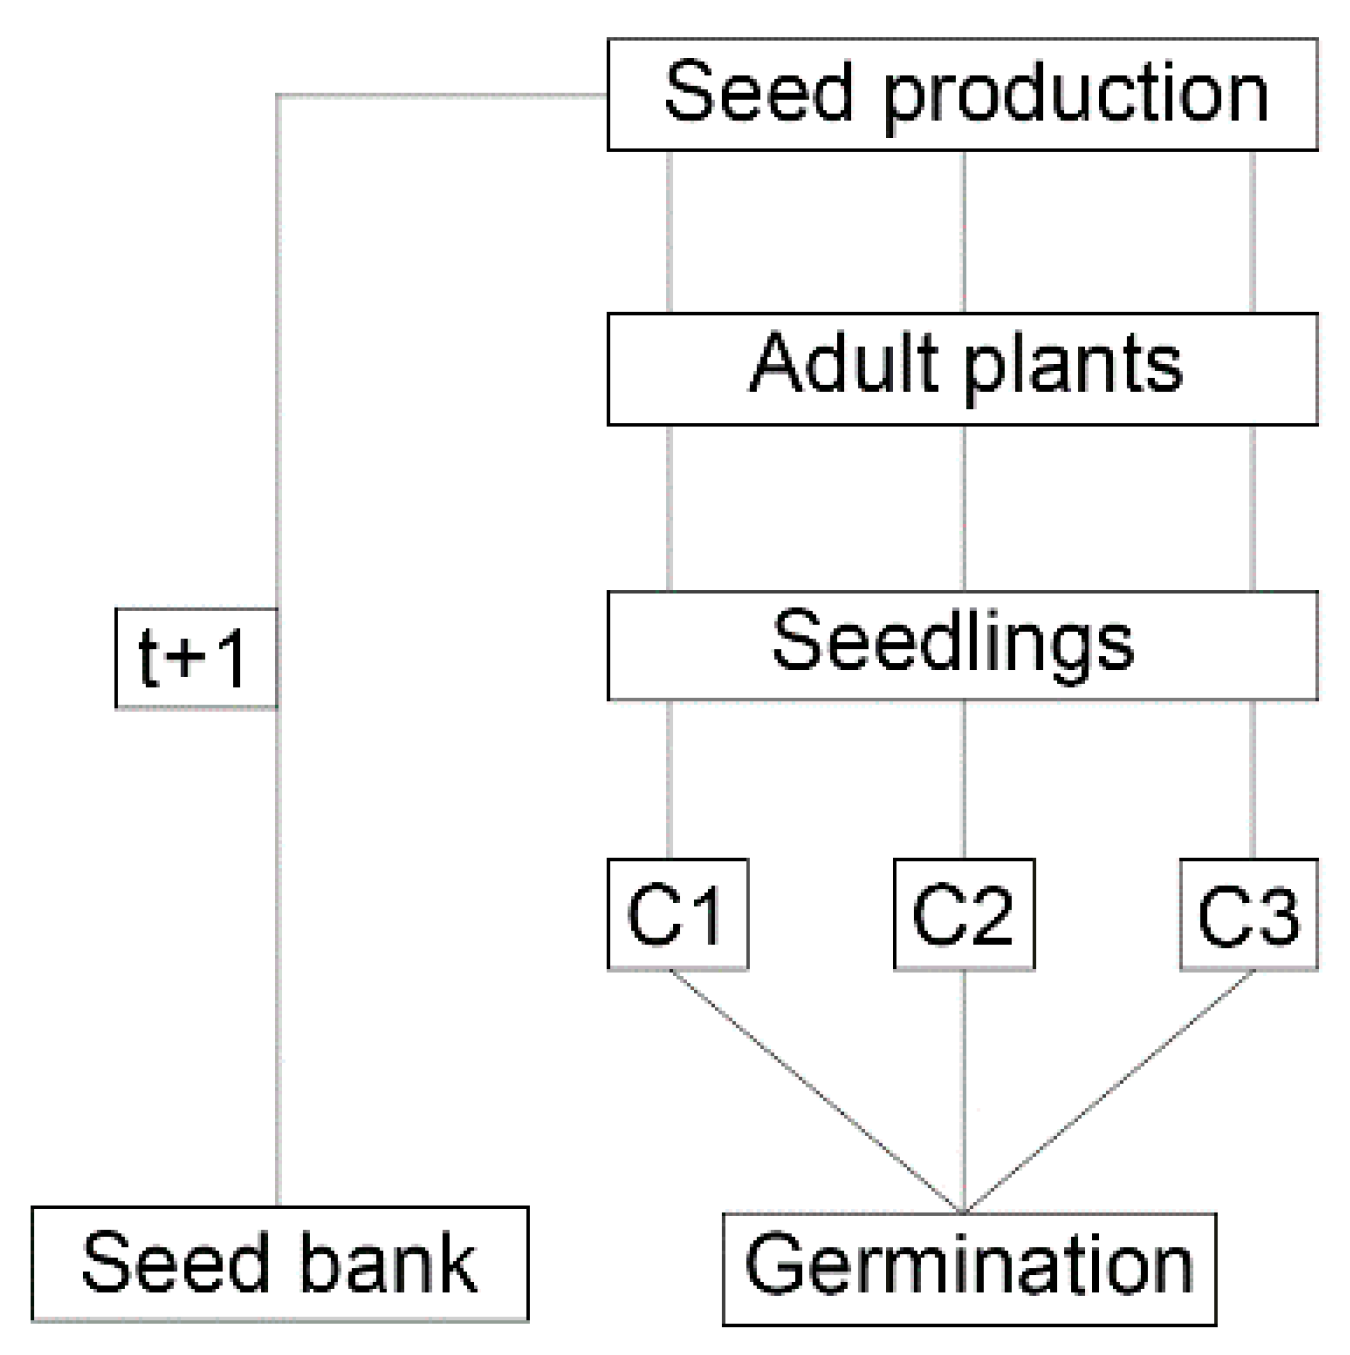
Figure 3.
Diagram used to describe L. multiflorum management strategies. The emergence flow and development of each cohort are described in this work, while the crops sowing is adjusted according to Galvan et al., (2015) [31].
Figure 3.
Diagram used to describe L. multiflorum management strategies. The emergence flow and development of each cohort are described in this work, while the crops sowing is adjusted according to Galvan et al., (2015) [31].


Table 1.
Parameters used in the model. (sd: standard deviation).
| Parameter | Susceptible | Resistant | Reference | |||
|---|---|---|---|---|---|---|
| Mean | sd | Mean | sd | |||
| Seed Bank | ||||||
| Seed Mortality | Sm | 0.49 | - | 0.49 | - | [31] |
| Emergence rate | e | 0.73 | 0.04 | 0.73 | 0.04 | [30] |
| Seedlings | ||||||
| Seedling Survival | sdlsi1 | 0.02 | 0.02 | 0.04 | 0.03 | [30] |
| Seedling Survival | sdlsi2 | 0.03 | 0.02 | 0.05 | 0.03 | [30] |
| Seedling Survival | sdlsi3 | 0.11 | 0.05 | 0.16 | 0.07 | [30] |
| Seed Production | ||||||
| Factor Reduction | fri1 | 0.07 | 0.07 | 0.02 | 0.06 | [30] |
| Factor Reduction | fri2 | 0 | - | 0 | - | [30] |
| Factor Reduction | fri3 | 0.46 | 0.1 | 0.34 | 0.12 | [30] |
| Max Seed Produced per Plant | f | 20300 | 1212 | 13830 | 1305 | [30] |
| Area to Produce f Seeds | b | 0.17 | 0.03 | 0.12 | 0.03 | [30] |
| Losses in Pollination | lp | 0.88 | 0.05 | 0.88 | 0.05 | [30] |
| Seed Losses (Standard Harvest) | sl | 0.19 | - | 0.19 | - | [5] |
| Management | ||||||
| Control rate (Post Emergence Early) | rcpostE | 0.98 | 0.005 | 0.98 | 0.005 | [32] |
| Control rate (Post Emergence Late) | rcpostL | 0.91 | 0.008 | 0.91 | 0.008 | [32] |
| Crop Rotation Wheat/Soybean | cr1 | 0.89 | 0.03 | 0.89 | 0.03 | [31] |
| Crop Rotation Oat/Soybean | cr2 | 0.48 | 0.13 | 0.48 | 0.13 | [31] |
| Crop Rotation Oat/Corn | cr3 | 0.89 | 0.03 | 0.89 | 0.03 | [31] |
Table 2.
Simulated chemical and cultural strategies for the management of L. multiflorum.
| Management | Year 1 | Year 2 | Year 3 | |||
|---|---|---|---|---|---|---|
| Winter | Summer | Winter | Summer | Winter | Summer | |
| M1 | Null | |||||
| M2 | PostLC1 + PostEC2 | |||||
| M3 | PostLC1 + PostLC2 + PostEC3 | |||||
| M4 | PostLC2 + PostLC3 | |||||
| M5 | Wheat | Soybean | ||||
| M6 | Oat | Soybean | ||||
| M7 | Oat | Corn | ||||
| M8 | Wheat | Soybean | Oat | Corn | ||
| M9 | Oat | Soybean | Oat | Corn | ||
| M10 | Wheat | Soybean | Oat | Corn | Oat | Soybean |
PosE: post emergence early; PosL: post emergence late; C1, C2, and C3 are cohorts.
© 2020 by the authors. Licensee MDPI, Basel, Switzerland. This article is an open access article distributed under the terms and conditions of the Creative Commons Attribution (CC BY) license (http://creativecommons.org/licenses/by/4.0/).
Share and Cite
MDPI and ACS Style
D. B. Pagnoncelli, F., Jr.; Trezzi, M.M.; Gonzalez-Andujar, J.L. Modeling the Population Dynamics and Management of Italian Ryegrass under Two Climatic Scenarios in Brazil. Plants 2020, 9, 325. https://doi.org/10.3390/plants9030325
AMA Style
D. B. Pagnoncelli F Jr., Trezzi MM, Gonzalez-Andujar JL. Modeling the Population Dynamics and Management of Italian Ryegrass under Two Climatic Scenarios in Brazil. Plants. 2020; 9(3):325. https://doi.org/10.3390/plants9030325
Chicago/Turabian StyleD. B. Pagnoncelli, Fortunato, Jr., Michelangelo M. Trezzi, and Jose L. Gonzalez-Andujar. 2020. "Modeling the Population Dynamics and Management of Italian Ryegrass under Two Climatic Scenarios in Brazil" Plants 9, no. 3: 325. https://doi.org/10.3390/plants9030325
Note that from the first issue of 2016, this journal uses article numbers instead of page numbers. See further details here.