Heat Stress Factors Expressed during Seed Maturation Differentially Regulate Seed Longevity and Seedling Greening

 and
and 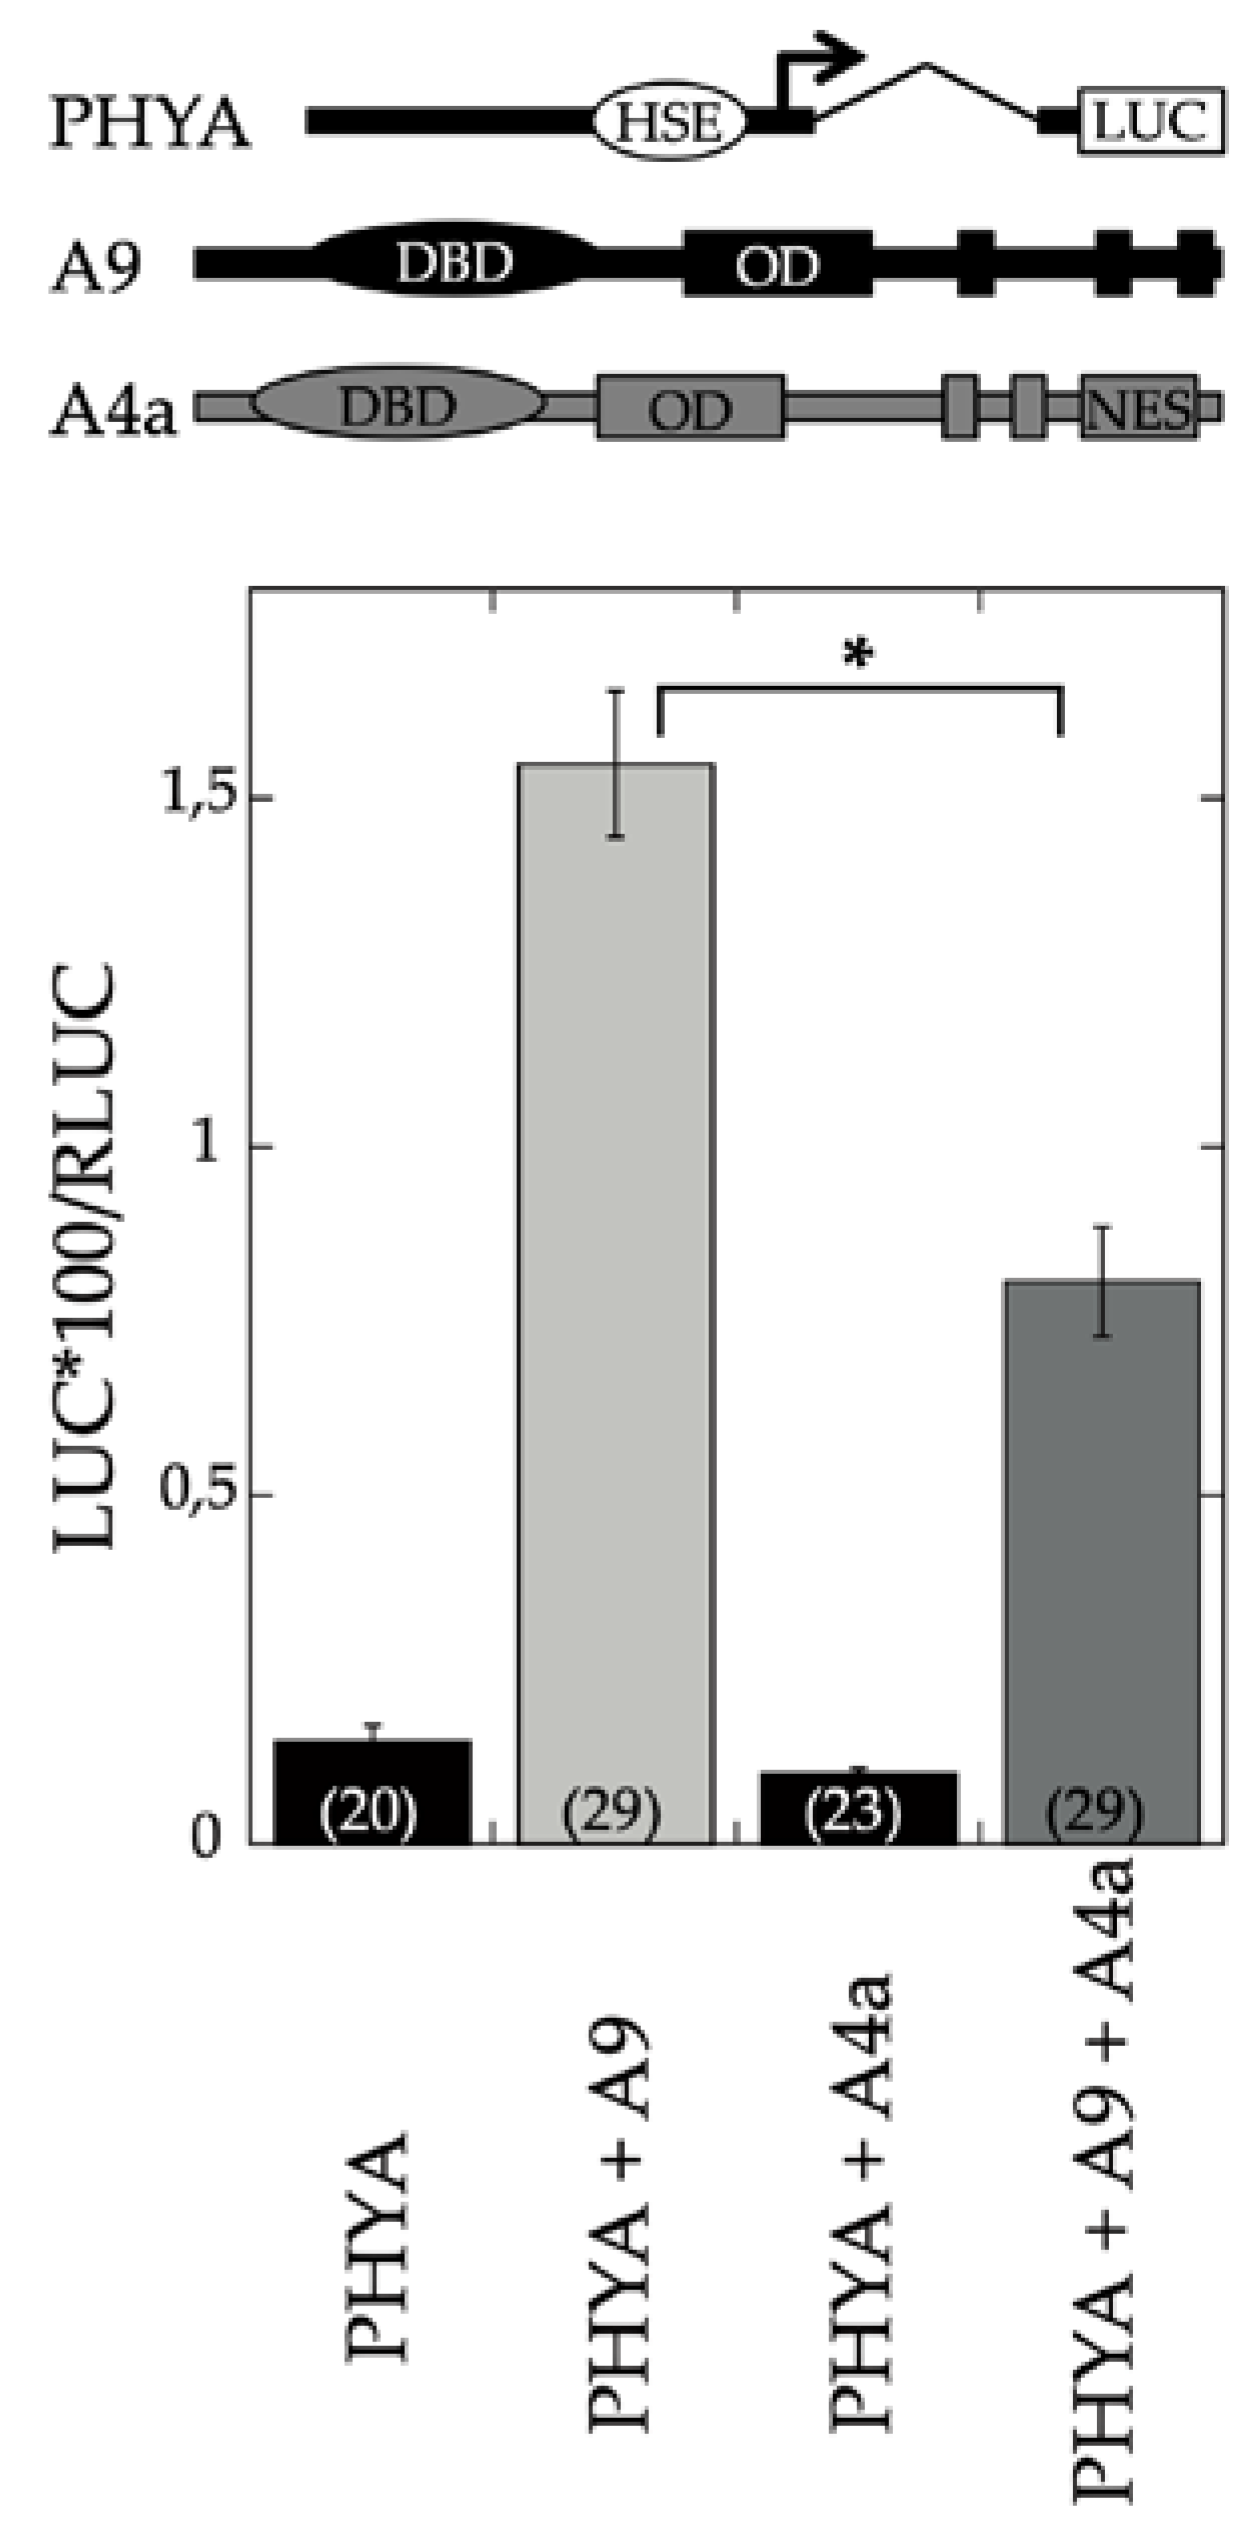
Abstract
:1. Introduction
2. Results
2.1. Transcriptomic Analysis of the Effects of A9 and A4a
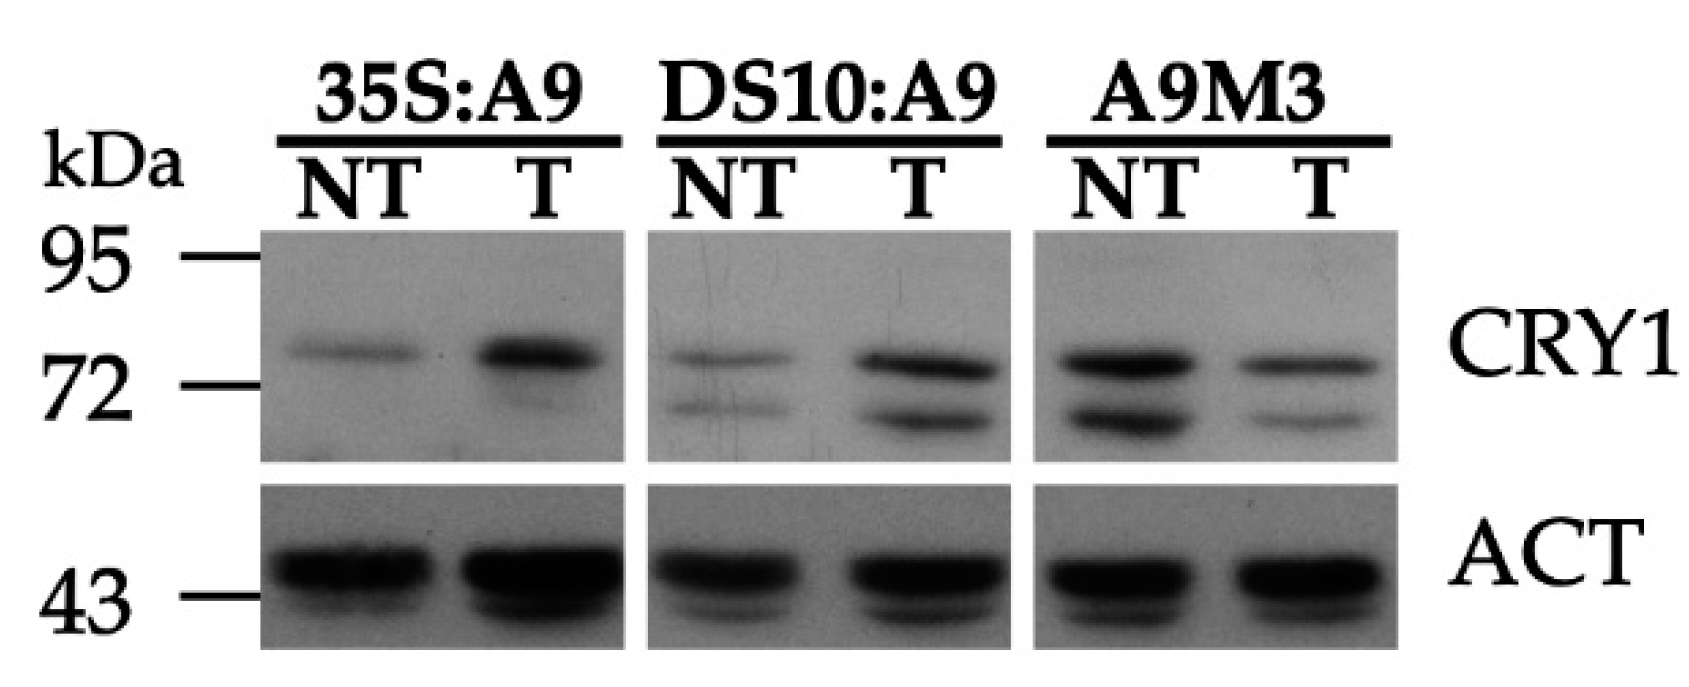
2.2. A9 Enhances Responses to Blue Light Mediated by CRY1
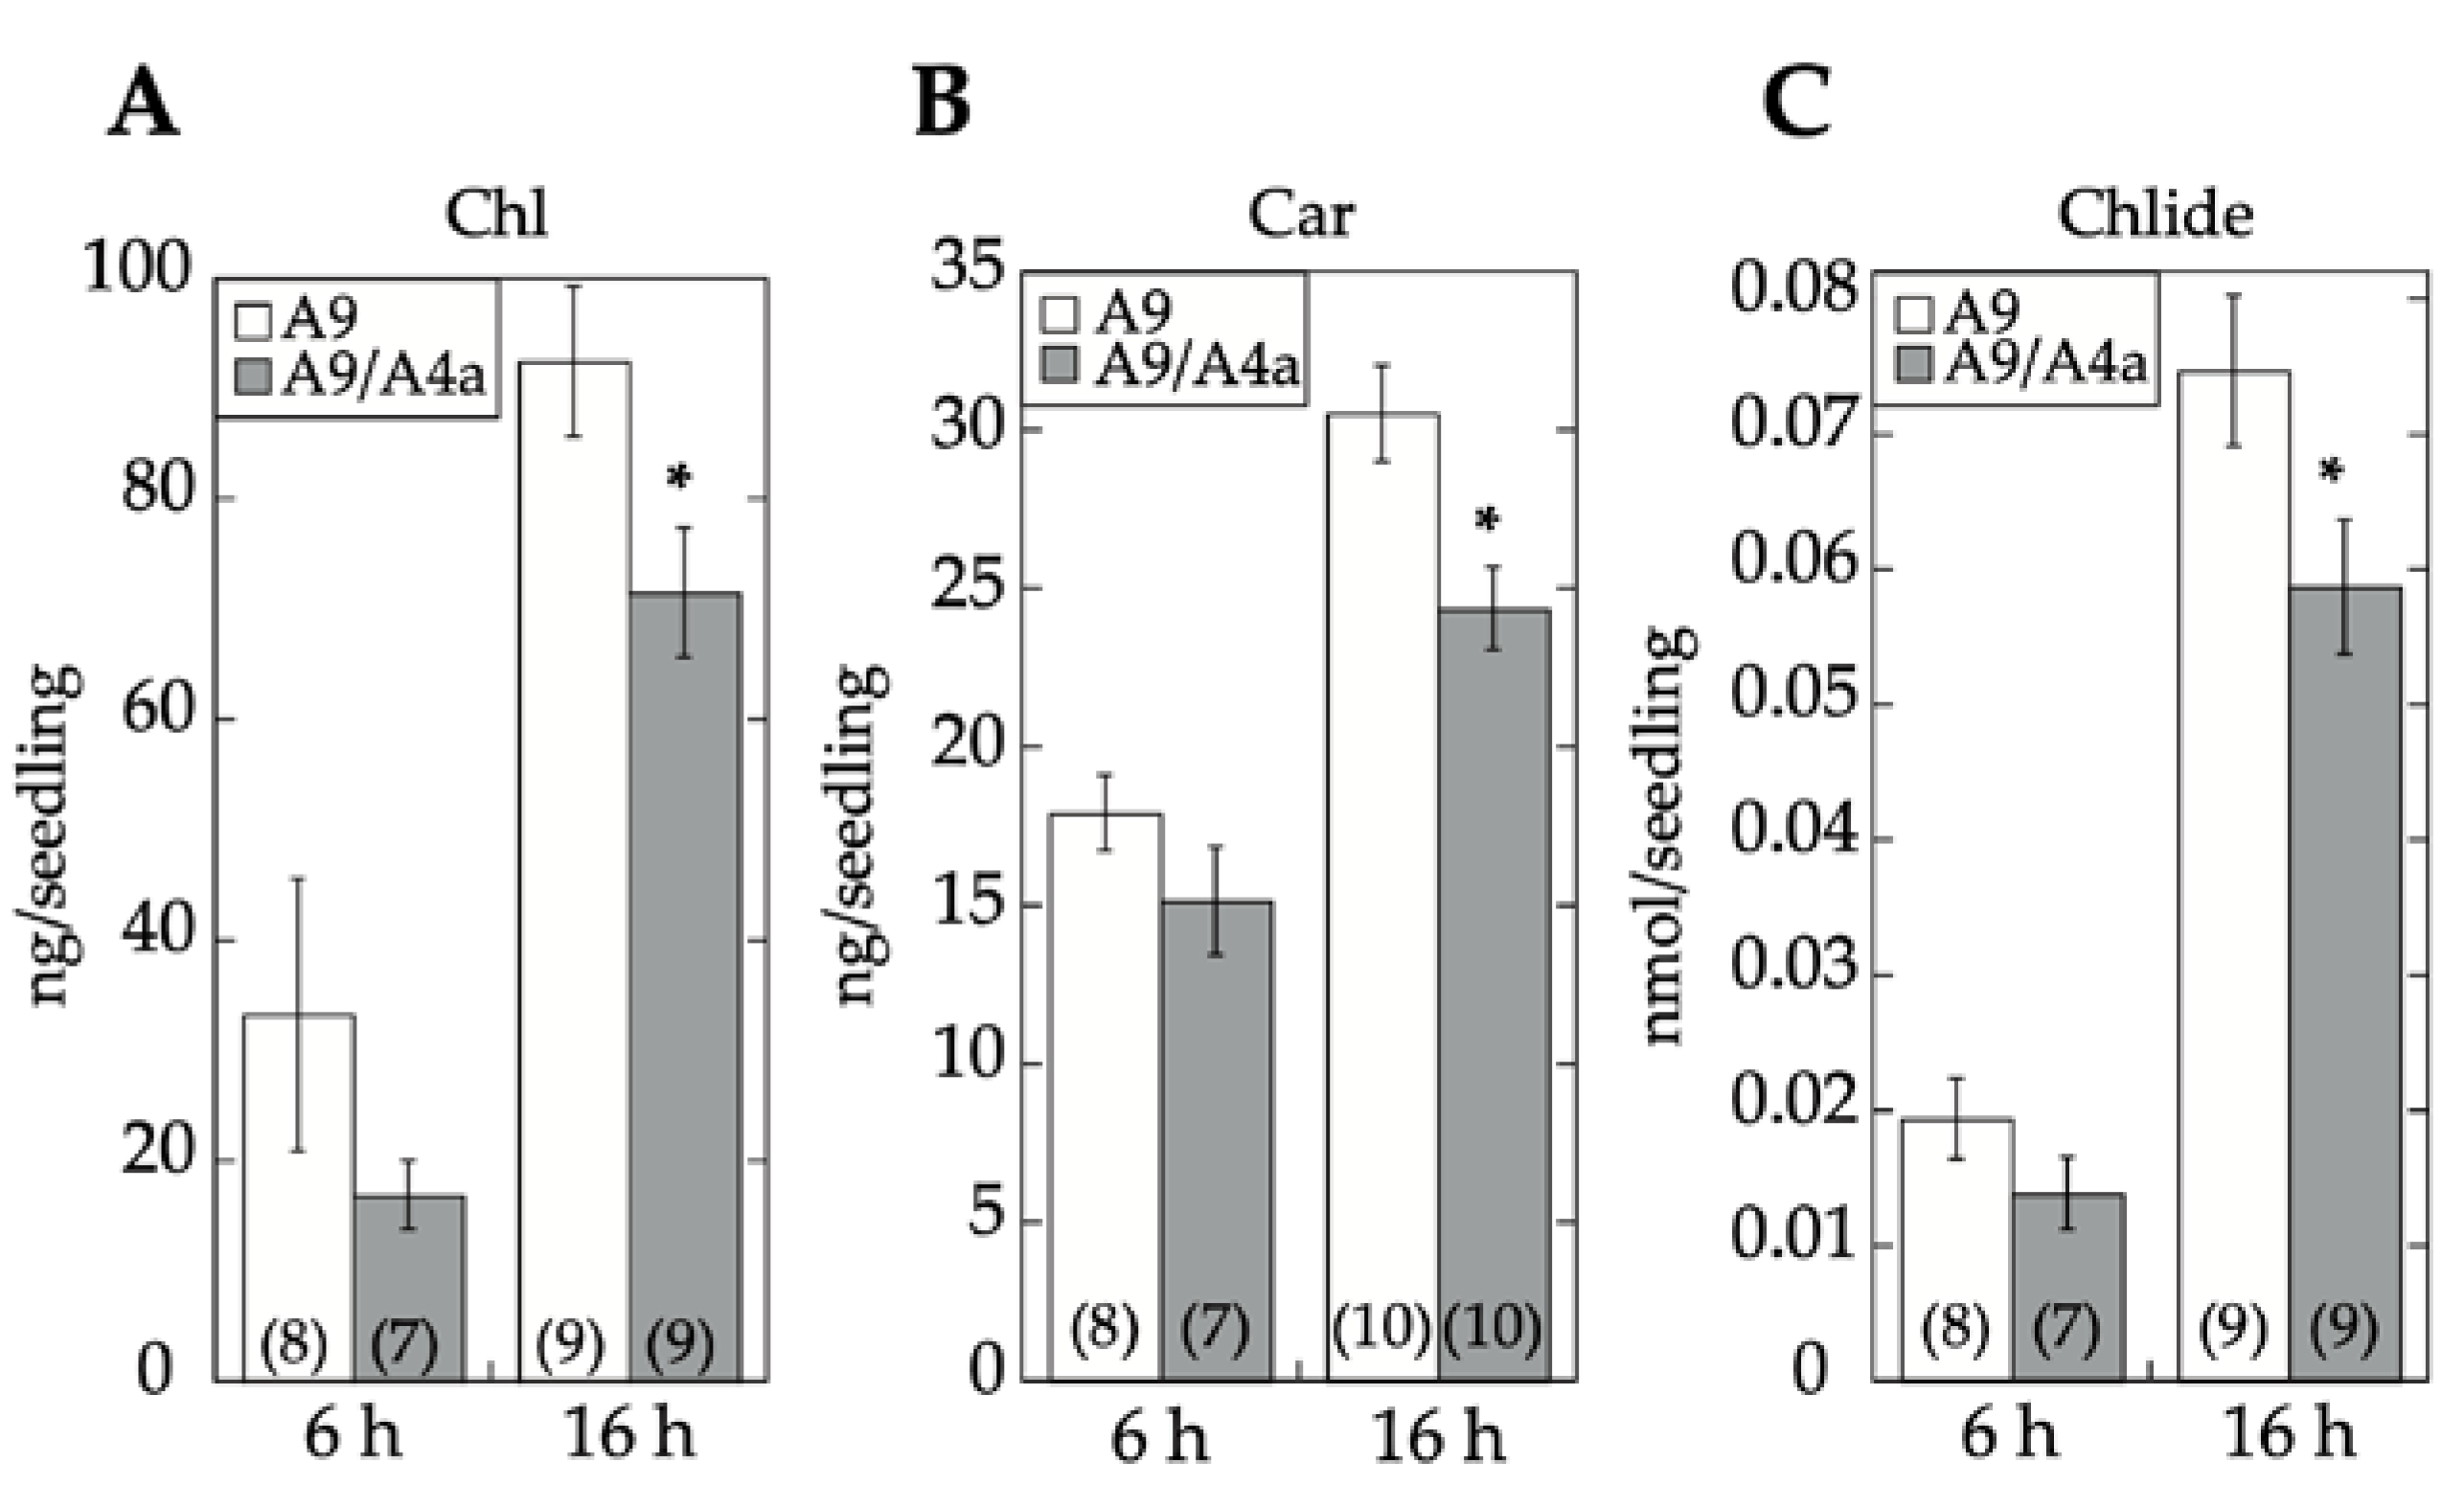
2.3. Comparative Loss-of-Function Effects of A9 in Seed Longevity and Seedling Greening
3. Discussion
4. Materials and Methods
4.1. Plant Material and Transgenic Lines
4.2. Promoter Activation Assays
4.3. RNA-Seq Transcript Analysis
4.4. Protein Accumulation Gel Blot Analyses
4.5. Seed Deterioration
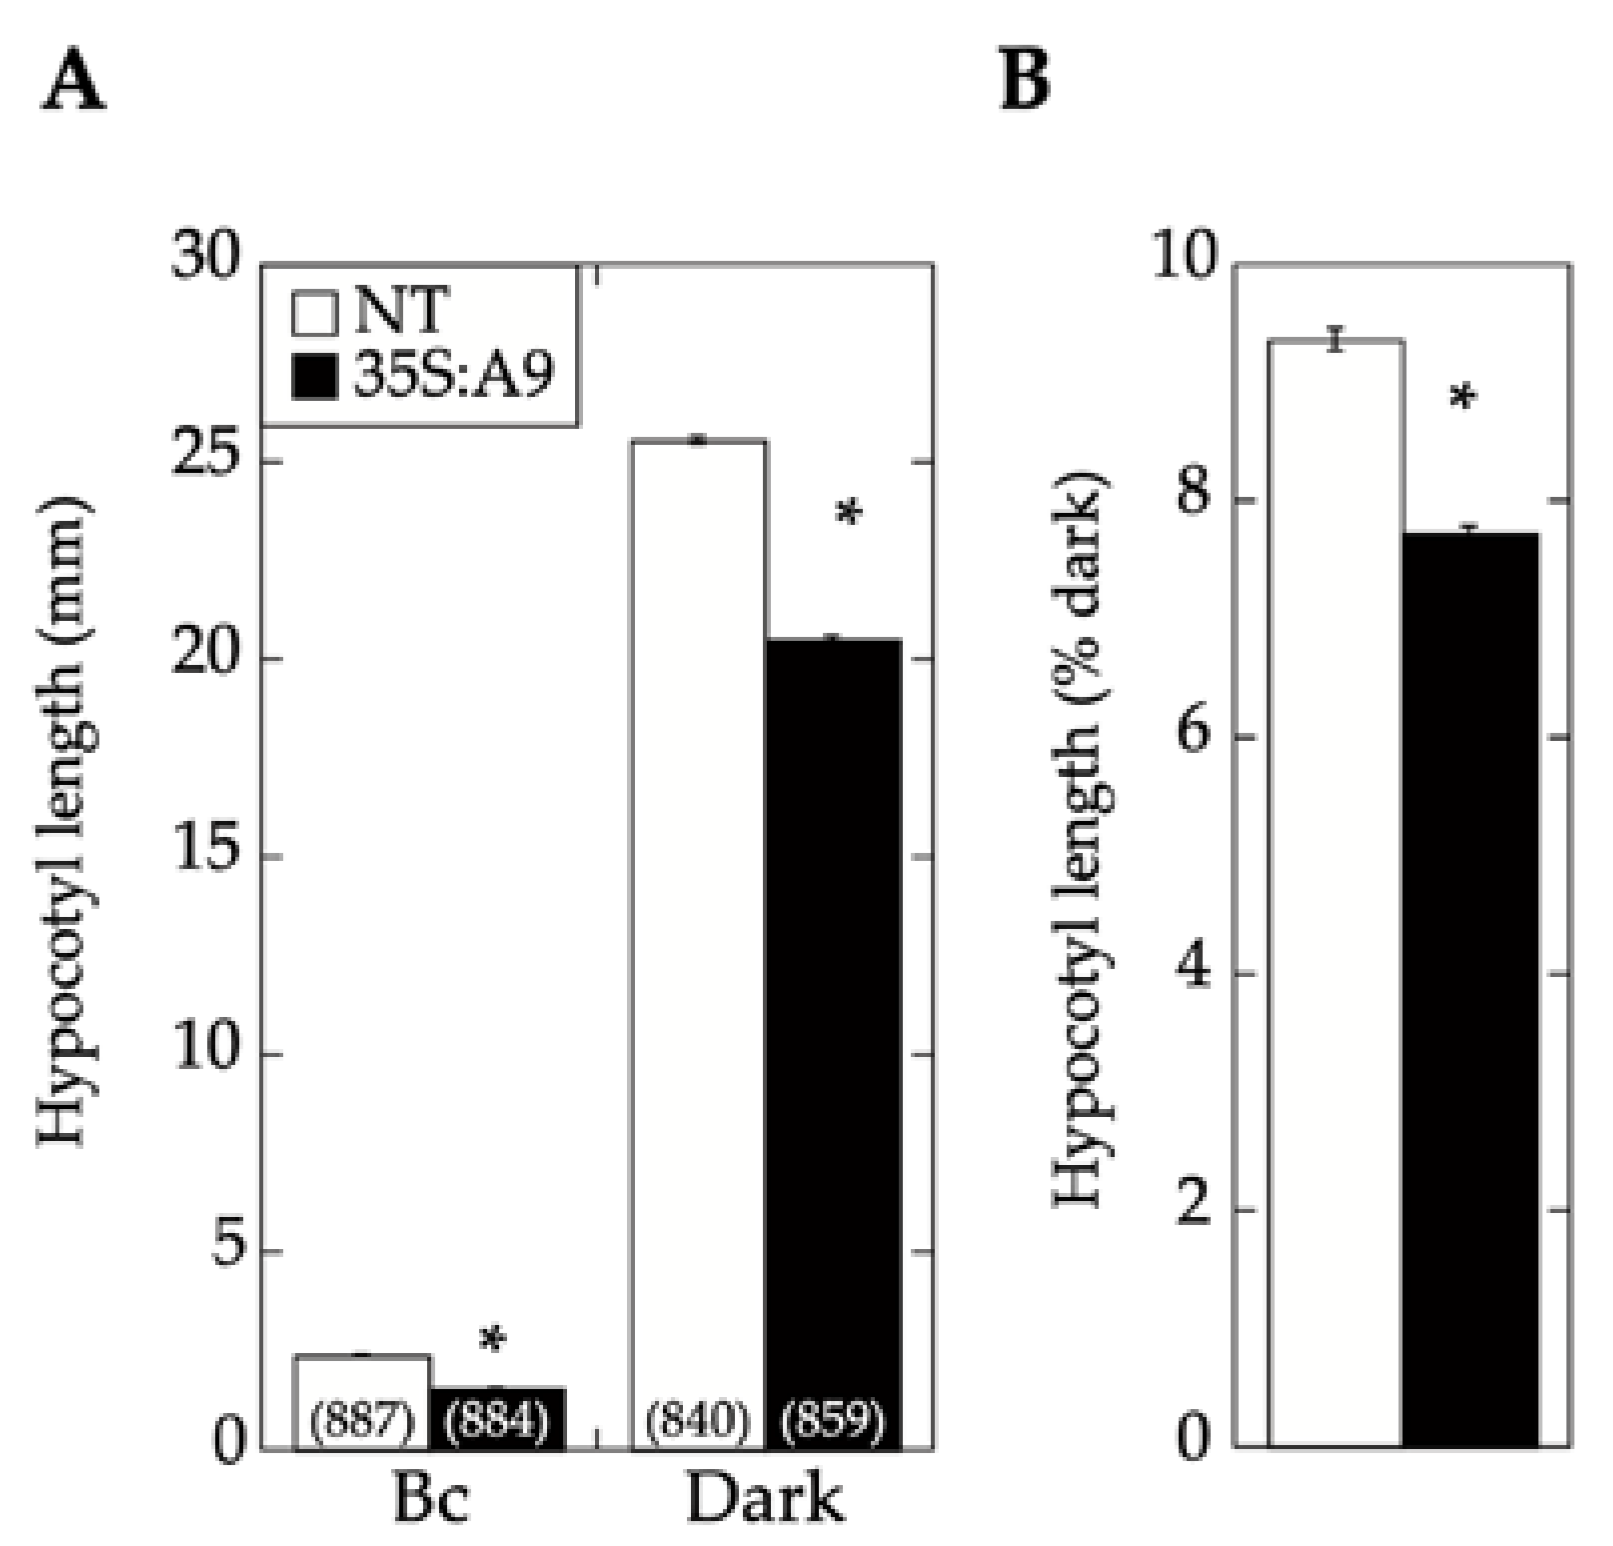
4.6. Light Treatments and Quantification of Hypocotyl Growth Reduction and Seedling Greening
4.7. Statistics
Supplementary Materials
Author Contributions
Funding
Acknowledgments
Conflicts of Interest
References
- Scharf, K.D.; Berberich, T.; Ebersberger, I.; Nover, L. The plant heat stress transcription factor (Hsf) family: Structure, function and evolution. Biochim. Biophys. Acta 2012, 1819, 104–119. [Google Scholar] [CrossRef] [PubMed]
- Guo, M.; Liu, J.H.; Ma, X.; Luo, D.X.; Gong, Z.H.; Lu, M.H. The Plant Heat Stress Transcription Factors (HSFs): Structure, Regulation, and Function in Response to Abiotic Stresses. Front. Plant Sci. 2016, 7, 114. [Google Scholar] [CrossRef] [PubMed] [Green Version]
- Almoguera, C.; Rojas, A.; Diaz-Martin, J.; Prieto-Dapena, P.; Carranco, R.; Jordano, J. A seed-specific heat-shock transcription factor involved in developmental regulation during embryogenesis in sunflower. J. Biol. Chem. 2002, 277, 43866–43872. [Google Scholar] [CrossRef] [Green Version]
- Prieto-Dapena, P.; Castaño, R.; Almoguera, C.; Jordano, J. Improved resistance to controlled deterioration in transgenic seeds. Plant Physiol. 2006, 142, 1102–1112. [Google Scholar] [CrossRef] [Green Version]
- Prieto-Dapena, P.; Castaño, R.; Almoguera, C.; Jordano, J. The ectopic overexpression of a seed-specific transcription factor, HaHSFA9, confers tolerance to severe dehydration in vegetative organs. Plant J. 2008, 54, 1004–1014. [Google Scholar] [CrossRef]
- Almoguera, C.; Prieto-Dapena, P.; Personat, J.M.; Tejedor-Cano, J.; Lindahl, M.; Diaz-Espejo, A.; Jordano, J. Protection of the Photosynthetic Apparatus from Extreme Dehydration and Oxidative Stress in Seedlings of Transgenic Tobacco. PLoS ONE 2012, 7, e51443. [Google Scholar] [CrossRef] [Green Version]
- Tejedor-Cano, J.; Prieto-Dapena, P.; Almoguera, C.; Carranco, R.; Hiratsu, K.; Ohme-Takagi, M.; Jordano, J. Loss of function of the HSFA9 seed longevity program. Plant Cell Environ. 2010, 33, 1408–1417. [Google Scholar] [CrossRef]
- Tejedor-Cano, J.; Carranco, R.; Personat, J.-M.; Prieto-Dapena, P.; Almoguera, C.; Manuel Espinosa, J.; Jordano, J. A Passive Repression Mechanism that Hinders Synergic Transcriptional Activation by Heat Shock Factors Involved in Sunflower Seed Longevity. Mol. Plant 2014, 7, 256–259. [Google Scholar] [CrossRef] [Green Version]
- Carranco, R.; Espinosa, J.M.; Prieto-Dapena, P.; Almoguera, C.; Jordano, J. Repression by an auxin/indole acetic acid protein connects auxin signaling with heat shock factor-mediated seed longevity. Proc. Natl. Acad. Sci. USA 2010, 107, 21908–21913. [Google Scholar] [CrossRef] [Green Version]
- Personat, J.M.; Tejedor-Cano, J.; Prieto-Dapena, P.; Almoguera, C.; Jordano, J. Co-overexpression of two Heat Shock Factors results in enhanced seed longevity and in synergistic effects on seedling tolerance to severe dehydration and oxidative stress. BMC Plant Biol. 2014, 14, 56. [Google Scholar] [CrossRef] [Green Version]
- Pogson, B.J.; Ganguly, D.; Albrecht-Borth, V. Insights into chloroplast biogenesis and development. Biochimica et Biophysica Acta 2015, 1847, 1017–1024. [Google Scholar] [CrossRef] [PubMed] [Green Version]
- Franklin, K.A.; Quail, P.H. Phytochrome functions in Arabidopsis development. J. Exp. Bot 2010, 61, 11–24. [Google Scholar] [CrossRef] [PubMed] [Green Version]
- Chen, M.; Chory, J. Phytochrome signaling mechanisms and the control of plant development. Trends Cell Biol. 2011, 21, 664–671. [Google Scholar] [CrossRef] [PubMed] [Green Version]
- Wang, H.; Wang, H. Phytochrome signaling: Time to tighten up the loose ends. Mol. Plant 2015, 8, 540–551. [Google Scholar] [CrossRef] [Green Version]
- Chaves, I.; Pokorny, R.; Byrdin, M.; Hoang, N.; Ritz, T.; Brettel, K.; Essen, L.O.; Van Der Horst, G.T.J.; Batschauer, A.; Ahmad, M. The cryptochromes: Blue light photoreceptors in plants and animals. Annu. Rev. Plant Biol. 2011, 62, 335–364. [Google Scholar] [CrossRef]
- Christie, J.M. Phototropin blue-light receptors. Annu. Rev. Plant Biol. 2007, 58, 21–45. [Google Scholar] [CrossRef] [Green Version]
- Prieto-Dapena, P.; Almoguera, C.; Personat, J.M.; Merchan, F.; Jordano, J. Seed-specific transcription factor HSFA9 links late embryogenesis and early photomorphogenesis. J. Exp. Bot 2017, 68, 1097–1108. [Google Scholar] [CrossRef] [Green Version]
- Rojas, A.; Almoguera, C.; Carranco, R.; Scharf, K.D.; Jordano, J. Selective Activation of the Developmentally Regulated Hahsp17.6G1 Promoter by Heat Stress Transcription Factors. Plant Physiol. 2002, 129, 1207–1215. [Google Scholar] [CrossRef] [Green Version]
- Lin, C.; Ahmad, M.; Gordon, D.; Cashmore, A.R. Expression of an Arabidopsis cryptochrome gene in transgenic tobacco results in hypersensitivity to blue, UV-A, and green light. Proc. Natl. Acad. Sci. USA 1995, 92, 8423–8427. [Google Scholar] [CrossRef] [Green Version]
- Poppe, C.; Sweere, U.; Drumm-Herrel, H.; Schäfer, E. The blue light receptor cryptochrome 1 can act independently of phytochrome A and B in Arabidopsis thaliana. Plant J. 1998, 16, 465–471. [Google Scholar] [CrossRef] [PubMed] [Green Version]
- Kotak, S.; Port, M.; Ganguli, A.; Bicker, F.; Von Koskull-Doring, P. Characterization of C-terminal domains of Arabidopsis heat stress transcription factors (Hsfs) and identification of a new signature combination of plant class A Hsfs with AHA and NES motifs essential for activator function and intracellular localization. Plant J. 2004, 39, 98–112. [Google Scholar] [CrossRef] [PubMed]
- Hiratsu, K.; Matsui, K.; Koyama, T.; Ohme-Takagi, M. Dominant repression of target genes by chimeric repressors that include the EAR motif, a repression domain, in Arabidopsis. Plant J. 2003, 34, 733–739. [Google Scholar] [CrossRef] [PubMed]
- Rajjou, L.; Lovigny, Y.; Groot, S.P.; Belghazi, M.; Job, C.; Job, D. Proteome-wide characterization of seed aging in Arabidopsis: A comparison between artificial and natural aging protocols. Plant Physiol. 2008, 148, 620–641. [Google Scholar] [CrossRef] [PubMed] [Green Version]
- Sano, N.; Rajjou, L.; North, H.M.; Debeaujon, I.; Marion-Poll, A.; Seo, M. Staying Alive: Molecular Aspects of Seed Longevity. Plant Cell Physiol. 2016, 57, 660–674. [Google Scholar] [CrossRef] [Green Version]
- Leprince, O.; Buitink, J. Desiccation tolerance: From genomics to the field. Plant Sci. 2010, 179, 554–564. [Google Scholar] [CrossRef]
- Finch-Savage, W.E.; Bassel, G.W. Seed vigour and crop establishment: Extending performance beyond adaptation. J. Exp. Bot 2016, 67, 567–591. [Google Scholar] [CrossRef] [Green Version]
- Friedberg, J.N.; Bowley, S.R.; McKersie, B.D.; Gurley, W.B.; Czarnecka-Verner, E. Isolation and characterization of class A4 heat shock transcription factor from alfalfa. Plant Sci. 2006, 171, 332–344. [Google Scholar] [CrossRef]
- Baniwal, S.K.; Chan, K.Y.; Scharf, K.D.; Nover, L. Role of heat stress transcription factor HsfA5 as specific repressor of HsfA4. J. Biol. Chem. 2007, 282, 3605–3613. [Google Scholar] [CrossRef] [Green Version]
- Shim, D.; Hwang, J.U.; Lee, J.; Lee, S.; Choi, Y.; An, G.; Martinoia, E.; Lee, Y. Orthologs of the Class A4 Heat Shock Transcription Factor HsfA4a Confer Cadmium Tolerance in Wheat and Rice. Plant Cell 2009, 21, 4031–4043. [Google Scholar] [CrossRef] [Green Version]
- Lang, S.; Liu, X.; Xue, H.; Li, X.; Wang, X. Functional characterization of BnHSFA4a as a heat shock transcription factor in controlling the re-establishment of desiccation tolerance in seeds. J. Exp. Bot. 2017, 68, 2361–2375. [Google Scholar] [CrossRef]
- Sanchez-Lamas, M.; Lorenzo, C.D.; Cerdan, P.D. Bottom-up Assembly of the Phytochrome Network. PLoS Genet 2016, 12, e1006413. [Google Scholar] [CrossRef] [PubMed]
- Hloušková, P.; Bergougnoux, V. A subtracted cDNA library identifies genes up-regulated during PHOT1-mediated early step of de-etiolation in tomato (Solanum lycopersicum L.). BMC Genom. 2016, 17, 291. [Google Scholar] [CrossRef] [PubMed] [Green Version]
- Bourbousse, C.; Mestiri, I.; Zabulon, G.; Bourge, M.; Formiggini, F.; Koini, M.A.; Brown, S.C.; Fransz, P.; Bowler, C.; Barneche, F. Light signaling controls nuclear architecture reorganization during seedling establishment. Proc. Natl. Acad. Sci. USA 2015, 112, E2836–E2844. [Google Scholar] [CrossRef] [PubMed] [Green Version]
- Nicotiana tabacum Reference Genome. Available online: ftp://ftp.solgenomics.net/genomes/Nicotiana_tabacum/sierro_et_al_2014/assembly/Ntab-BX_AWOK-SS.fa.gz (accessed on 6 January 2020).
- Nicotiana tabacum Transcriptome. Available online: ftp://ftp.solgenomics.net/tobacco_genome/sierro_et_al_2014/annotation/Ntab-BX_AWOK-SS_Basma.mrna.annot.fna (accessed on 6 January 2020).
- Audic, S.; Claverie, J.M. The significance of digital gene expression profiles. Genome Res. 1997, 7, 986–995. [Google Scholar] [CrossRef]


© 2020 by the authors. Licensee MDPI, Basel, Switzerland. This article is an open access article distributed under the terms and conditions of the Creative Commons Attribution (CC BY) license (http://creativecommons.org/licenses/by/4.0/).
Share and Cite
Almoguera, C.; Prieto-Dapena, P.; Carranco, R.; Ruiz, J.L.; Jordano, J. Heat Stress Factors Expressed during Seed Maturation Differentially Regulate Seed Longevity and Seedling Greening. Plants 2020, 9, 335. https://doi.org/10.3390/plants9030335
Almoguera C, Prieto-Dapena P, Carranco R, Ruiz JL, Jordano J. Heat Stress Factors Expressed during Seed Maturation Differentially Regulate Seed Longevity and Seedling Greening. Plants. 2020; 9(3):335. https://doi.org/10.3390/plants9030335
Chicago/Turabian StyleAlmoguera, Concepción, Pilar Prieto-Dapena, Raúl Carranco, José Luis Ruiz, and Juan Jordano. 2020. "Heat Stress Factors Expressed during Seed Maturation Differentially Regulate Seed Longevity and Seedling Greening" Plants 9, no. 3: 335. https://doi.org/10.3390/plants9030335