Article

Analysis of Pilot-Induced-Oscillation and Pilot Vehicle System Stability Using UAS Flight Experiments

Department of Mechanical and Aerospace Engineering, West Virginia University, Morgantown, WV 26506, USA
*
Author to whom correspondence should be addressed.
Aerospace 2016, 3(4), 42; https://doi.org/10.3390/aerospace3040042
Submission received: 15 August 2016 / Revised: 6 November 2016 / Accepted: 14 November 2016 / Published: 29 November 2016
(This article belongs to the Collection Unmanned Aerial Systems)

Abstract

:
This paper reports the results of a Pilot-Induced Oscillation (PIO) and human pilot control characterization study performed using flight data collected with a Remotely Controlled (R/C) unmanned research aircraft. The study was carried out on the longitudinal axis of the aircraft. Several existing Category 1 and Category 2 PIO criteria developed for manned aircraft are first surveyed and their effectiveness for predicting the PIO susceptibility for the R/C unmanned aircraft is evaluated using several flight experiments. It was found that the Bandwidth/Pitch rate overshoot and open loop onset point (OLOP) criteria prediction results matched flight test observations. However, other criteria failed to provide accurate prediction results. To further characterize the human pilot control behavior during these experiments, a quasi-linear pilot model is used. The parameters of the pilot model estimated using data obtained from flight tests are then used to obtain information about the stability of the Pilot Vehicle System (PVS) for Category 1 PIOs occurred during straight and level flights. The batch estimation technique used to estimate the parameters of the quasi-linear pilot model failed to completely capture the compatibility nature of the human pilot. The estimation results however provided valuable insights into the frequency characteristics of the human pilot commands. Additionally, stability analysis of the Category 2 PIOs for elevator actuator rate limiting is carried out using simulations and the results are compared with actual flight results.

Graphical Abstract

1. Introduction

There has been a surge in the use of Unmanned Aircraft System (UAS) in recent years due to their low-cost and versatility in applications such as product delivery, routine surveillance, resource management, disaster response, agriculture, etc. However, UAS development often does not face the same design and testing rigor that is typical of a manned aircraft. With an increase in UAS application the question of integrating them safely into the airspace shared with manned aircraft needs to be addressed. Due to the fact that many (although with a decreasing percentage) small UAS today are still fully or partially controlled by a ground pilot, a poorly designed UAS with inadequate performance characteristics or handling qualities could lead to safety concerns.
One of the serious effects of inadequate design consideration towards human–UAS interaction is the Pilot Induced Oscillation (PIO). Military Standard Flying Qualities of Piloted Aircraft (MIL-STD 1797A) [1] defines PIO to be “sustained or uncontrollable oscillations resulting from efforts of the pilot to control the aircraft”. It usually occurs when the pilot is involved in a highly demanding task and a trigger which interrupts the task and make pilot go out of sync with respect to the aircraft. Typical trigger events are control mode shifting, change in dynamics, atmospheric effects etc. Despite many research efforts studying PIO for full-scale manned aircraft, there has only been limited study on the remote control of unmanned aircraft [2,3,4], where the aircraft is generally smaller and the human pilot is not physically present inside the aircraft.
PIO can be categorized based on the underlying linear or non-linear causes. In existing literature, there are three commonly accepted categories of PIO as outlined in a 1997 summary report by the NRC Committee [5] on Effects of Aircraft-Pilot Coupling on Flight Safety, which are as follows.
Category 1 PIO: Characterized by oscillations with an underlying linear cause such as excessive time delay, phase loss, etc., which makes it easy to understand and study. Several criteria for manned aircraft focusing on excessive phase loss and time delay have already been developed. Certain criteria are based on open-loop analysis such as the Bandwidth/Pitch rate overshoot criteria [6,7], while criteria such as Neal-Smith [8] is a closed-loop analysis method with an assumed pilot model.
Category 2 PIO: Characterized by nonlinear events which can be modeled as Quasi-linear events such as actuator rate limiting or amplitude limiting, etc. This is the most common type of PIO observed. Most PIOs associated with non-linear events were found to be “cliff-like” [5]; that is, the pilot reported the onset of the PIO as sudden and unexpected. Since control surface actuator rate limiting is a common non-linearity associated with modern flight control systems [9,10,11], most of the studies are focused on studying its influence on aircraft handling quality and PIO. Currently, Open Loop Onset Point (OLOP) developed by Holger Duda at Deutsches Zentrum für Luft-und Raumfahrt e.V. (DLR) is the only commonly accepted criterion for Category 2 PIO resulting from rate limited actuator in the fully rate saturated case [6,7].
Category 3 PIO: This category of PIO is caused by highly nonlinear events which involve transition in the control element of the aircraft or the human pilot behavioral dynamics. The non-linearities associated are more complex and cannot be modeled as quasi-linear effects. The PIOs associated with this category are also “cliff-like” [5]. Category 3 PIOs are difficult to recognize and are relatively rare, but could be highly dangerous when they do occur.
Due to a lack of PIO criteria for unmanned aircraft, in this paper, the existing PIO criteria developed for manned aircraft are first evaluated using UAS experiments. One advantage of studying PIO on UAS is that human life is not in danger due to PIO accidents; however, the lack of motion cues and pucker factor may render existing PIO criteria for manned aircraft ineffective on unmanned systems. Filling this knowledge gap was one of the main motivations for carrying out this research.
For simple flying conditions consisting of a single-input single-output task (e.g., maintaining a constant pitch attitude) a human pilot can be satisfactorily represented as a quasi-linear system with a linear component consisting of corresponding gain, lead, lag, time delay and a non-linear remnant [12]. This quasi-linear model may not necessarily replicate the human pilot output or control decision making process exactly, but it is capable of giving basic information about the frequency properties and stability limits of the human controller for control tasks in systems such as aircraft or automobiles [5,13].
When flying an aircraft, a human pilot can change the control mode or use different control parameters to obtain satisfactory performance under different operating conditions [13,14,15]. Therefore, there is a need to estimate the parameters of a quasi-linear control-theoretic pilot model. With these parameters, the assumed pilot control model structure, and the aircraft model, the closed-loop Pilot-Vehicle System (PVS) stability can be evaluated.
One way of estimating the parameters of a quasi-linear pilot model is through batch estimation using techniques such as maximum likelihood estimator and non-linear least squares estimator [16,17]. The batch estimation has the inherent assumption that the pilot model parameters are invariant for the data sets used for estimation. This can be reasonably true if the flight conditions are not changing quickly but it is not guaranteed. The parameters obtained from batch estimation may not provide us with variation in human pilot control but they provide the average values that can be useful for post-flight PVS stability studies for understanding the flight results.
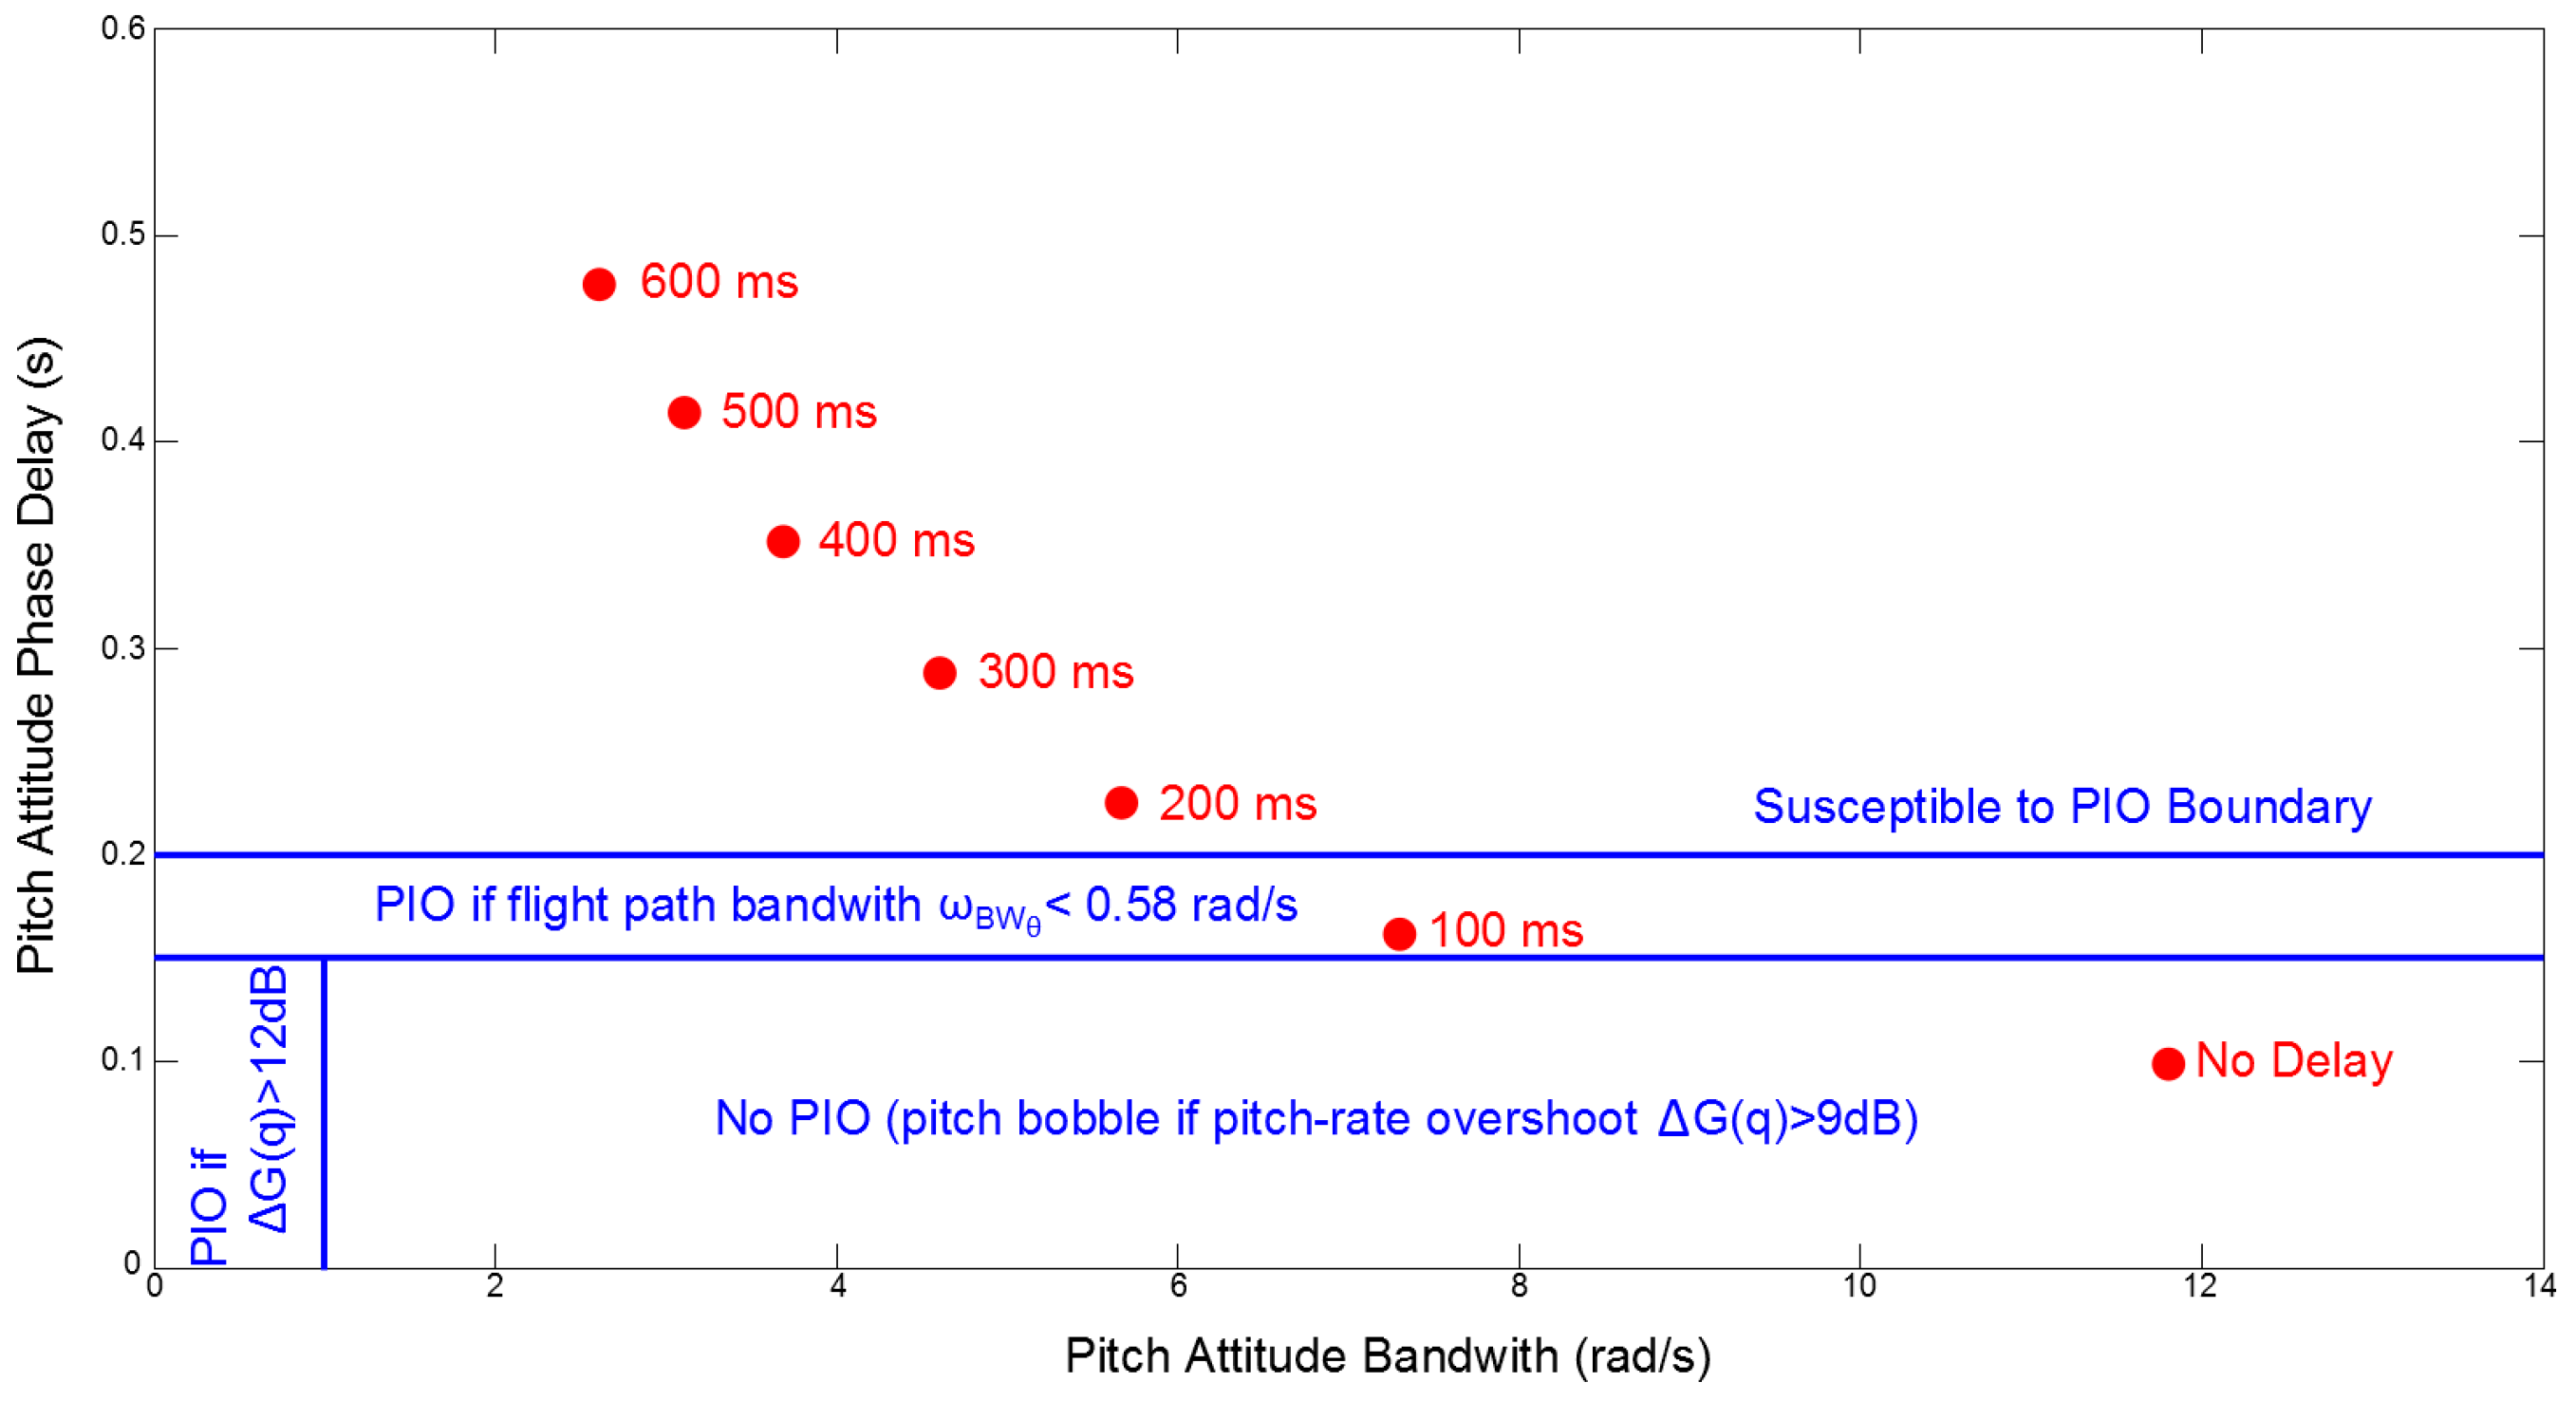
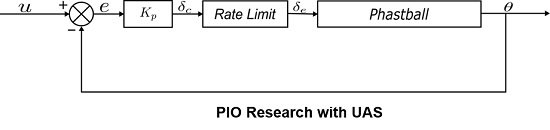
This paper builds on our previous PIO research carried out on an Remotely Controlled (R/C) research aircraft “Phastball” [18] at West Virginia University (WVU) by adding the “Phase Rate and Gain Phase Template Criterion” for Category 1 PIO susceptibility prediction and closed-loop PVS stability studies using the pilot model obtained in Mandal, et al. [19]. The research in this paper aims at laying the ground work for other researchers who plan to study PIO and human control behavior on R/C aircraft.
The rest of the paper is organized as follows. Section 2 presents a summary of flight experiments carried out at WVU for PIO and Human Pilot model parameter estimation. 
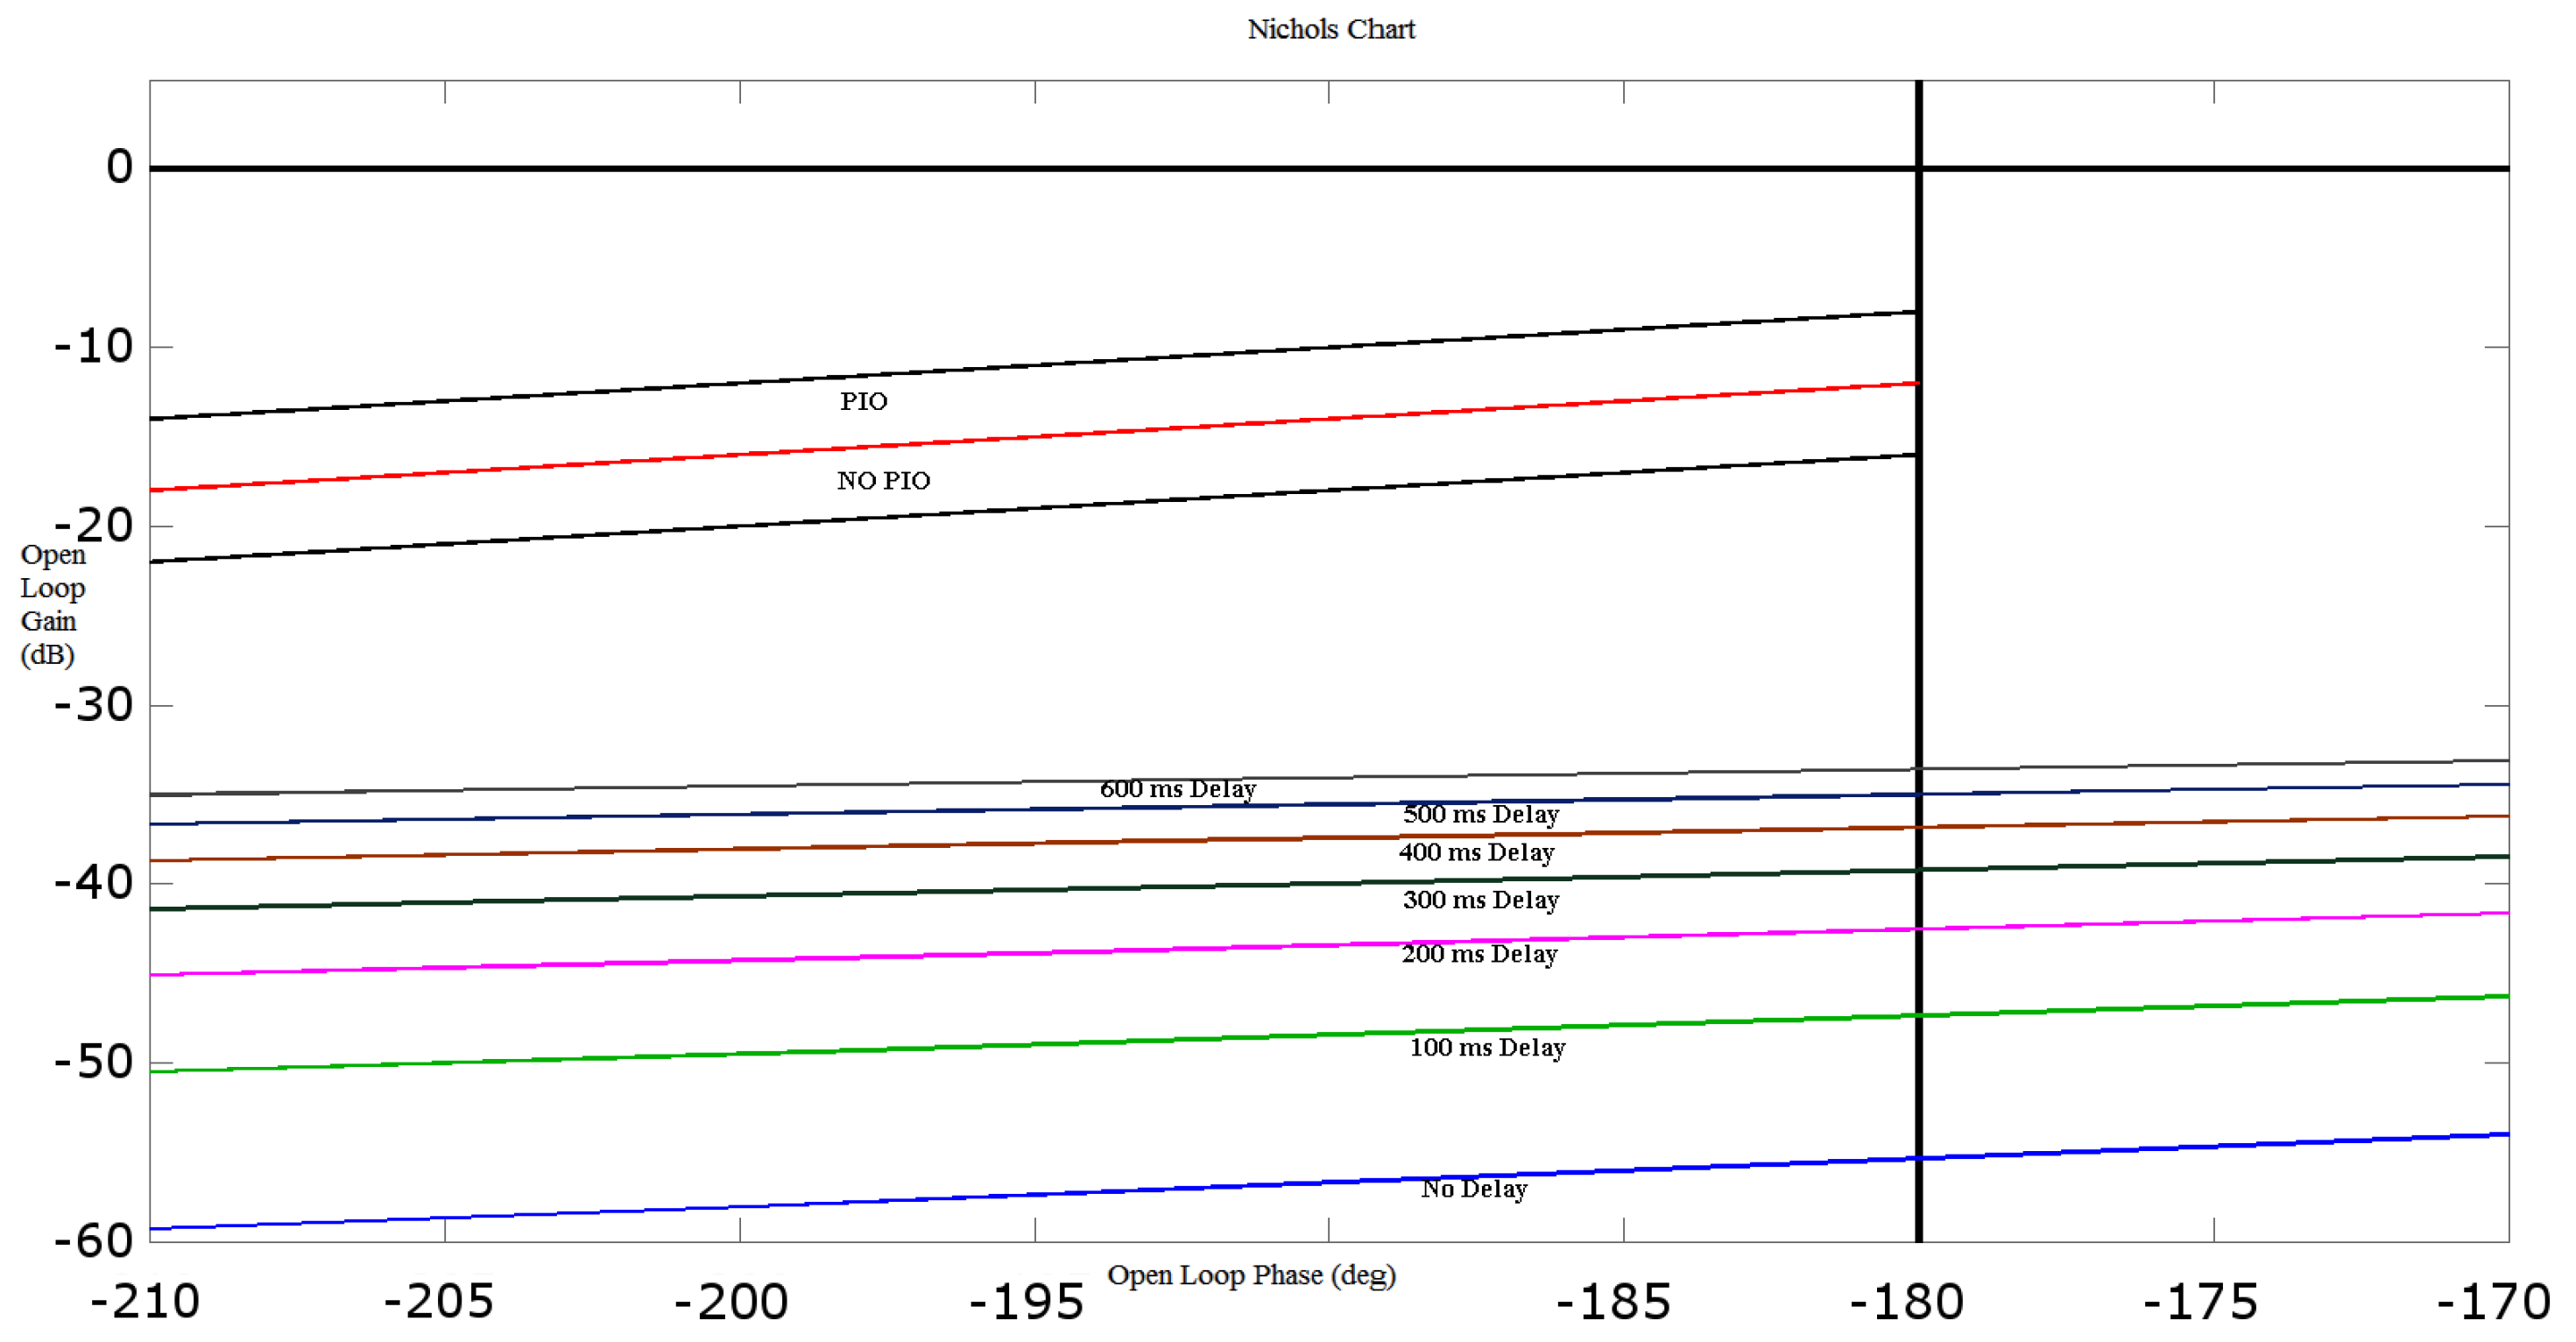
Section 3 presents a survey of Category 1 and 2 PIO analysis methods along with their ability in predicting the PIO susceptibility of “Phastball”. Section 4 consists of analysis of pilot commands in the flight data and parameter estimation carried out for the McRuer pilot model. Section 5 contains stability analysis for Category 1 and 2 PIO using both simulations and linear system control theory and is followed by conclusions in Section 6.

2. Flight Experiments

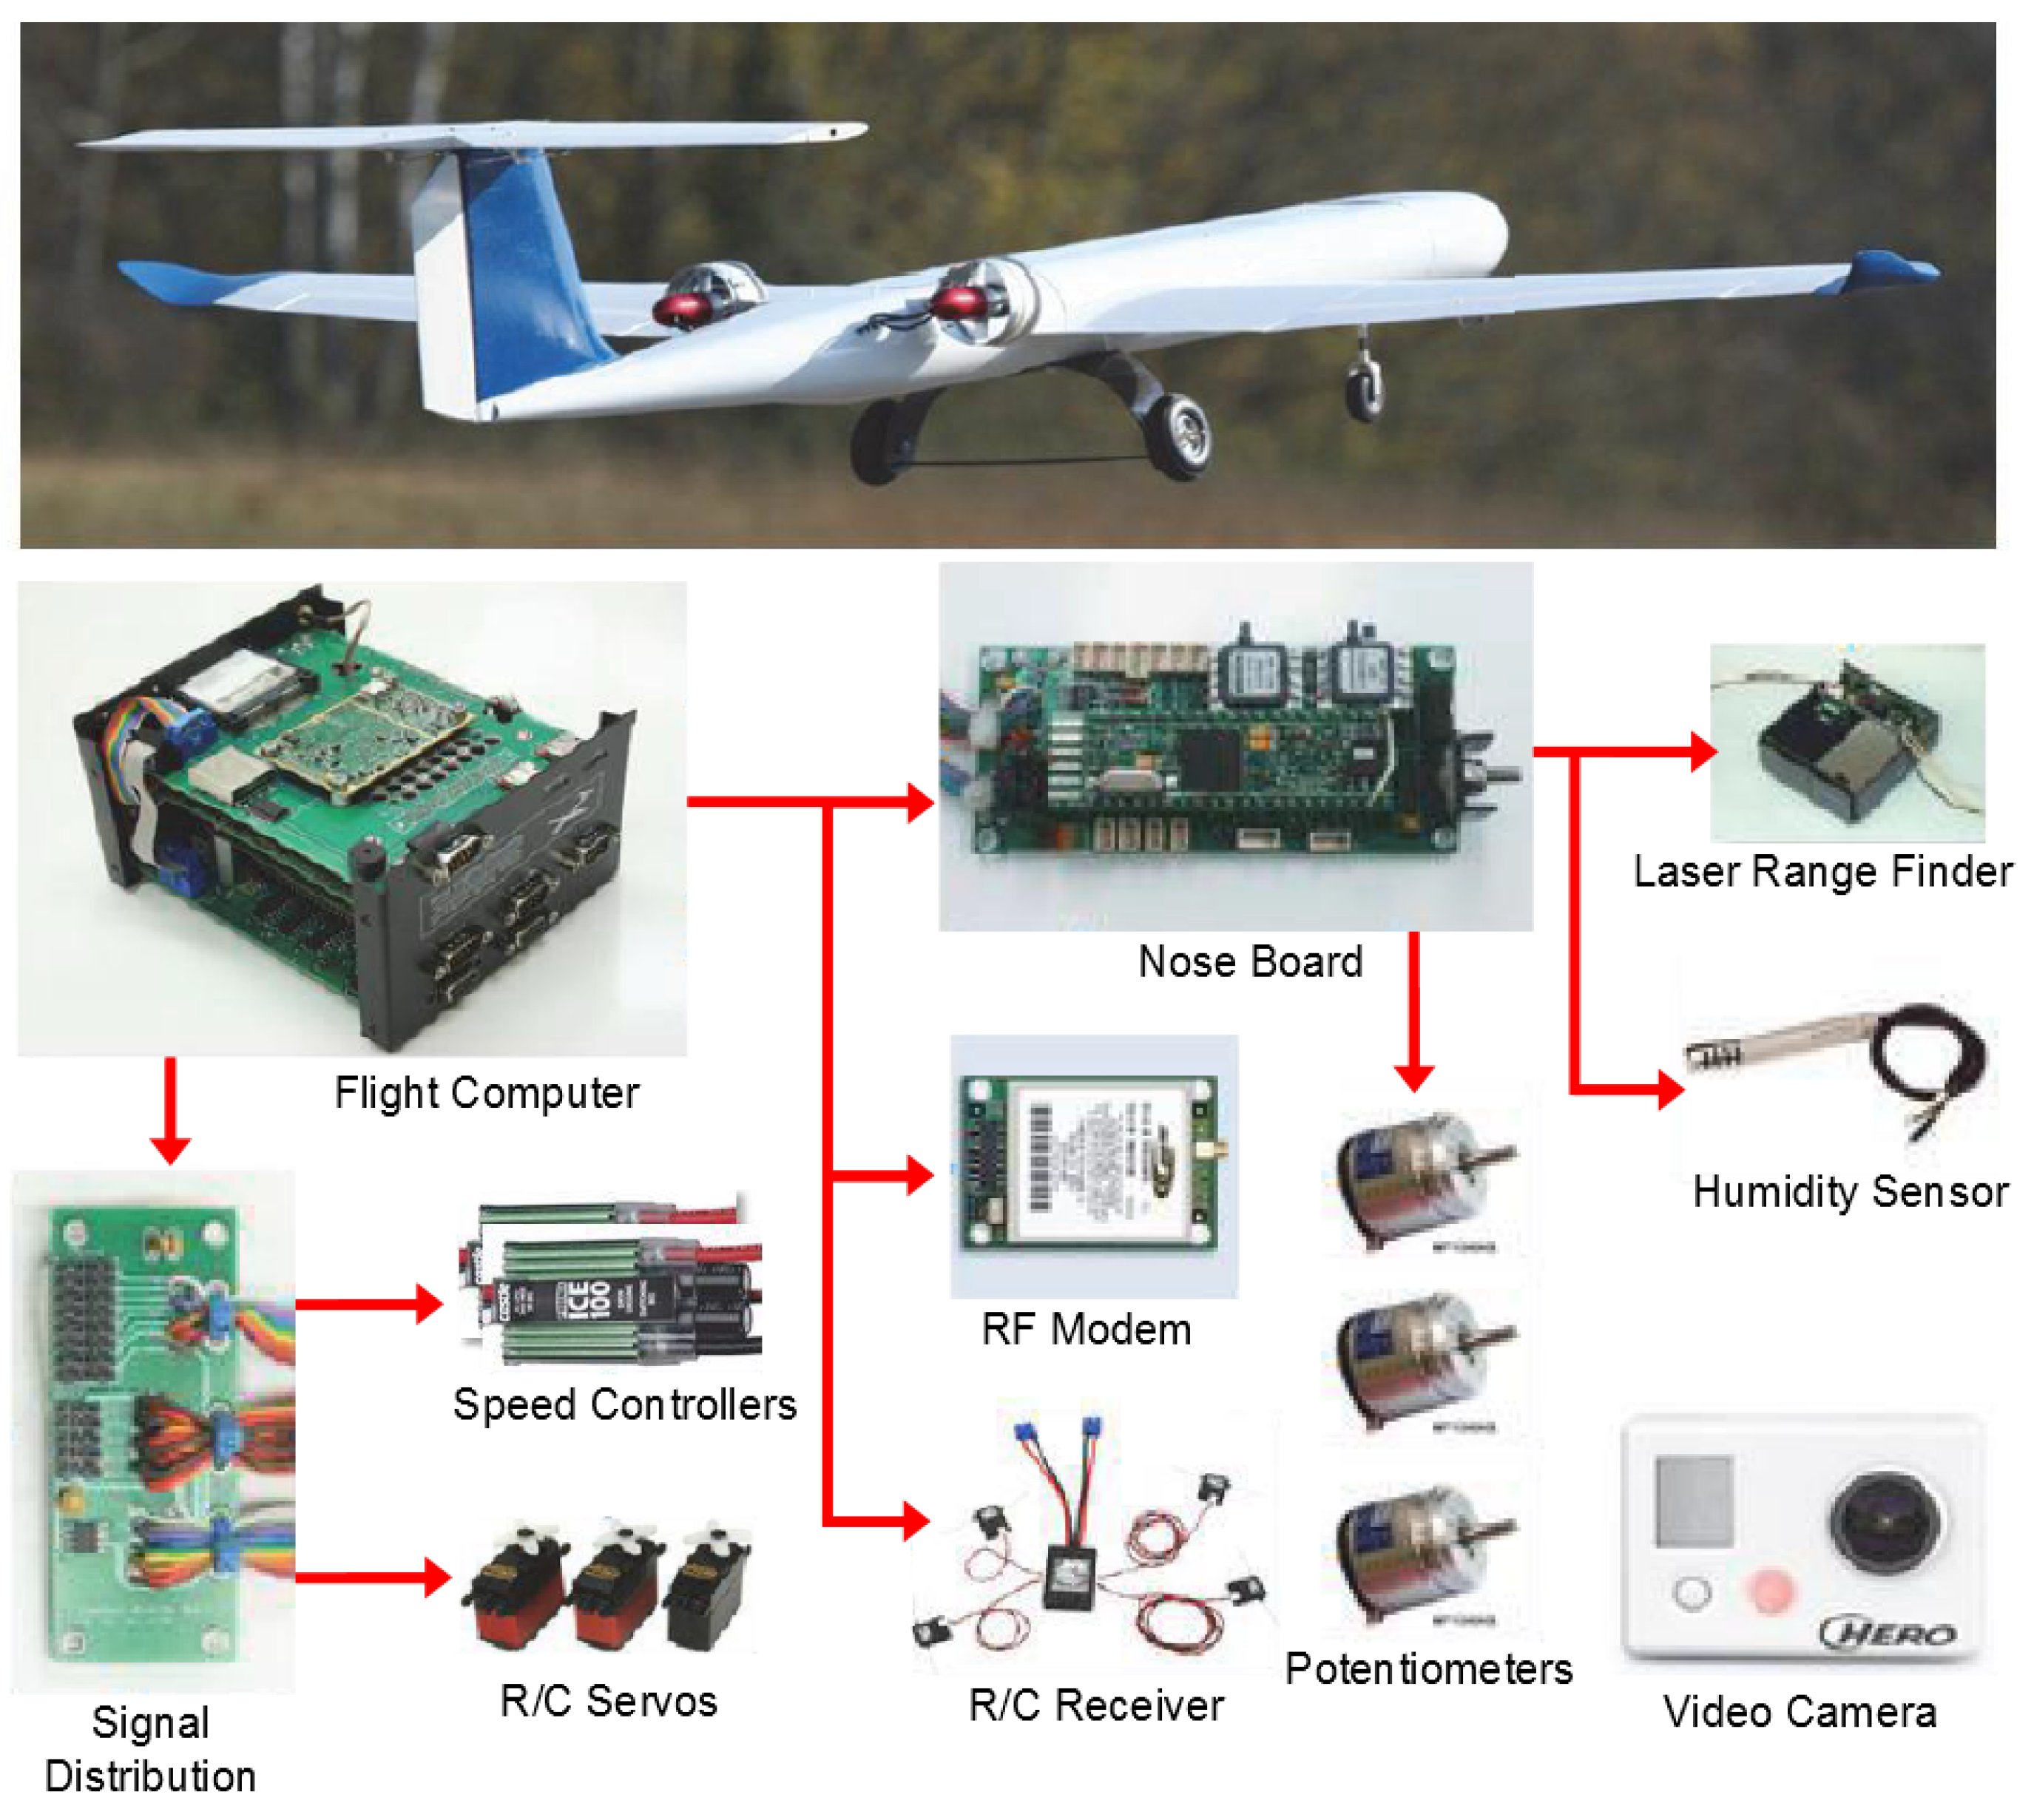
“Phastball” is equipped with a Gen-V avionics developed at WVU [20,21] shown in Figure 1. It can perform functions including data acquisition, signal conditioning and distribution, global positioning system/inertial navigation system (GPS/INS) sensor fusion, Guidance Navigation and Control (GNC), failure emulation, and aircraft health monitoring. Processes such as attitude estimation, data logging, and actuator command generation takes place at 50 Hz in the Gen-V avionics [22].
During “Phastball” flight the pilot can choose to operate in the Pilot-In-Loop (PIL) or Non-PIL modes. In PIL mode the pilot commands are read, processed, and modified by the avionics before being sent to actuators. Whereas in Non-PIL mode, the pilot commands are simply recorded by the avionics and sent directly to actuators. The extra data processing and modification in PIL mode adds additional time delay between the pilot command and the actuator movement. The measured system latency when PIL experiments were carried out was found to be 170 ms and in Non-PIL mode the measured system latency was found to be 70 ms. These latency values were measured pre-flight. It is assumed to be constant as long as the system in unchanged, more details can be found in Mandal et al. [18]. Information about this delay is important as its value affects the stability analysis of the pilot vehicle system.
All experiments were carried out for the longitudinal axis of “Phastball”. Three pilots were recruited for this study who were highly experienced (>15 years of experience in R/C aircraft flying). The flight trajectory followed during flight tests is elliptical in shape [
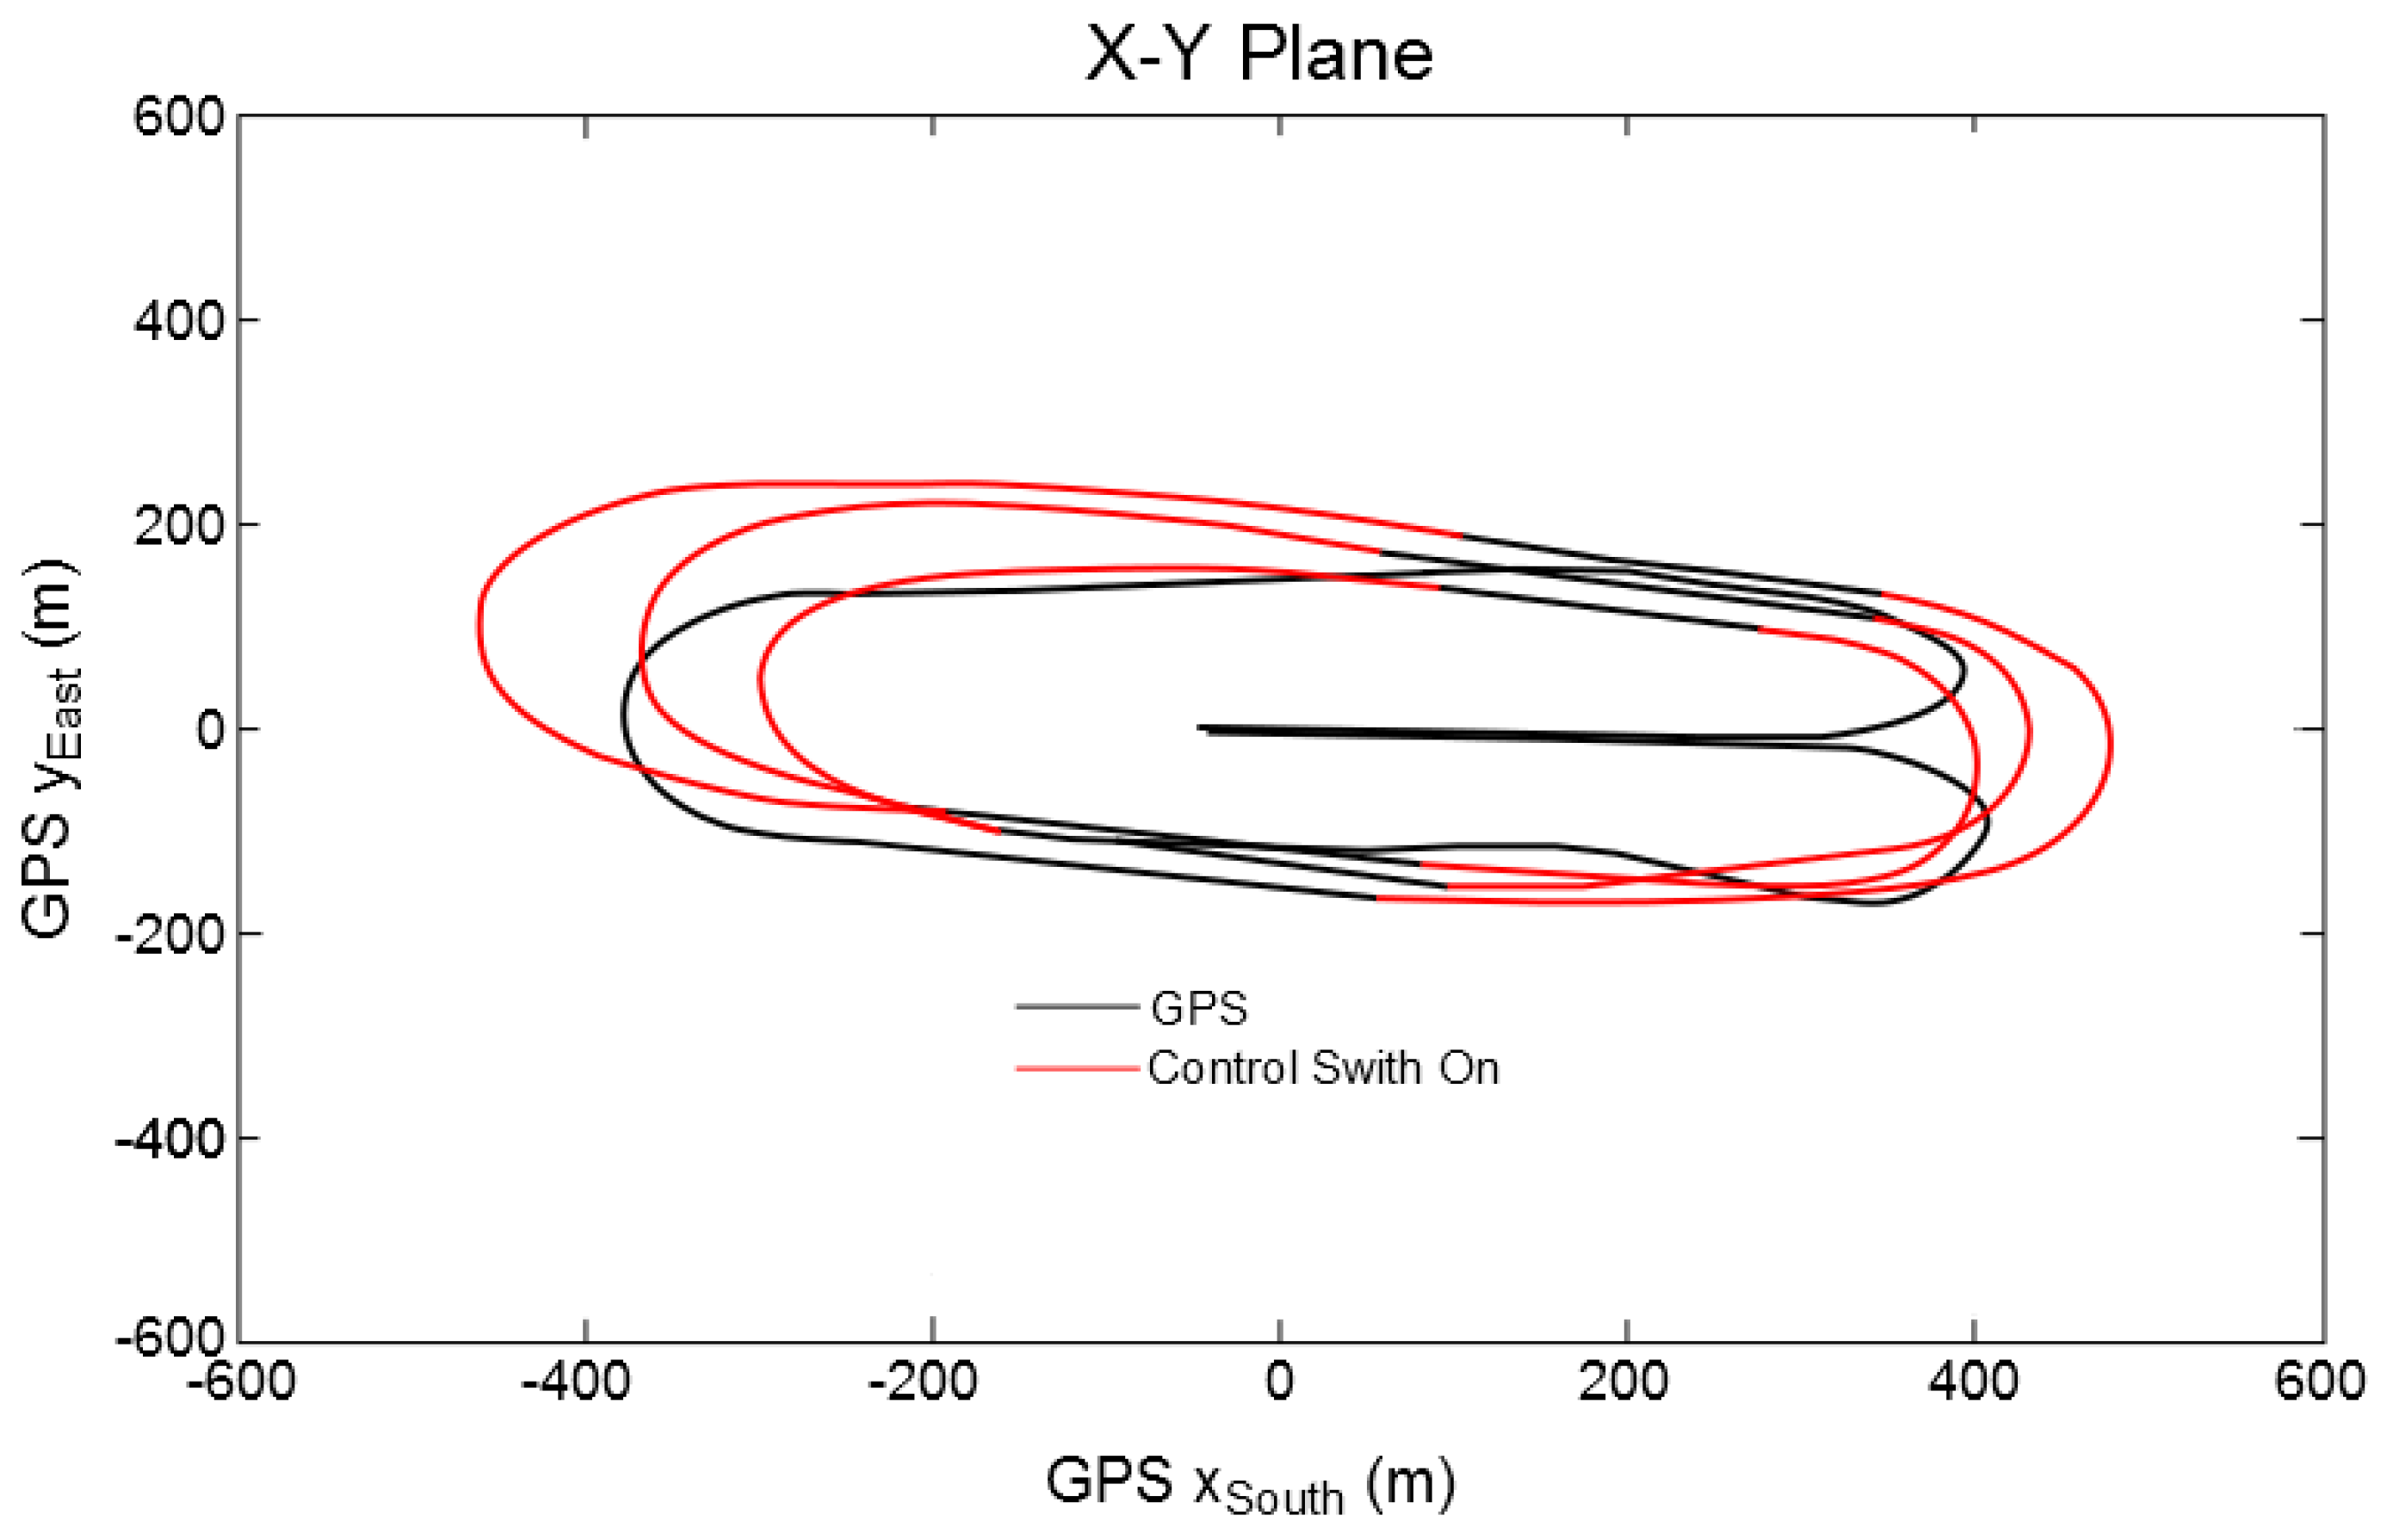
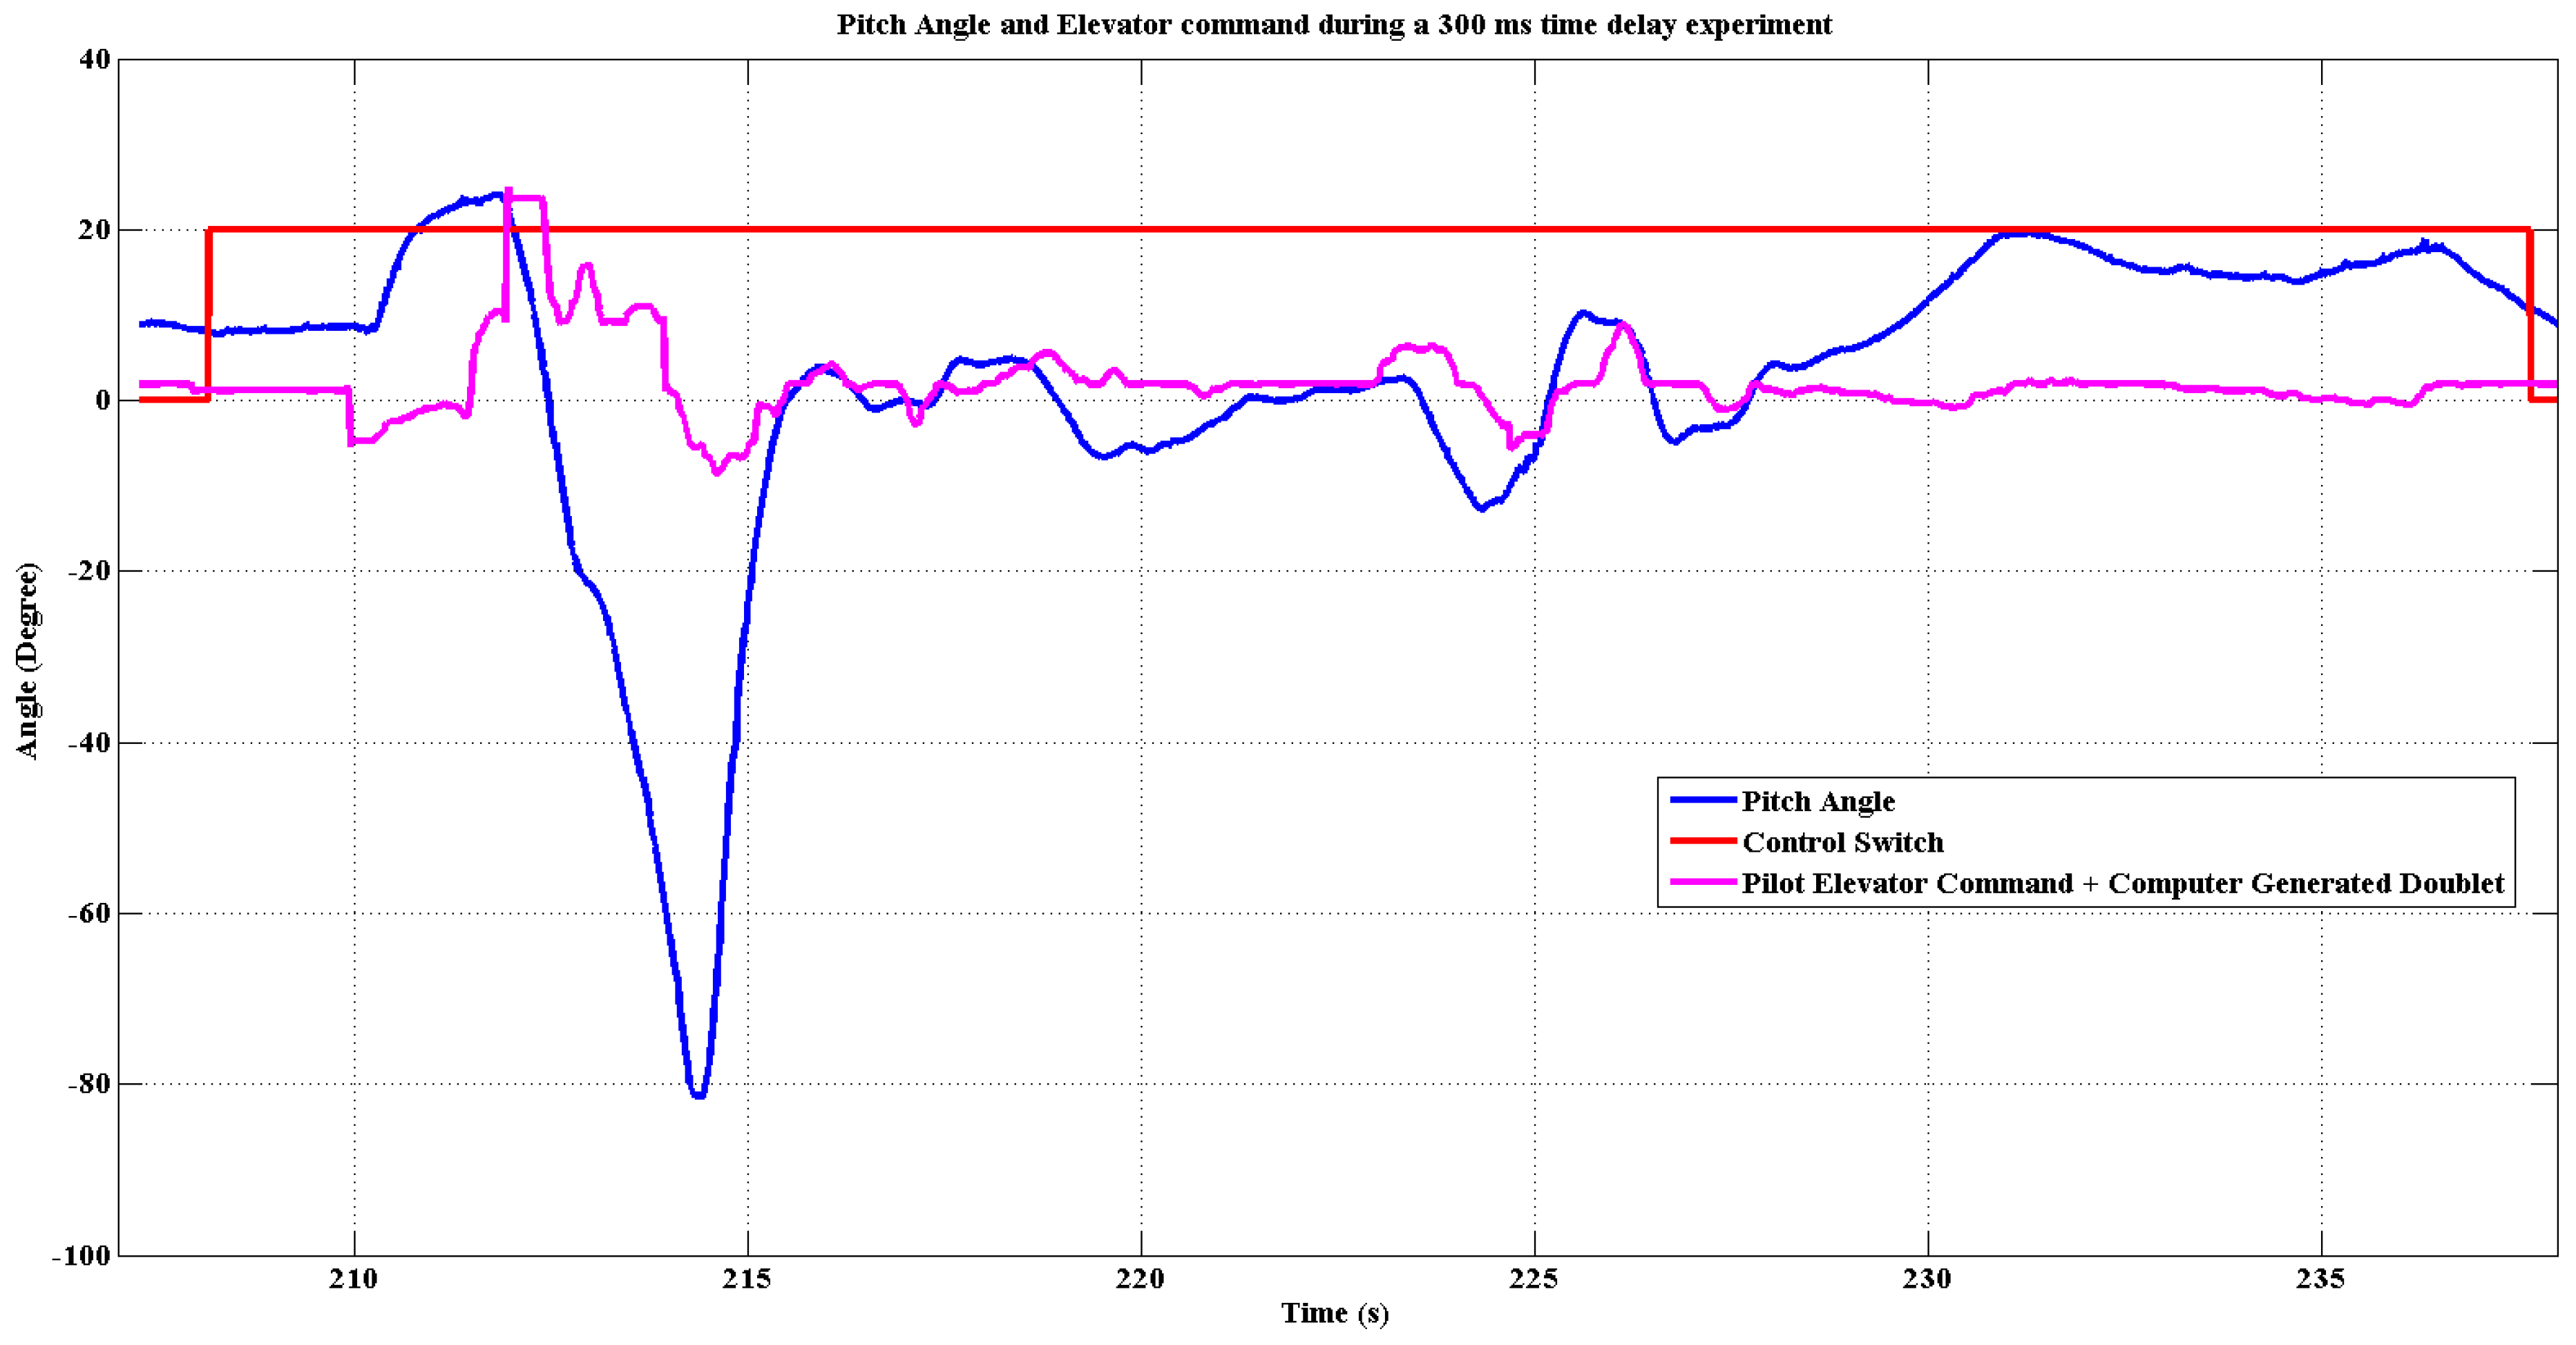
21] which is followed in a counter-clockwise direction. All PIO experiments take place in PIL mode and the flight experiments conducted in Non-PIL mode (no delay injection or rate limiting of the actuators) acts as control and provides a baseline for PIO experiments. The experiment starts when when the pilot activates a control switch. The control switch is a switch on the R/C transmitter which is used by the pilot to notify the on-board computer to trigger a special event such as adding delay or rate limiting to pilot commands. Immediately after the activation of the control switch the on-board computer also generates an elevator doublet to perturb the aircraft state, prompting pilot controls for stabilizing the flight trajectory. Figure 2 shows a test flight trajectory with multiple control switch activations. During the flight the pilot location is approximately at (100,0) coordinate point in Figure 2 and he/she uses visual reference for feedback.
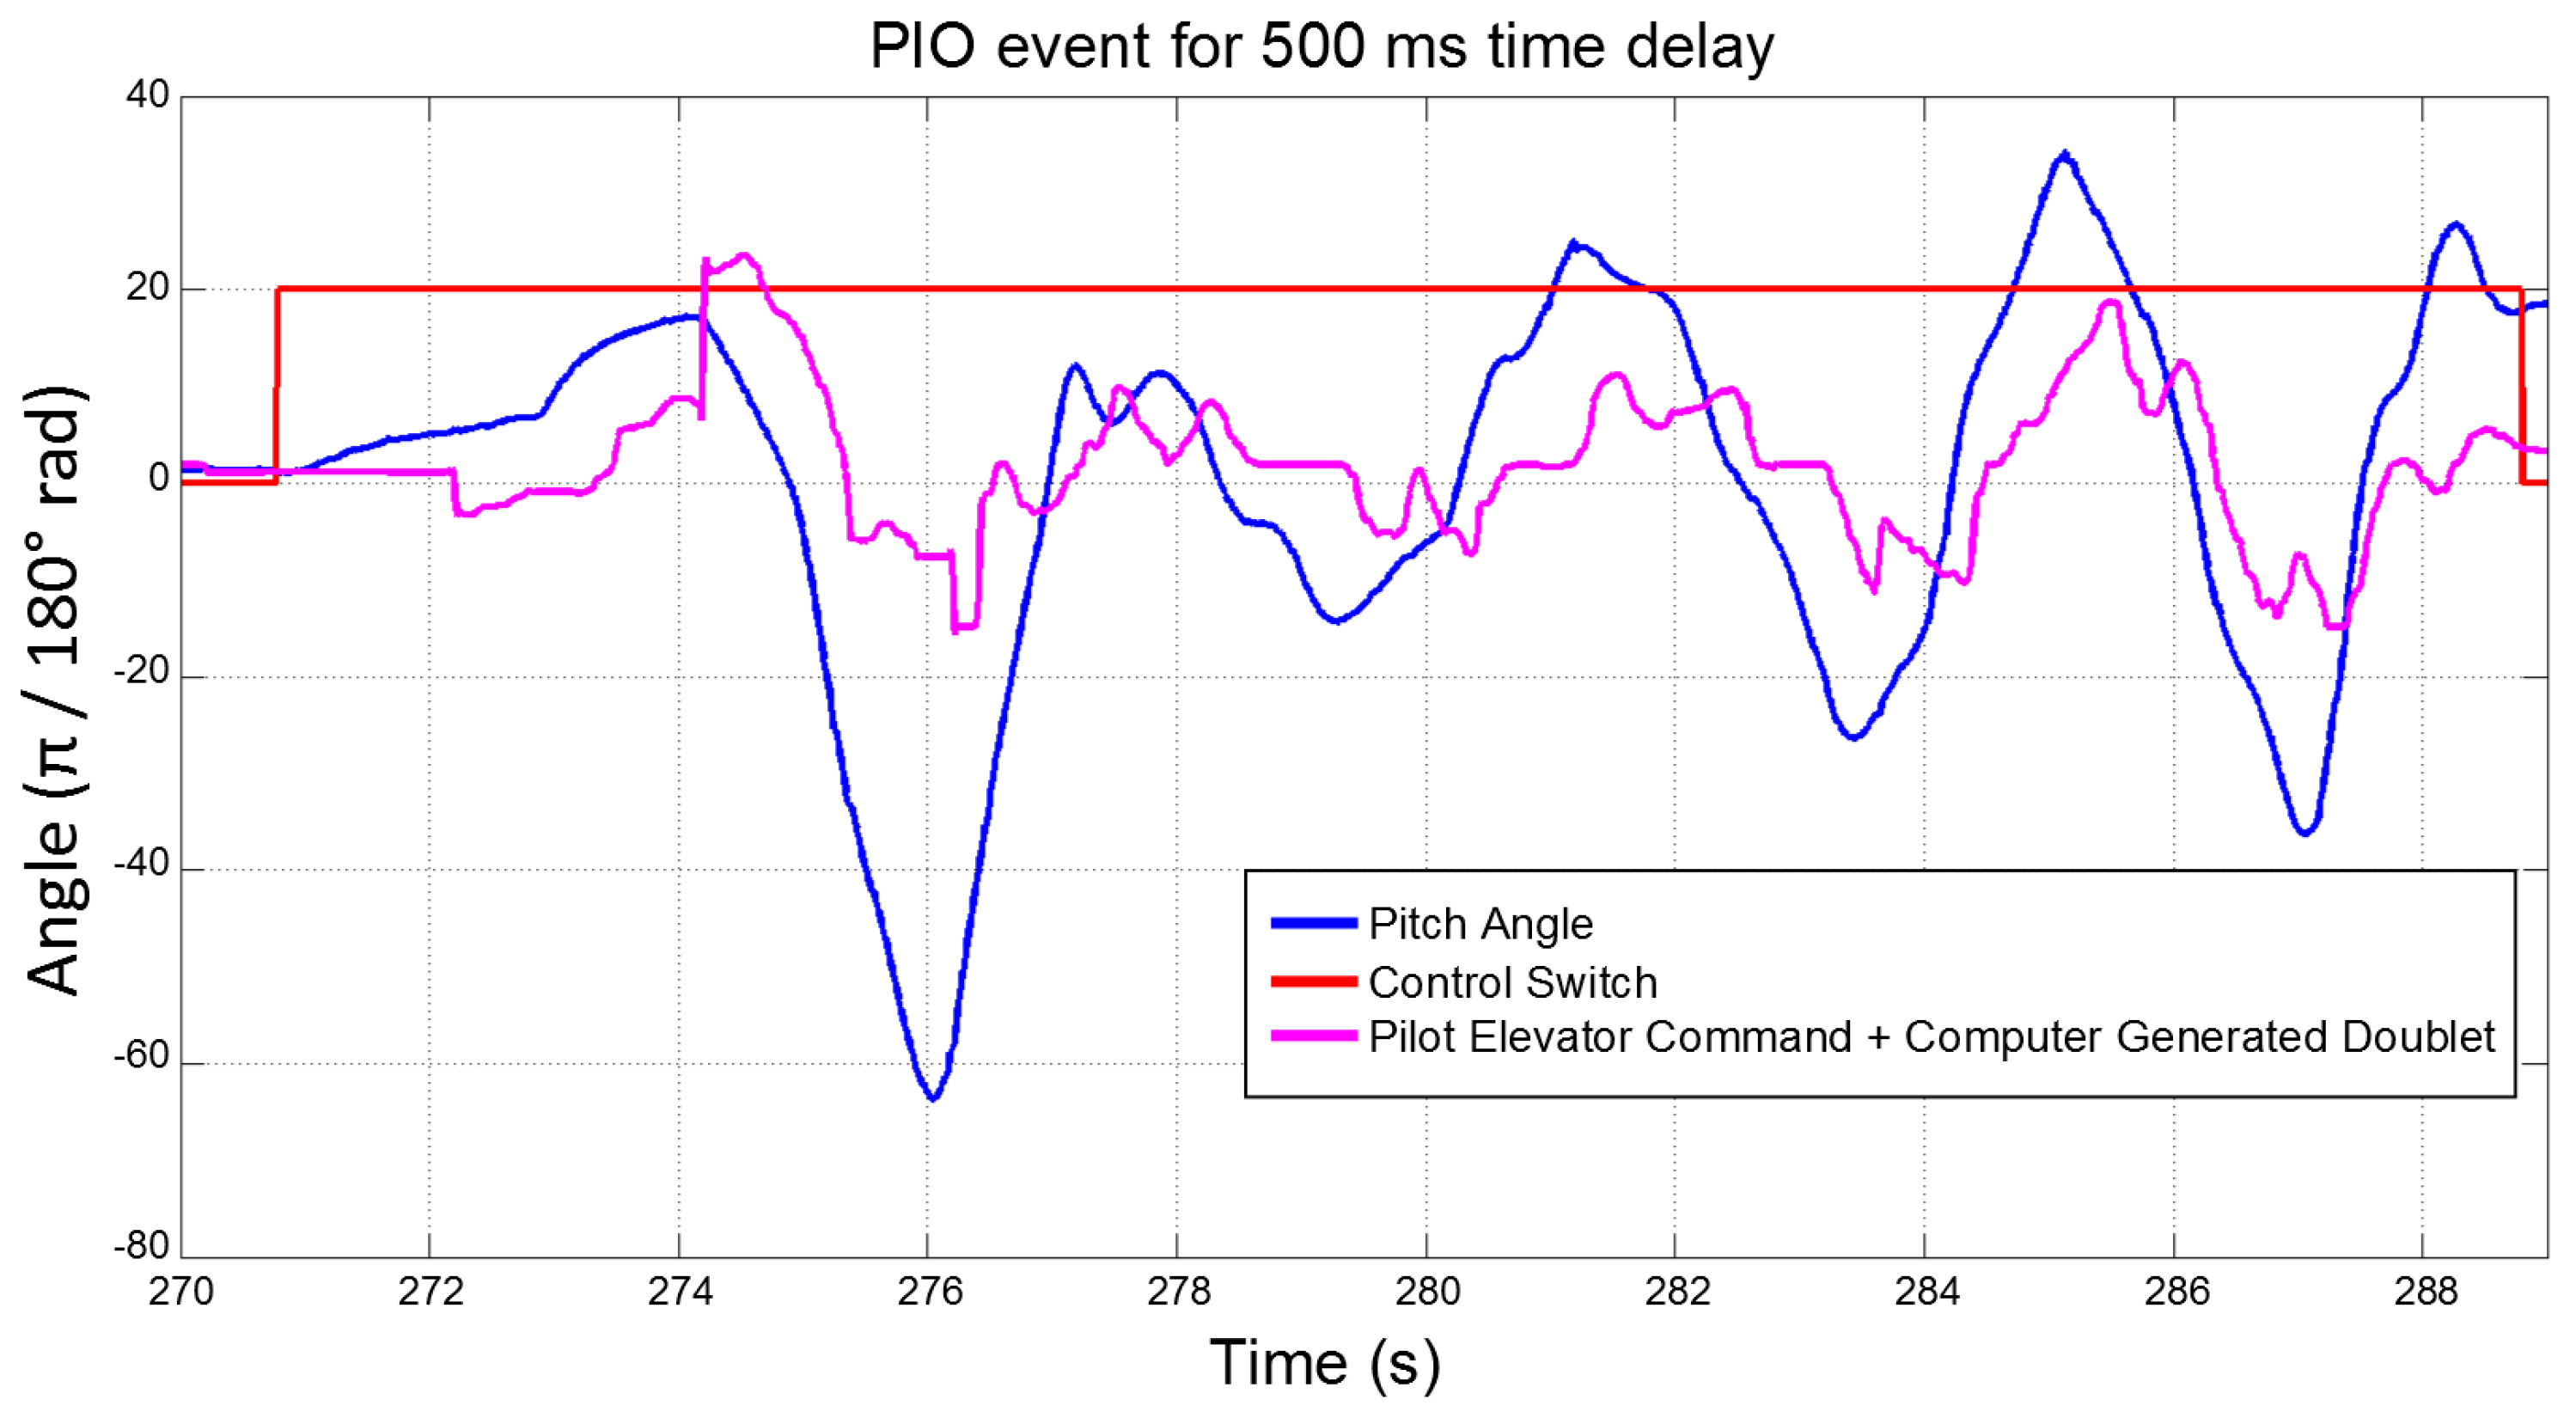
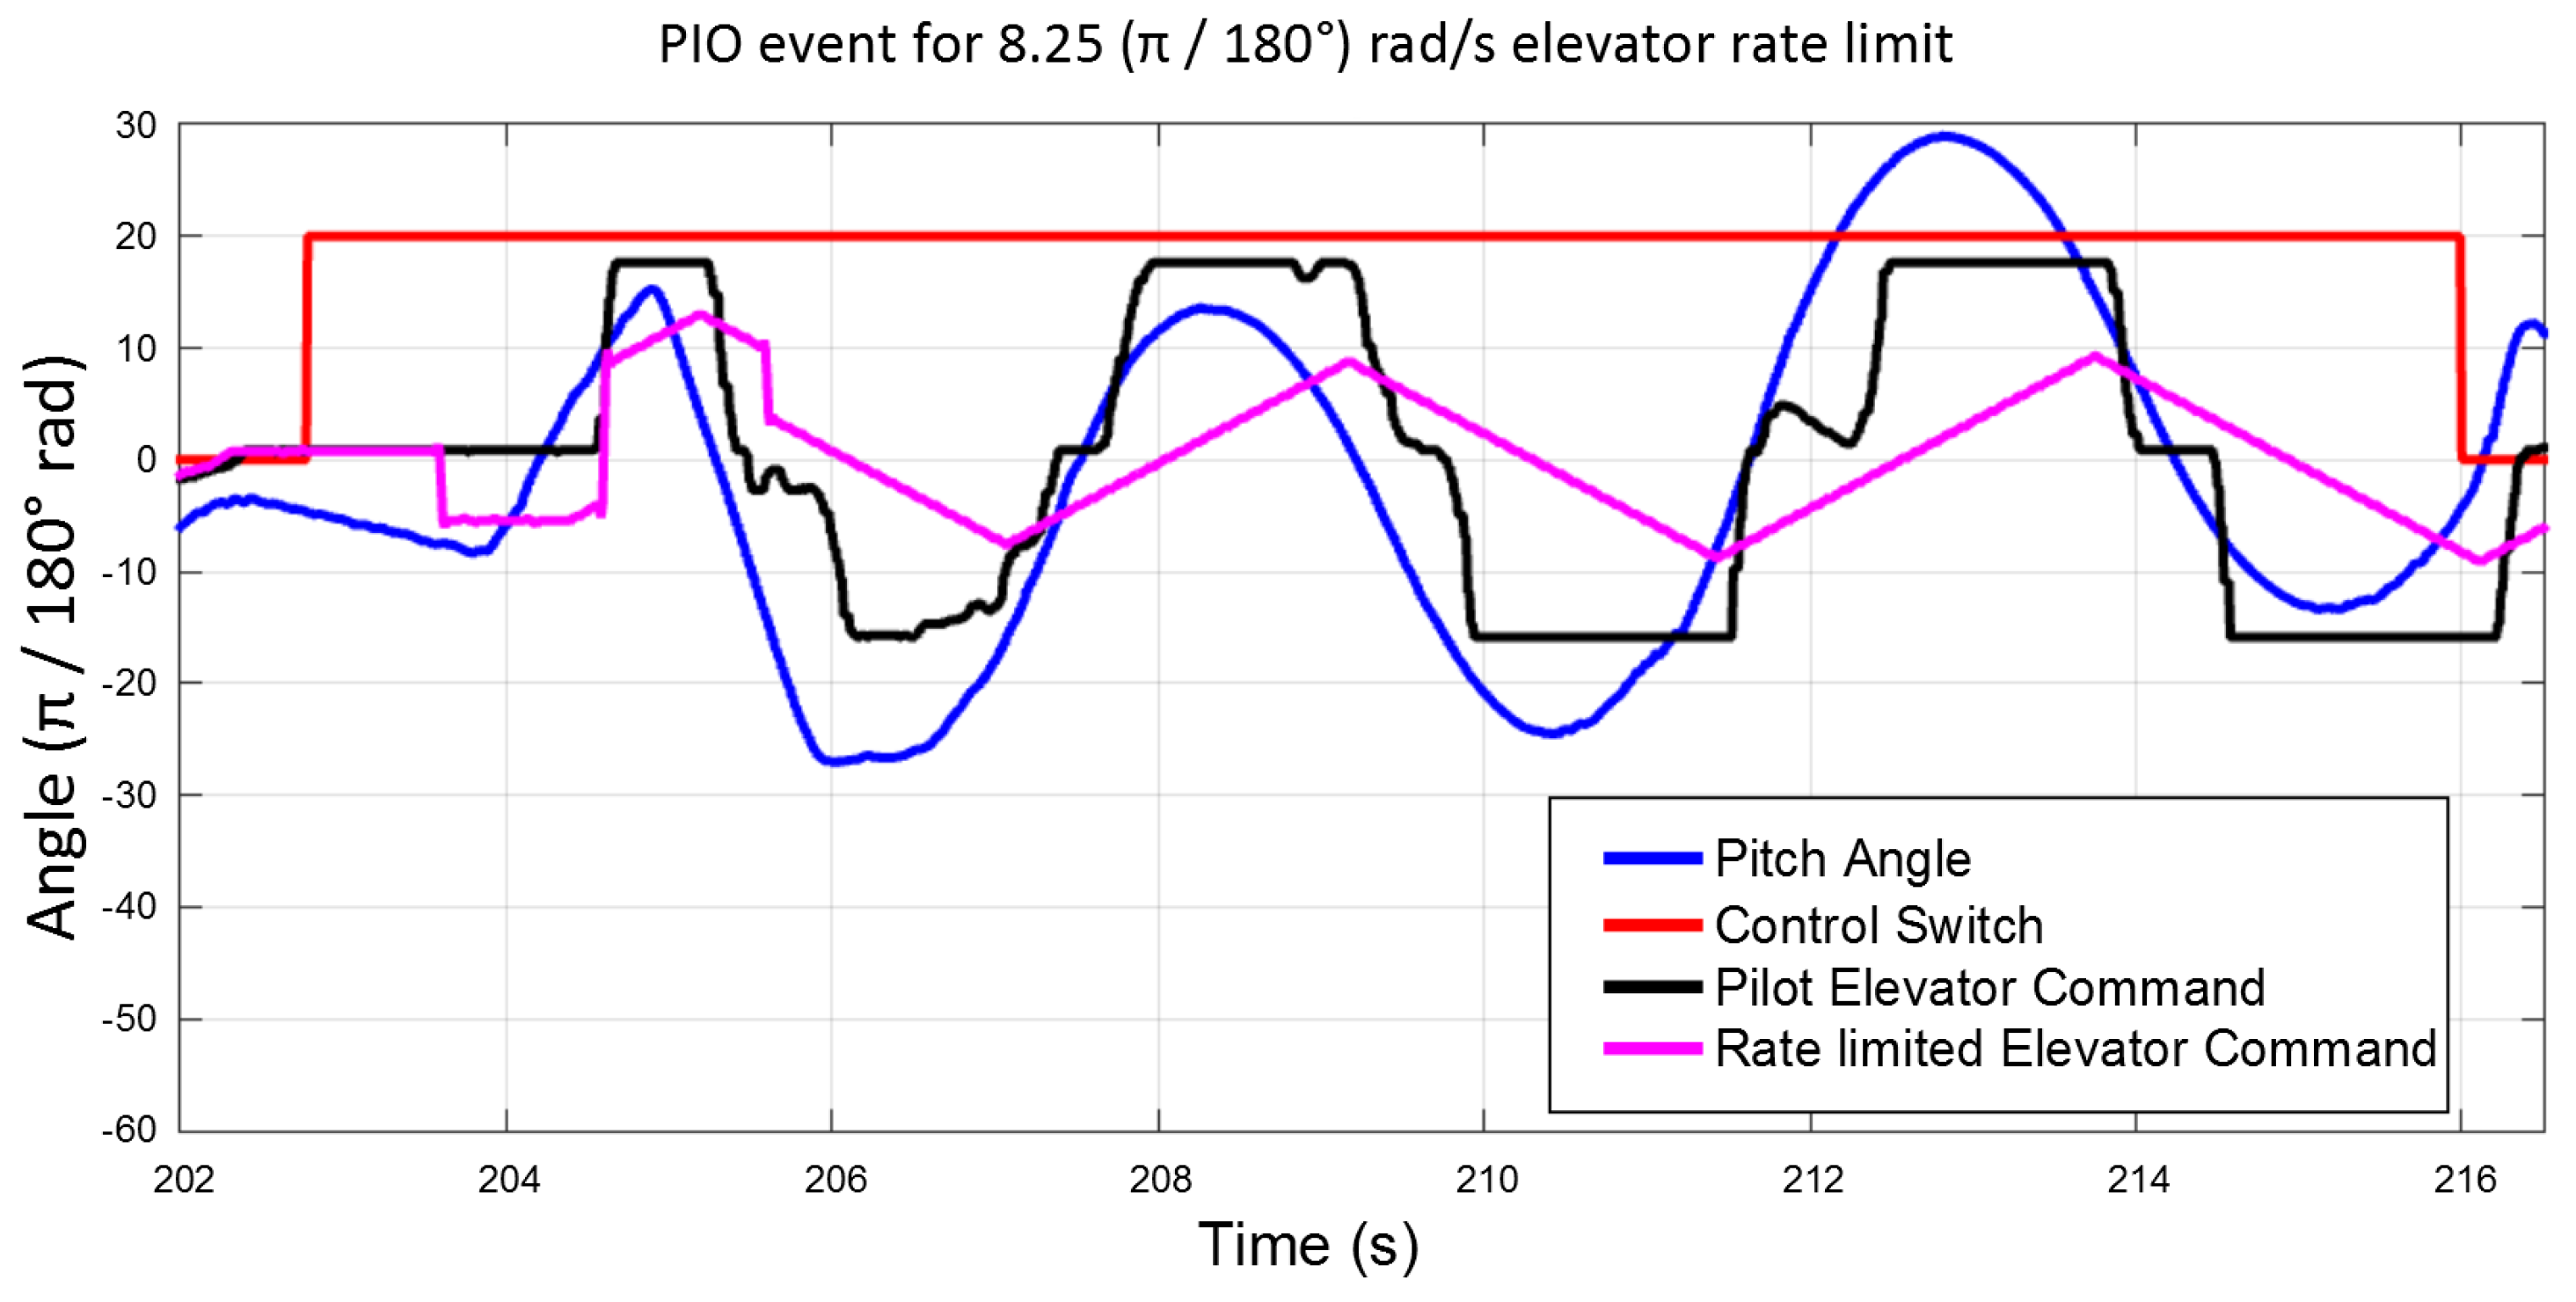
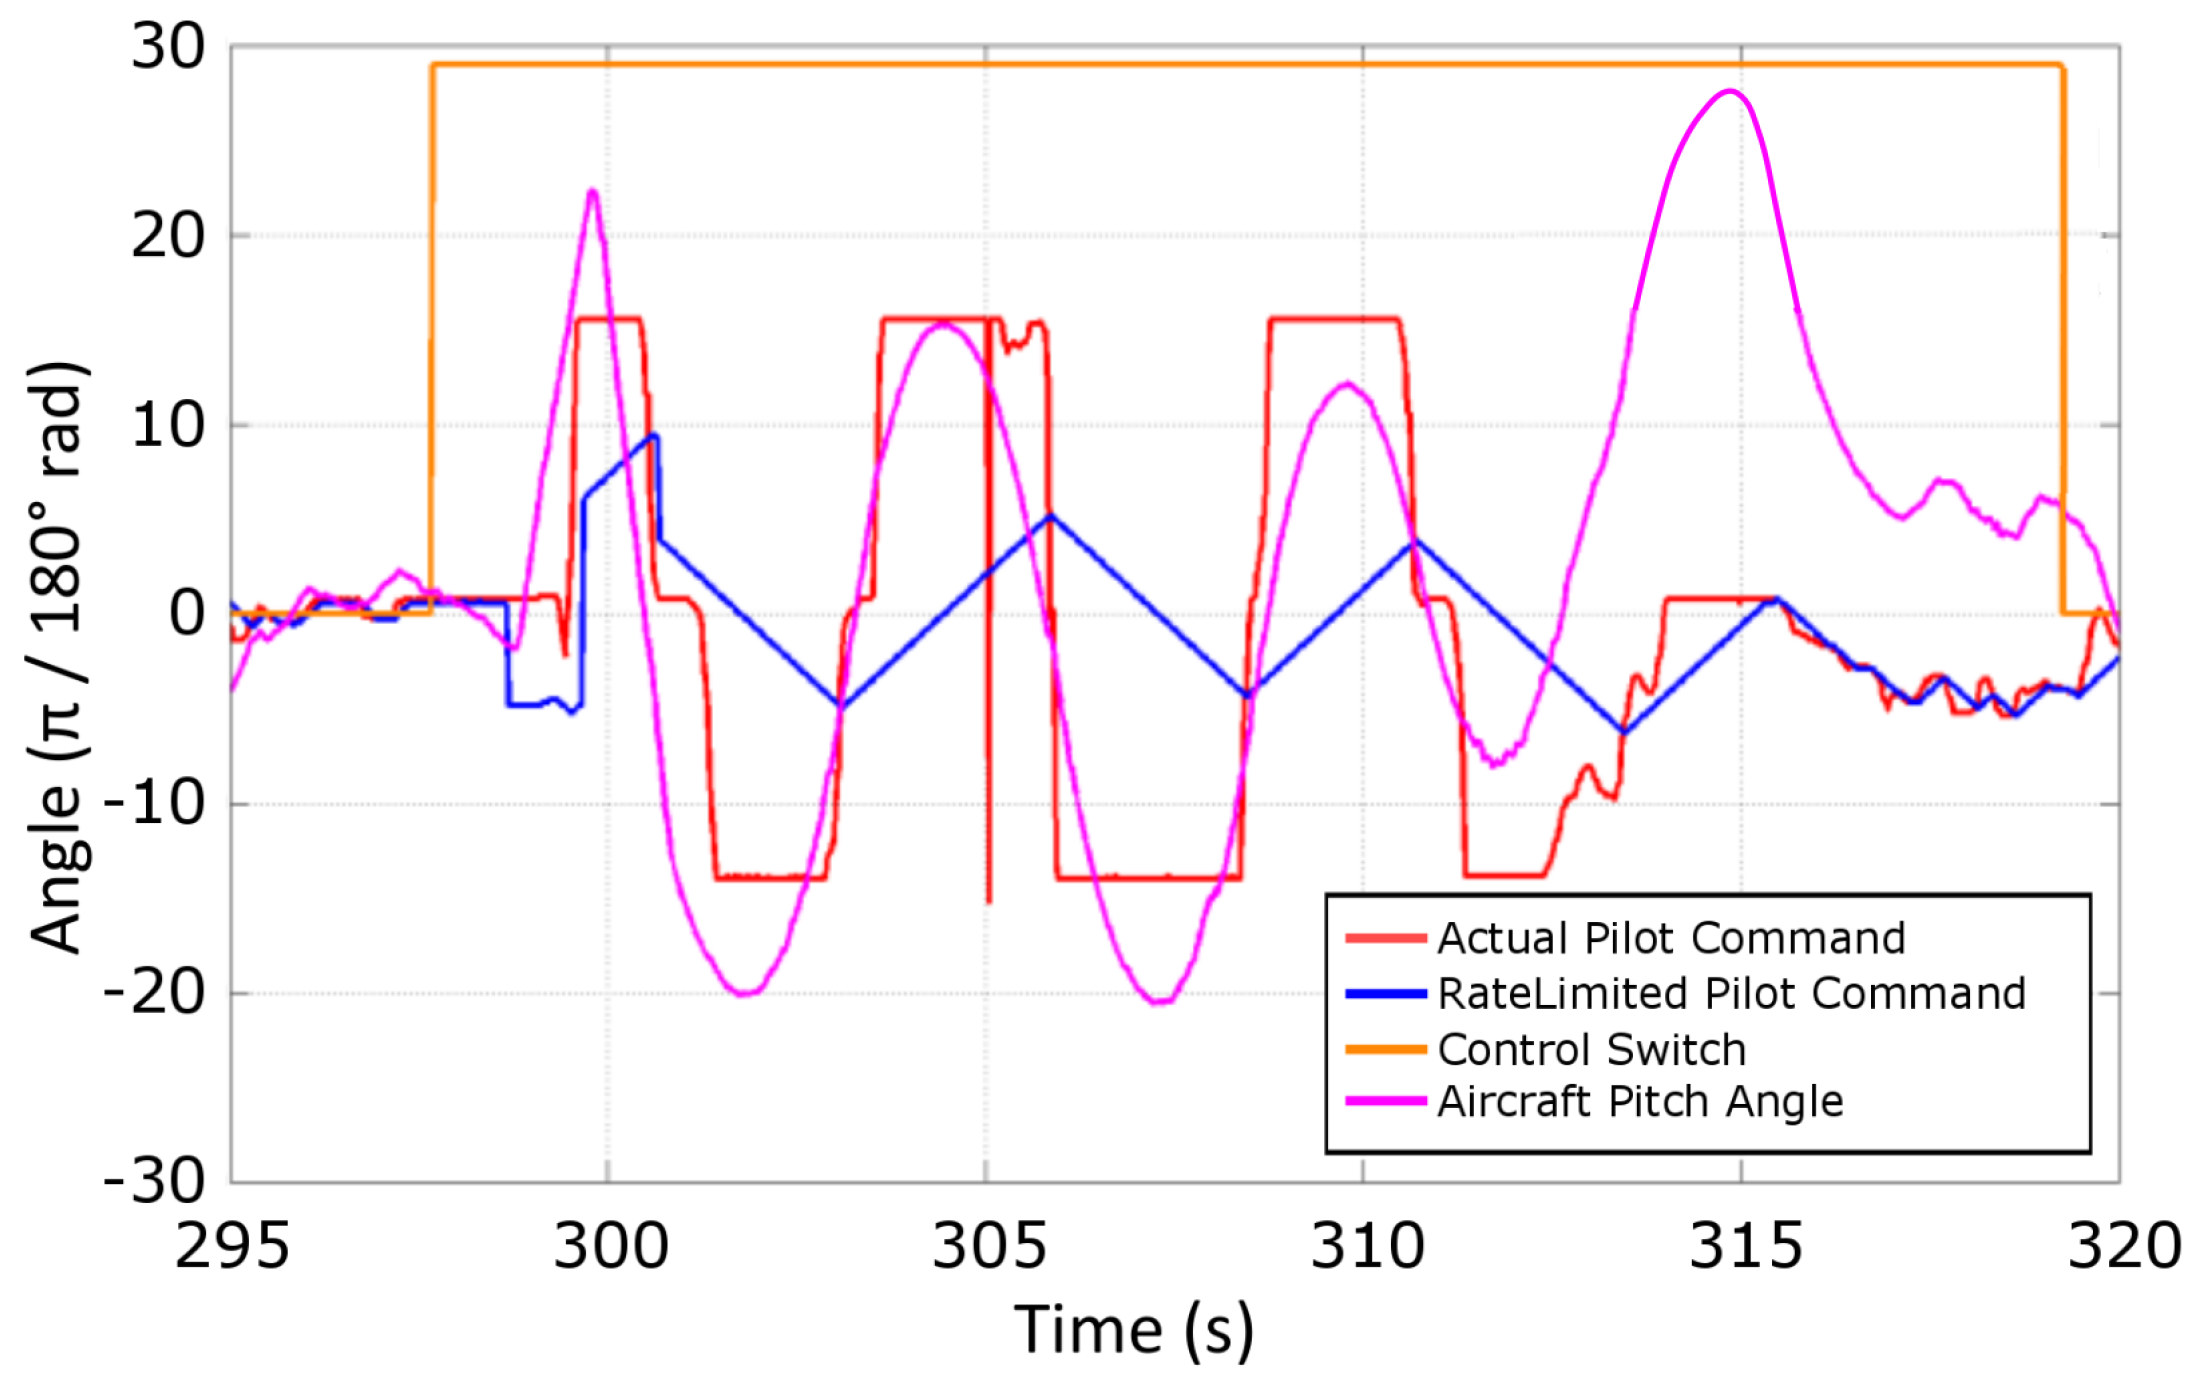
For Category 1 PIO experiment, each control switch activation adds an additional delay of 100 ms to the pilot’s elevator command and for Category 2 PIO experiment each control switch activation limits the elevator rate to 80% of the previous rate. Since the control switch activation is in the pilot’s control it can be assumed that the pilot roughly knows the severity of delay or rate limit (based on the number of control switch activation). This can lead to the pilot preemptively generating control actions for an anticipated effect of rate limit or delay. For future experiments, it was decided that the control switch will not be activated by the pilot but by the experimenter. However, for the present case, it was observed that in each flight session it takes time for the pilot to get fully accustomed to the PIO experiments before they start pre-empting the time delay or rate limit effects on “Phastball”.
A total of 21 PIO flight experiments and an additional 26 flights for human pilot characterization were carried out using three pilots over a course of eight-month time period. Out of 21 PIO flights, 6 flight tests were carried out with injected time delay (Category 1) in the PVS and 14 flight tests were carried out with elevator rate limiting (Category 2). During each PIO flight each straight leg of the elliptical flight path was used for analysis. During each flight test multiple values of delay and rate limiting were used [18]. For pilot study the data from straight leg and landing was used due to pilot workload being different for the two scenarios [19]. 
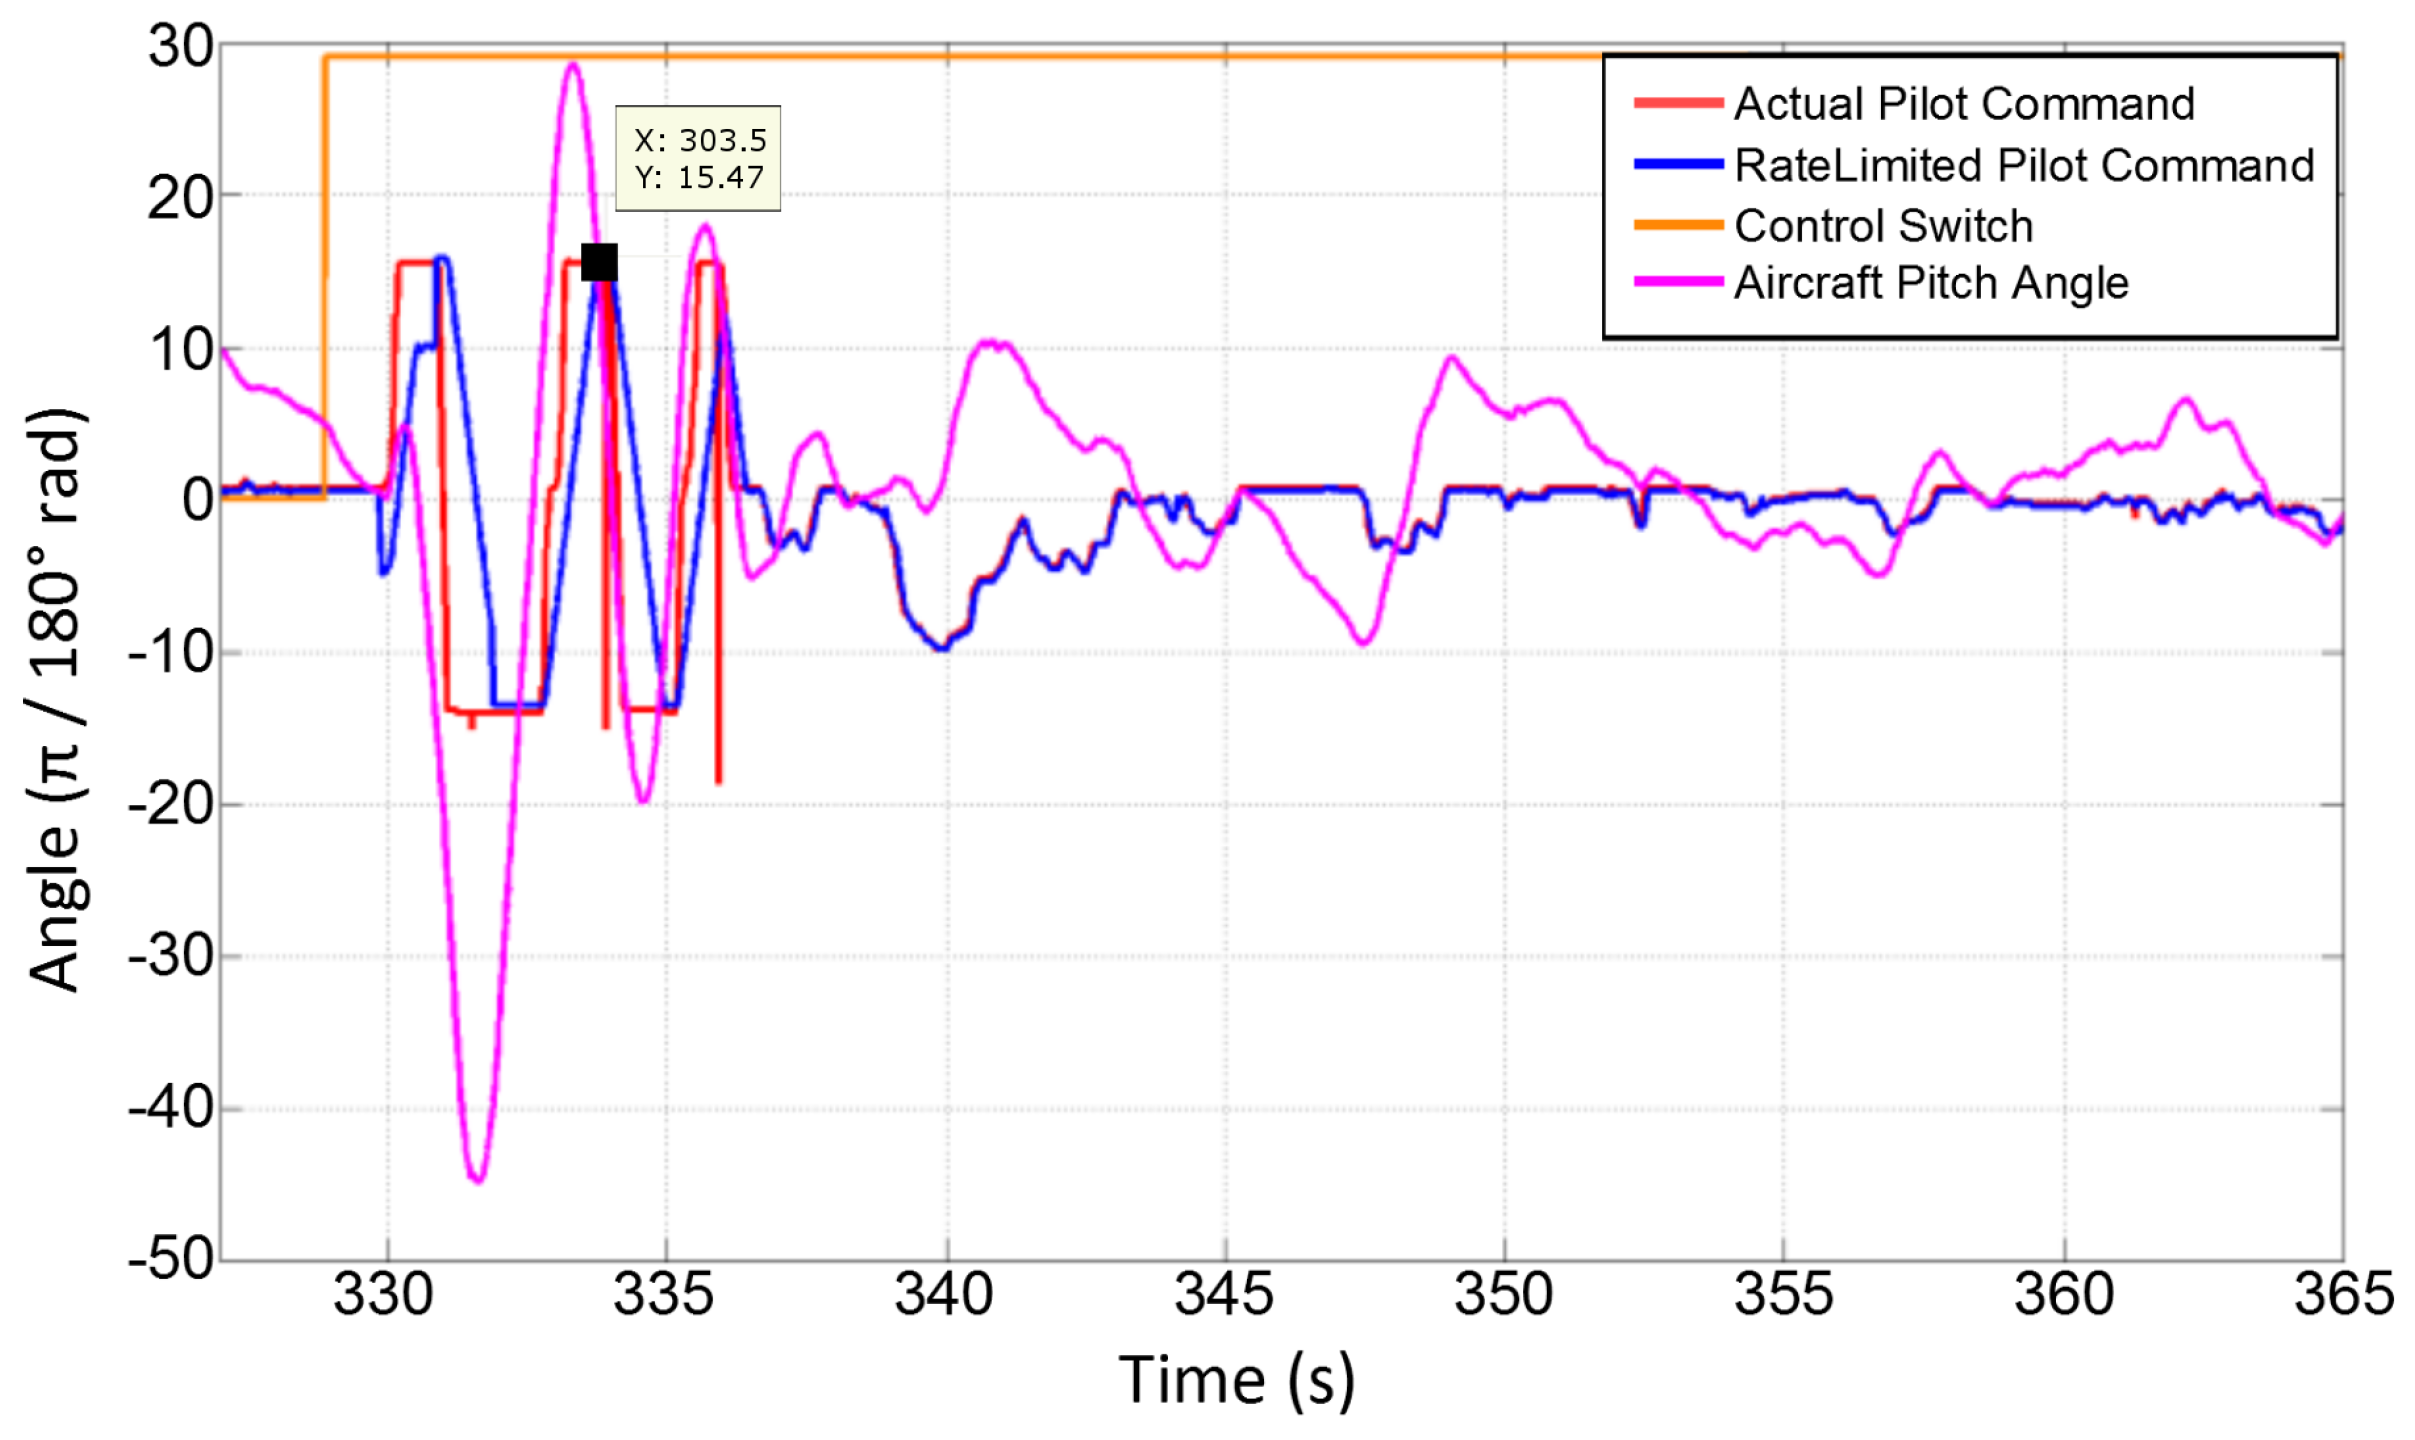
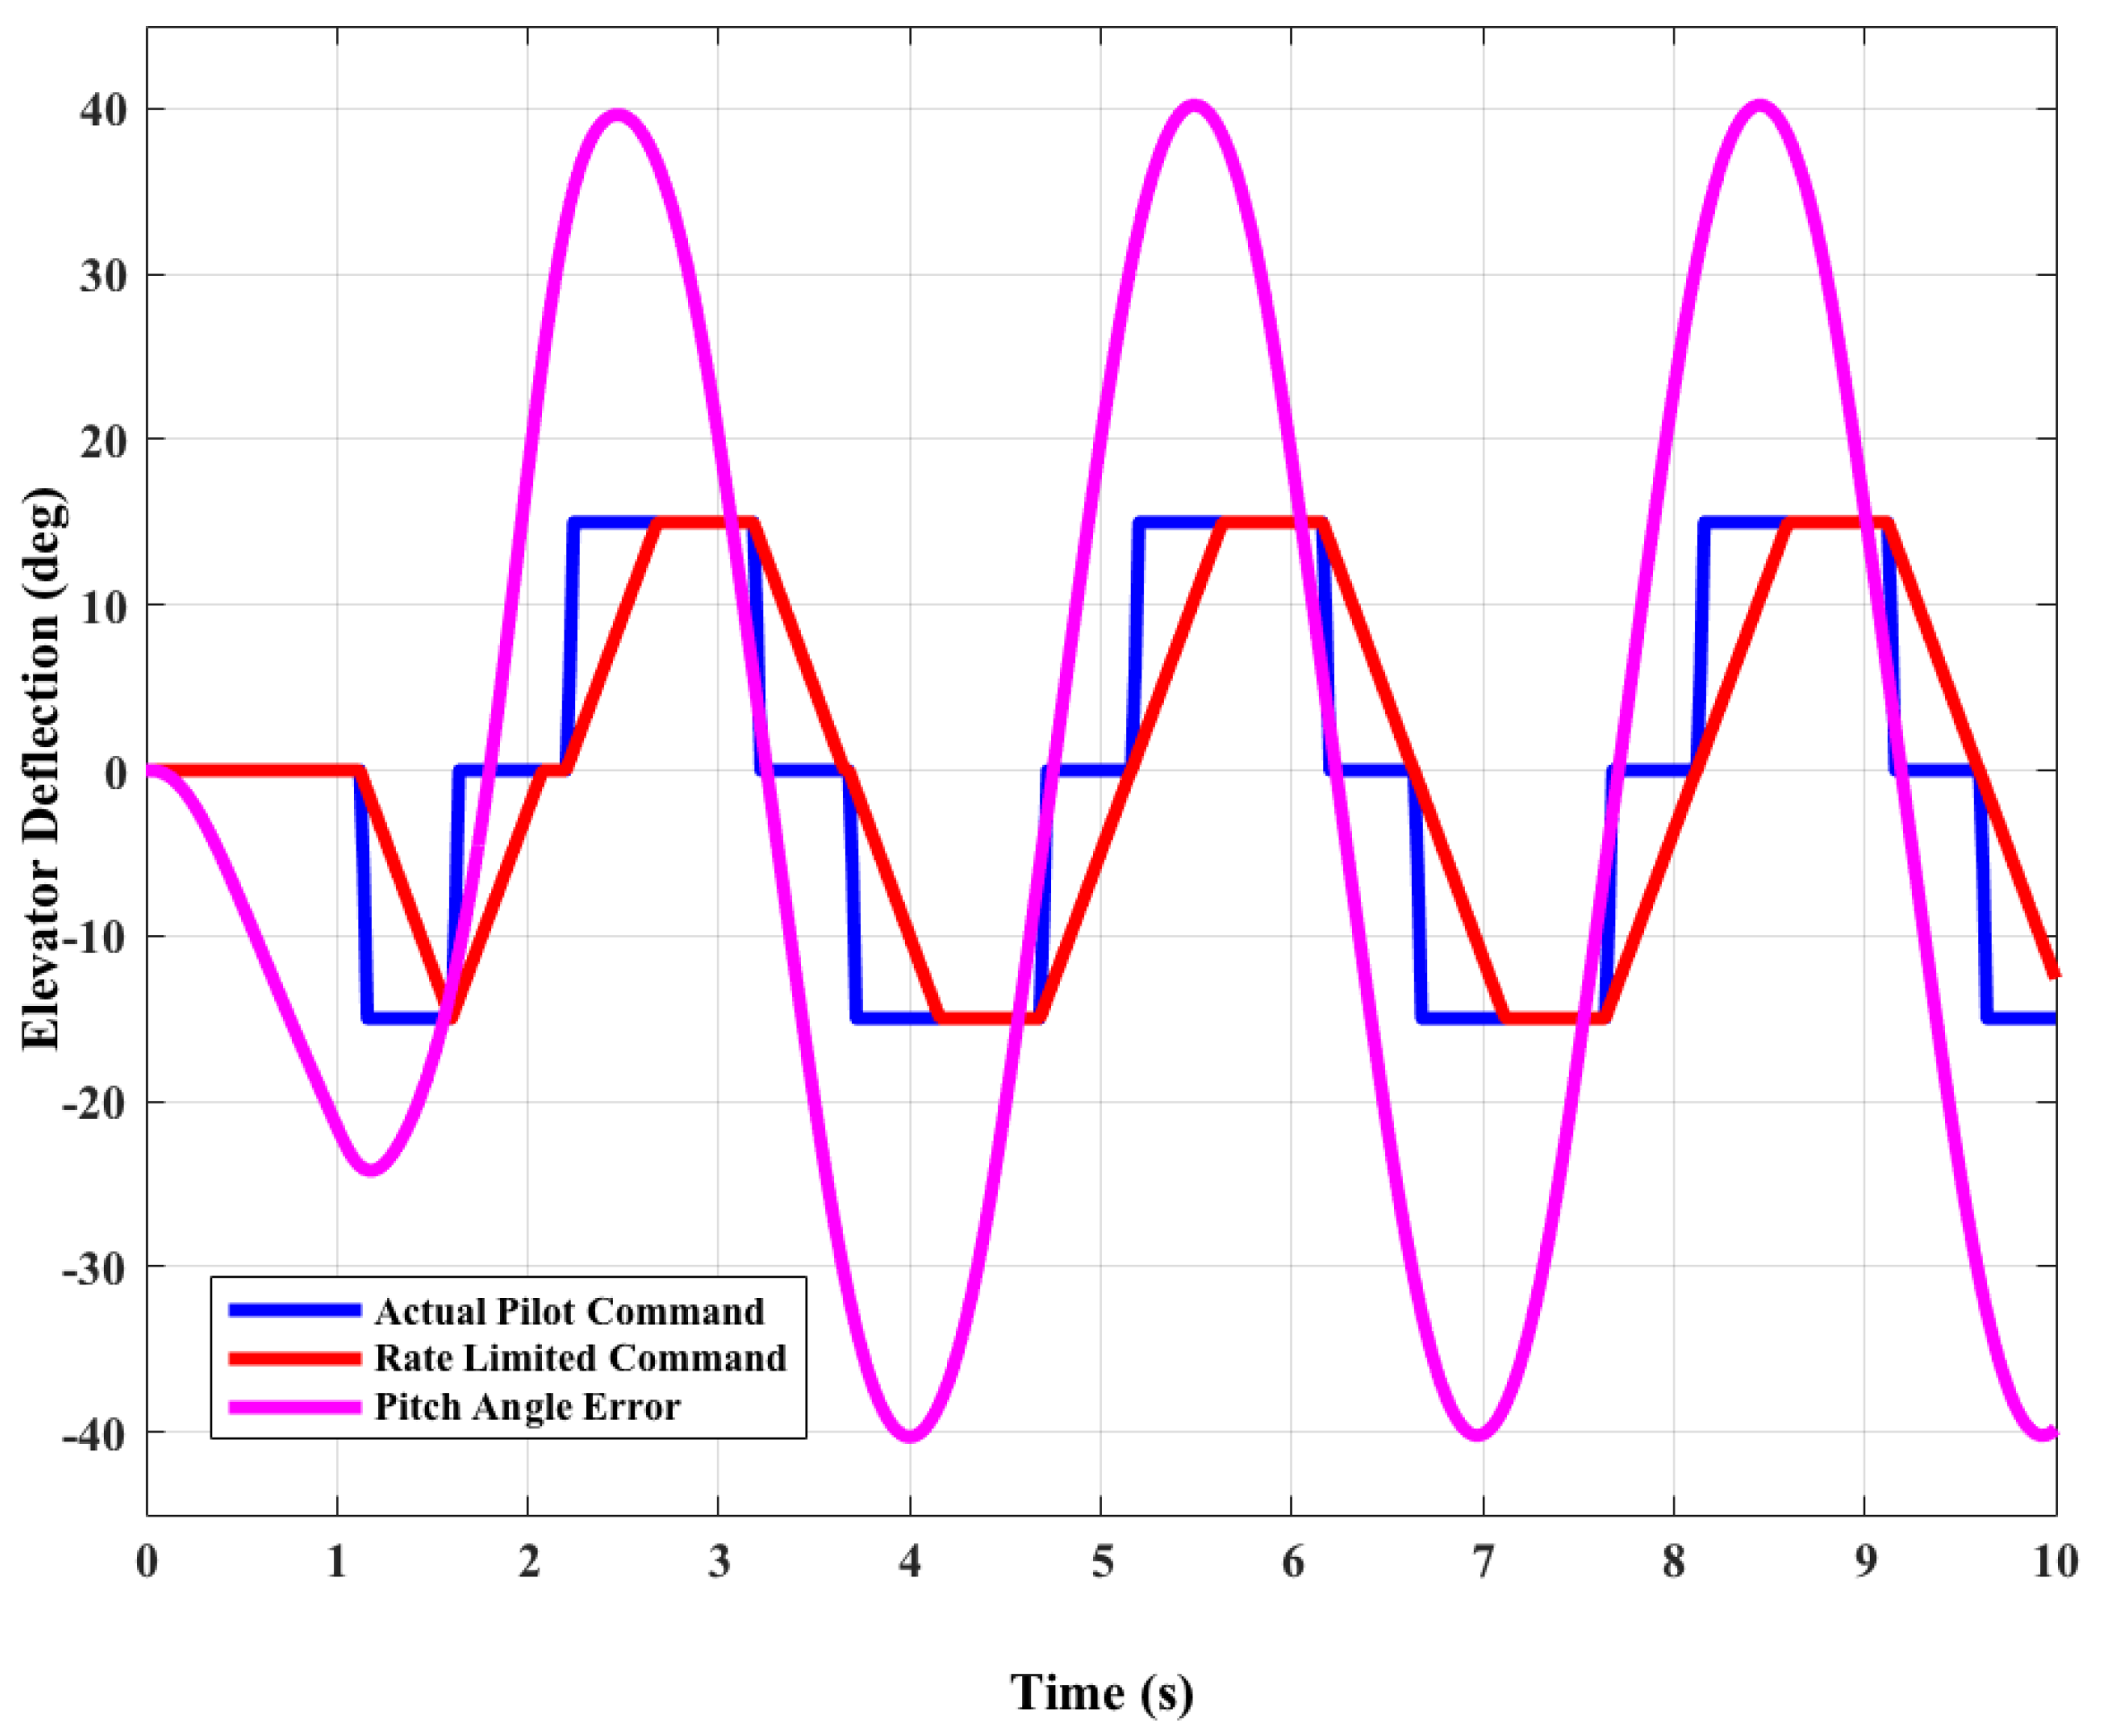
Figure 3 shows a sample Category 1 PIO event and Figure 4 shows a sample Category 2 PIO observed during a “Phastball” PIO experiment.

3. Flight Data Analysis for Pilot-Induced Oscillation (PIO)

PIOs are sporadic in nature which makes it difficult to predict their occurrence. Instead, the general goal of a PIO analysis technique is to predict the aircraft susceptibility to PIOs so that corrective measures can be taken in the design phase of the aircraft system itself and improve its handling quality. This section presents a survey of commonly used PIO criteria for Category 1 and Category 2 PIO for determining the PIO susceptibility of “Phastball” under injected time delay or elevator actuator rate limiting. The objective is to evaluate the existing PIO analysis techniques developed for manned aircraft with an R/C unmanned aircraft.

3.1. Category 1 PIO Analysis

3.1.1. Bandwidth/Pitch Rate Overshoot

Two parameters from the stick deflection to pitch attitude transfer function needs to be computed for application of this criterion [23,24,25], the bandwidth and phase delay. The stick deflection to pitch attitude transfer function is given by.
θ ( s ) δ p ( s ) = 29 . 11 s 2 + 115 . 50 s 49 . 29 s 4 + 6 . 94 s 3 + 22 . 59 s 2 10 . 64 s + 0 . 3 × 1 0 . 0760 s + 1 e 0 . 17 s rad / rad
The last term in Equation (1) is the elevator actuator transfer function and it was obtained by providing a step input to the elevator actuator and recording the elevator angle output. The first term of Equation (1) is the elevator deflection to pitch attitude transfer function for “Phastball” and is obtained through an earlier parameter identification study [26]. The transfer function in Equation (1) does not include the the delay induced during Category 1 PIO experiment. However, during analysis the induced time delay was included in the calculations. The bandwidth and phase delay terms for this criterion are defined as follows:
(1)
The Bandwidth ω B W is defined as the frequency at which the phase margin is 45 or the gain margin is 6 dB, whichever frequency is lower. This represents the range of frequencies over which the pilot can control the aircraft without giving rise to instability.
(2)
The Phase delay τ p is defined as τ p = ϕ ( 2 ω 180 ) ϕ ( ω 180 ) 2 ω 180 × π 180 . It represents the slope of the phase angle at frequencies above the bandwidth. A large value of phase delay means that above the bandwidth frequency the pilot will find a rapidly decreasing phase margin, thus instability is likely to occur.
The above two parameters are plotted on a criteria plane and its location relative to PIO boundary [6,7,24] gives an idea about the PIO susceptibility of the system. Sometimes two additional parameters, the flight path parameter and the drop back parameter can be used for cases where PIO susceptibility is not well predicted by primary parameters. Figure 5 shows the location of the calculated primary parameters for “Phastball” on the criteria plane.
In Table 1 a summary of the prediction result is presented and compared with the actual flight test results for “Phastball” [18].
Since PIOs are complex phenomena, are affected by several factors, and are highly dependent on human pilot, the prediction of susceptibility to PIO does not necessarily mean PIO will be observed in the actual flight with 100% probability. It can be seen that Bandwidth criteria slightly over-predicts “Phastball” PIO susceptibility in this case. Modification of boundary is necessary by utilization of large number of flights. Reference [27] provides another case study where existing boundaries were modified for better PIO predictions.

3.1.2. Neal-Smith Criterion

Neal-Smith criterion [8] is a closed-loop system analysis to predict PIO susceptibility of the system and uses a pilot model [5,12,28,29] to close the loop. The pilot model contains a gain K p , lead T L and lag T 1 parameters and a time delay τ as shown below:
P ( s ) = K T L s + 1 T 1 s + 1 e τ s E ( s ) rad
In Equation (2) P(s) is the frequency domain elevator stick deflection command, E(s) is the error in the pitch angle calculated by subtracting the current pitch angle from 2 reference pitch angle for “Phastball” [18]. The pilot model is developed for a particular bandwidth frequency, ω B W determined by the category of flight [30].
Since all flight experiments carried out for “Phastball” are in Category B flight phase, which is defined as gradual maneuvering without precision, for example, climb, cruise, descent etc., a corresponding value of Neal-Smith flight bandwidth ω B W = 1 . 5 rad/s is considered [8,31]. In the pilot model, τ represents the pilot’s neuro-muscular delay, which is assumed to be 0.3 s [8]. Closed-loop frequency analysis was carried out to estimate K p , T L and T 1 such that the following requirements are satisfied:
1
The aircraft-pilot phase angle at the bandwidth frequency must be −90 .
2
The low frequency droop must be less than −3 dB.
However the 3 dB droop constraint for an assumed pilot model can cause one of the following two situations to happen rendering it inapplicable as a PIO criterion [28]:
1
The solution does not converge.
2
The predicted model contains excessive lag.
For “Phastball” aircraft at bandwidth frequencies corresponding to Category B flight phase the solution does not converge. This renders Neal-Smith criterion unusable for “Phastball”. One reason can be that the constraints on closed loop PVS response were defined for a manned aircraft and may not be valid for an unmanned aircraft. In Neal-Smith criterion the assumed pilot model includes a time delay to account for the pilot’s neuro-muscular lag and experience shows that the results are sensitive to the value of delay (e.g., pilot delay can be different while flying unmanned aircraft) [28].

3.1.3. Smith-Geddes Criterion

Ralph Smith [32,33] considered three types of PIO not to be confused with the PIO categories, of which Type III (initiated by resonance of the closed-loop aircraft-pilot system during attitude tracking, regardless of acceleration dynamics without switching) is of interest for the “Phastball” case. For prediction of Type III attitude-dominant PIO, a simple procedure has been proposed by Ralph Smith based on the parameter ω c r given by.
ω c r = 6 + 0 . 24 S
where S is the average slope of the attitude (pitch attitude for this particular experiment) to stick deflection amplitude response in the crossover region and is calculated by determining the average slope over the frequency range of 1 to 6 rad/s. Smith-Geddes criterion predicts susceptibility to PIO by calculating the phase angle, ϕ c r of attitude (pitch attitude in this case) to the stick deflection frequency response for, ω c r and comparing it with PIO boundaries. Smith-Geddes predicts type III PIO sensitive if ϕ c r < 160 and PIO prone if ϕ c r < 180 . Table 2 presents the Smith-Geddes criteria evaluation for “Phastball” for various values of time delay injected.
It can be seen that Smith-Geddes criterion predicts PIO susceptibility of “Phastball” with reasonable accuracy. Due to its simplicity, Smith-Geddes can be used for a quick understanding of the system but this method lacks some fundamental measures of the characteristics which leads to PIO in the first place. It appears that PIO susceptibility prediction cannot be derived solely from the value of ϕ c r alone. Some of the deficiencies of the method are not taking into consideration the shape of phase curve of the attitude-stick deflection frequency response and the straight line approximation of the amplitude curve [28].

3.1.4. Phase Rate Criterion and Gain Phase Template (Average Phase Rate)

Phase characteristics of an aircraft around neutral frequency are an important indicator of an aircraft’s PIO characteristics. Phase Rate Criterion [34,35] uses the gradient of the phase angle in the neutral stability region as a parameter to give an indication of the PIO susceptibility of an aircraft. A pilot performing demanding closed-loop tracking task usually increases his/her control gain to increase the bandwidth, which will in turn increase the phase delay. This results in the pilot assuming that the aircraft is not responding fast enough and as the pilot further increases the gain, this may in the end lead to instability and hence PIO. The original definition of the phase rate parameter is the local slope of the phase angle around 180 phase delay.
P R 180 = Δ ϕ ( ω ) Δ ω | ϕ ( ω ) = 180
However, in recent applications the average phase rate is used [7], where phase angle slope is determined over a wider frequency range: Δ ω = 2 ω 180 ω 180 . When Phase rate criterion is compared to previous Bandwidth criterion it can be observed that the average phase rate parameter is directly proportional to the phase delay parameter τ p . For the evaluation of the criterion, the phase rate parameter is plotted with the neutral stability frequency which is compared to the PIO boundary [25,30]. Figure 6 shows the Average Phase Rate Criterion evaluation of “Phastball”.
The configuration in the L1 region has a very low PIO susceptibility and the PIO susceptibility increases as the configuration moves from the L1 to L3 region and beyond. When compared with predictions from the Bandwidth criterion, it can be seen that both the criteria give similar predictions, which was expected. When compared with flight test results from Table 1 it can be observed that the average phase rate criterion also over-predicts PIO susceptibility. The second part of this criterion, the gain phase template, evaluates the effects of the actual gain of the aircraft dynamics on PIO. The pitch attitude transfer function is plotted on a Nichols chart with a focus on the area with phase range [−200 , −180 ] also dubbed as the “PIO region”. In this region, bounds are given both for the gain at −180 phase and for the slope of the transfer function. Figure 7 shows the evaluation of the Gain Phase Template for “Phastball”.
It can be observed in Figure 7 that the existing boundaries obtained from manned flight data are unable to correctly predict the PIO susceptibility of the “Phastball”. However, it can be noted that as the delay in the “Phastball” system increases the gain phase curve towards the boundaries, this point to the requirement of different set of boundaries for a “Phastball” like system.

3.2. Category 2 PIO Analysis

The methods for Category 1 PIO use linear analysis and it is difficult to extend these methods to the non-linear effects that give rise to Category 2 PIO, such as rate limiting of control surfaces. The Open Loop Onset Point [9] (OLOP) method developed by Holger Duda is one of the most widely used methods in literature to study PIO due to actuator rate limiting. This study evaluates the effectiveness of OLOP method in predicting the Category 2 PIO susceptibility for “Phastball” under various elevator rate limiting values.
The rate limiting nonlinearity in this criteria is approximated with a describing function technique [9,36] so tools like Nichols plot can be used for analysis. Also in a fully developed PIO due to actuator rate limiting, it has been observed that the pilot acts as pure gain so a simple gain pilot model is used for this criteria with a constraint on the linear crossover phase angle [36]. In this criterion, open loop onset point is the frequency response value of the open-loop system at the closed-loop onset frequency ( ω o n s e t ). It is the frequency at which the rate limiter is activated is given by the following.
ω o n s e t = R L δ m a x i m u m e l e v a t o r d e f l e c t i o n
where R L is the Maximum rate permitted. The position of the OLOP on the Nichols chart of the open-loop system gives an idea about the susceptibility of the aircraft to PIO due to rate limiting. In Figure 8, different points are the phase and gain value for the frequency at which open loop system frequency response intersects with the describing function for a particular value of rate limiting [18]. For an OLOP located below 0 dB line on the Nichols chart, the rate limiting effects are not that severe and from many flight tests and simulations slightly relaxed boundaries have been proposed. Figure 8 shows the positions of OLOP corresponding to various rate limiting values with respect to the stability boundary for a low gain pilot model [18].
It can be noticed from the OLOP analysis that configurations with elevator rate limits below 39.32 /s are prone to PIO. Table 3 shows the flight test results for the Category 2 PIO experiments carried out on “Phastball”.
The success rate of OLOP method for “Phastball” was 91.89% (calculated by considering the total number of successful prediction among all the flights).

4. “Phastball” Pilot Command Analysis and Pilot Model Parameter Estimation

PIO is the result of pilot-aircraft interactions and it is important that while analyzing the PIO susceptibility of an aircraft, human control nature is also taken into account to get a holistic view of the PIO process. Initial analysis of human pilot command from the flight data was carried out using Fourier analysis to obtain information regarding the frequency properties of the human pilot command [37]. 
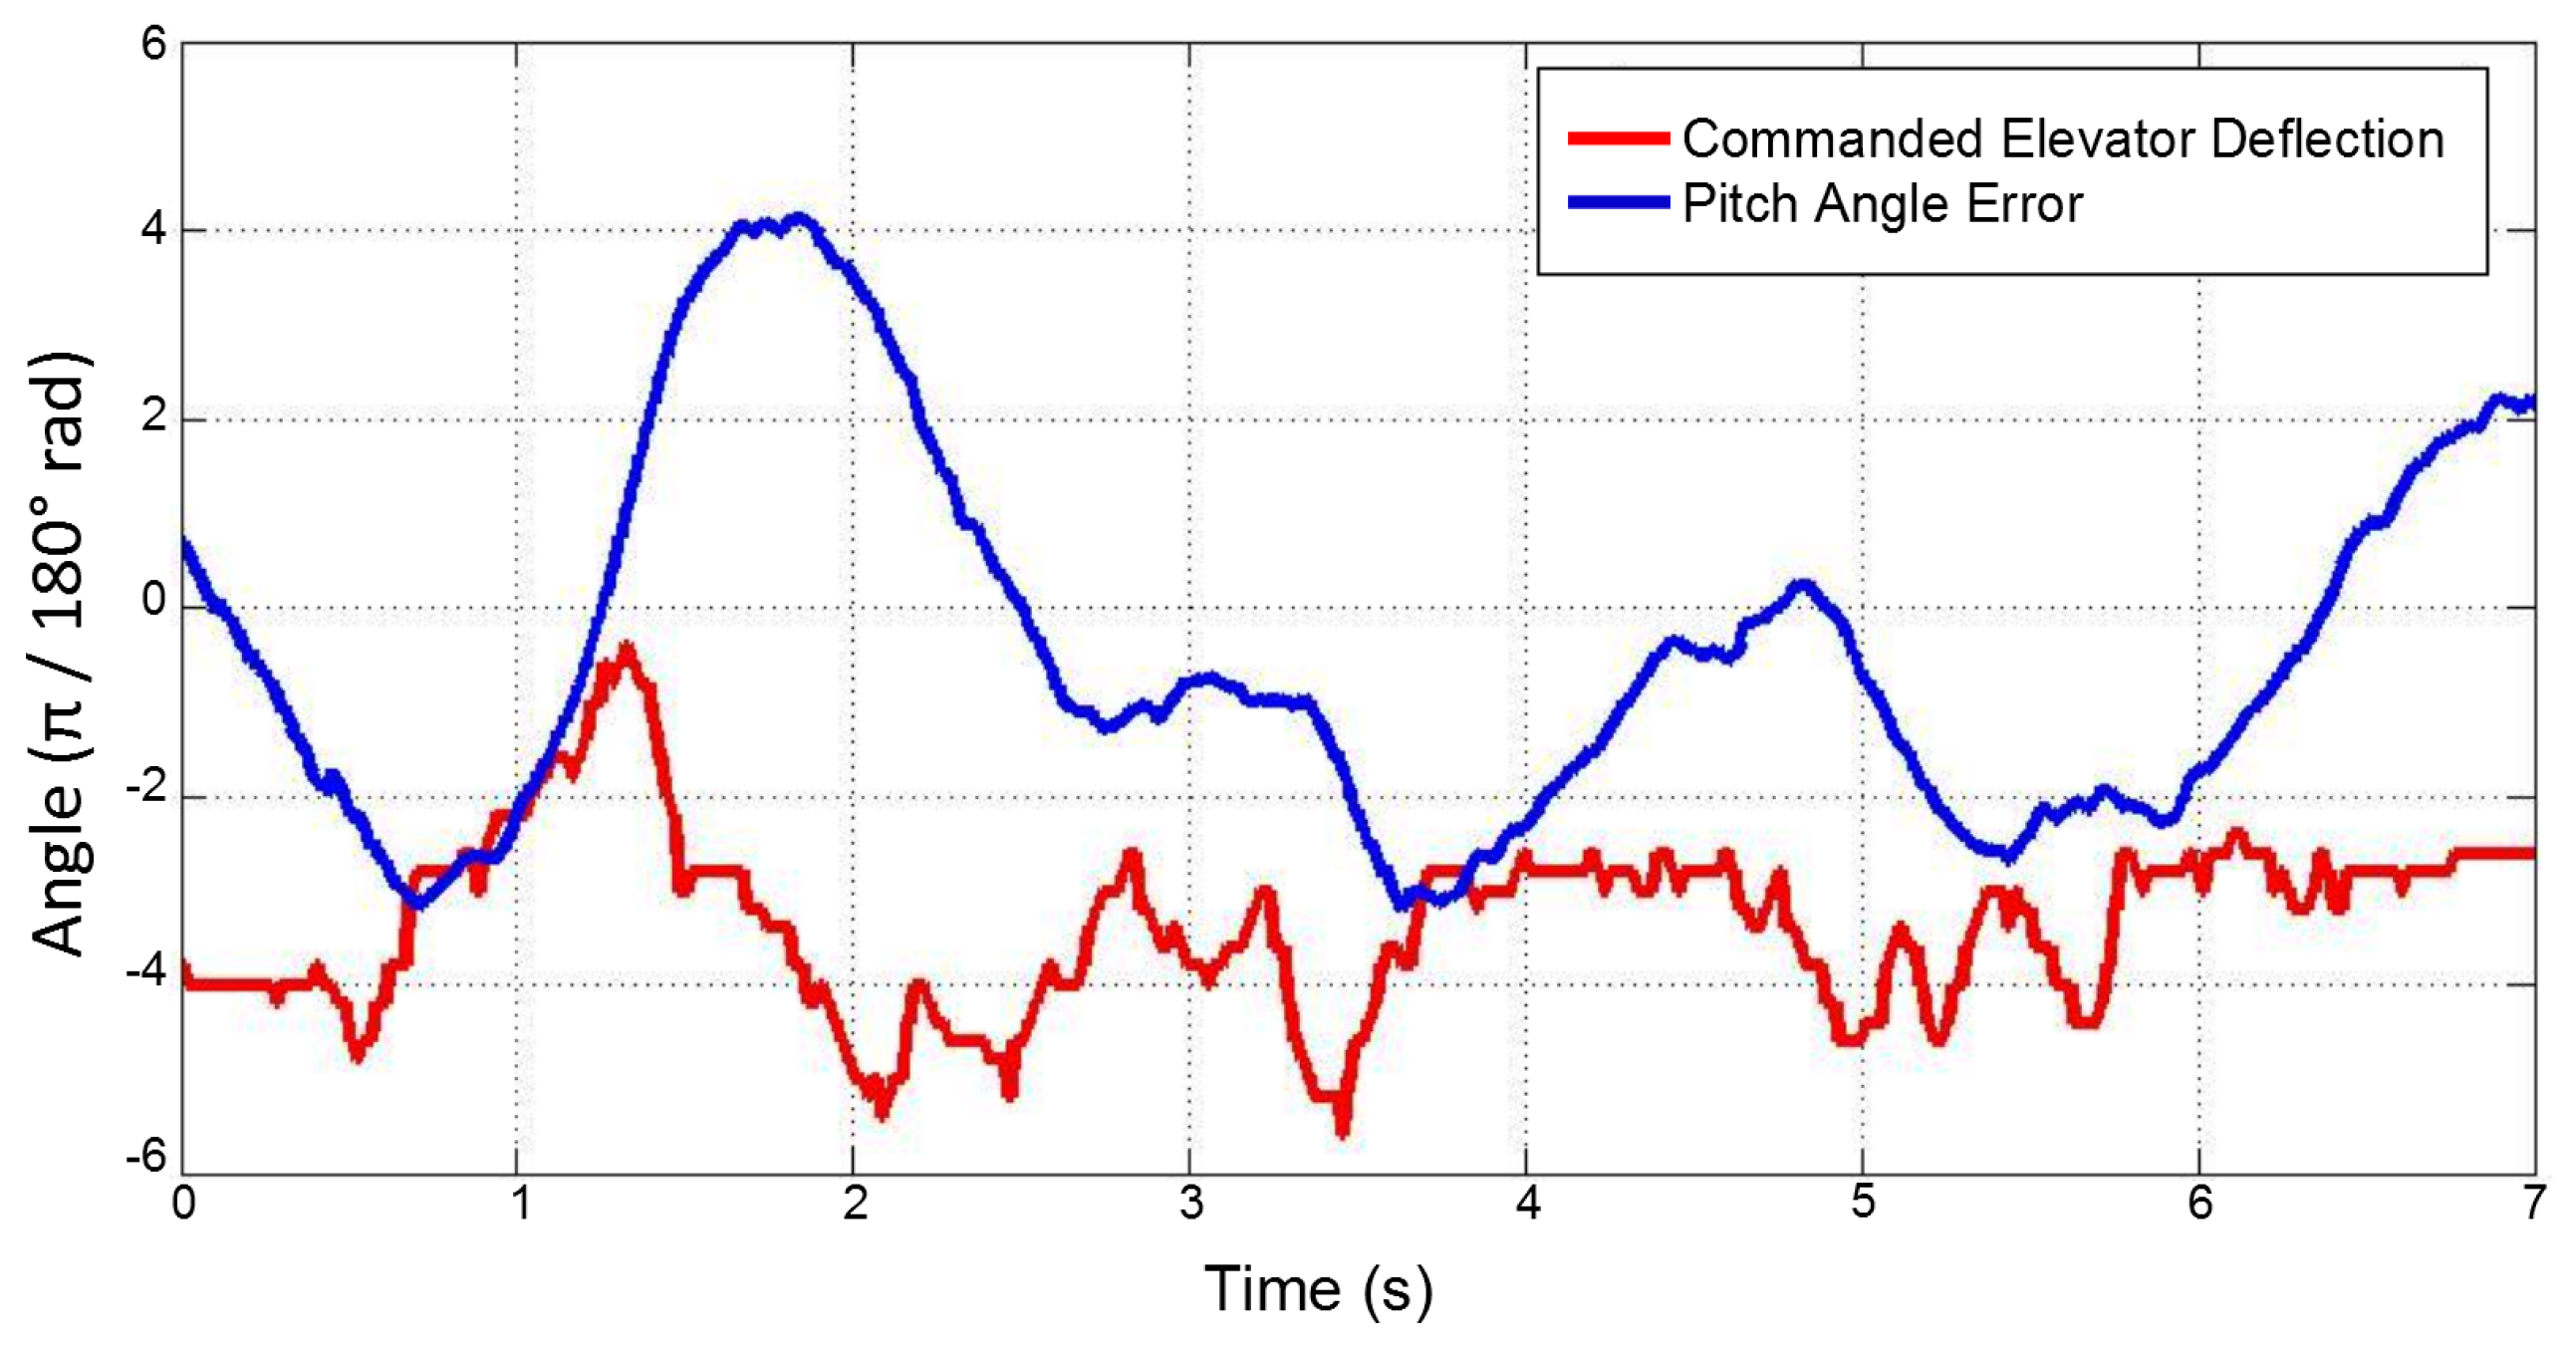
Figure 9 presents a typical pilot response obtained from flight data recorded at 50 Hz and Figure 10 shows its amplitude spectrum during a Steady Level Flight Phase (SLFP). The pitch error is calculated knowing that “Phastball” is trimmed to fly at two degree pitch angle in SLFP. It should be noted that an R/C aircraft pilot typically does not have access to instrumented data; therefore, an R/C pilot has to visually estimate the aircraft pitch angle. The error calculated from the data may not be the exact error perceived by the pilot during the flight. It is, however expected that the pilot would roughly track a constant pitch reference and compensate for the tracking error to keep the aircraft straight and level during the straight legs of the flight.
The major frequencies of the pilot control command are concentrated in the low frequency region. The SLFP condition gives a baseline against which the pilot’s performance during other flight conditions can be compared. It can be assumed that during SLFP the pilot task demand is low as s/he only has to maintain the necessary speed, pitch, and heading angles to keep the aircraft straight and level.
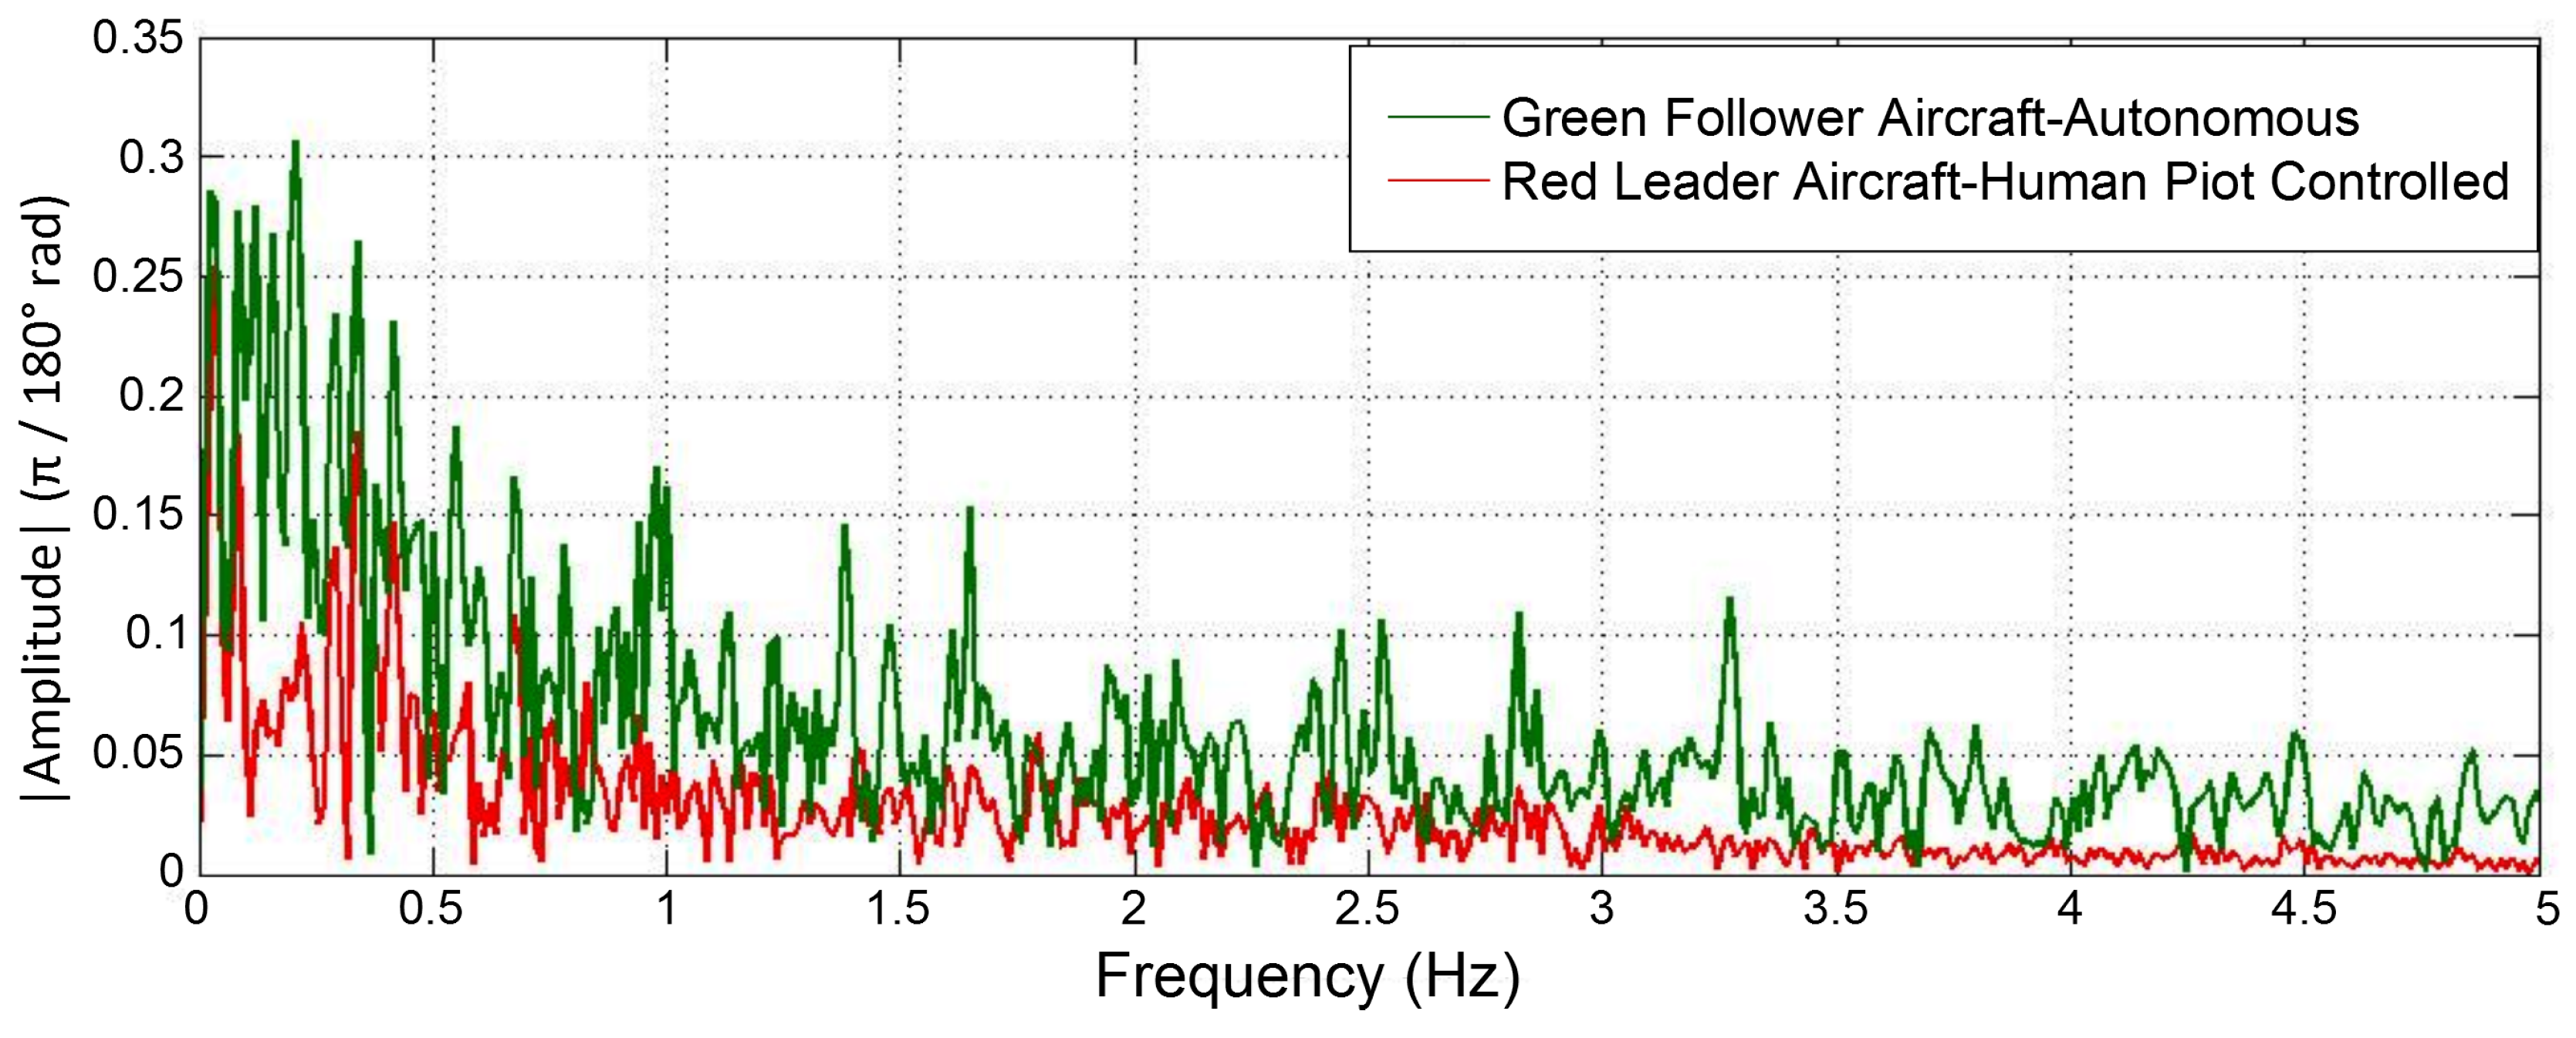
Also during the flight season, formation flight experiments with two aircraft were carried out [38]. A red “Phastball” aircraft was designated as the leader and was controlled manually by a human pilot and a follower green aircraft was under fully autonomous control. The control output to the elevator was compared for the two aircraft in formation flight for SLFP. Figure 11 shows the comparison of elevator control output and Figure 12 shows the amplitude spectrum of elevator control output for both red and green “Phastball” during SLFP with a separation of 30m between the two aircraft along the direction of the fuselage.
From Figure 11 it can be seen that during SLFP the human pilot reacts very selectively and most of the time the pilot control output is constant at the trim value of the elevator deflection. Also in the amplitude spectrum Figure 12 the autonomous controller output has several peaks spread over a wide frequency range as it constantly works to reduce the pitch error. Human pilot on the other hand provides control input intermittently and the pilot input during one intermittent period might be of different characteristics than the other intermittent period. Also, the peaks in the amplitude spectrum of the pilot control output seen in Figure 10 and Figure 12 are mostly bounded within 1 Hz. Further analysis was carried out to find the delay between the pilot command and observed pitch angle error which ranged from 200 to 1040 ms with an average of 642 ms of delay.

Pilot Model Parameter Estimation

In accordance with the existing literature [12,39] a lead-lag pilot model with delay was assumed and non-linear least squares estimation technique was used to find the pilot model parameters. The pilot model acts on the pitch error and generates elevator commands. The following quasi-linear pilot model was used.
P ( s ) = K p T L s + 1 T 1 s + 1 e τ s E ( s ) + η ( s ) rad
where T L is the lead constant, T 1 is the lag constant of the pilot, K p is the pilot gain, τ is the pilot inherent delay, and η is the pilot nonlinear remnant. The input to the pilot model in Equation (6) is the pitch error ( E ( s ) ) visually perceived by the human pilot and the output is the elevator stick deflection ( P ( s ) ). The pitch error is calculated by subtracting the actual pitch angle from the “Phastball” trim pitch angle of 2 . McRuer pilot model has been shown to perform well while modeling single-input single-output compensatory manual task. McRuer pilot model has been shown to perform well while modeling single-input single-output compensatory manual task. In this study, the pilot is only using vision feedback and generating control commands. A simplified assumption is made that the pilot is using visual information about pitch error to generate elevator deflection and that the McRuer model is still valid. Whereas in a manned aircraft the pilot has multiple feedback such as motion cues, vision cues etc. For “Phastball” it was noticed that the power in the high frequency region (from amplitude spectrum) is negligible compared to that in the low frequency region, therefore for “Phastball” pilot command analysis, only the parameters of the linear part of the pilot model were estimated. For analysis purposes the actual pilot output was shifted by the known system delay (70 ms) of manual mode and only T L , T 1 , K p , and τ need to be estimated.
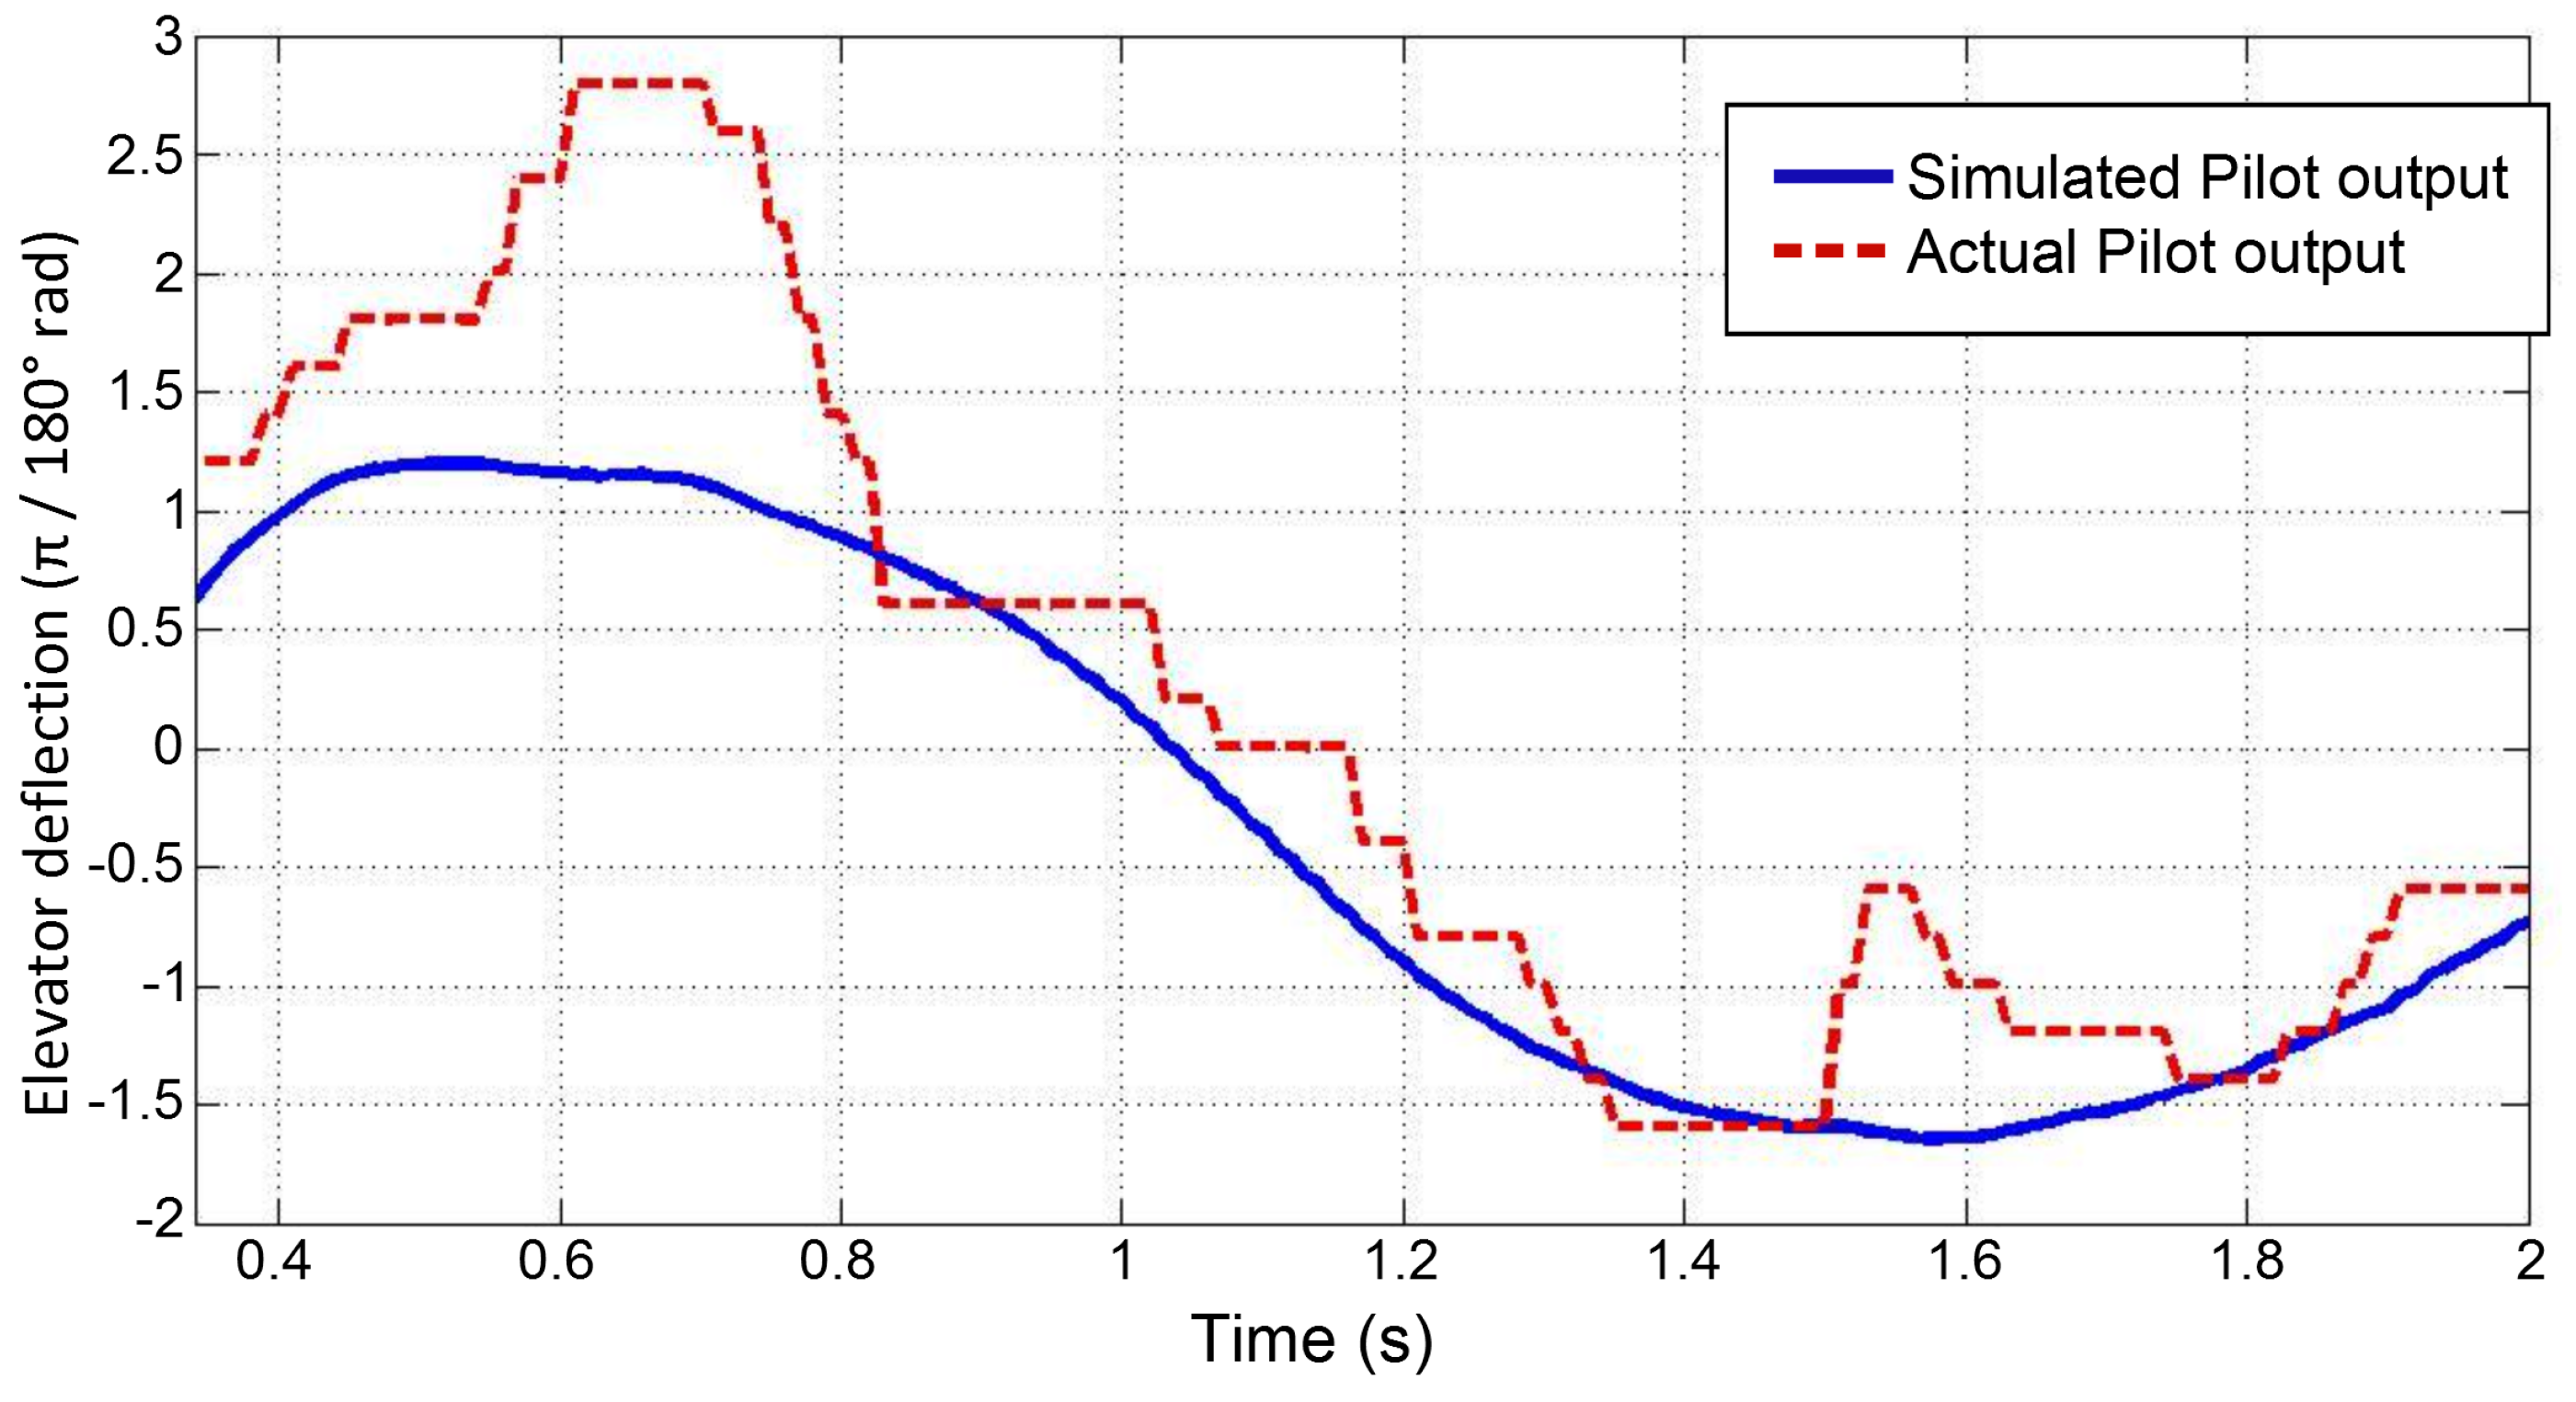
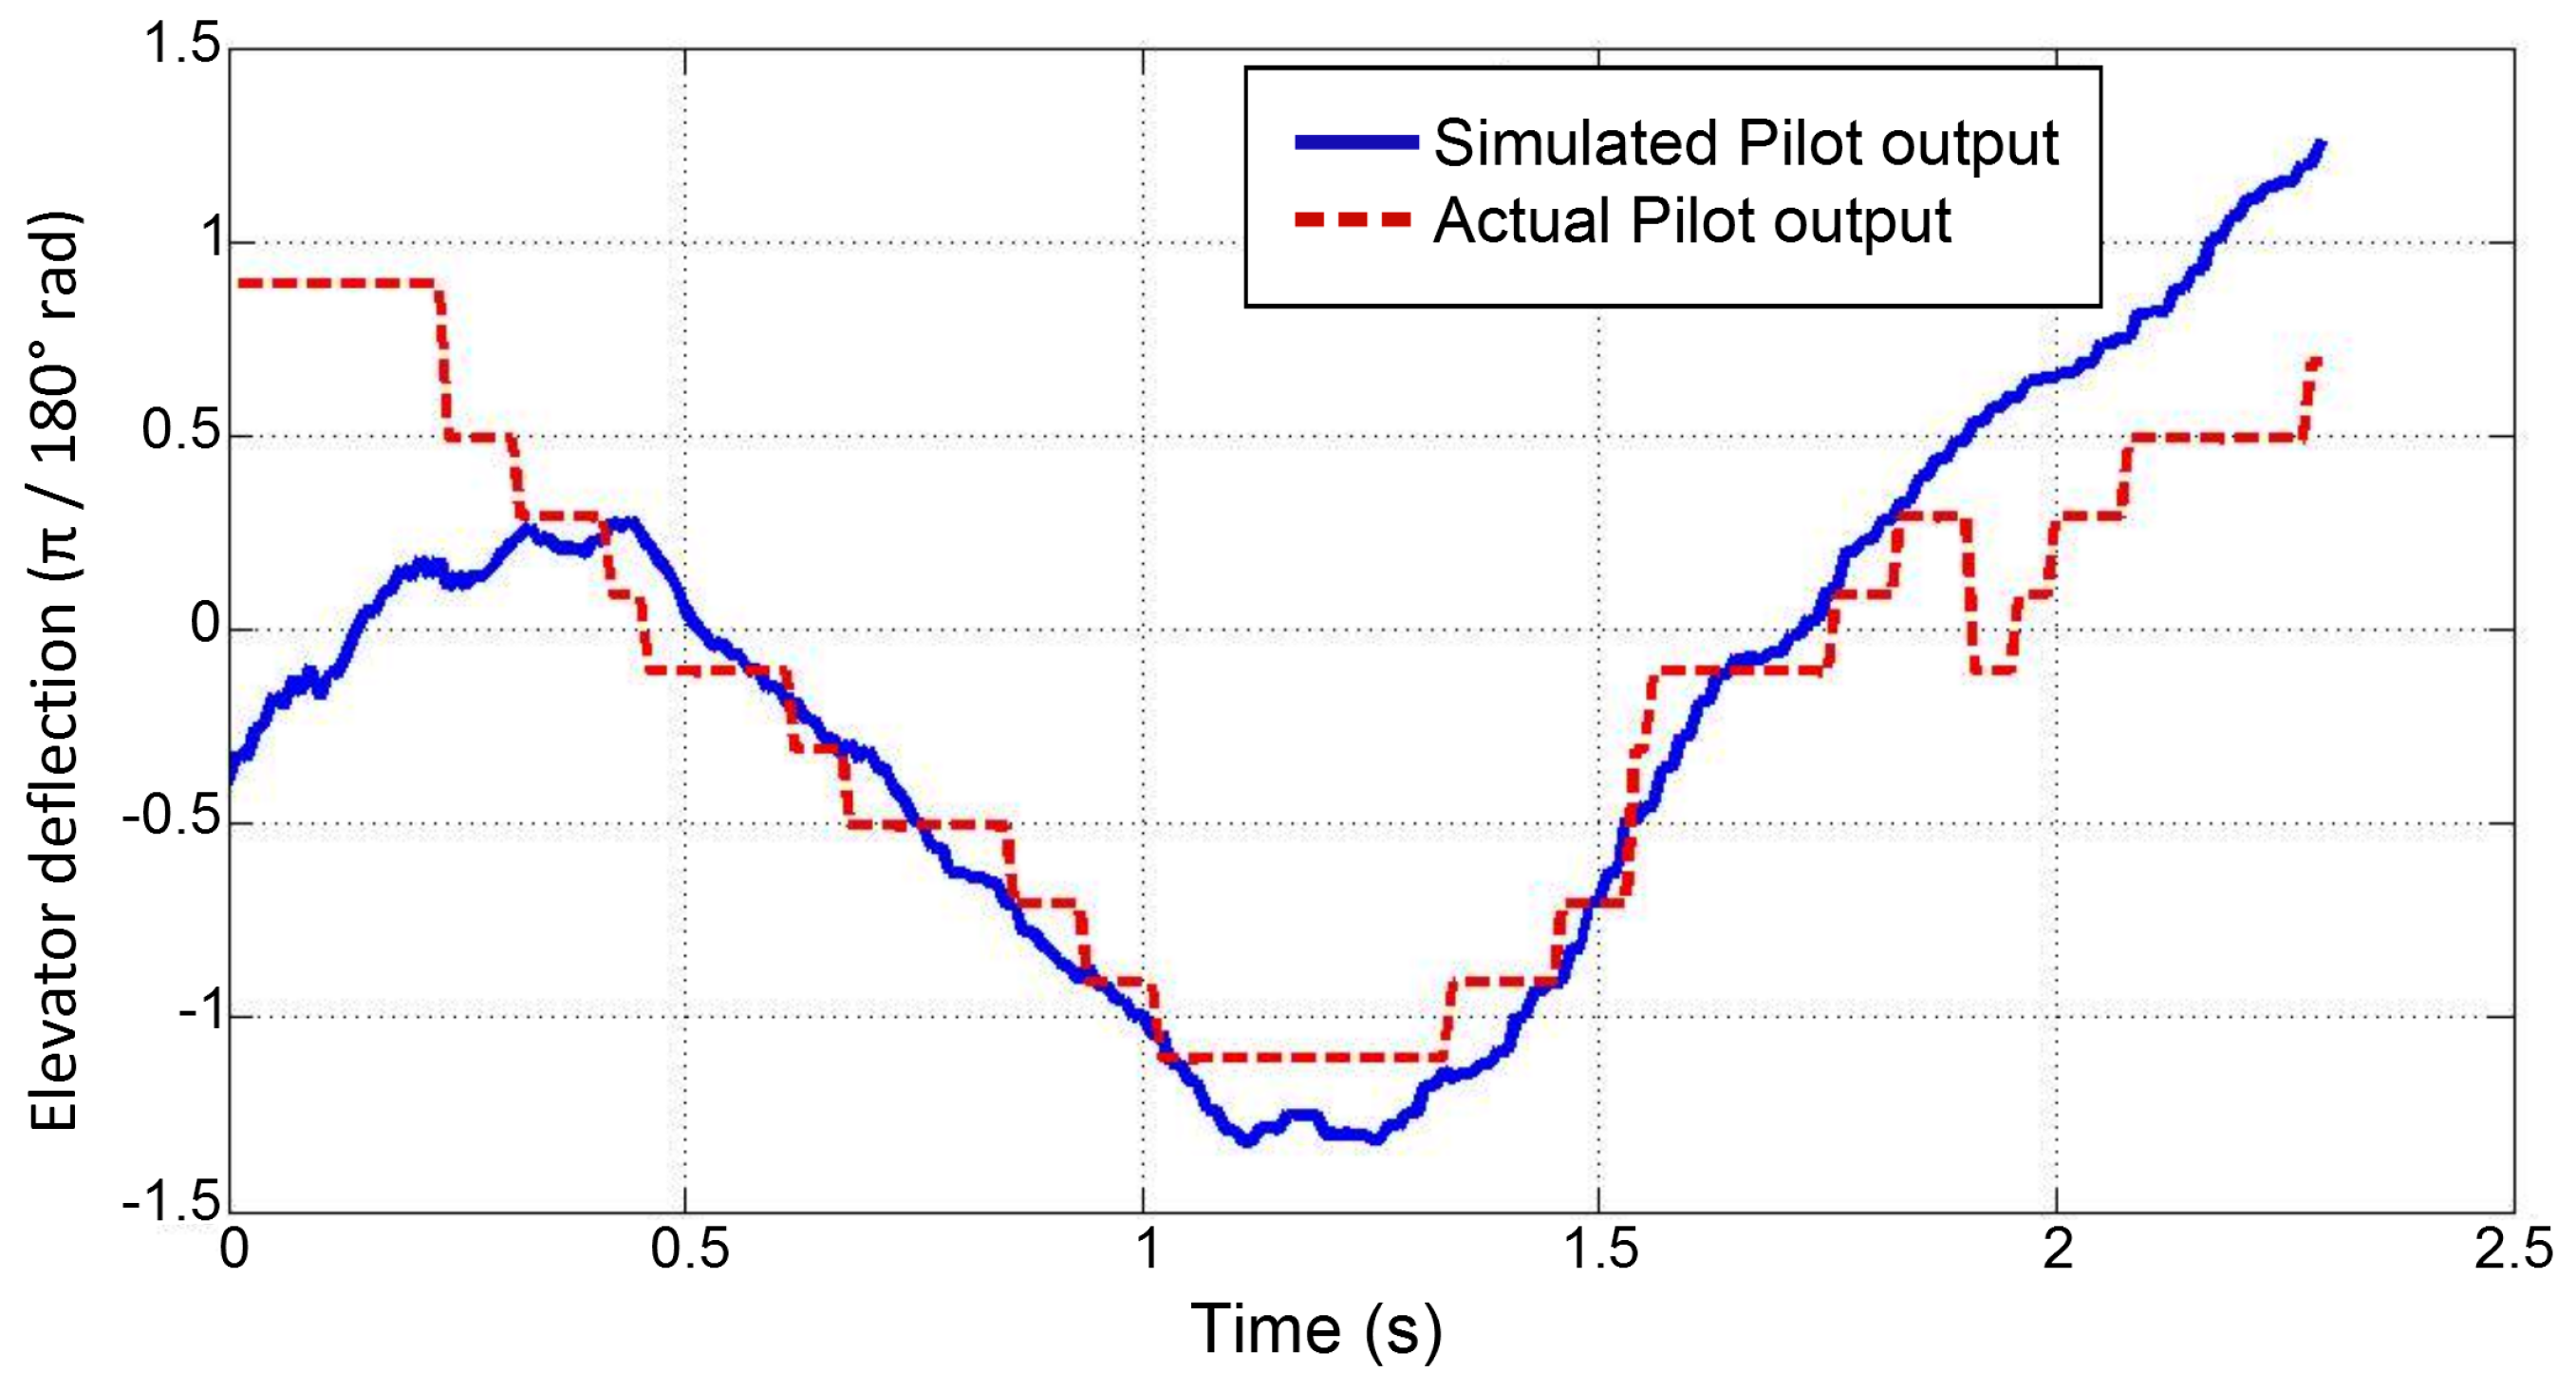
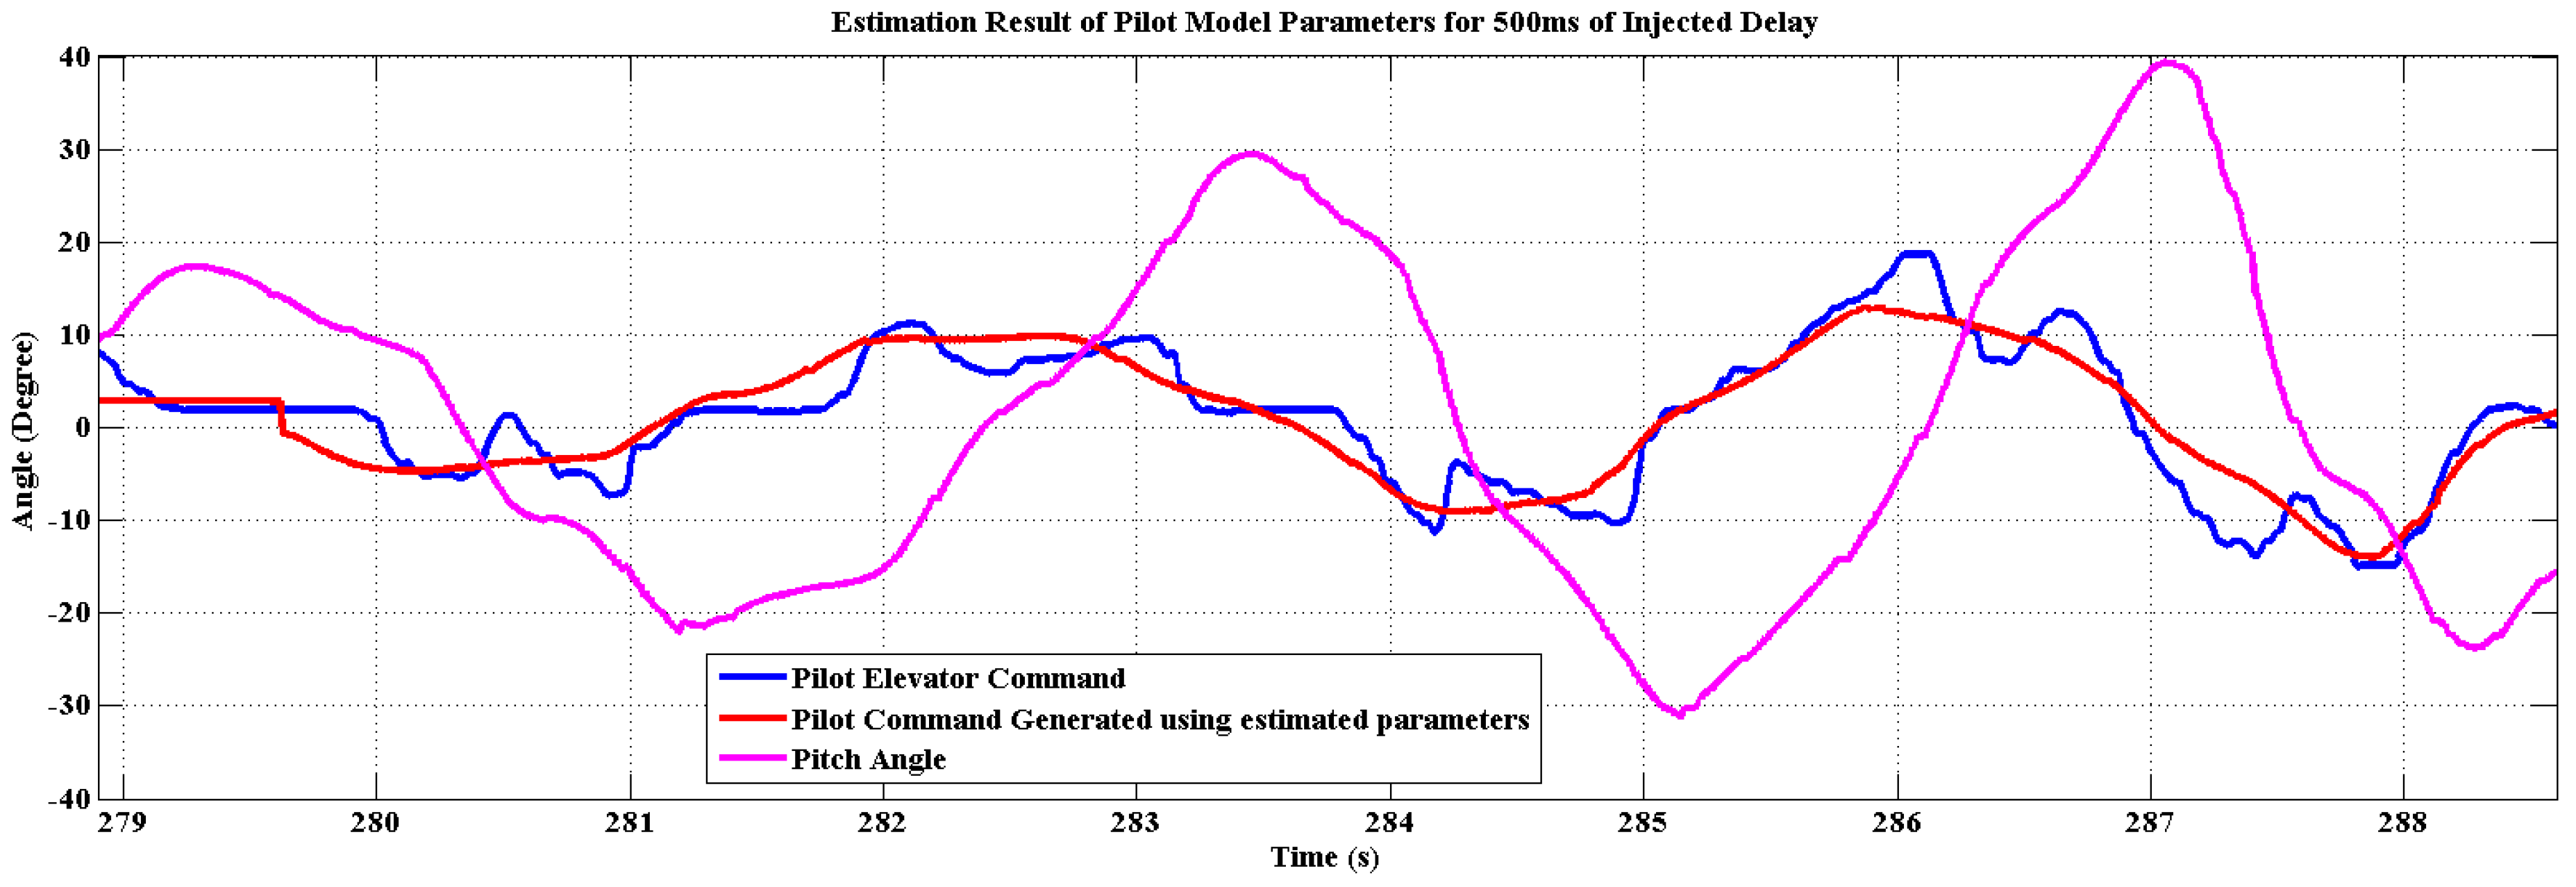
 Figure 13 and Figure 14 show the estimation result and validation results for the analysis carried out for a typical SLFP data set. The estimation was carried out using non-linear least square estimation in Matlab [19]. Data from the straight leg portion and the landing portion of the 26 flight tests carried out for studying human pilot were used for the estimation. The estimated parameters for each data set were used in the validation of 2 randomly selected data set from the reminder of the data to negate any inherent bias.
The estimated values of K p , T L , T 1 , and τ are 0.4148, 0.0284, 0.0837, and 0.3089 s respectively. The total delay induced by the pilot (including lead-lag and pilot delay) is 360 ms, which when added with the Non-PIL system delay of 70 ms (Section 2) is close to the delay of 460 ms observed in the data, obtained using shifting the pitch error input data and pilot output data to get the maximum correlation. The values of the mean and standard deviation of the residuals are 0.3576 and 0.5303 respectively. Table 4 gives the range of values of parameters for the lead-lag pilot model for SLFP obtained for 12 different SLFP data sets obtained from “Phastball” flights [19].

5. “Phastball” PVS Stability Analysis

This section uses the information obtained in Section 4 to get a better understanding of the stability characteristics of “Phastball” PVS under different conditions that may give rise to PIO. Since Category 1 PIO is linear in nature, simple frequency domain analysis will provide sufficient information to determine approximately for what values of delay injected into the system the pilot vehicle system becomes susceptible to PIO. However, due to the non-linear nature of Category 2 PIO a simple frequency analysis is not possible. Instead Describing function technique [40,41] and simulations are used to acquire more information about susceptibility of “Phastball” to Category 2 PIO due to elevator rate limiting.

5.1. Category 1 PIO

Equation (1) and system latency (Section 2) together completely characterize the “Phastball” elevator to pitch system. Finally, the pilot model obtained in Section 4 for SLFP is used to close the loop and obtain the delay margins for the PVS pitch system. Subtracting the system delay of 170 ms and average estimate of pilot delay from Section 4 from the delay margin should provide the approximate amount of delay that can be injected into the system before the PVS becomes unstable and hence help in predicting the PIO susceptibility of the PVS.
When “Phastball” system latency of 170 ms and average estimated SLFP pilot delay of 428 ms are subtracted from the delay margin, the delay that can be injected in the PVS without leading to instability is 186 ms. However, from “Phastball” Category 1 PIO experiments it was observed that the PIO first appeared at an induced delay of 300 ms. If Neal-Smith pilot delay of 300 ms was assumed instead of 428 ms then a delay of 314 ms is needed to induce PIO which is similar to what was seen in the flight tests. Therefore, the prediction of PIO susceptibility is sensitive to pilot delay. The range of values for pilot delay estimated in Section 4 does include a pilot delay value close to Neal-Smith pilot delay of 300 ms. However, the value estimated post flight may not represent the actual pilot during the flight. This a drawback of the batch estimation technique.
During SLFP the onboard elevator doublet does create a nuisance for the pilot but in many cases the effect of the doublet is short lived due to damping in the system and after countering the doublet, the pilot applies minimal control inputs. Figure 15 shows one such event for 300 ms induced delay. From Figure 15 it can be seen that after the doublet event the pilot control input is very minimal similar to what was observed during a normal SLFP (Section 4). Therefore, after a doublet trigger pilot does not actively participate in controlling the “Phastball” and in many cases PIOs can be avoided if the aircraft system is inherently stable and the pilot does not interfere with the controls after a trigger event.
Figure 16 illustrates the pilot parameter estimation result for an injected delay of 500 ms (note that the “Phastball” is experiencing PIO in this case). For the data set in Figure 16 the parameters values are K p = 7 . 37 , T L = 1 . 86 , T 1 = 37 . 50 , and τ = 230 ms.
The parameters T L , T 1 , K p are significantly different from the values in Table 4, also a linear stability analysis of “Phastball” PVS shows that the system is indeed unstable for this set of parameters. This shows that the parameters estimated using batch estimation technique for a normal SLFP may not always give the right parameters to characterize the stability of the system during PIO experiments. It can be seen that the pilot increased the gain to counter the decreasing bandwidth and the pilot was not able to generate significant lead ( T L > T 1 ) to counter the time lag injected. However, the pilot’s time delay is within the bounds of the time delay given in Table 4. This suggests that the “Phastball” pilot needs minimum time delay around that value to acquire visual feedback from “Phastball” and decide on control action during a PIO event.
It is also important to note that a straight forward human pilot delay of 300 ms may not properly characterize all PIO scenarios. As with an increase in delay, the phase lag increases and the phase margin decreases and even a small mistake by human pilot can cause oscillation. Such analysis does not provide information about the condition when PIOs are caused because of increased workload on the human pilot, such that the pilot over reacts for small error for small values of delay in the system. This explains why Category 1 PIO predictions are so sensitive to the human operator delay.

5.2. Category 2 PIO

As mentioned earlier, a straight forward frequency domain analysis is not feasible to determine Category 2 PIO susceptibility due to actuator rate limiting. During a fully developed PIO due to rate-limited actuators, the pilot is treated as a synchronous pilot (i.e., pilot commands are in sync with the pitch error) instead of the lead-lag pilot model for which parameters were estimated in Section 4. In short, the pilot essentially acts as a pure gain [9,10,11,40]. The closed-loop system in use while doing PIO analysis is shown in Figure 17.
However, a quasi-linear analysis using describing function method can be used to estimate the phase and magnitude of the rate-limited actuator which can then be used for stability analysis. The describing function developed here assumes a sinusoidal input to the rate-limited actuator and the magnitude and phase of the output is given by [40,41].
| δ e ( j ω ) δ c ( j ω ) | = 8 π 2 K * = 4 R L π A ω rad · s 1 / rad · s 1
K * = R L A ω π 2 rad · s 1 / rad · s 1
δ e ( j ω ) δ c ( j ω ) = tan 1 1 K * 2 1 rad / rad
where δ e ( j ω ) is the actual elevator deflection, δ c ( j ω ) is the commanded elevator deflection, R L is the maximum rate limit of the elevator actuator, A and ω are the amplitude and the frequency (Hz) of the δ c ( j ω ) sinusoid respectively. The magnitude and the phase of the describing function for rate limiting are dependent on the input sinusoid amplitude and the frequency. However, a plot can be created for the gain and phase of the describing function as a function of K * from Equations (7)–(9). Figure 18 shows the plot of the phase and gain of the actuator output as K * changes.
The gain of the synchronous pilot model is increased until the Nichols plot of the linear system is tangent with the describing function. This point corresponds to the gain value of the synchronous pilot model near the PIO condition. For “Phastball” PVS, this pilot gain was found to be equal to 8.1 with 40 phase lag and 1.86 dB gain attenuation. Figure 19 shows the Nichols plot of “Phastball” PVS with respect to describing function after the pilot gain adjustment.
The frequency value at which the Nichols plot is tangent with the describing function gives the limit cycle frequency of the system. The limit cycle frequency for “Phastball” was found to be 14.51 rad/s which is significantly higher than the PIO frequency observed for the “Phastball” system due to all values of elevator actuator rate-limiting used for PIO experiments (2.09–0.12 rad/s). Also the pilot gain obtained from this method near PIO condition is much higher than any gain values estimated in Section 4. This mismatch in result was anticipated because in “Phastball” Category 2 PIO experiments, due to elevator actuator rate limiting it was noticed that the actual pilot commands were in fact pulse like instead of sinusoidal. Figure 20 and Figure 21 shows pilot command during a fully developed PIO event for different values of elevator actuator rate limits.
In Figure 20 the frequency of oscillation is approximately 2.09 rad/s and in Figure 21 the frequency of oscillation is approximately 1.26 rad/s, both are different from the frequency predicted using describing function technique. These observations suggest that the “Phastball” pilot should be approximated as a bang-bang controller in a fully developed Category 2 PIO for “Phastball”. The actuator rate limiting and the doublet trigger made the pilot to increase the gain with bang-bang control being the worst-case gain scenario [42,43] and also the pilot command consists of significant dead band. This particular way of applying the describing function approach is suitable for a single non-linearity. There are two different non-linearity (rate limiting and dead band) present in the PVS and consequently the results are different compared to the actual flight experiments.
To address this issue, the stability analysis of “Phastball” is further carried out using PVS simulations (with the pilot modeled as a bang-bang controller [42,43]) and by comparing the simulated results with actual flight data. The simulation includes both dead band and rate limiting non-linearity. The simulation was carried out for different pitch error threshold ranging from | 3 | to | 8 | obtained from the portion of flight data when pilot was not generating elevator command for non-zero pitch error. The pitch error threshold refers to error threshold below which pilot does not react.
Figure 22 shows the simulation results for the 31.46 /s elevator rate limit. The frequency of oscillation observed in simulation was 2.09 rad/s, similar to flight test results.
It was also observed from the simulations that the oscillation phenomenon is very sensitive to the threshold value with the system being more prone to PIO when a low error threshold for the pilot is assumed when the elevator rate limit is activated. This points to the importance of recognizing the adaptability of the human pilot in analyzing susceptibility of the PVS to PIO. It was observed from the simulations that if the elevator rate limit is severe and the pilot reacts with a high gain (i.e., bang-bang) for minute changes in the pitch angle; i.e., pilot has a low threshold for pitch error, the closed-loop PVS oscillates. Also, since “Phastball” is longitudinally stable, if the pilot does not react abruptly to small pitch errors then the simulation does not show any PIO. Table 5 provides the accuracy of using the simulation technique in determining the PIO susceptibility of “Phastball”. The susceptibility was measured for a conservative case when pilot error threshold is low ( | 3 | ) (i.e., pilot is focused and is actively controlling the aircraft).
Table 5 shows that the simulation technique prediction results are slightly better than the OLOP technique for the no PIO case. Note that OLOP criterion also uses describing function technique for the analysis and it was seen from the flight data that pilot should be treated as bang-bang controller for the case of “Phastball”.

6. Conclusions

This paper answers several questions regarding PIOs susceptibility and human pilot characteristics using flight data collected with a remotely controlled “Phastball” aircraft such as:
  • Is PIO possible in UAS?
    Section 2 provides example of PIO events seen during “Phastball” flight test.
  • Effectiveness of existing PIO criteria developed for manned aircraft when applied to UAS?
    Section 3 evaluates various existing PIO criteria for “Phastball” for both Category 1 and Category 2 PIO for “Phastball”. Existing Category 1 PIO methods such as Bandwidth/Pitch Rate Overshoot and Phase Rate criteria and the Category 2 PIO method OLOP provide sufficiently accurate PIO predictions for “Phastball”. The conventional PIO analysis techniques which do not agree with “Phastball” flight test results, such as Neal-Smith and Phase Template criteria can in part be attributed to the fact that the existing PIO susceptibility boundaries were developed for large manned aircraft and the same boundaries may not hold for a small R/C aircraft like “Phastball”.
  • Batch estimation technique accuracy in determining McRuer model parameters?
    Section 4 carries out batch estimation of the data for straight leg and landing phase. The batch estimated parameters gave poor validation results. However, they still provided valuable information regarding the frequency characteristics of the pilot command.
  • Closing the loop with pilot model and stability analysis accuracy for predicting PIO events?
    In Section 5 the estimated pilot model was used to determine the Category 1 PIO susceptibility for “Phastball” and it was observed that the delay margin of the PVS is highly susceptible to human pilot intrinsic delay and workload. On the other hand, a fully developed Category 2 PIO (due to elevator actuator rate limiting) flight data showed that the pilot command is of bang-bang control nature during the PIO event. This renders the lead-lag pilot model inapplicable to determine the Category 2 PIO susceptibility for “Phastball”. The bang-bang control nature of the pilot also rendered describing function technique to determine Category 2 PIO susceptibility inapplicable. Therefore, PVS simulations were carried out for the “Phastball” system for various inputs to obtain additional information about the Category 2 PIO susceptibility of “Phastball” due to elevator actuator rate limiting. It was observed in simulations that “Phastball” Category 2 PIO susceptibility is sensitive to pilot’s threshold for pitch error (the pitch error below which pilot does not react). Simulations also showed the pilot threshold values at which PIO appears decreases with decreasing value of rate limit on the actuators.
A secondary contribution of this study is the development of an alternative way to collect flight data for studying PIO events and human pilot behavior without putting human life in danger and within reasonable operational costs. The use of unmanned aircraft provides flexibility in designing experiments where loss of control is highly probable so that human pilot characteristics during such events can be studied using real flight data with application to improving aviation safety.
From the standpoint of pilot model parameter estimation, it was observed that the batch estimation technique does not provide sufficient information regarding the variability of human pilot model parameters. Therefore, current research is focused on developing techniques for reliable estimation of pilot model parameters in real-time and predict the onset of loss of control events in real time. For future studies, PIO experiments are being designed for the landing phase where the pilot is more involved in controlling the aircraft and more nervous about causing an accident. Also in the future experiments the pilot will not have any knowledge of the added time delay or the rate limit, which will be injected into the system by researcherst from a ground control station.

Acknowledgments

This research was supported in part by NASA grant # NNX12AM56A.

Author Contributions

Yu Gu was the principal investigator and conceived the research. Tanmay K. Mandal contributed to designing experiments, data collection, and analysis.

Conflicts of Interest

The authors declare no conflict of interest.

Abbreviations

The following abbreviations are used in this manuscript:
ω B w Bandwidth frequency (Bandwidth/Pitch Rate criterion)
ω 180 Frequency at phase 180
ω c r Critical frequency (Smith-Geddes criterion)
ω o n s e t Close-loop onset frequency
θ ( s ) Aircraft pitch angle
ϕPhase angle
ϕ c r Critical phase (Smith-Gedded criterion)
δ p ( s ) Pilot commanded elevator deflection
δ e ( s ) Elevator deflection
τ p Phase delay (Bandwidth/Pitch Rate criterion)
τPilot delay
η ( s ) Pilot remnant
E ( s ) Pitch error input to pilot model
KPilot gain
P ( s ) Pilot model output
P R 180 Phase rate parameter around 180 phase angle
R L Maximum elevator rate limit
SAverage slope of the attitude to stick deflection amplitude response
T L Pilot lead
T 1 Pilot lag
Gen-VGeneration V
GNCGuidance, Navigation, and Control
OLOPOpen Loop Onset Point
PIOPilot Induced Oscillation
PILPilot-In-Loop
PVSPilot Vehicle System
R/CRemote Controlled
SLFPSteady Level Flight Phase
WVUWest Virginia University
UASUnmanned Aircraft System

References

  1. Standard, M. Flying Qualities of Piloted Aircraft; Technical Report, MIL-STD-1797A; Department of Defense: Washington, DC, USA, 1990.
  2. Cooke, N.J. Human factors of remotely operated vehicles. In Proceedings of the Human Factors and Ergonomics Society Annual Meeting, San Francisco, CA, USA, 16–20 October 2006; Volume 50, pp. 166–169.
  3. McCarley, J.S.; Wickens, C.D. Human Factors Concerns in UAV Flight; Champaign Institute of Aviation, Aviation Human Factors Division, University of Illinois at Urbana: Urbana, IL, USA, 2004. [Google Scholar]
  4. Williams, W. UAV Handling Qualities….. You Must be Joking; Aerospace Sciences Corperation Pty. Ltd.: Springfield Lakes, Australia, 2003. [Google Scholar]
  5. McRuer, D.T. Aviation Safety and Pilot Control: Understanding and Preventing Unfavorable Pilot-Vehicle Interactions; The National Academies Press: Washington, DC, USA, 1997. [Google Scholar]
  6. Moorhouse, D.J. Flight Control Design—Best Practices; NATO Research and Technology-Organization (RTO-TR): Neuilly sur Seine, France, 2000; Volume 29. [Google Scholar]
  7. GARTEUR Action Group FM. Evaluation of Prominent PIO Susceptibility Criteria; Technical Report, Technical Report TP-120-01; Group for Aeronautical Research and Technology in EURop: Cranfield, UK, 1999. [Google Scholar]
  8. Neal, T.P.; Smith, R.E. An In-Flight Investigation to Develop Control System Design Criteria for Fighter Airplanes. Volume 2. Appendices 1 through 5; Technical Report, DTIC Document; Air Force Flight Dynamics Laboratory: Dayton, OH, USA, 1970. [Google Scholar]
  9. Duda, H. Prediction of pilot-in-the-loop oscillations due to rate saturation. J. Guid. Control Dyn. 1997, 20, 581–587. [Google Scholar] [CrossRef]
  10. Hanke, D. Handling Qualities Analysis on Rate Limiting Elements in Flight Control Systems; Advisory Group for Aerospace Research and Development, Flight Vehicle Integration Panel Workshop on Pilot Induced Oscillations 18 p(SEE N 95-31061 11-03); Advisory Group for Aerospace Research and Development: Neuilly sur Seine, France, 1995. [Google Scholar]
  11. Amato, F.; Iervolino, R.; Pandit, M.; Scala, S.; Verde, L. Analysis of pilot-in-the-loop oscillations due to position and rate saturations. In Proceedings of the 39th IEEE Conference on Decision and Control, Sydney, Australia, 12–15 December 2000; Volume 4, pp. 3564–3569.
  12. McRuer, D.T.; Jex, H.R. A review of quasi-linear pilot models. IEEE Tran. Hum. Factors Electron. 1967, HFE-8, 231–249. [Google Scholar] [CrossRef]
  13. Stapleford, R.L.; Peters, R.A.; Alex, F.R. Experiments and a Model for Pilot Dynamics with Visual and Motion Inputs; National Aeronautics and Space Administration (NASA): Moffett Field, CA, USA, 1969.
  14. Kleinman, D.L.; Baron, S.; Levison, W.H. A control theoretic approach to manned-vehicle systems analysis. IEEE Trans. Autom. Control 1971, 16, 824–832. [Google Scholar] [CrossRef]
  15. Johannsen, G.; Levis, A.H.; Stassen, H.G. Theoretical problems in man-machine systems and their experimental validation. Automatica 1994, 30, 217–231. [Google Scholar] [CrossRef]
  16. Pool, D.M.; Zaal, P.M.; Damveld, H.J.; van Paassen, M.M.; Mulder, M. Pilot equalization in manual control of aircraft dynamics. In Proceedins of the IEEE International Conference on Systems, Man and Cybernetics (SMC 2009), San Antonio, TX, USA, 11–14 October 2009; pp. 2480–2485.
  17. Zaal, P.M.T.; Pool, D.M.; Chu, Q.; Mulder, M.; Van Paassen, M.; Mulder, J.A. Modeling human multimodal perception and control using genetic maximum likelihood estimation. J. Guid. Control. Dyn. 2009, 32, 1089–1099. [Google Scholar] [CrossRef]
  18. Mandal, T.; Gu, Y.; Chao, H.; Rhudy, M. Flight Data Analysis of Pilot-Induced-Oscillations of a Remotely Controlled Aircraft. In Proceedings of the AIAA Guidance, Navigation, and Control Conference, Boston, MA, USA, 19–22 August 2013.
  19. Mandal, T.; Gu, Y. Pilot-Vehicle System Modeling Using Sub-Scale Flight Experiments. In Proceedings of the AIAA Modeling and Simulation Technologies Conference (AIAA 2014-1004), National Harbor, MD, USA, 13–17 January 2014.
  20. Gross, J.N.; Gu, Y.; Rhudy, M.B.; Gururajan, S.; Napolitano, M.R. Flight-test evaluation of sensor fusion algorithms for attitude estimation. IEEE Trans. Aerosp. Electron. Syst. 2012, 48, 2128–2139. [Google Scholar] [CrossRef]
  21. Gururajan, S.; Gu, Y.; Seanor, B.; Prucz, J.; Napolitano, M. Evolution of the Flight Testing Program at West Virginia University in Support of Flight Control Research. In Proceedings of the 52nd Israel Annual Conference on Aerospace Sciences.
  22. Gu, Y.; Barchesky, F.; Chao, H.; Gross, J.; Napolitano, M. Avionics Design for a Sub-Scale Fault-Tolerant Flight Control Test-Bed; INTECH Open Access Publisher: Rijeka, Croatia, 2012. [Google Scholar]
  23. Mitchell, D.G.; Klyde, D.H. A critical examination of PIO prediction criteria. In Proceedings of the AIAA Atmospheric Flight Mechanics Conference, Boston, MA, USA, 10–12 August 1998.
  24. Mitchell, D.G.; Klyde, D.H. Bandwidth Criteria for Category I and II PIOs; The workshop “Pilot-Induced Oscillation Research: The Status at the End of the Century, NASA Dryden”; NASA Dryden Flight Research Center: Hampton, VA, USA, 2001.
  25. Gibson, J.C. The Prevention of PIO by Design; AGARD Conference Proceedings Agard CP. DTIC Document; Advisory Group for Aerospace Research and Development: Neuilly sur Seine, France, 1995; p. 2. [Google Scholar]
  26. Gururajan, S.; McGrail, A.; Gu, Y.; Seanor, B.; Napolitano, M.; Prucz, J.; Phillips, K. Identification of Aerodynamic Parameters for a Small UAV from Flight Data. In Proceedings of the 52nd Israel Annual Conference on Aerospace Sciences.
  27. Pavel, M.D.; Masarati, P.; Gennaretti, M.; Jump, M.; Zaichik, L.; Dang-Vu, B.; Lu, L.; Yilmaz, D.; Quaranta, G.; Ionita, A.; et al. Practices to identify and preclude adverse Aircraft-and-Rotorcraft-Pilot Couplings—A design perspective. Prog. Aerosp. Sci. 2015, 76, 55–89. [Google Scholar] [CrossRef] [Green Version]
  28. Levine, W.S. Aerospace Controls. In The Control Handbook; CRC Press: Boca Raton, FL, USA, 1996; p. 1287. [Google Scholar]
  29. Tischler, M.B. Advances in Aircraft Flight Control; CRC Press: Boca Raton, FL, USA, 1996. [Google Scholar]
  30. Pratt, R. Flight Control Systems: Practical Issues in Design and Implementation; The Institution of Engineering and Technology: Stevenage, UK, 2000; Number 57. [Google Scholar]
  31. Hoh, R.H.; Mitchell, D.G.; Ashkenas, I.L.; Klein, R.H.; Heffley, R.K. Proposed MIL Standard and Handbook-Flying Qualities of Air Vehicles; Proposed MIL Handbook; Technical Report; DTIC Document; Systems Technology Inc.: Hawthorne, CA, USA, 1982; Volume 2. [Google Scholar]
  32. Smith, R.H. The Smith-Geddes Criteria. In Proceedings of the SAE Aerospace Control and Guidance Systems Committee Meeting, Reno, NV, USA, 11 March 1993.
  33. Smith, R.H.; Geddes, N.D. Handling Quality Requirements for Advanced Aircraft Design: Longitudinal Mode; Technical Report; DTIC Document; Systems Research Labs Inc.: Dayton, OH, USA, 1979. [Google Scholar]
  34. Gibson, J.C. Evaluation of alternate handling qualities criteria in highly augmented unstable aircraft. Am. Inst. Aeronaut. Astronaut. 1990, 2844. [Google Scholar]
  35. Gibson, J.; St Annes, L. Looking for the Simple PIO Model; Advisory Group for Aerospace Research and Development, Flight Vehicle Integration Panel Workshop on Pilot Induced Oscillations 11 p(SEE N 95-31061 11-03); DTIC Document; Advisory Group for Aerospace Research and Development: Neuilly sur Seine, France, 1995. [Google Scholar]
  36. Gilbreath, G.P. Prediction of Pilot-Induced Oscillations (PIO) Due to Actuator Rate Limiting Using the Open-Loop Onset Point (OLOP) Criterion; Technical Report; DTIC Document; Air Force Inst of Tech Wright-Patterson: Dayton, OH, USA, 2001. [Google Scholar]
  37. Taylor, L.W., Jr. A comparison of human response modeling in the time and frequency domains. In Proceedings of the Third Annual NASA-University Conference on Manual Control, NASA SP-144, Los Angeles, CA, USA, 1–3 March 1967; pp. 137–153.
  38. Gu, Y.; Seanor, B.; Campa, G.; Napolitano, M.R.; Gururajan, S. Autonomous Formation Flight: Design and Experiments; INTECH Open Access Publisher: Rijeka, Croatia, 2009. [Google Scholar]
  39. McRuer, D.T.; Krendel, E.S. Mathematical Models of Human Pilot Behavior; Technical Report; DTIC Document; Advisory Group for Aerospace Research and Development: Neuilly sur Seine, France, 1974. [Google Scholar]
  40. Klyde, D.H.; Mitchell, D.G. Investigating the role of rate limiting in pilot-induced oscillations. J. Guid. Control Dyn. 2004, 27, 804–813. [Google Scholar] [CrossRef]
  41. Klyde, D.H.; McRuer, D.T.; Myers, T.T. PIO analysis with actuator rate limiting. In Proceedings of the AIAA Atmospheric Flight Mechanics Conference, San Diego, CA, USA, 29–31 July 1996; pp. 569–580.
  42. Smith, R.H. Predicting and validating fully-developed PIO. In Proceedings of the Guidance, Navigation, and Control and Co-located Conferences, Scottsdale, AZ, USA, 1–3 August 1994; pp. 1162–1166.
  43. Young, L.R.; Meiry, J.L. Bang-bang aspects of manual control in high-order systems. IEEE Trans. Autom. Control 1965, 10, 336–341. [Google Scholar] [CrossRef]
Figure 1. “Phastball” aircraft and its main avionics hardware.
Aerospace 03 00042 g001
Figure 2. GPS trajectory of a typical flight, flight path highlighted with red corresponds to control switch in the on position.
Aerospace 03 00042 g002
Figure 3. Pilot-Induced Oscillation (PIO) event following injection of 500 ms delay.
Aerospace 03 00042 g003
Figure 4. PIO event following 8.25 /s elevator actuator rate limit.
Aerospace 03 00042 g004
Figure 5. Plot of bandwidth and phase delay on the criteria plane [18].
Aerospace 03 00042 g005
Figure 6. Phase rate criterion applied to “Phastball” system.
Aerospace 03 00042 g006
Figure 7. Gain phase template for “Phastball”.
Aerospace 03 00042 g007
Figure 8. OLOP analysis result for “Phastball”.
Aerospace 03 00042 g008
Figure 9. Typical values of pitch angle error and commanded elevator deflection during steady level flight.
Aerospace 03 00042 g009
Figure 10. Amplitude spectrum of commanded elevator deflection.
Aerospace 03 00042 g010
Figure 11. Comparison of red and green “Phastball” elevator commands in formation flight for Steady Level Flight Phase (SLFP).
Aerospace 03 00042 g011
Figure 12. Amplitude spectrum of elevator command during formation flight for SLFP.
Aerospace 03 00042 g012
Figure 13. Estimation example for SLFP portion for lead-lag pilot model.
Aerospace 03 00042 g013
Figure 14. Validation example for lead-lag pilot model.
Aerospace 03 00042 g014
Figure 15. Pitch Angle and Elevator deflection during flight experiment for 300 ms induced delay.
Aerospace 03 00042 g015
Figure 16. Pilot parameter estimation result for injected delay of 500 ms.
Aerospace 03 00042 g016
Figure 17. Closed Loop PVS system simulation used to analyze PIOs due to elevator rate limiting.
Aerospace 03 00042 g017
Figure 18. Rate limit describing function characteristics.
Aerospace 03 00042 g018
Figure 19. Nichols plot of “Phastball” with respect to describing function after pilot gain adjustment.
Aerospace 03 00042 g019
Figure 20. Flight experiments for 31.46 /s elevator rate limit.
Aerospace 03 00042 g020
Figure 21. Flight experiments for 8.25 /s elevator rate limit.
Aerospace 03 00042 g021
Figure 22. Simulation result for 31.46 /s elevator rate limit.
Aerospace 03 00042 g022
Table 1. PIO susceptibility prediction using bandwidth/pitch rate overshoot method and actual flight test results.
System Delay Introduced (ms)Susceptibility to PIO (Prediction)Number of Flights PIO ObservedNumber of Flights PIO Not Observed
0Very LowNo PIO observed in any flight
100Low03
200High03
300High11
400Very High11
500Very High20
600Very High20
Table 2. Smith-Geddes criterion evaluation for “Phastball”.
System Delay Introduced (ms) ϕ cr ( )Susceptibility to PIO (Prediction)Number of Flights PIO ObservedNumber of Flights PIO Not Observed
0−33.53Not SusceptibleNo PIO observed in any flight
100−63.07Very Low03
200−92.34Very Low03
300−121.66Low11
400−151.20High11
500−181.26Very High20
600−210.81Very High20
Table 3. “Phastball” flight test results for different values of elevator rate limit.
PredictionNumber of Flights PIO ObservedNumber of Flights PIO Not Observed
No PIO220
PIO141
Table 4. Range of values of parameters for lead-lag pilot model SLFP.
K p T L T 1 τ (ms)
Range of Values0.2856–0.58230.0200–0.87420.0624–1.048192–980
Mean0.31240.35800.85217428
Standard Deviation0.10260.147870.2143147
Table 5. “Phastball” PIO susceptibility prediction result using simulation technique.
PredictionNumber of Flights PIO ObservedNumber of Flights PIO not Observed
No PIO121
PIO141

