Field Trial Measurements to Validate a Stochastic Aircraft Boarding Model


Department of Air Transportation, German Aerospace Center (DLR), Lilienthalplatz 7, 38108 Braunschweig, Germany
Aerospace 2018, 5(1), 27; https://doi.org/10.3390/aerospace5010027
Submission received: 2 February 2018
/
Revised: 1 March 2018
/
Accepted: 5 March 2018
/
Published: 7 March 2018
(This article belongs to the Special Issue Application of Multiagent Systems and Artificial Intelligence Techniques in Aviation)
Abstract
:Efficient boarding procedures have to consider both operational constraints and the individual passenger behavior. In contrast to the aircraft handling processes of fueling, catering and cleaning, the boarding process is more driven by passengers than by airport or airline operators. This paper delivers a comprehensive set of operational data including classification of boarding times, passenger arrival times, times to store hand luggage, and passenger interactions in the aircraft cabin as a reliable basis for calibrating models for aircraft boarding. In this paper, a microscopic approach is used to model the passenger behavior, where the passenger movement is defined as a one-dimensional, stochastic, and time/space discrete transition process. This model is used to compare measurements from field trials of boarding procedures with simulation results and demonstrates a deviation smaller than 5%.
1. Introduction
Operational air transportation processes have to be efficient in both cost and operational strategies. The passenger handling at airports mainly aims at reliable on-time performance for the boarding process. For aircraft boarding, a specific amount of passenger trajectories (individual path along handling stations, such as check-in or security control, and corresponding timestamps [1]) and the associated 4D aircraft trajectory [2,3] are brought together in one point of space and time. Thus, boarding holds a significant potential for influencing the whole aircraft trajectory over the day of operations.
The aircraft trajectory consists of an air and a ground part. The aircraft ground handling processes to prepare the outbound flight are defined as the aircraft turnaround and take place between the in-block (arrival) and off-block (departure) at the apron/gate position [4,5,6]. From an operational point of view, passenger boarding becomes more important if an aircraft demands a short turnaround time, since the operational buffers become smaller and boarding will be on the critical path of the turnaround [7]. For the air traffic management, the turnaround has to provide a reliable basis for the operational procedures on the day of operations. From the airline perspective, the boarding process allows the provision of specific airline products (e.g., priority boarding and loyalty program), which results in a dedicated airline revenue management for further improving the economic revenue of a flight.
Whereas the turnaround processes are controlled by the operational personnel from the airport, airline, and ground handling agents, boarding is mainly influenced by individual passenger behavior, which includes the willingness and ability to follow the designated boarding processes in an efficient manner. The passenger behavior is characterized by individual attributes, such as late arrival at the gate, amount of hand luggage, physical constraints (e.g., reduced mobility [8,9]), group constellations, travel purpose (business or leisure), as well as time needed for orientation in the cabin or for storing the hand luggage (cf. [10]).
1.1. Status quo
In the following section, a short overview concerning scientific research on aircraft boarding problems is given. Comprehensive overviews are provided for aircraft turnaround [11], boarding [12], and corresponding economic impact [13,14,15]. Relevant studies include, but are not limited to, the following current examples.
A common goal of simulation-based approaches is to minimize the time that is required for passengers to board the aircraft. A study [16] investigated the efficiency of different boarding strategies, considering specific boarding patterns. A similar approach focused particularly on disturbances to the boarding sequence caused by early or late arrivals of passengers [17]. The results showed faster boarding times for the commonly used back-to-front boarding in the case of passengers not boarding in their previously assigned boarding block. This fact indicated that a back-to-front policy is not an optimal solution for the boarding problem. Picking up the idea of block boarding, a study based on an analytical model [18] showed significantly improved boarding times for block policies compared to the back-to-front policy. In contrast, research contributions supported the back-to-front policy in comparison to the random boarding strategy (cf. [19]). A stochastic cellular automaton model [20] demonstrated that back-to-front boarding is most efficient if two boarding blocks are used, which was confirmed using a 1 + 1 polynuclear growth model with concave boundary conditions [21]. In [22], a cellular Discrete-Event System Specification (Cell-DEVS) is used to provide evaluation of aircraft boarding strategies.
A minimum interference of passengers during the seating process was focused by using a mixed integer linear program for optimization [23]. A stochastic approach [20] covered individual passenger behavior (e.g., passenger conformance to the proposed boarding strategy, and individual hand luggage amount and distribution) and aircraft/airline operational constraints of aircraft/airlines (e.g., seat load factor and arrival rates). Using a Markov Chain Monte Carlo optimization algorithm, a boarding strategy was developed [24] assuming that the handling of the hand luggage is a major impact factor for the boarding time and a model based on fundamental statistical mechanics was provided [25]. A power law rule was identified [26], where the boarding time scales with the number of passengers to board, which allowed the prediction of back-to-front boarding strategy, and was extended to large numbers of passengers [27].
A boarding model was developed, which considers passengers’ individual physique (maximum speed), quantity of hand luggage, and individually preferred distance [28]. Based on a specific boarding strategy [24], a method assigned passengers to seats so that their luggage is distributed evenly throughout the cabin [29], assuming a less time-consuming process for finding available storage in the overhead bins. The prioritization of passengers with a high number of hand luggage items to board first was focused by [30]. The impact of hand luggage was investigated further [31] and passengers were assigned to seats according to the number of hand luggage items proposing that passengers with few pieces should be seated close to the entry. To minimize individual interference, effects of passenger groups during boarding were analyzed [32].
An analytical approach demonstrated [33] that the efficiency of boarding strategies is linked to the aircraft interior design (seat pitch and passengers per row). Furthermore, different aircraft seating layouts and alternative designs could significantly reduce the boarding time for both single and twin-aisle configuration [7,34]. The aircraft design and, in particular, the impact of aircraft cabin modifications with regard to the boarding efficiency was analyzed by [35], while studies evaluated novel aircraft layout configurations and seating concepts for single and twin-aisle aircraft with 180–300 seats [36,37].
1.2. Objectives and Document Structure
In the context of input data for boarding models, there are only limited datasets available to provide reliable input for boarding models. These datasets are from experimental mock-ups [38], observations during boarding operations [39,40], and small scale experiments [41,42]. Therefore, this paper provides a reliable dataset for calibrating models for aircraft boarding and covers a broad range of input factors. In recent years data from more than 400 flights were manually recorded with a different focus and level of details: passenger processes (e.g., time to store hand luggage or time needed to take the seat), arrival rates at the aircraft, and boarding time using different boarding strategies. After a brief introduction of the stochastic boarding model, the recorded data are systematically analyzed and used to calibrate the boarding model [7,20]. In the next stage, data from two airline field trials are used as a reference to demonstrate the reliability of the stochastic approach. For this reason, the observed operational constraints (e.g., boarding procedures and arrival rates) are implemented in the existing simulation environment and the simulation results are compared against the field measurements. Finally, the conclusion provides an overview concerning the achieved results and an outlook on future research activities.
2. Stochastic Boarding Model
Scientific approaches often not consider the operational conditions in the context of aircraft boarding, such as seat load and passenger’s ability or willingness to follow the proposed procedure (conformance). In addition, the non-deterministic nature of the accompanied handling processes and input parameter is rarely considered (e.g., amount and distribution of hand luggage). Furthermore, there is a clear lack of reliable data from the aircraft operations and the passenger handling. Assumptions regarding the inner processes are often derived from simplified research environments or gathered in less realistic test setups. To bridge this gap, data from the field are manually recorded during the day of operations to calibrate the sub-processes of a stochastic aircraft boarding model [7,20].
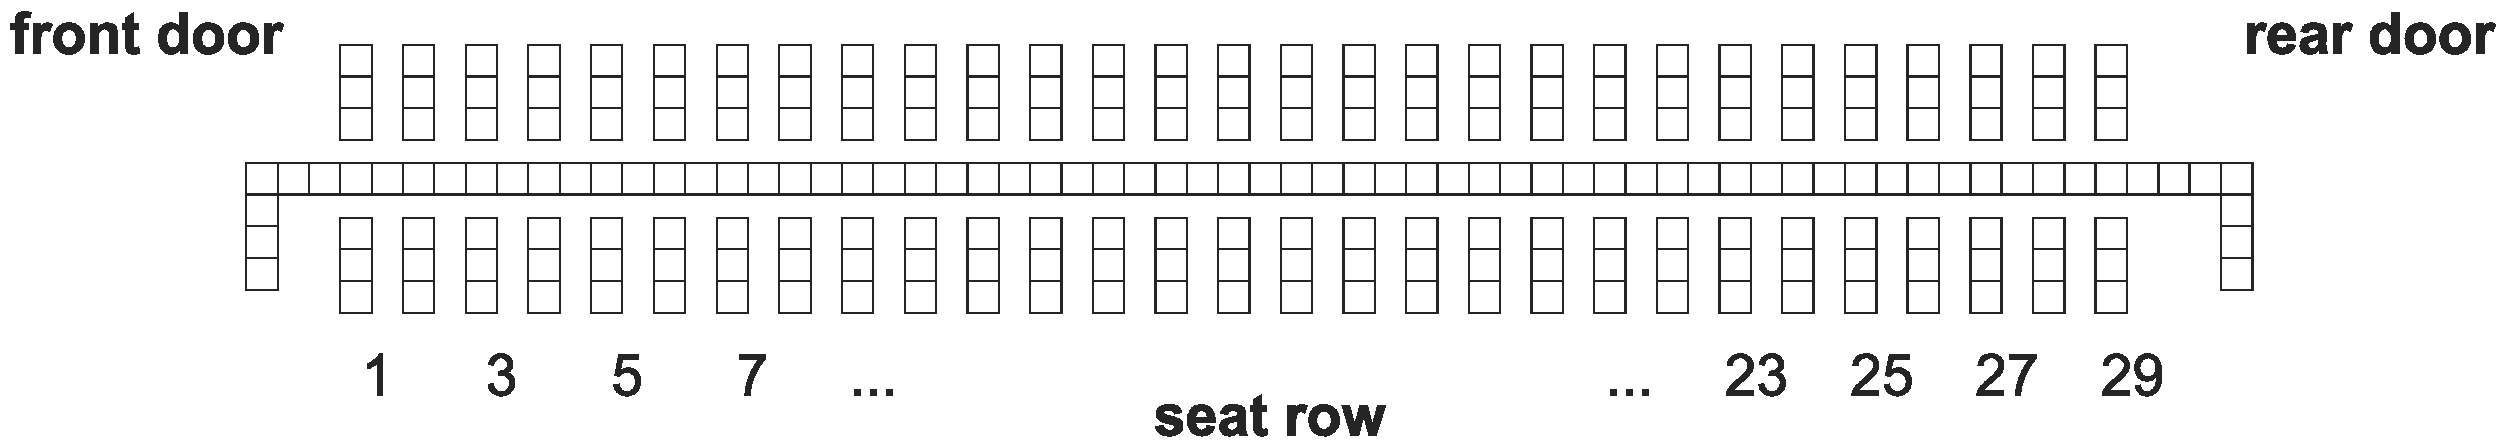
The used dynamic model for the boarding simulation is based on an asymmetric simple exclusion process (ASEP [43]). The ASEP was successfully adapted to model the dynamic passenger behavior in the airport terminal environment [1,10,44]. In this context, passenger boarding is assumed to be a stochastic, forward-directed, one-dimensional and discrete (time and space) process. To provide both an appropriate set of input data and an efficient simulation environment, the aircraft seat layout is transferred into a regular grid with aircraft entries, the aisle(s) and the passenger seats as shown in Figure 1. In this context, the Airbus 320 with 29 seat rows (single aisle, 174 seats) is used as a common reference aircraft to allow efficient comparisons of achieved results within the research community. The regular grid consists of equal cells with a size of 0.4 m × 0.4 m, whereas a cell can either be free or contain exactly one passenger.
The boarding progress consists of a simple set of rules for the passenger movement: (a) enter the aircraft at the assigned door (based on the current boarding scenario); (b) move forward from cell to cell along the aisle until reaching the assigned seat row; and (c) store the hand luggage (aisle is blocked for other passengers) and take the seat. The movement process only depends on the state of the next cell (free or occupied). The storage of the hand luggage is a stochastic process and depends on the individual amount of hand luggage. The seating process is stochastically modelled as well, whereas the time to take the seat depends on the already used seats in the corresponding row. The stochastic nature of the boarding process requires a minimum of simulation runs for each selected scenario to derive reliable simulation results. In this context, a simulation scenario is mainly defined by the underlying seat layout, the number of passengers to board (seat load factor, default: 85%), the arrival frequency of the passengers at the aircraft (default: 14 passengers per minute), the number of available doors (default: 1 door), the specific boarding strategy (default: random) and the conformance of passengers in following the current strategy (default: 85%). The default values are used to define the reference boarding scenario, which is the benchmark to evaluate boarding performance. In this context, the conformance of passengers only impacts non-random boarding strategies. Further details regarding the model and the simulation environment are provided by [7,20].
In the simulation environment, the boarding process is implemented as follows. Depending on the seat load, a specific number of randomly chosen seats are used for boarding. For each seat, a passenger (agent) is created. The agent contains individual parameters, such as number of hand luggage items, maximum walking speed in the aisle (set for all agents to 0.8 m/s), seat coordinates, time to store the hand luggage and arrival time at the aircraft door. Further, several process characteristics could be saved during the simulation runs (e.g., waiting times, number of interactions). To create the time needed to store the hand luggage, a triangular distribution provides a stochastic time value depending on the number of items (see [7,20]). The agents are sorted with regard to their seats and the current boarding strategy. From this sequence, a given percentage of agents (conformance rate) are taken out of the sequence and inserted into a position, which contradicts the current strategy (e.g., inserted into a different boarding block). According to the arrival time distribution (e.g., linear or exponential) and the boarding sequence, each agent gets a timestamp to appear on the aircraft door queue. When the simulation starts, the first agent of the queue always enters the aircraft by moving from the queue to the entry cell of the aisle grid (aircraft door), if this cell is free. In each simulation step, all agents located in the row are moved to the next cell, if possible (free cell and not arrived at the seat row), using a shuffled sequential update procedure (emulating parallel update behavior, cf. [10,43]). If the agent arrives at the assigned seat row, he waits on the aisle cell according to the time needed to store the hand luggage. Depending on the seat row condition (e.g., blocked aisle or middle seat or both), an additional time is stochastically generated to wait in the aisle to perform the seat shuffle. During the whole waiting process, no other agent can pass. If the waiting process finally finishes, the agent is set to the seat and the aisle cell is set free. Each boarding scenario is simulated 100,000 times, to derive statistically relevant results defined by average boarding time (start with first passenger arrives the aircraft and finished, when last passenger is seated) and standard deviation of boarding time.
To model different boarding strategies, the grid-based approach enables both the individual assessment of seats and classification/aggregation according to the intended strategy. In Figure 2, the seats are color-coded (grey-scale) and aggregated to a structure with three blocks of seats (per row and per designation). The boarding takes place in the order of the grey-scale value, from the back to the front (back-to-front sequence I-II-III) in the first example and from the outer to the inner seat designation (window to aisle, outside-in) in the second example. In this context, random boarding means that all passengers possess a seat, but the chronological order of the arrival of passengers is not defined. Block boarding stands for an optimized block sequence, which is, in the case of six equal blocks (numbered from the back to the front by I, II, III, IV, V, and VI), II-IV-VI-I-III-V. Finally, the back-to-front policy is only favorable for a two-block configuration [20,21].
The model does not address unruly behavior or counterflow passenger movements which may arise from individual problems in finding the assigned seat or blocked overhead compartments. In particular, the problem of blocked overhead compartments could not be solved by operational strategies, but with increased compartment capacity or a more restrictive airline policy regarding the amount of allowed hand luggage. If the airline does not react to high numbers of hand luggage items, a boarding approach to allow for evenly distributed hand luggage throughout the cabin is provided by [29].
3. Measurements and Calibration
This section will provide an overview of boarding times, boarding/deboarding rates, and measurements regarding the individual passenger behaviors inside the aircraft (seat interactions and hand luggage storage). Addressing the bilateral agreements with the concerned airlines and airports, the data sets are appropriately aggregated to be used in this research context. The data were manually and specifically recorded addressing the specific process to calibrate. This results in a high level of reliability, since each setup was controlled by the responsible examiner and contains additional descriptions of progress, setup and comments.
3.1. Field Measurements and Airline Trials
The data were recorded at several field measurements during actual aircraft turnarounds of Airbus A320 and Boeing B737/B738. Each measurement campaign aimed at different aspects of the individual boarding behavior of passengers and was realized in close cooperation with the corresponding airlines, ground handling agents, and airport operators. While passenger arrival/departure rates could be measured from outside the cabin by recording the individual time stamps of passengers passing the aircraft door, the hand luggage storage time and passenger interactions during the seating (seat shuffle) were recorded from positions inside the narrow aircraft cabin. Particularly, the specific seat shuffles required special attention and a close observation position, which results only in a limited number of measurements.
The first field measurements aimed to record the passenger boarding time and determine the correlation to the number of passengers boarded, which should be used as an input for an aircraft turnaround model [45]. The boarding time was defined as time between first passengers enters the aircraft (pass the aircraft door) and last passenger is seated. The boarding times were recorded at different German airports with different airlines during the summer periods 2010–2015. The observer cooperates closely with the ground handling companies and stands near the aircraft door, where the (inter-arrival) times between the passengers during boarding and deboarding could be additionally measured. The analysis of the boarding times shows a positive correlation (Section 3.2), but different categories of boarding speed exists (slow, medium, fast boarding), which are not indicated by the number of passengers. In the context of the aircraft turnaround, the boarding time consists of additional dependencies, which are mainly driven by the individual passenger behavior.
To cover this expected individual behavior during the passenger boarding process, the existing stochastic aircraft boarding model was planned to be calibrated with data from additional field trial measurements. Since inter-arrival times of passengers are already covered by the prior measurements (Section 3.3) passenger interactions are focused on, particularly the time to store the hand luggage (Section 3.4) and time for the seating process (Section 3.5). The measurements were taken in the summer period of 2012. For each flight, two observers were positioned inside the cabin to separately cover the front and rear part of the aircraft cabin. Therefore, the observers stood near the first and the last seat row or used unbooked seats.
To prove the reliability of the calibrated stochastic model, a third field measurement with a German airline was setup, to compare simulated boarding times with the actual boarding times of newly introduced boarding strategies (Section 4.1). Thus, the airline prepared an operational test phase in summer 2014 with the developed boarding strategies and recorded both the boarding time (in accordance to the definition above) and the number of passengers. The latest airline trials in 2015 and 2016 (Section 4.2) mainly focusses on the impact boarding strategies, operational configurations (one door and two doors), seat load factor, transfer mode (walk, bus shuttle, and gate), and destination.
3.2. Boarding Times
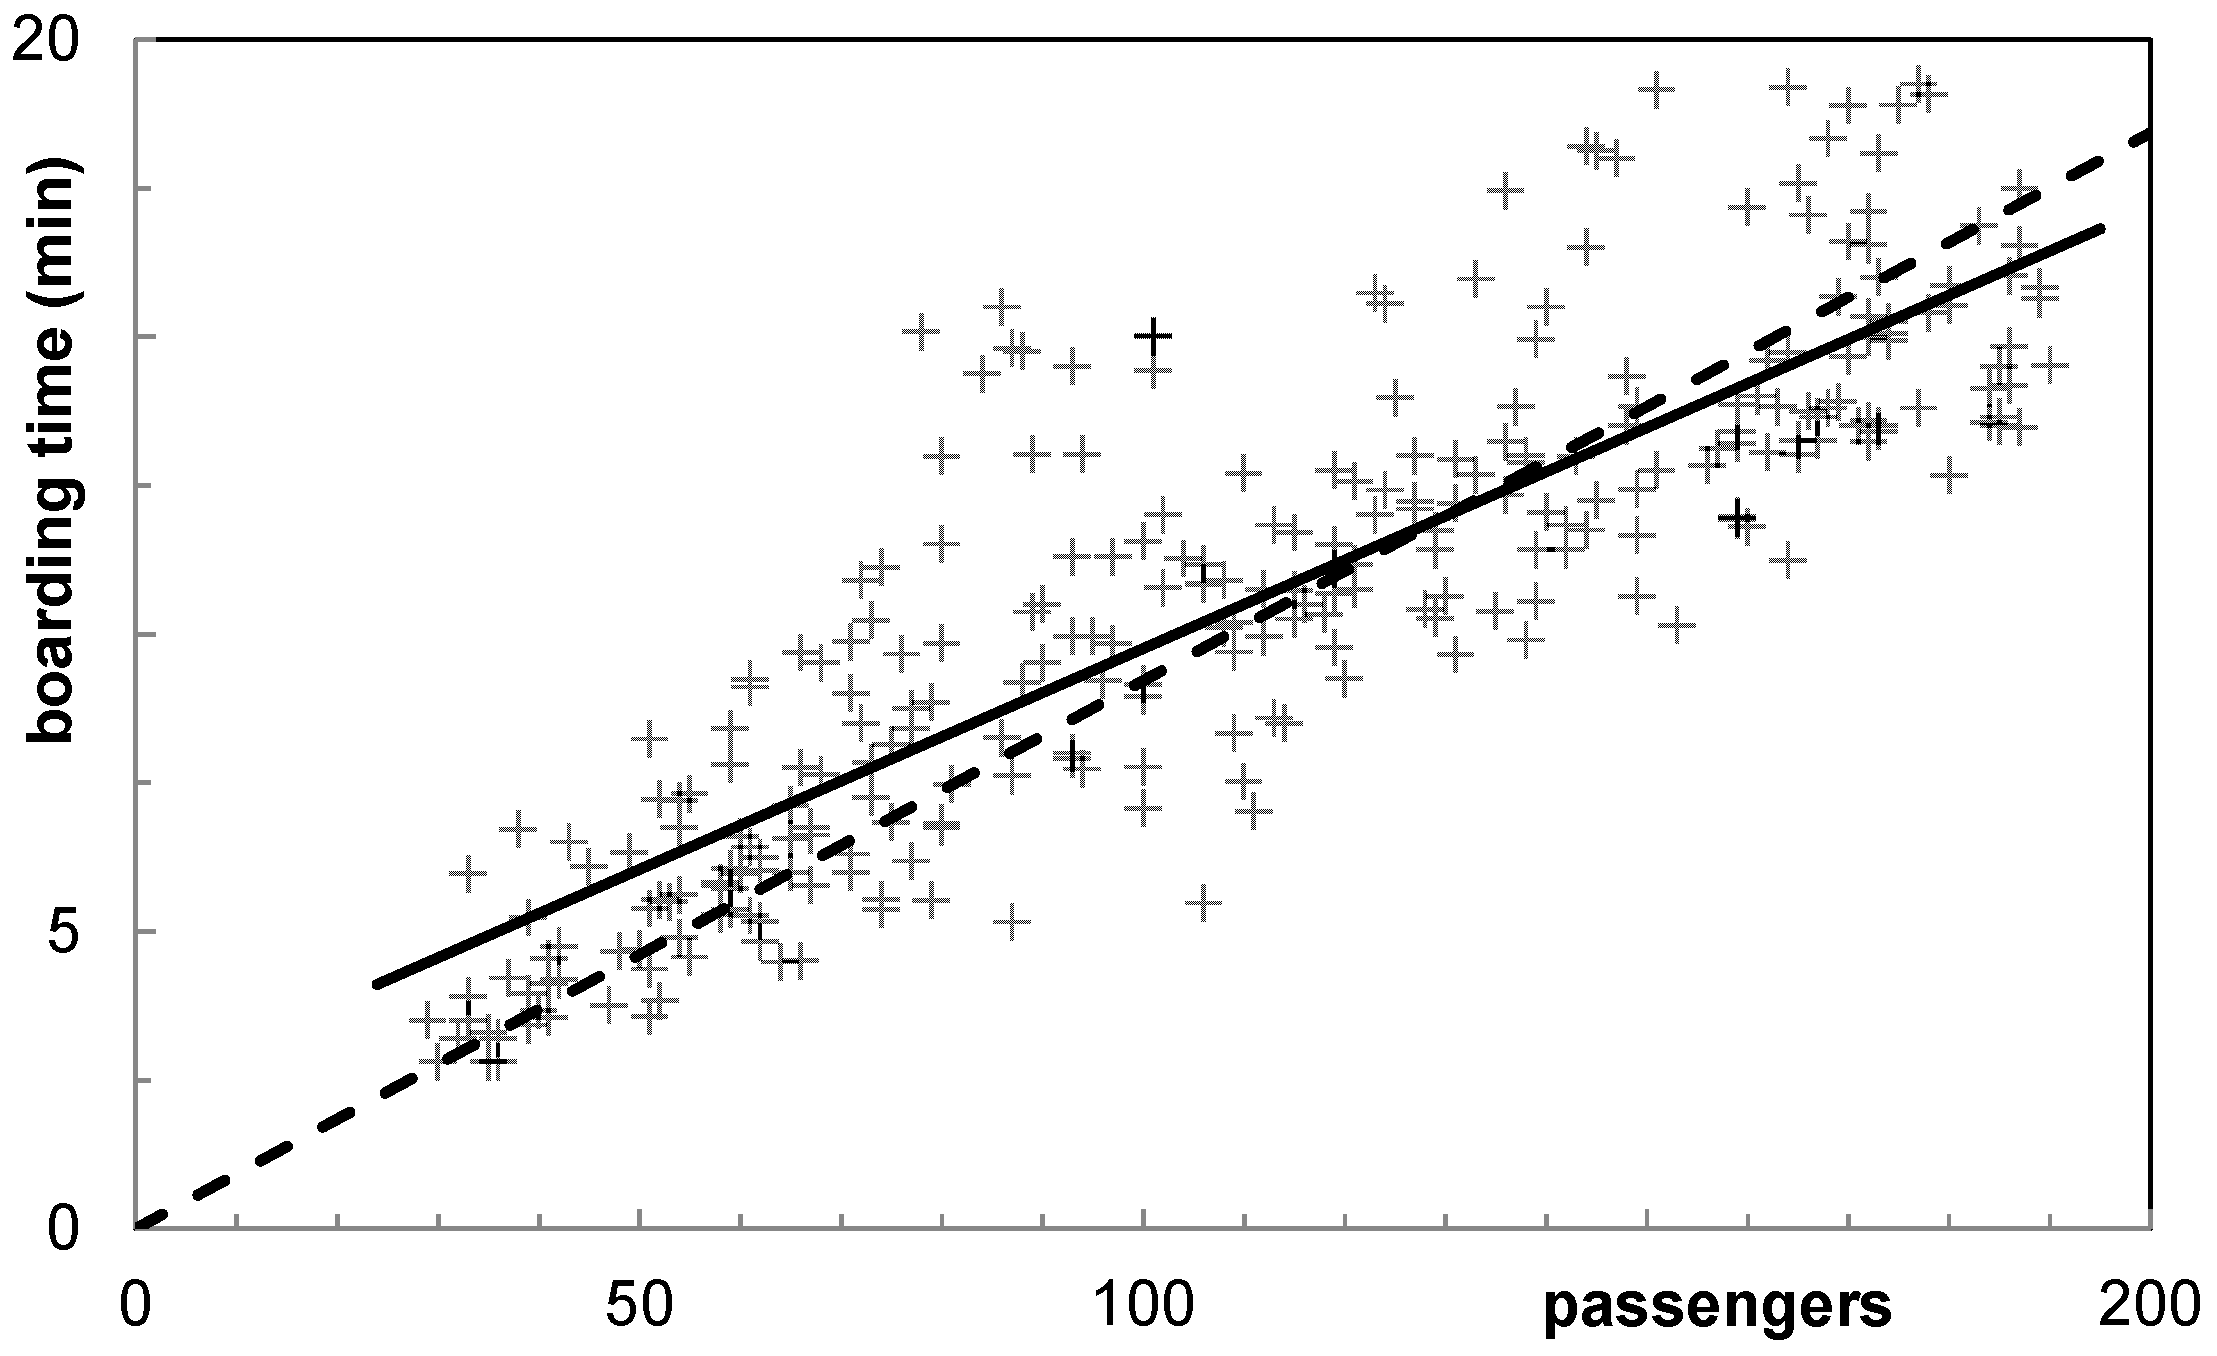
In Figure 3, the measurements of 282 boarding events for single-aisle aircraft (Airbus A320 and Boeing B737) are shown, with a minimum of 29 passengers (pax) and a maximum of 190 passengers. Assuming a linear boarding progress, boarding time increases for each passenger by 4.5 s with an additional offset of 2.3 min on average (bold regression line in Figure 3). In the simplest case, if the boarding time only depends on the number of passengers (no offset), a rate of 5.5 s per passenger has to be used (thin regression line in Figure 3). To derive a more sophisticated understanding of boarding times, the boarding time tB is weighted by the amount of passengers np, so the boarding rate is rnB = tB/np.
In a descriptive statistic summary, rnB can be characterized by the following quantiles: Q.10, Q.25, Q.50, Q.75 and Q.90 with values of 4.5 s/pax, 5.0 s/pax, 5.6 s/pax, 6.5 s/pax and 8.0 s/pax, respectively (positive skew). This descriptive summary demonstrates that 80% of rnB is in the range of 4.5 s/pax and 8.0 s/pax (between Q.10 and Q.90). According to the median (Q.50 = 5.6 s/pax), this is a spread of the boarding time from −19% to +44%. For a detailed analysis, the linear boarding progress is compared against the boarding measurements; a Q–Q plot is used (see Figure 4). In a Q–Q plot, the probability functions of two distributions are compared against each other. In the case of similarity, the data points converge to a diagonal line. Comparing the expected (linear function with tB = 5.5 s/pax × np) and the measured distribution of the boarding rate (boarding time weighted by number of passengers), a constant linear correlation does not seem to be a valid assumption.
The Q–Q plot indicates a classification into three sectors: fast, medium and slow boarding progress. In Figure 4, two prominent coordinates could be observed at 8.4 min and 12.1 min in the measured distribution. At 8.4 min, the boarding time per passenger decreases after a section of a nearly constant rate and at 12.1 min, an offset indicates a new section of boarding rate. If these values are used as section dividers, three sections with different boarding rates can be introduced. In Figure 5, the result of the classification is shown.
On the left side, the observed boarding times are separated according to a fast, medium and slow boarding progress. On the right side, the characteristics regarding the number of passengers according to the classification are shown (95 measurements with fast, 78 with medium, and 109 with slow boarding rates). Following the initial approach of linear correlation between the number of passengers and the boarding time (defined by slope and constant offset), the accompanied slope values are 1.0 s/pax, 1.2 s/pax, and 2.2 s/pax and the constant offsets are 12.3 min, 8.2 min, and 3.5 min for the slow, medium and fast classification respectively. In the following Table 1, the results of the classification are summarized and exemplarily chosen to point out the consequence of using a common average for scenarios with 80, 110, 140, and 170 passengers. According to Figure 5, these scenarios consist of a chance to be classified as boarding with a fast, medium or slow progress. Depending on both the scenario and the classification, the boarding time could accordingly deviate within a corridor of ± 5.3 min (170 pax: 15.0 min in the slow category and 9.7 min in the fast category).
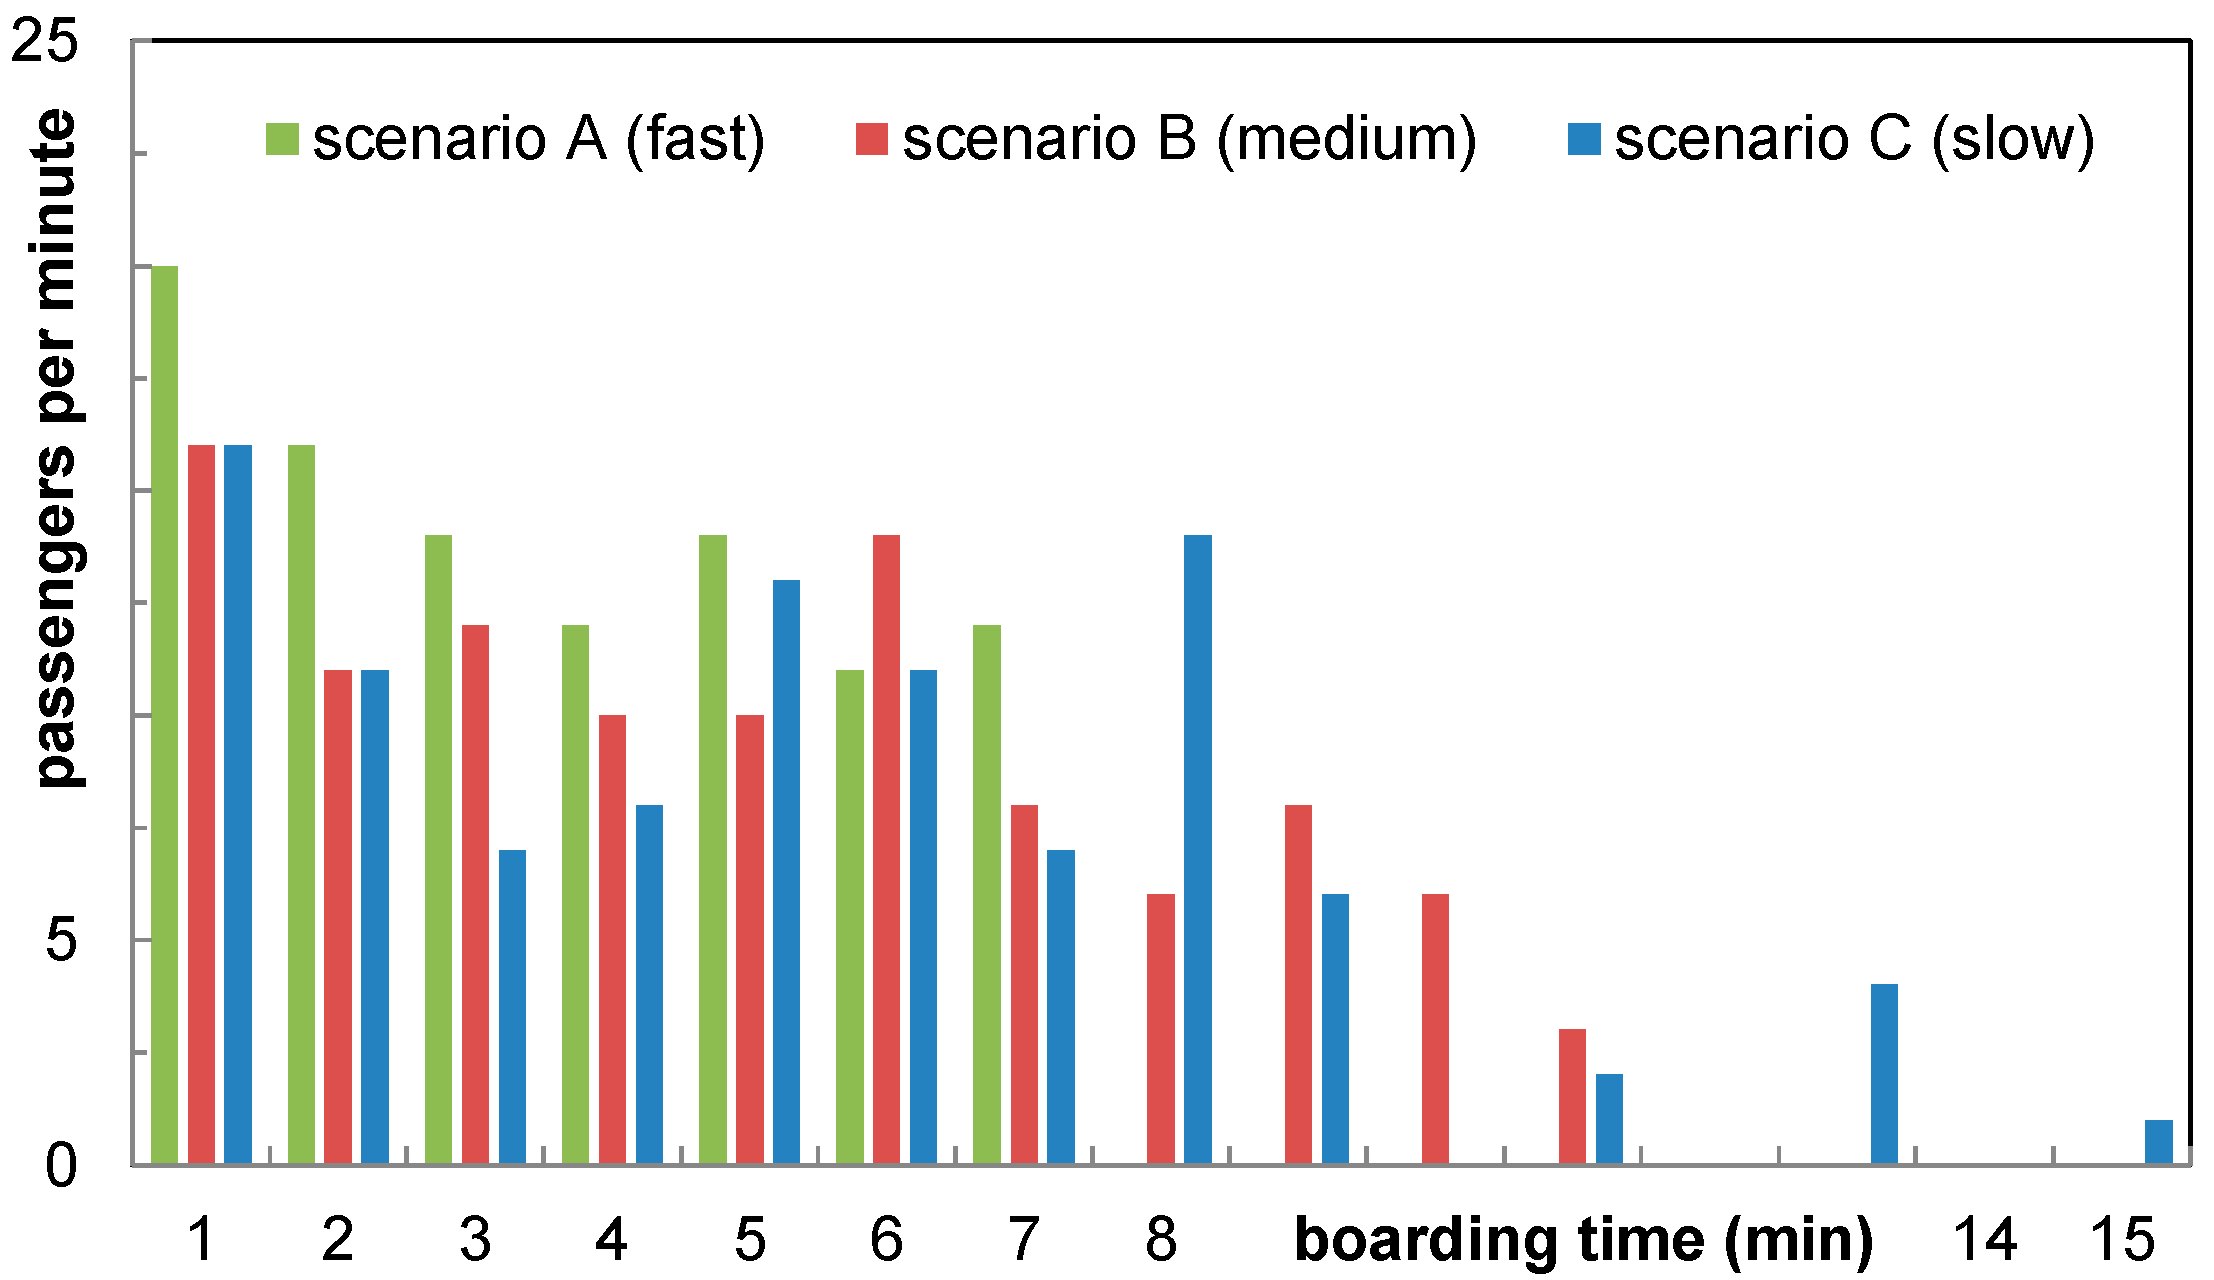
To emphasize the different boarding progresses, three boarding real boarding events are selected from the recorded data. These events reflect a single specific flight with nearly the same number of passengers: 99, 104 and 100 for Scenarios A, B, and C, with fast, medium and slow arrival behavior, respectively (see Figure 6).
Due to the different passengers’ arrival times, boarding is completed after 7 min in Scenario A, after 11 min in Scenario B and after 15 min in Scenario C. Obviously, late passengers will significantly extend the boarding process (Scenario C). However, a (constant) lower arrival rate of passengers at the aircraft also affects the boarding progress adversely. The arrival rate of passengers at the aircraft is mainly triggered by the presence of passengers at the boarding gate and the service rate at boarding card control. Consequently, an airline should balance the effort/benefit ratio between introducing new boarding procedures and faster dispatch/higher availability of passengers at the boarding gate.
3.3. Arrival Rates and Deboarding Rates
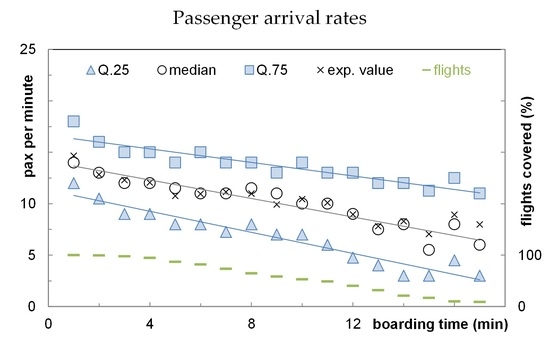
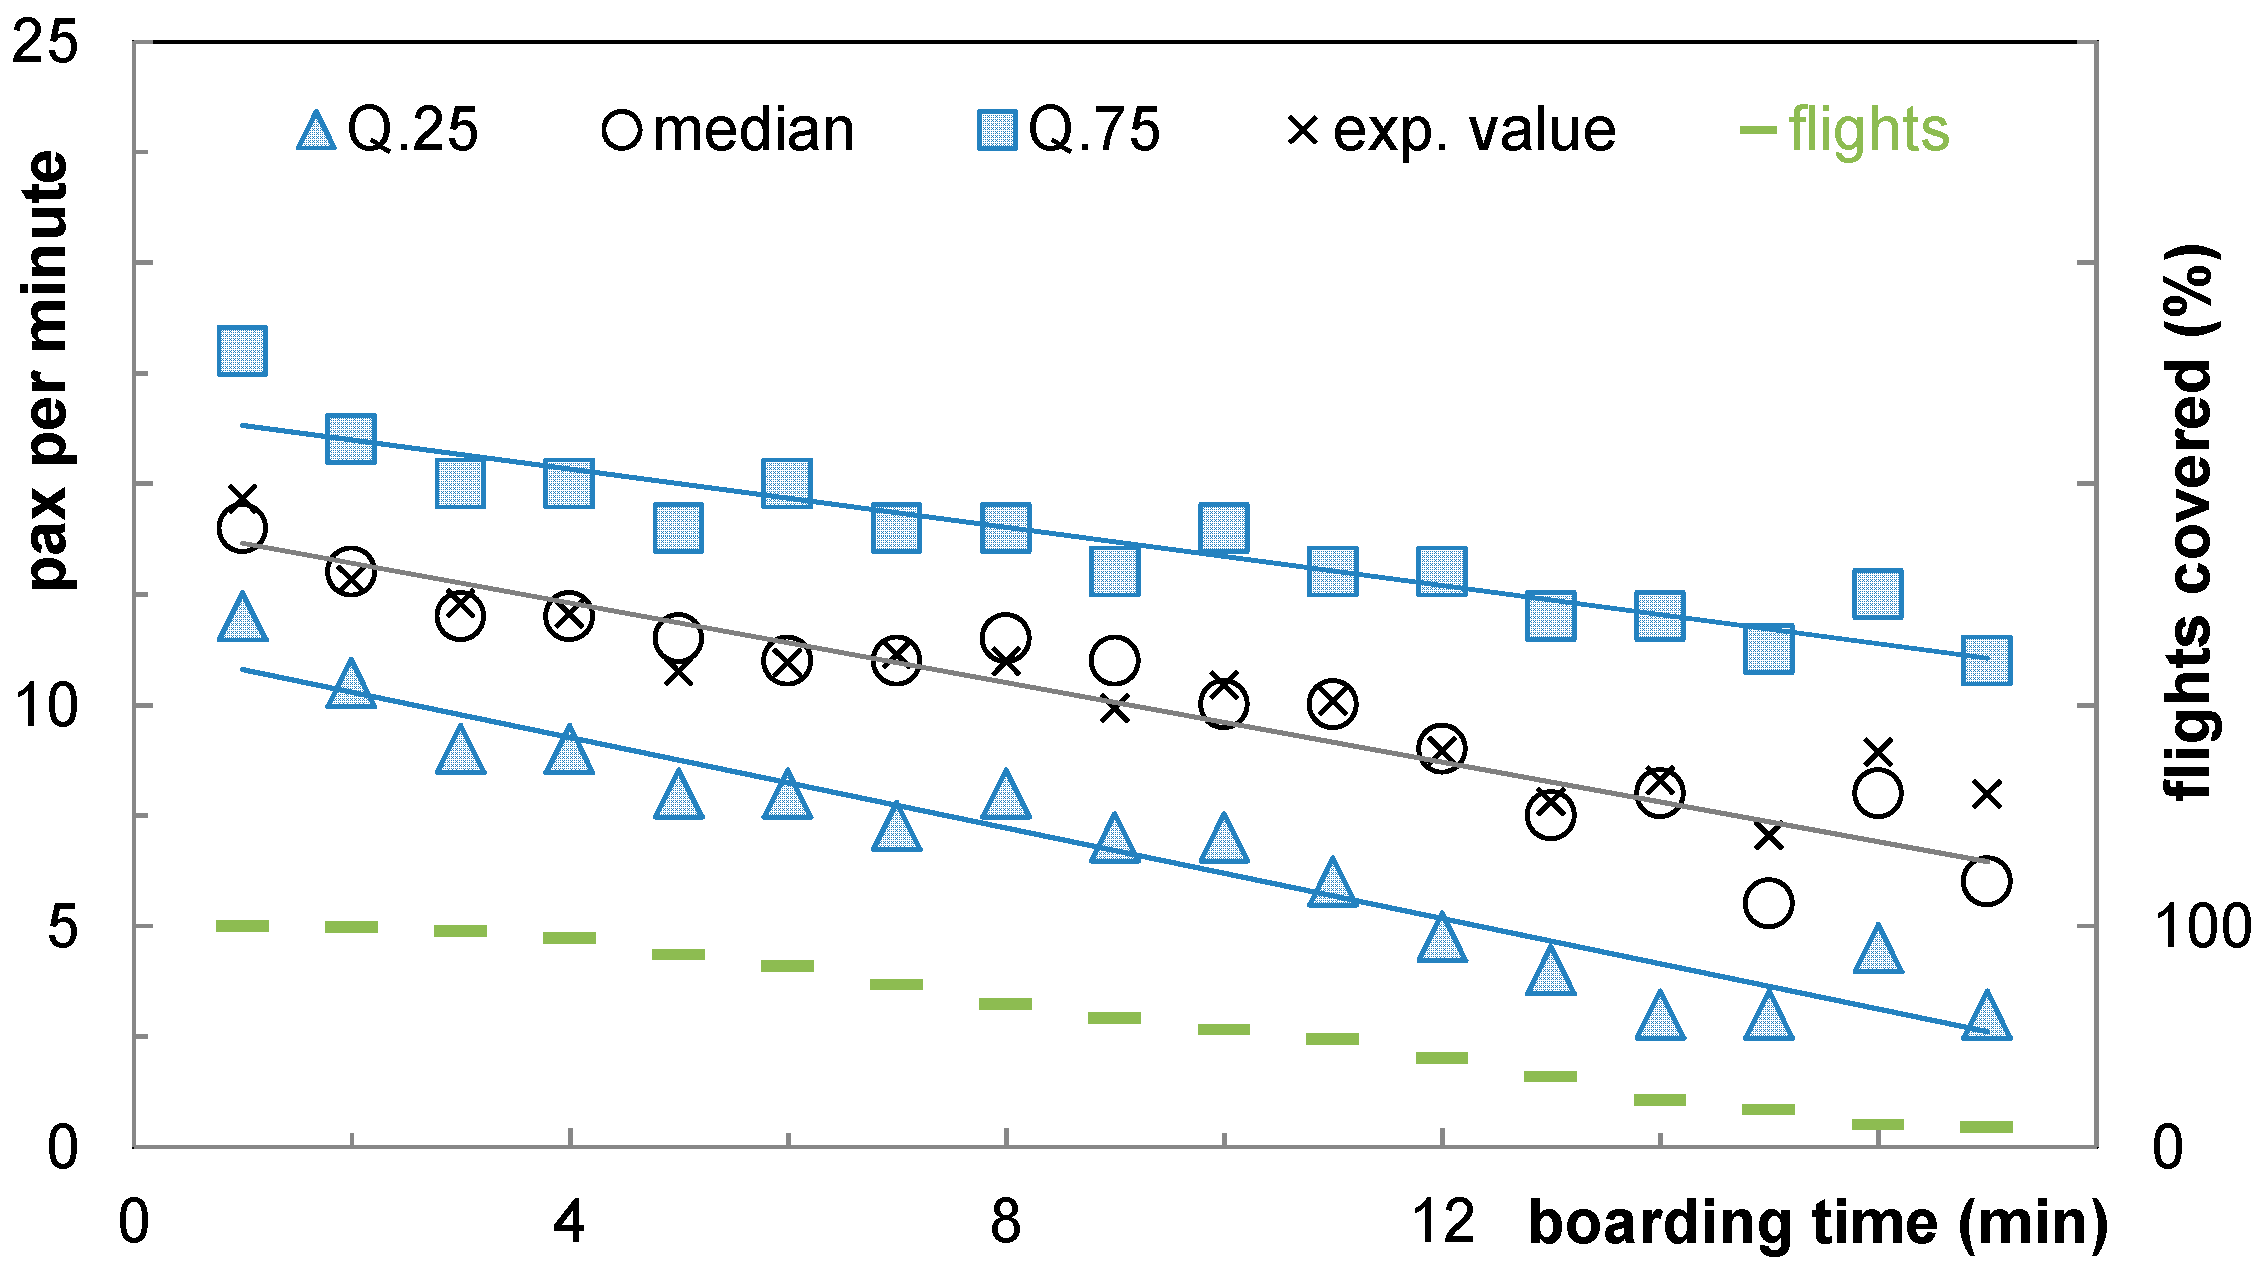
The arrival rate of passengers at the aircraft is a significant input factor for the boarding model to reliably simulate the final boarding time. In the recorded data, 188 flights are available for an analysis rate at boarding and 186 flights for the departure rate at deboarding. Figure 7 demonstrates that the arrival rate (arrival at aircraft door or at corresponding queue) is not constant over the time: the arrival rate decreases during the boarding progress. This behavior is shown by using the 25%, 50% and 75% quantiles (Q.25, median and Q.75), the expected value (μ) and the number of covered flights (right scale). After 10 min, approximately 50% of flights already completed their boarding and provide no values for arrival rates after this timestamp. In the first minute, passengers arrive at the aircraft door at a rate of 14 pax/min (median value) with Q.25 = 12 pax/min and Q.75 = 18 pax/min. These rates decrease to 3 pax/min, 6 pax/min and 11 pax/min in the 17th min for Q.25, median and Q.75 respectively. At this time, the boarding is finished in 91% of all recorded flights. The remaining data possess only a limited significance (only a few samples per period) and are not included in Figure 7.
The straight lines of the Q.25, median, and Q.75 values in Figure 7 emphasize a declining trend and the increasing spread of the arrival rates. If the median is used as a reference with a linear behavior, the arrival rate decreases by 0.45 pax/min per minute starting at 14.1 pax/min.
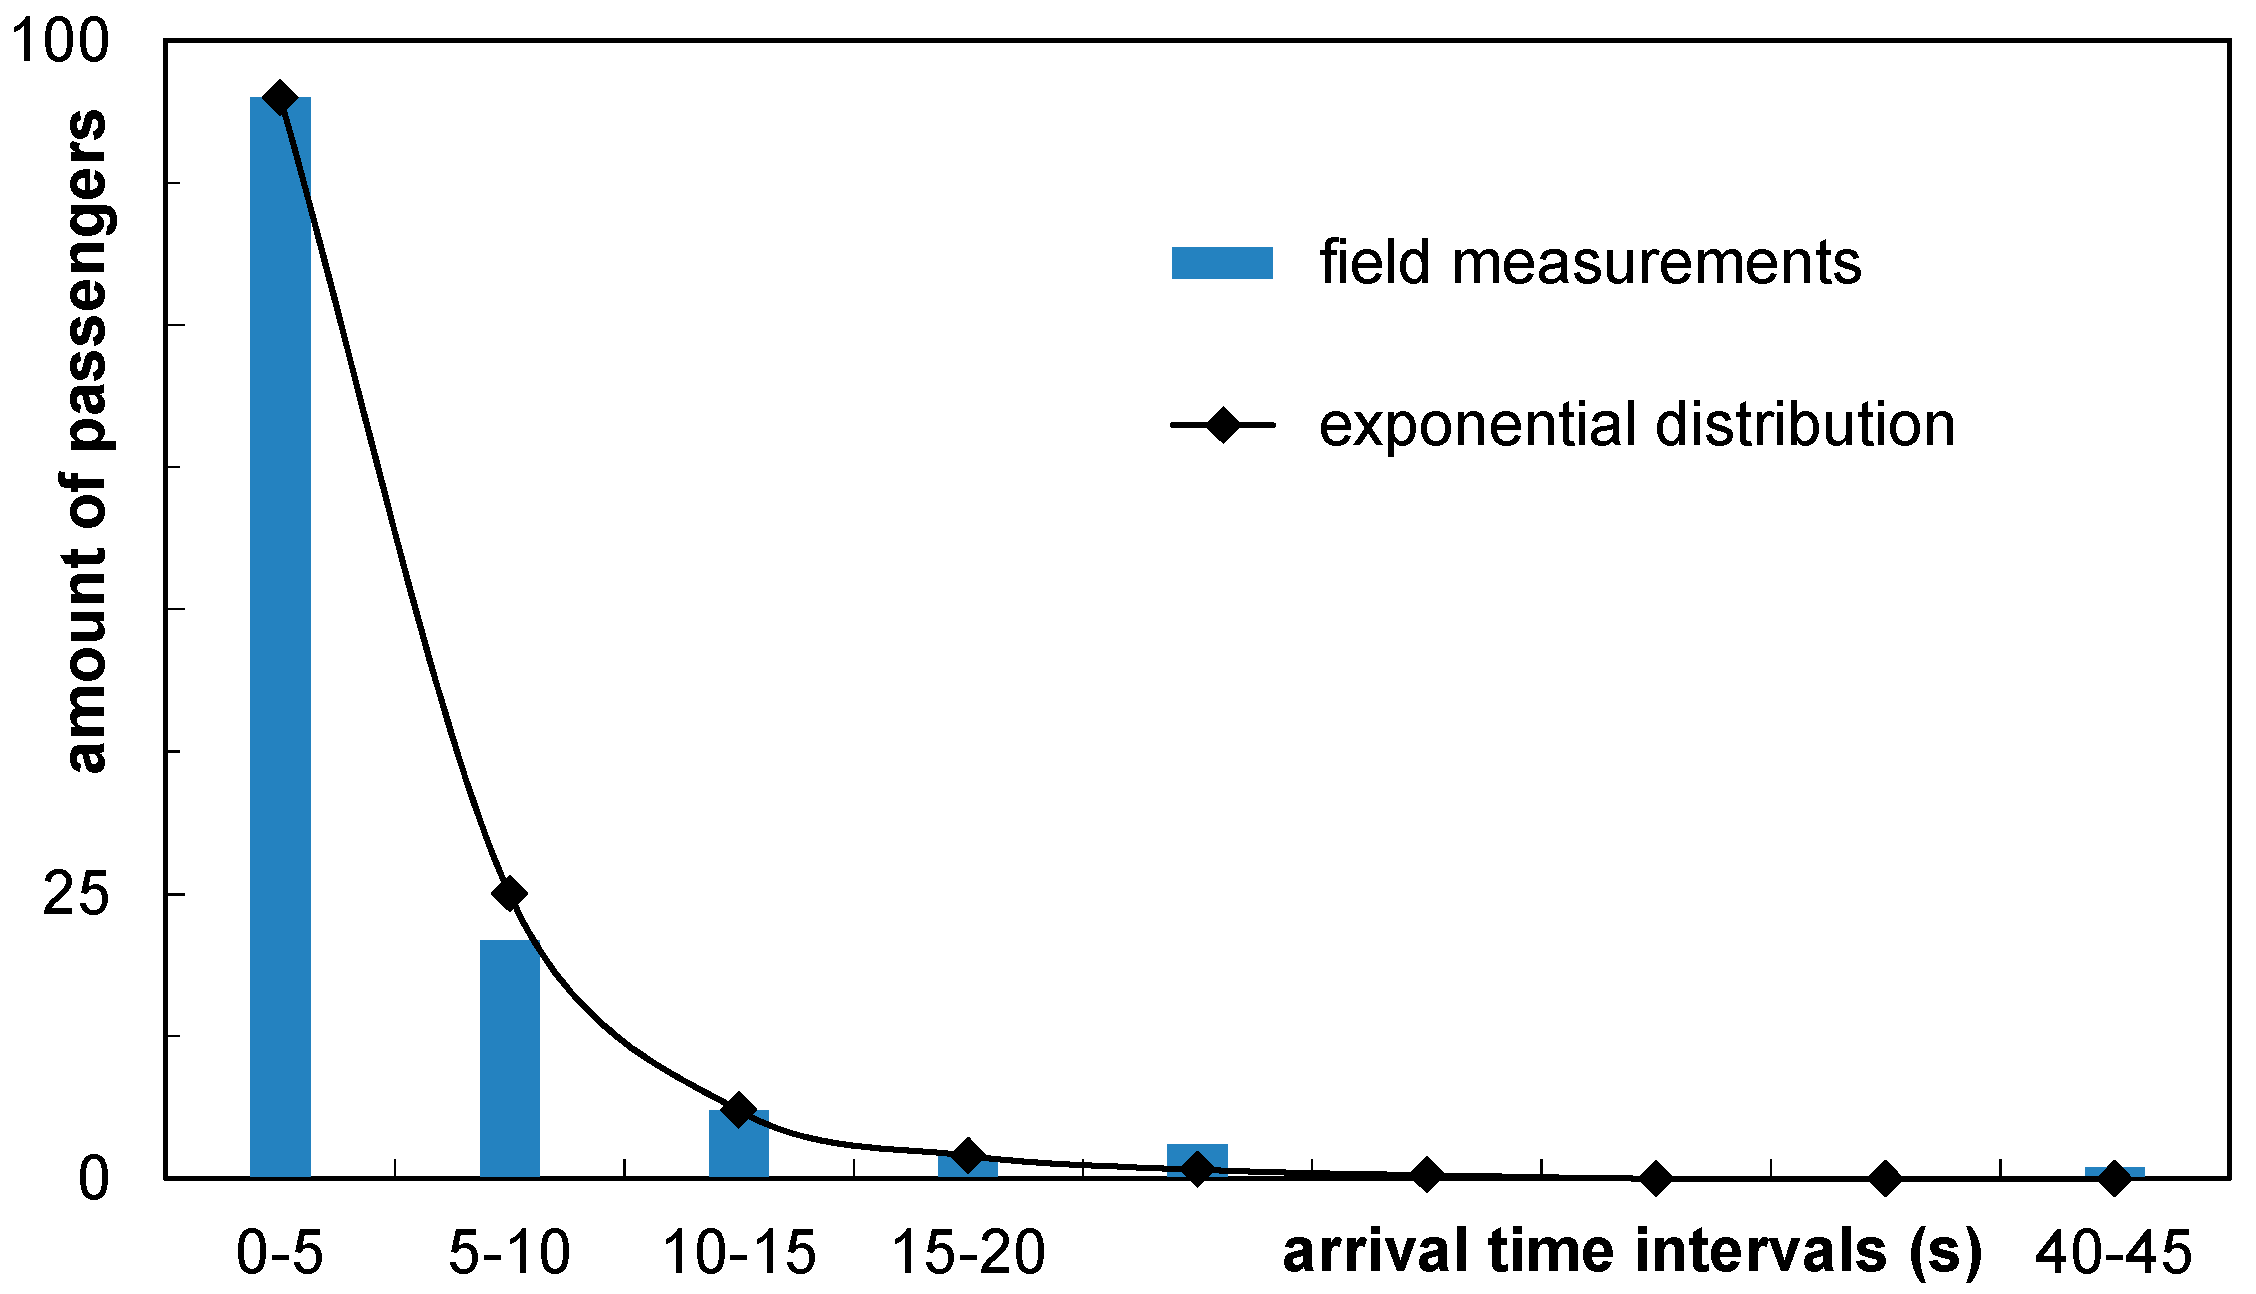
An in-depth analysis of inter-arrival times (the times between successive arrivals) indicates an exponential distribution of these time values. The cumulative distribution function of the exponential distribution is given by Equation (1) where λ is the rate parameter defined by λ = 1/μinter-arrival time.
The results of the evaluation are shown in Figure 8. An appropriate fitting of the measured number of passengers is achieved with an exponential distribution assuming μinter-arrival time = 3.7 s, which results in a chi-squared test value of 0.64 (acceptance level of 14.07, using significance level of 5% and 7 degrees of freedom).
The exponential distributed inter-arrival times also indicate a Poisson process. The corresponding cumulative distribution function of the Poisson distribution is given by Equation (2) where, in this case, the rate parameter λ is defined as the reciprocal value of the average amount of passengers expected in a given time interval.
Using this strong fitting result for the inter-arrival times as a basis, the corresponding Poisson distribution is shown in Figure 9. The field measurements are categorized by a 5 s interval. According to the average inter-arrival time of 3.7 s, it is expected that 1.35 passengers will arrive on average in this 5 s interval. Thus, the λ value for the Poisson distribution will be 0.74. As Figure 9 already qualitatively emphasizes, the associated Poisson distribution with a chi-squared test value of 67.2 is not an appropriate candidate for describing the measured field data (acceptance level of 11.07 using significance level of 5% and 5 degrees of freedom). Whereas the probability of 0 arrivals and 2 per interval corresponds to the Poisson distribution, the arrival of 1 pax per interval shows a much higher probability and lower probabilities for more than 2 arrivals with regard to the recorded dataset. Figure 9 supports the observation of group arrivals in the airport environment (cf. [1,10]). Finally, the arrival process will be modeled by exponential distributed inter-arrival times.
The analysis of deboarding with regard to outflow rates (measured at aircraft door) focuses only on the aggregated flow rate. In contrast to the arrival rates, the outflow rates (deboarding) are significantly higher (first minute: 18 pax/min, 23 pax/min and 29 pax/min for Q.25, median and Q.75 values, respectively, see Figure 10). The outflow rate increases during the first three minutes. After 8 min, for 91% of the recorded flights deboarding is finished (this level was reached after 17 min for boarding, so deboarding is 53% faster than boarding). In the context of deboarding, the seat interference disappears and only the interference of passengers in the aisle is important for an efficient process [42,46]. A study of deplaning strategies [47] used stochastic optimization methods and assumed a deboarding time of between 9 and 4.8 min, depending on the structure of the deboarding procedure.
3.4. Hand Luggage Storage
The hand luggage storage process is parameterized by the time to store one piece and the individual amount of luggage pieces. The prior approach to modelling the time needed to store the hand luggage was based on both a triangular distribution (Equation (3)) with time values for the minimum, maximum, and mode time value for storing one piece of hand luggage as well as the distribution of the hand luggage per passenger [7,16,20].
During the field trials, 323 values are manually recorded. The recording starts at the time the passenger reaches his seat row and ends when the passenger enters the seat row. To mathematically fit the measurements, the Weibull distribution is used (Equation (4)) with the scale parameter α and the shape parameter β. Since the minimum time xmin to store the hand luggage is zero, no offset is required to derive the distribution parameter (xmin = 0).
With the parameter α = 1.7 and β = 16.0 s, the Weibull distribution demonstrates an appropriate level of correlation with a chi-squared test value of 3.65 (acceptance level of 12.6. using significance level of 5% and six degrees of freedom). Although the previously used triangular distribution qualitatively describes the shape of the recorded data, it clearly over-estimates the time for the hand luggage storage (see Figure 11). The expected average time for storing the hand luggage is 13.9 s for the recorded field data and 17.5 s for the initial triangular distribution. In the first section (0–5 s), the triangular distribution indicates no values, whereas the field data indicate a probability of 12%. The sections 10–15 s, 20–25 s and 25–30 s exhibit a deviation of 5% on average. As a result of this analysis, further simulations will use the derived Weibull distribution with the parameter set α = 1.7 and β = 16.0 s. An empirical analysis by [40] also provides time values for hand luggage and outerwear storage into the overhead compartments, which qualitatively confirms measured times.
3.5. Seat Interactions
The chronological order of occupying the seat rows affects the boarding time, due to the required coordination of position changes (seat shuffle, cf. [20,23]). In the worst case, the aisle and the middle seats are already occupied and the arriving passenger wants to sit in the window seat. For this constellation, nine movements are necessary for stepping out of the row, (re-)entering the row and unblocking the aisle. The other seat occupation patterns demand four (aisle seat blocked) and five movements (middle seat is blocked and window seat is the target). If the passenger can enter his seat without any interference, the time for entering the seat row is defined with one movement. The characteristics of the accompanied time required to finally unblock the aisle are shown in Figure 12, where the blue color represents the field measurement and the red color represents the results of the modelled distribution of time needed. Furthermore, the colored boxes represent 50% of all values (measured or calculated) bounded by the accompanied upper and lower quantiles (Q.25 and Q.75). Around these colored areas, additional areas are defined by bars to cover 80% of all values (with Q.10 and Q.90).
During the field trials, only a minor quantity of specific movements could be recorded (between 10 and 15 measurements per category). This is mainly caused by the observation position at the front/back door of the aircraft, the unpredictable seating progress of a specific row and the ability to clearly define start and end of the seating process. Consequently, the observers could only concentrate on a limited set of seat rows. However, the recorded measurements qualitatively confirm the proposed model as regards calculating the time required to unblock the aisle. As a side note, the cabin crews approve the order of magnitude of the gathered data as well, but point out that specific events during boarding regularly disturb the progress. These events are not covered in the model. Considering both the minor quantity of measurements and the same order of magnitude of the results, the initial distribution of the seat shuffle would appear to be an acceptable approach and will be used in the following simulations.
3.6. Simulation-Validation of Prior Results
Since the field measurements of the specific sub-processes of boarding are analyzed in detail and used to calibrate the simulation environment, the validity of the prior simulation results will be checked (see [7]). For this purpose, the additional input parameters are seat load factor (85%) and passenger conformance rate according to the assigned seat (85%). The random strategy is used as baseline with both the non-calibrated and calibrated input values to evaluate the average boarding time and the accompanied standard deviation. Table 2 demonstrates the differences in the boarding times between non-calibrated and calibrated simulation runs are not significant (<1.5%).
As all strategies show a minor improvement, the relative order of the strategies is still valid. However, the calibrated random strategy is 8.4% faster accompanied with a 5.9% lower standard deviation against the non-calibrated random strategy. As was expected, the standard deviations of the boarding strategies increase, caused by a higher bandwidth of the hand luggage distribution and the non-constant arrival distribution observed in the field.
4. Field Trials, Validation of Simulation Results
The previous section was aimed at the calibration of the stochastic passenger boarding model. In a next step, the calibrated model is used to simulate boarding scenarios, which were set up in operational field trials of an airline, to validate the passenger boarding model. The airline provides all information about the test setup and the measured boarding times. The first airline trial evaluates the performance of two advanced boarding scenarios as a proof of concept. The second field trial extends the initial concept and integrates the boarding scenarios into the airline operations, which cover different seat loads, the use of one/two doors, gate/apron position, destination, amount of pre-boarding passengers, and transfer mode (bus, gate, walk).
4.1. Airline Trials 1
To ensure convenient and fast boarding progress airline operates employed new strategies, which were tested in field. These strategies were also simulated with the calibrated modeled and compared against data collected from the field (provided by the airline). Beside the common approach of group boarding (back-to-front with four blocks, validation Scenario 1 in Figure 13), a new outside-in strategy was tested (validation Scenario 2 in Figure 13) to determine potential operational benefits. In the boarding validation Scenario 2, the aircraft cabin is divided into a rear/front section (rows) as well as a window and middle/aisle section. The rear window seats are boarded first, followed by the front window seats, the rear middle/aisle seats, and the front middle/aisle seats.
These field measurements were conducted in 2014, aiming at business routes with the following restrictions: families were not separated, the aircraft stands at gate position, and an A320/B738 aircraft is used. The average seat load factor (SLF) of the 13 recorded flights was 76%. Since the test is based on non-operational strategies, the boarding progress and group assignment were directly supported by the airline ground staff. For reasons of comparability to the past and current airline boarding operations, all measured boarding times were linearly extrapolated (based an average of 76%) to a reference seat load factor of 90%. This approach contradicts the fact that the impact of seat load factor for the block boarding strategies (including back-to-front) shows a nonlinear behavior [7,20,33]. To allow a reliable comparison of the field trials with the simulation results, two approaches are used. The first simulation trial starts with the reference seat load factor of 90% and the second trial starts with the average 76% SLF (measured in the field) with an equal distributed variation of ±5% to cover the expected deviation from the average load. All simulations use calibrated values for arrival times, seat interaction, and hand luggage storage (see Section 3). The results of the simulation runs are listed in Table 3, where expected values of the boarding time as well the quantiles of the boarding time distribution are shown (10%, 25%, 75%, and 90%). In the first scenario with 90% SLF, the baseline boarding strategy (random) exhibits only minor differences (−1%) and the validation Scenario S2 strategy also indicates a reliable simulation approach (−3% difference from the field trials). A different picture is given for the validation Scenario S1 strategy, where the simulated boarding times are 11% higher than the measured times at the field trials. The observed differences could also be caused by the linear up-scaling for the reference boarding scenario (seat load factor of 90%). This linear scaling results in an underestimation of the boarding time. Since the airline could not provide the full details of the tests, the measured boarding times were linearly scaled back to reflect the reported average SLF of 76%. To cover the operational bandwidth of seat load, the simulation considers an additional variation of SLF within a range of ±5% (equally distributed). With these adjustments, the absolute differences of the random and validation Scenario S2 strategies are slightly increased, but now the validation Scenario S1 strategy shows only a difference of 3.9%. As a side note, simulation results show additional time savings of 3%, if in validation Scenario S2 the defined four boarding blocks are aggregated to three blocks (Scenario S2*, see Figure 13, combining the window seats in the front and middle/aisle seats in the back to one single block).
Finally, the results of simulation runs with the calibrated values cover the observed boarding times at the field with an accuracy of ±5%. The observed boarding times are within a ±25% range (between Q.25 and Q.75), which additionally emphasizes the validity of the calibrated stochastic boarding model.
4.2. Airline Trials 2
During the second airline trial, 64 additional boarding events were recorded, aiming at a deeper understanding on how passengers and their individual behavior influence the boarding process, beyond the already considered input parameters. These particular validation trials mainly focused on two boarding scenarios: Scenario S1 (four blocks back-to-front) and outside-in (cf. Figure 2). Furthermore, two operational configurations (one door and two doors) were chosen and single aisle aircraft with 180–210 seats (A320/B738) were used. Figure 14 demonstrates that the ability of the rear door for boarding does not necessarily result in an efficient operational use (not even in a field trial environment). Thus, a boarding event will be defined as a one-door scenario (37 flights), if at least 75% of the passengers are using the front door. All operational relevant information for a specific flight was recorded, such as amount of pre-boarding passengers, aircraft position at apron and additional flight categorization (tourist, EU, Germany). It is suggested that all these parameters will substantially influence the boarding progress. As an example, an apron position near the gate enables walk boarding (passengers walk across the apron directly to the aircraft).
If all recorded field data from airline trial 2 are used as an input for a flight classification, only a few flights will be in one category. In Table 4, the transfer mode to aircraft and destination of flights are used for categorization. The different positions of aircraft at the apron determine the mode of passenger transfer: bus shuttle (apron position), terminal gangway (gate position) or walk boarding (near gate or apron position).
It is necessary to reduce the amount of input parameters to analyze the field data in the context of boarding model validation. For the analysis, flights are separated by seat load factor in three groups: SLF 60–80% (27 flights), SLF 80–90% (20 flights) and with SLF 90–100% (17 flights). These groups are mainly chosen to reflect the initial operational assumption of the stochastic boarding model, which uses a reference value for seat load factor of 85% with ±5% deviation. Figure 15 exhibits the distribution of pre-boarded passengers. These passengers are allowed to board first because of their membership in loyalty programs (e.g., frequent traveler status), reduced mobility or specific group constellations (e.g., families with small children). In the stochastic boarding model, pre-boarding is also considered indirectly by passenger’s conformance to the current strategy, which is set to 85% (cf. Section 2).
While the first airline trials where strictly focused on specific flights with nearly identical operational conditions (input factors are covered by the stochastic boarding model), the second trial is characterized by a high range of different (new) impact factors (not covered by the model). Consequently, the simulation results exhibit higher deviations from the operational measurements for both average boarding time and corresponding standard deviation.
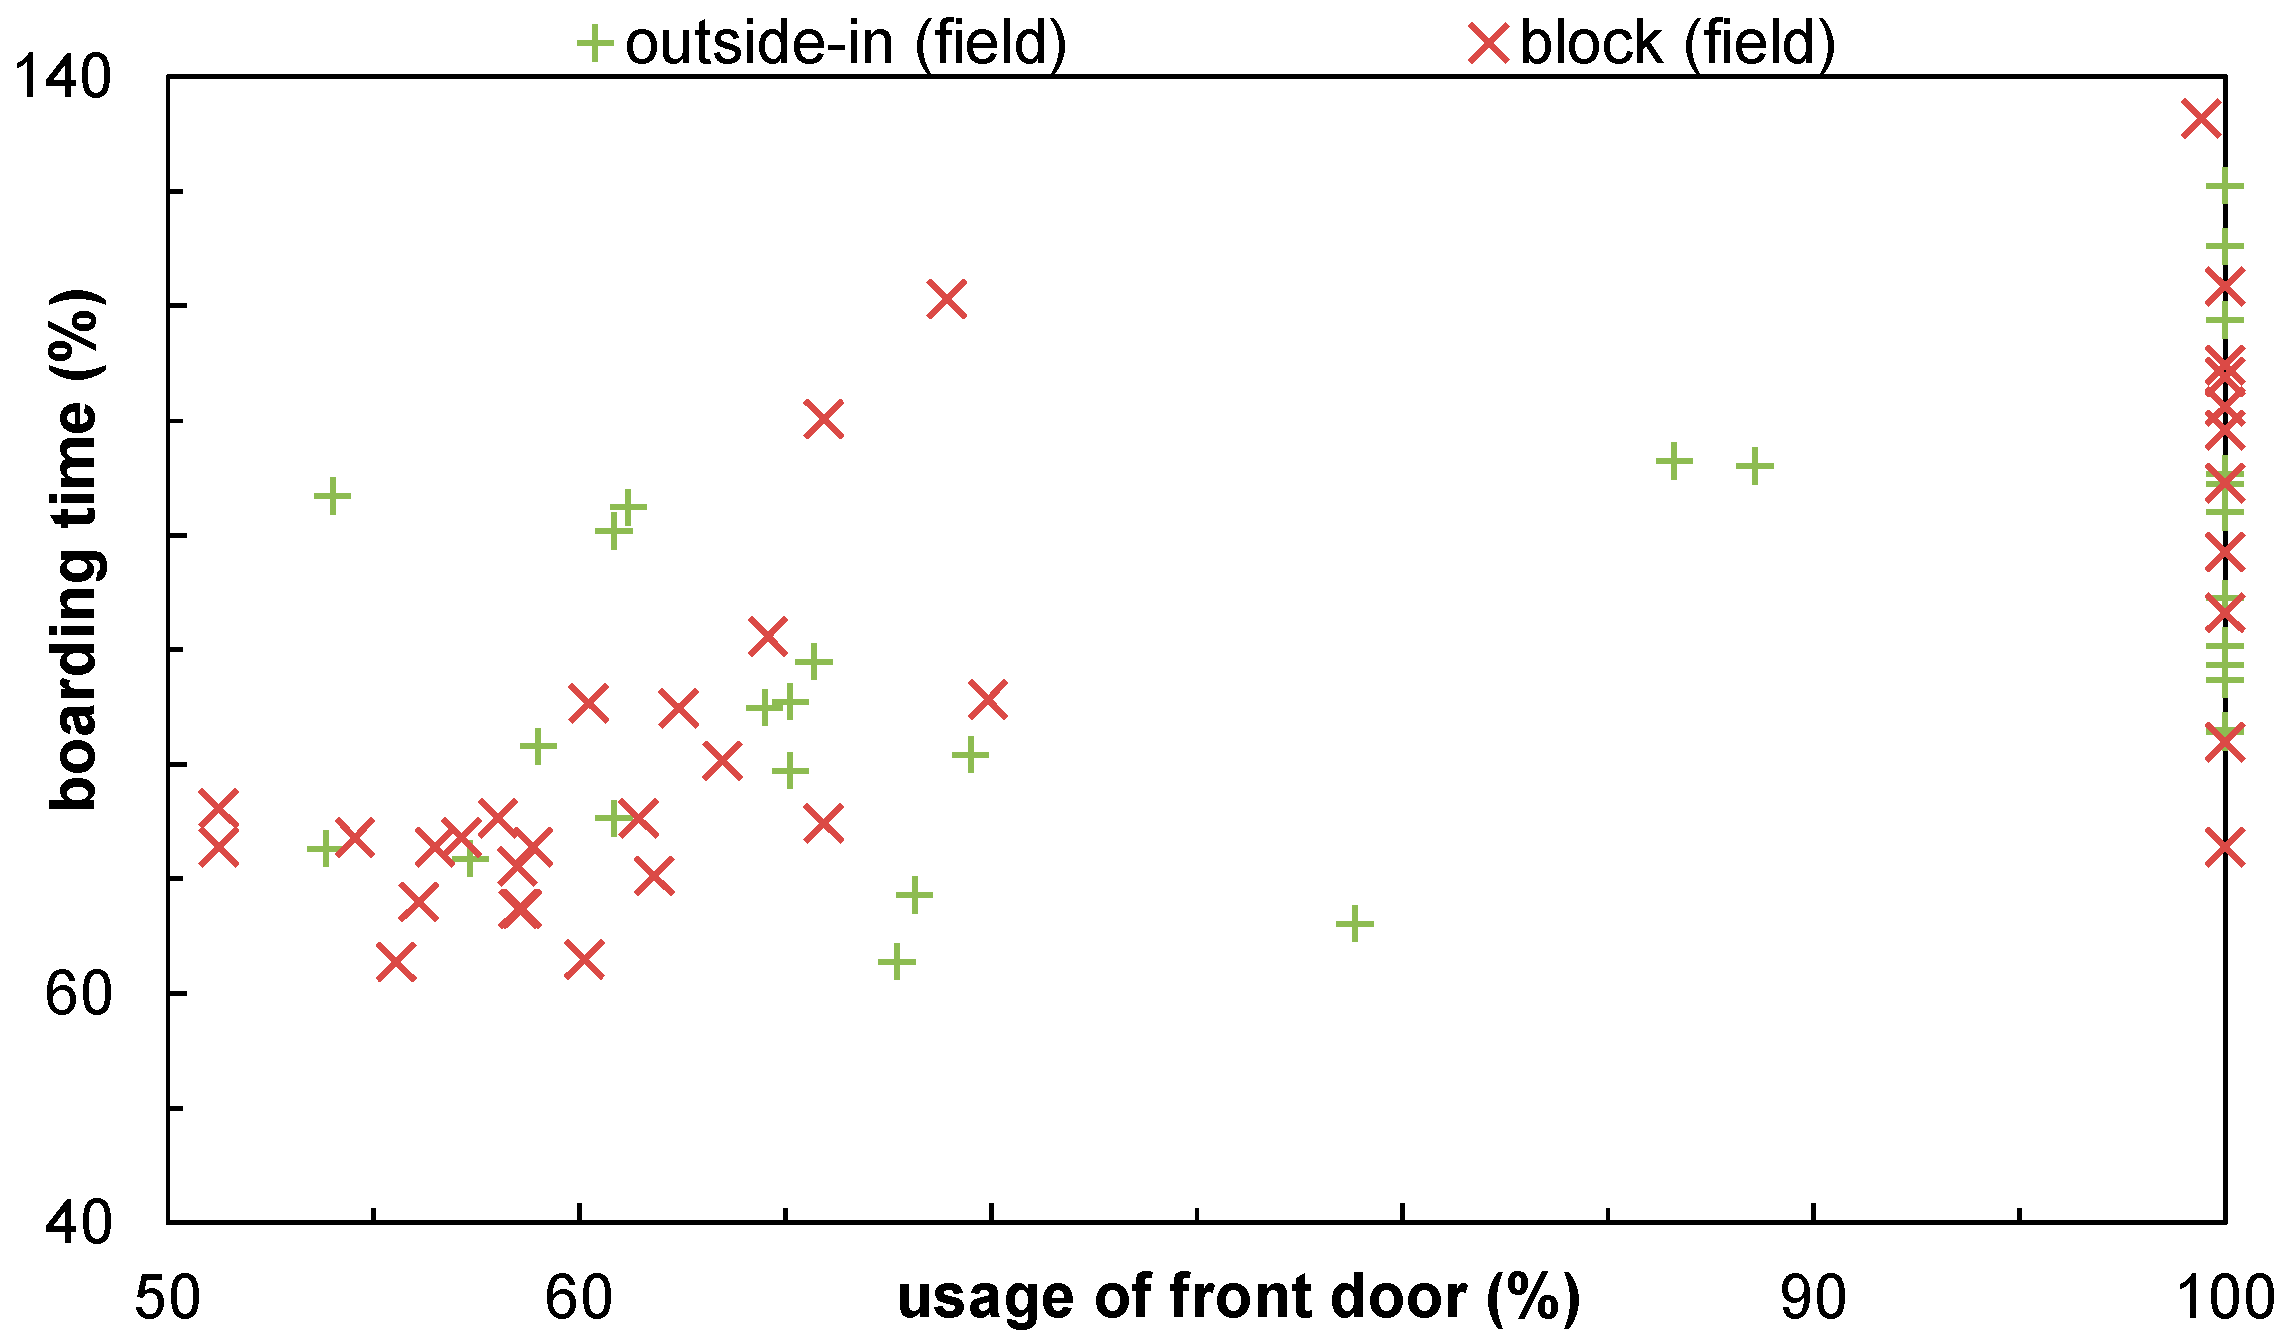
In Figure 16, the simulation results are marked with circles with an error bar indicating the 10% and 90% quantile. The red crosses mark the block strategy (Scenario S1 with four blocks, back-to-front) and the green plus signs mark the outside-in strategy separated by one-door/two-door configuration. In particular, the outside-in strategy does not show the expected benefit. Since the simulation results in shorter boarding times, it is expected that the amount of pre-boarding passengers and the operational procedures to handle these passengers will mainly cause this effect.
Several (measured) input factors influence aircraft boarding, such as aircraft position or flight destination. Unfortunately, the recorded data are insufficient for a comparison between simulation results and the field data from airline trial 2 with regards to a specific input factor. To cover significant operational constraints, these factors have to be considered in future boarding models.
5. Conclusions and Outlook
This paper provides a comprehensive set of operational data as a reliable basis for the calibration of a stochastic boarding model, including classification of boarding times, arrival and departure rates of passengers at the aircraft door, individual durations to store hand luggage, and timestamps for passenger interactions during seating. The data were recorded at several field measurements during actual aircraft turnarounds of Airbus A320 (short-medium haul, single aisle) and comparable Boeing B737/B738. These aircraft are mainly used as a reference layout for boarding research. Each measurement campaign aimed at different aspects of individual boarding behavior of passengers and realized in close cooperation with the corresponding airlines, ground handling agents, and airport operators. While passenger arrival/departure rates could be measured from outside the cabin by recording the individual time stamps of passengers passing the aircraft door, the hand luggage storage time and passenger interactions during the seating (seat shuffle) were recorded from positions inside the narrow aircraft cabin. Particularly, the specific seat shuffles are required special attention and a close observation position, which results only in a limited number of measurements.
The analyzed boarding times, defined as time between first passengers enters the aircraft and last passenger is seated, demonstrate three different characteristics of boarding progress: fast, medium, and slow boarding. This result emphasizes the demand for a more comprehensive investigation into the passenger boarding process to enable a reliable boarding time prediction. Since arrival at the aircraft, storage of hand luggage, and interactions during the seating process are identified as major input factors for the individual passenger behavior, specific field trials provide a fundamental database to calibrate these factors. As a result, the measurements show a non-constant arrival rate, a Weibull distribution for the time needed to store the hand luggage, and support the initial assumptions about the interactions during the seat shuffle (taking a seat, while other seats already occupied). The comparison between prior simulations (non-calibrated input) and current simulations (calibrated input) shows only minor relative differences (smaller 2%) with regard to the corresponding boarding time (random boarding non-calibrated/calibrated as a reference).
The calibrated boarding model was then used to simulate the different boarding scenarios, which were also operationally implemented during a field trial campaign (controlled environment). The comparison of simulation results and measured boarding times showed deviations smaller than ±5%. Additionally, measurements from a less controlled operational environment demonstrate that the boarding is also driven by external factors, which are currently not covered by the stochastic boarding model. Thus, measurements show a much higher deviation than the simulation results. It is expected that future cooperation between researchers and operators will enable new insights into passenger boarding processes. As a necessary first step, this paper provides a comprehensive set of data to calibrate the input parameter of boarding models.
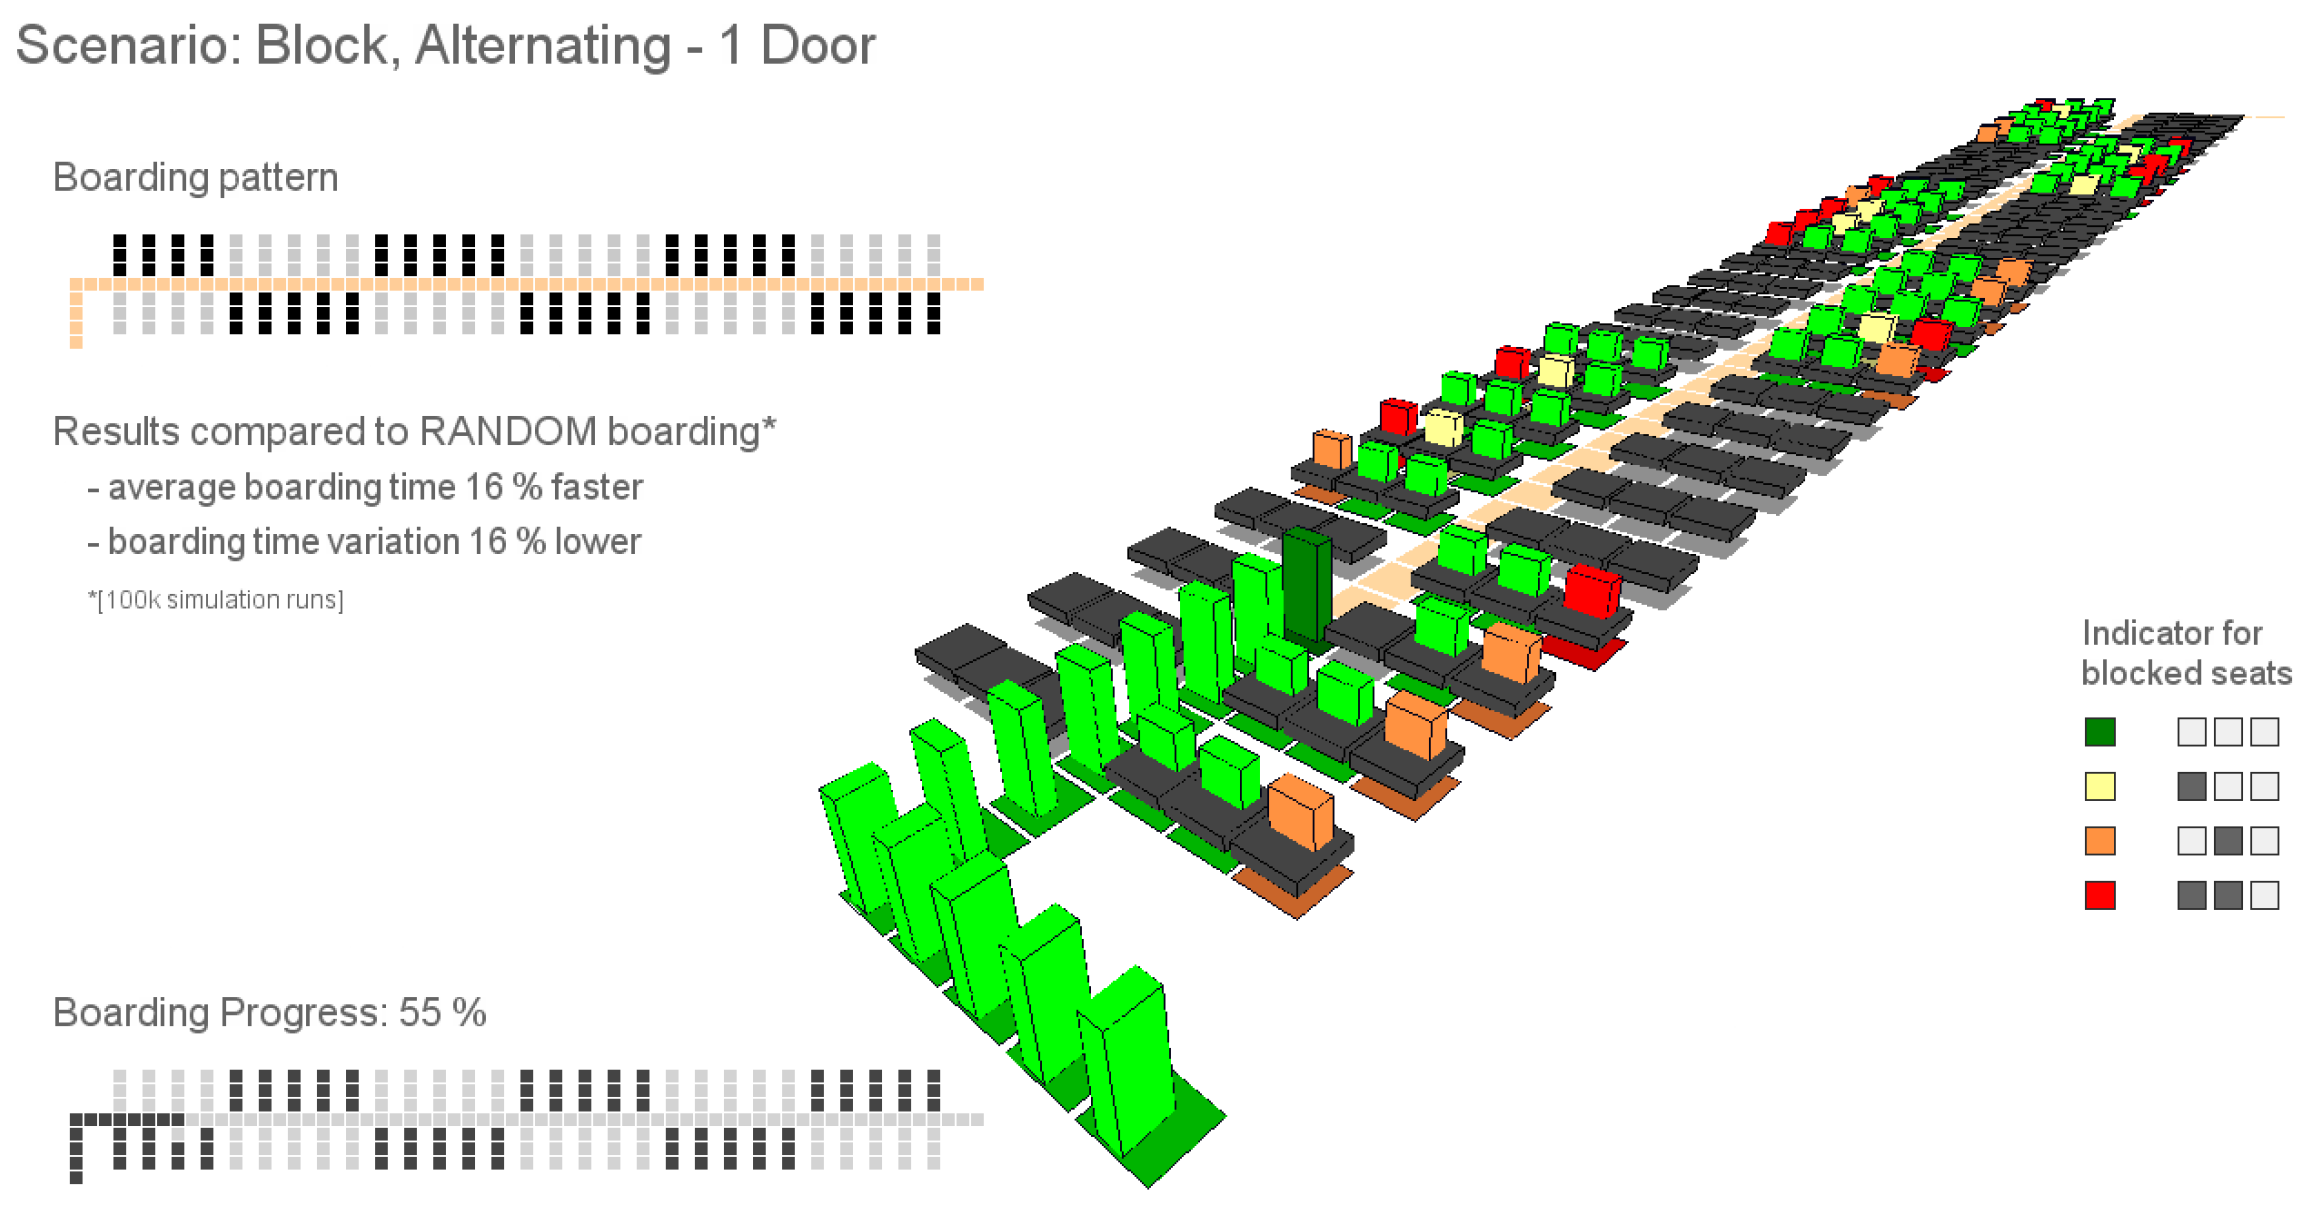
The simulation environment and the aircraft boarding model are being continuously developed to enable both scientific and operational assessments of aircraft boarding scenarios. In the context of specific research projects, the simulation environment is extended with evolutionary algorithms to search for optimal strategies under certain airline requirements and operational conditions [48,49]. Starting with the implemented basic boarding strategies, new boarding strategies will emerge to enable new infrastructural approaches (e.g., combination of block + alternation patterns for the Side-Slip Seat implementation, see Figure 17).
After introducing a stochastic approach to consider the individual passenger behavior during aircraft boarding [7,20], the field measurements to calibrate the stochastic model, and investigations into procedural/infrastructural changes [48,49], two new topics in the context of aircraft boarding will be focused upon: the real-time prediction of the boarding time [51,52] using sensor information from a connected aircraft cabin [53,54] and the seatNow concept [55]. The seatNow concept addresses operational improvements if the current standard call-in boarding procedure is replaced by a dynamic seat allocation process. The seatNow concept has already been successfully tested with Eurowings at Cologne/Bonn airport and will be a promising approach towards further improvement in both passenger convenience and efficient airport/airline operations.
Conflicts of Interest
The author declares no conflicts of interest.
References
- Schultz, M.; Fricke, H. Managing Passenger Handling at Airport Terminal. In Proceedings of the 9th USA/Europe Air Traffic Management Research and Development Seminar, Berlin, Germany, 14–17 June 2011. [Google Scholar]
- ICAO. Global Air Traffic Management Operational Concept, Doc. 9854; ICAO: Montreal, QC, Canada, 2005. [Google Scholar]
- ICAO. Flight & Flow Information for a Collaborative Environment, Doc. 9965; ICAO: Montreal, QC, Canada, 2012. [Google Scholar]
- SESAR. Concept of Operations Step 2 (Ed. 01.01.00). Single European Sky ATM Research Programme; Eurocontrol: Brussels, Belgium, 2014. [Google Scholar]
- Eurocontrol. Airport CDM Implementation Manual, 5th ed.; Eurocontrol: Brussels, Belgium, 2017. [Google Scholar]
- IATA. Aircraft Handling Manual, 37th ed.; International Air Transport Association: Montreal, QC, Canada, 2016. [Google Scholar]
- Schultz, M.; Kunze, T.; Fricke, H. Boarding on the Critical Path of the Turnaround. In Proceedings of the 10th USA/Europe Air Traffic Management Research and Development Seminar, Chicago, IL, USA, 10–13 June 2013. [Google Scholar]
- Holloway, C.; Thoreau, R.; Petit, E.; Tyler, N. Time and Force Required for Attendants Boarding Wheelchair Users onto Aircraft. Int. J. Ind. Ergon. 2015, 48, 167–173. [Google Scholar] [CrossRef]
- Davies, A.; Christie, N. An Exploratory Study of the Experiences of Wheelchair Users as Aircraft Passengers—Implications for Policy and Practice. IATSS Res. 2017, 41, 89–93. [Google Scholar] [CrossRef]
- Schultz, M. Entwicklung Eines Individuenbasierten Modells zur Abbildung des Bewegungsverhaltens von Passagieren im Flughafenterminal. Ph.D. Thesis, Technische Universität Dresden, Dresden, Germany, August 2010. Available online: http://nbn-resolving.de/urn:nbn:de:bsz:14-qucosa-85592 (accessed on 26 September 2017).
- Schmidt, M. A Review of Aircraft Turnaround Operations and Simulations. Prog. Aerosp. Sci. 2017, 92, 25–38. [Google Scholar] [CrossRef]
- Jaehn, F.; Neumann, S. Airplane boarding. Eur. J. Oper. Res. 2015, 244, 339–359. [Google Scholar] [CrossRef]
- Nyquist, D.C.; McFadden, K.L. A Study of the Airline Boarding Problem. J. Air Transp. Manag. 2008, 14, 197–204. [Google Scholar] [CrossRef]
- Mirza, M. Economic impact of Airplane Turn-times. AERO Q. 2008, 4, 14–19. [Google Scholar]
- Cook, A.J.; Tanner, G. European Airline Delay Cost Reference Values; Technical Report; EUROCONTROL Performance Review Unit: Brussels, Belgium, 2015. [Google Scholar]
- Van Landeghem, H.V.; Beuselinck, A. Reducing Passenger Boarding Time in Airplanes: A Simulation Based Approach. Eur. J. Oper. Res. 2002, 142, 294–308. [Google Scholar] [CrossRef]
- Ferrari, P.; Nagel, K. Robustness of Efficient Passenger Boarding Strategies for Airplanes. J. Trans. Res. Board 2005, 1915, 44–54. [Google Scholar] [CrossRef]
- Van den Briel, M.H.L.; Villalobos, J.R.; Hogg, G.L.; Lindemann, T.; Mule, A.V. America West Airlines Develops Efficient Boarding Strategies. Interfaces 2005, 35, 191–201. [Google Scholar] [CrossRef]
- Bachmat, E.; Elkin, M. Bounds on the Performance of Back-to-Front Aircraft Boarding Policies. Oper. Res. Lett. 2008, 35, 597–601. [Google Scholar] [CrossRef]
- Schultz, M.; Schulz, C.; Fricke, H. Efficiency of Aircraft Boarding Procedures. In Proceedings of the 3rd International Conference on Research in Air Transportation, Fairfax, VA, USA, 1–4 June 2008; pp. 371–377. [Google Scholar]
- Bachmat, E.; Khachaturov, V.; Kuperman, R. Optimal Back-to-Front Aircraft Boarding. Phys. Rev. E 2013, 87, 062805. [Google Scholar] [CrossRef] [PubMed]
- Jafer, S.; Mi, W. Comparative Study of Aircraft Boarding Strategies Using Cellular Discrete Event Simulation. Aerospace 2017, 4, 57. [Google Scholar] [CrossRef]
- Bazargan, M. A Linear Programming Approach for Aircraft Boarding Strategy. Eur. J. Oper. Res. 2006, 183, 394–411. [Google Scholar] [CrossRef]
- Steffen, J.H. Optimal Boarding Method for Airline Passengers. J. Air Trans. Manag. 2008, 14, 146–150. [Google Scholar] [CrossRef]
- Steffen, J.H. A Statistical Mechanics Model for Free-for-all Airplane Passenger Boarding. Am. J. Phys. 2008, 76, 1114–1119. [Google Scholar] [CrossRef]
- Frette, V.; Hemmer, P.-C. Time needed to board an aircraft: A power law and the structure behind it. Phys. Rev. E Stat. Nonlinear Soft Matter Phys. 2012, 85, 011130. [Google Scholar] [CrossRef] [PubMed]
- Bernstein, N. Comment on Time Needed to Board an Airplane: A Power Law and the Structure Behind it. Phys. Rev. E Stat. Nonlinear Soft Matter Phys. 2012, 86, 023101. [Google Scholar] [CrossRef] [PubMed]
- Tang, T.-Q.; Wu, Y.-H.; Huang, H.-J.; Caccetta, L. An Aircraft Boarding Model Accounting for Passengers’ Individual Properties. Trans. Res. Part C 2012, 22, 1–16. [Google Scholar] [CrossRef]
- Milne, R.J.; Kelly, A.R. A New Method for Boarding Passengers onto an Airplane. J. Air Trans. Manag. 2014, 34, 93–100. [Google Scholar] [CrossRef]
- Qiang, S.-J.; Jia, B.; Xie, D.-F.; Gao, Z.-Y. Reducing Airplane Boarding Time by Accounting for Passengers’ Individual Properties: A Simulation Based on Cellular Automaton. J. Air Trans. Manag. 2014, 40, 42–47. [Google Scholar] [CrossRef]
- Milne, R.J.; Salari, M. Optimization of Assigning Passengers to Seats on Airplanes Based on Their Carry-on Luggage. J. Air Trans. Manag. 2016, 54, 104–110. [Google Scholar] [CrossRef]
- Zeineddine, H. A Dynamically Optimized Aircraft Boarding Strategy. J. Air Trans. Manag. 2017, 58, 144–151. [Google Scholar] [CrossRef]
- Bachmat, E.; Berend, D.; Sapir, L.; Skiena, S.; Stolyarov, N. Analysis of Aircraft Boarding Times. Oper. Res. 2009, 57, 499–513. [Google Scholar] [CrossRef]
- Chung, C.-A. Simulation Design Approach for the Selection of Alternative Commercial Passenger Aircraft Seating Configurations. J. Aviat. Technol. Eng. 2012, 2, 100–104. [Google Scholar] [CrossRef]
- Fuchte, J. Enhancement of Aircraft Cabin Design Guidelines with Special Consideration of Aircraft Turnaround and Short Range Operations. Ph.D. Thesis, Technische Universität Hamburg-Harburg, Hamburg, Germany, 2014. [Google Scholar]
- Schmidt, M.; Nguyen, P.; Hornung, M. Novel Aircraft Ground Operation Concepts Based on Clustering of Interfaces; SAE Technical Paper 2015-01-2401; SAE AeroTech Congress and Exhibition: Seattle, WA, USA, September 2015. [Google Scholar]
- Schmidt, M.; Heinemann, P.; Hornung, M. Boarding and Turnaround Process Assessment of Single- and Twin-Aisle Aircraft. In Proceedings of the 55th AIAA Aerospace Sciences Meeting, AIAA SciTech Forum, (AIAA 2017-1856), Grapevine, TX, USA, 9–13 January 2017. [Google Scholar]
- Steffen, J.H.; Hotchkiss, J. Experimental Test of Aircraft Boarding Methods. J. Air Trans. 2012, 18, 64–67. [Google Scholar] [CrossRef]
- Steiner, A.; Philipp, M. Speeding up the airplane boarding process by using pre-boarding areas. In Proceedings of the 9th Swiss Transport Research Conference, Monte Verità/Ascona, Switzerland, 9–11 September 2009. [Google Scholar]
- Kierzkowski, A.; Kisiel, T. The Human Factor in the Passenger Boarding Process at the Airport. Proced. Eng. 2017, 187, 348–355. [Google Scholar] [CrossRef]
- Gwynne, S.M.V.; Senarath Yapa, U.; Codrington, L.; Thomas, J.R.; Jennings, S.; Thompson, A.J.L.; Grewal, A. Small-scale trials on passenger microbehaviours during aircraft boarding and deplaning procedures. J. Air Trans. Manag. 2018, 67, 115–133. [Google Scholar] [CrossRef]
- Miura, A.; Nishinari, K. A passenger distribution analysis model for the perceived time of airplane boarding/deboarding, utilizing an ex-Gaussian distribution. J. Air Trans. Manag. 2017, 59, 44–49. [Google Scholar] [CrossRef]
- Schultz, M. Stochastic Transition Model for Pedestrian Dynamics. In Pedestrian and Evacuation Dynamics 2012; Weidmann, U., Kirsch, U., Schreckenberg, M., Eds.; Springer: Cham, Switzerland, 2014; pp. 971–985. [Google Scholar]
- Schultz, M.; Kretz, T.; Fricke, H. Solving the Direction Field for Discrete Agent Motion. In Proceedings of the 9th International Conference on Cellular Automata for Research and Industry (ACRI 2010), Ascoli Piceno, Italy, 21–24 September 2010; pp. 489–495. [Google Scholar]
- Schultz, M.; Kunze, T.; Oreschko, B.; Fricke, H. Microscopic Process Modelling for Efficient Aircraft Turnaround Management. In Proceedings of the Fourth International Air Transport and Operations Symposium, Delft, The Netherlands, 8–12 July 2013. [Google Scholar]
- Qiang, S.-J.; Jia, B.; Jiang, R.; Huang, Q.-X.; Radwan, E.; Gao, Z.-Y.; Wang, Y.-Q. Symmetrical Design of Strategy-pairs for Enplaning and Deplaning an Airplane. J. Air Trans. Manag. 2016, 54, 52–60. [Google Scholar] [CrossRef]
- Wald, A.; Harmon, M.; Klabjan, D. Structured Deplaning via Simulation and Optimization. J. Air Trans. Manag. 2014, 36, 101–109. [Google Scholar] [CrossRef]
- Schultz, M. Faster aircraft boarding enabled by infrastructural changes. In Proceedings of the 50th Winter Simulation Conference, Las Vegas, NV, USA, 3–6 December 2017; pp. 2530–2541. [Google Scholar]
- Schultz, M. Dynamic change of aircraft seat condition for fast boarding. Trans. Res. Part C 2017, 85, 131–147. [Google Scholar] [CrossRef]
- Molon Labe Seating. Side-Slip Seat, 2017. Available online: www.airlineseats.biz (accessed on 26 September 2017).
- Schultz, M. The seat interference potential as an indicator for the aircraft boarding progress. In Proceedings of the SAE AeroTech Congress and Exhibition, Fort Worth, TX, USA, 25–27 September 2017. SAE Technical Paper 2017-01-2113. [Google Scholar]
- Schultz, M. A metric for the real-time evaluation of the aircraft boarding progress. Trans. Res. Part C 2018, 86, 467–487. [Google Scholar] [CrossRef]
- Schultz, M. Reliable Aircraft Boarding for Fast Turnarounds. In Proceedings of the 5th International Workshop on ATM/CNS, Tokyo, Japan, 14–16 November 2017. [Google Scholar]
- Schultz, M. Fast Aircraft Turnaround Enabled by Reliable Passenger Boarding. Aerospace 2018, 5, 8. [Google Scholar] [CrossRef]
- Schultz, M. seatNow—Dynamic Seat Allocation, 2018. Available online: www.seatNow.net (accessed on 18 February 2018).
Figure 1.
Grid-based simulation environment—Airbus A320 as reference.

Figure 2.
Example for back-to-front and outside-in boarding strategy (darker seats are boarded first, block sequence is I-II-III) modelled in the simulation environment.
Figure 2.
Example for back-to-front and outside-in boarding strategy (darker seats are boarded first, block sequence is I-II-III) modelled in the simulation environment.
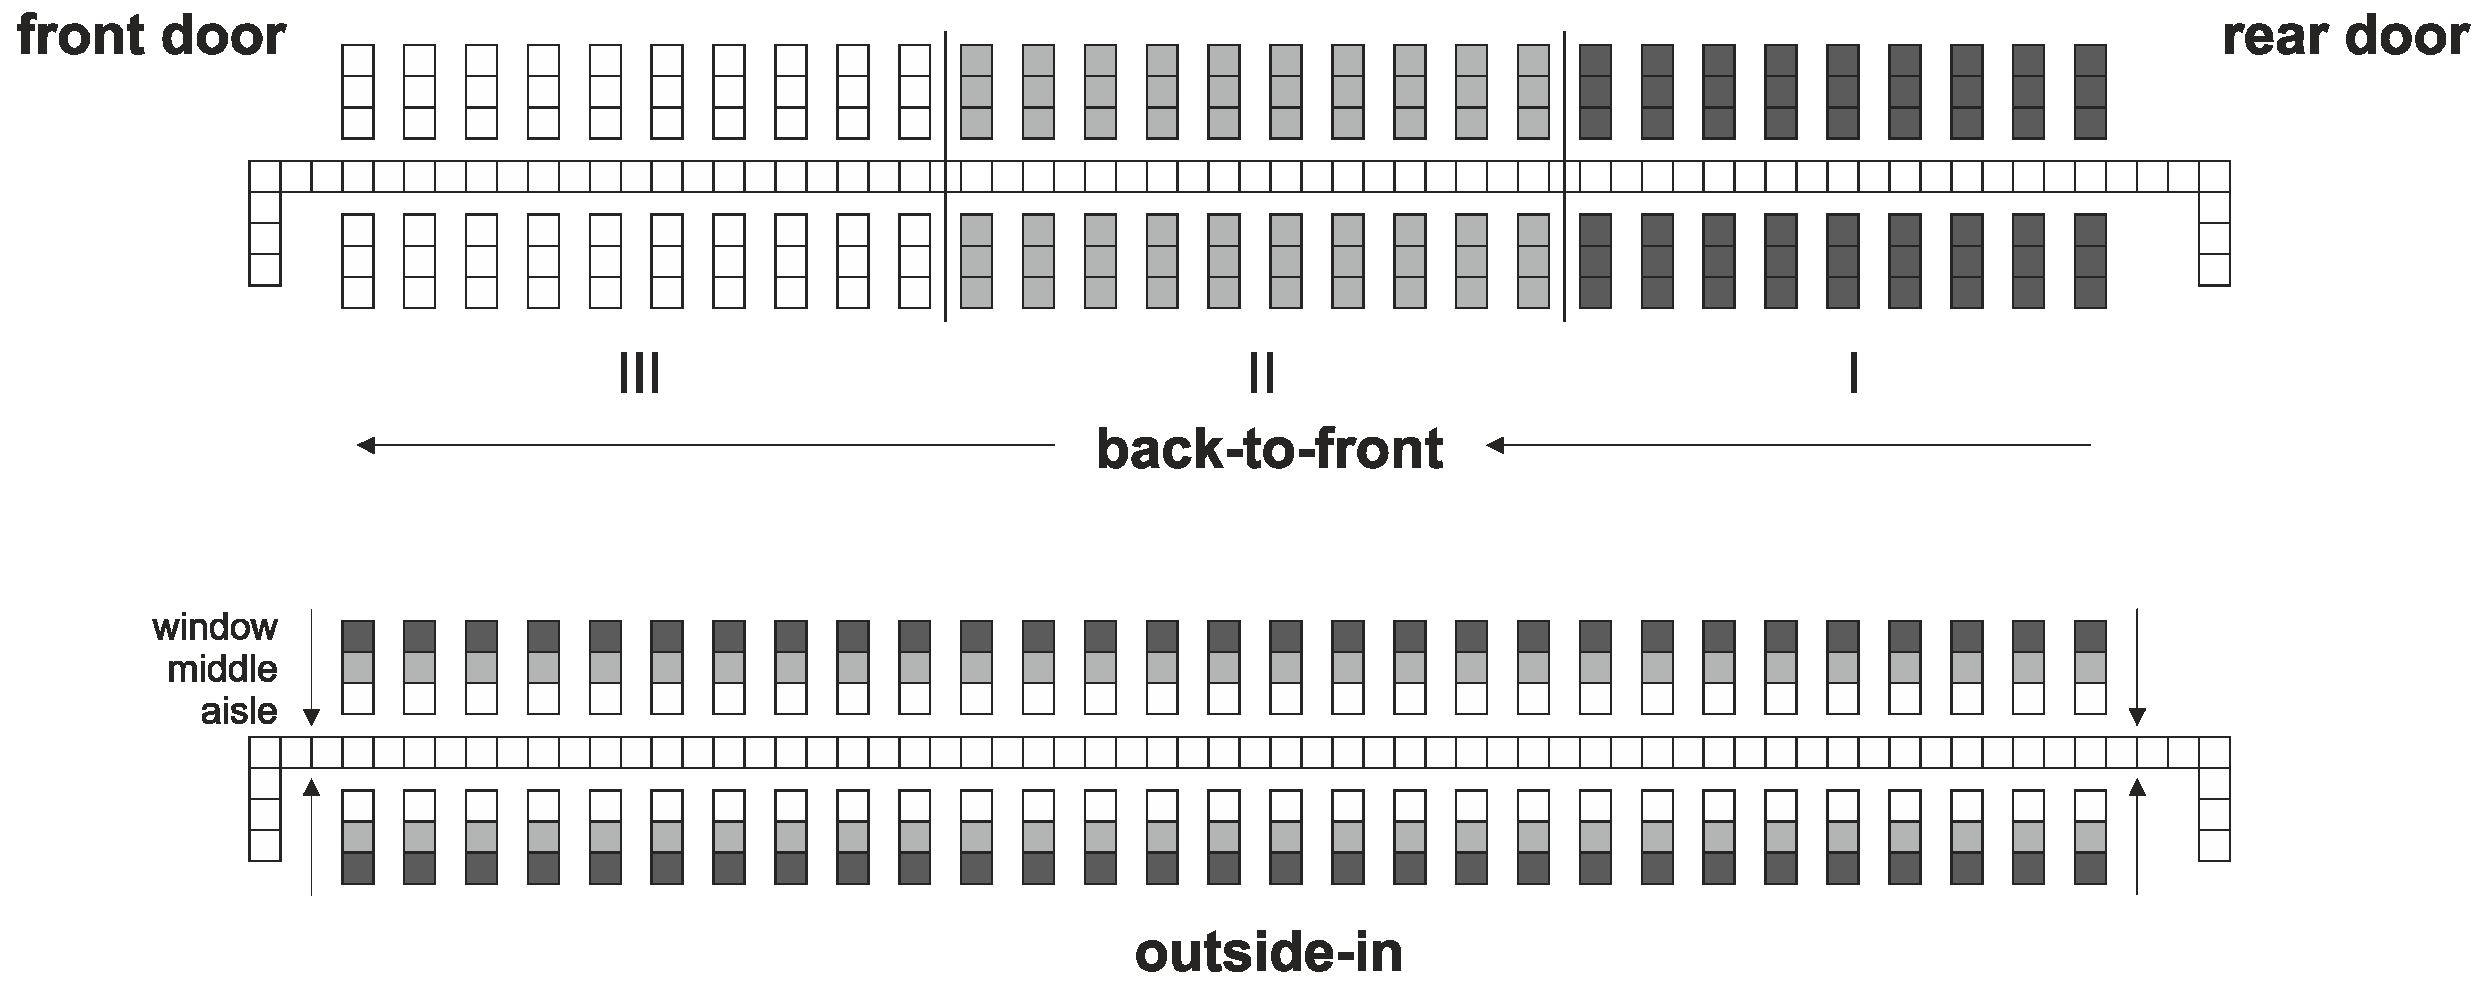
Figure 3.
Boarding times of 282 measured flights with different number of passengers assuming a linear correlation between passengers and boarding time with both defined offset (bold line) and no offset (thin line).
Figure 3.
Boarding times of 282 measured flights with different number of passengers assuming a linear correlation between passengers and boarding time with both defined offset (bold line) and no offset (thin line).

Figure 4.
Q–Q plot of cumulative distribution functions (CDF) of boarding rate percentiles with measured boarding rates against a linear boarding progress with rnB = 5.5 s/pax.
Figure 4.
Q–Q plot of cumulative distribution functions (CDF) of boarding rate percentiles with measured boarding rates against a linear boarding progress with rnB = 5.5 s/pax.
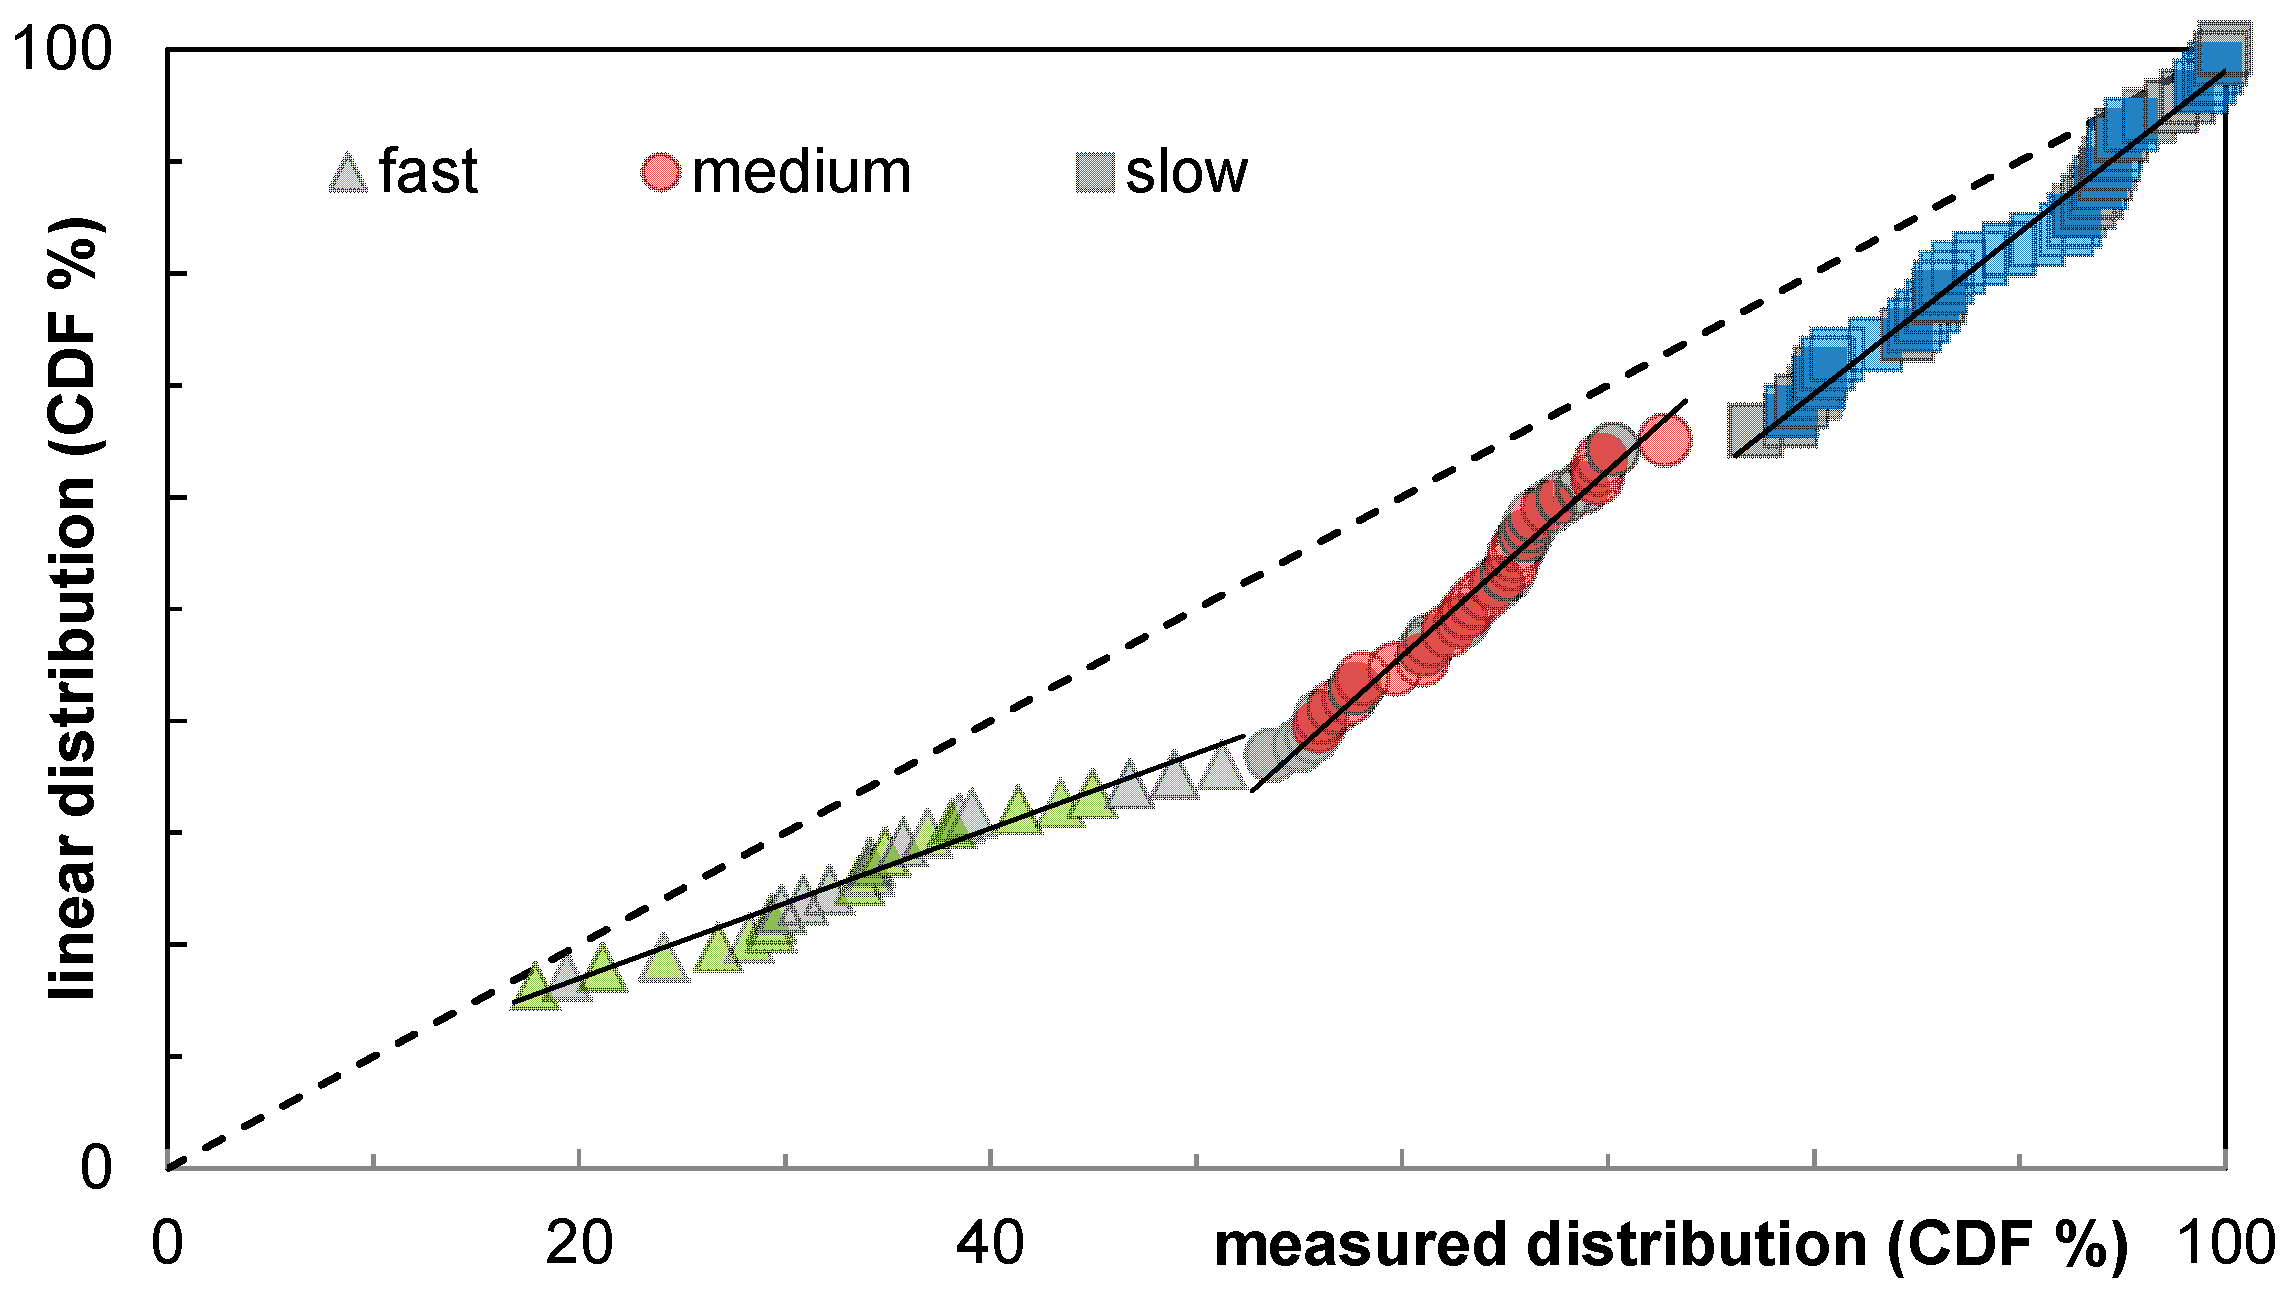
Figure 5.
Boarding time classification of field measurements: fast, medium, and slow progress.
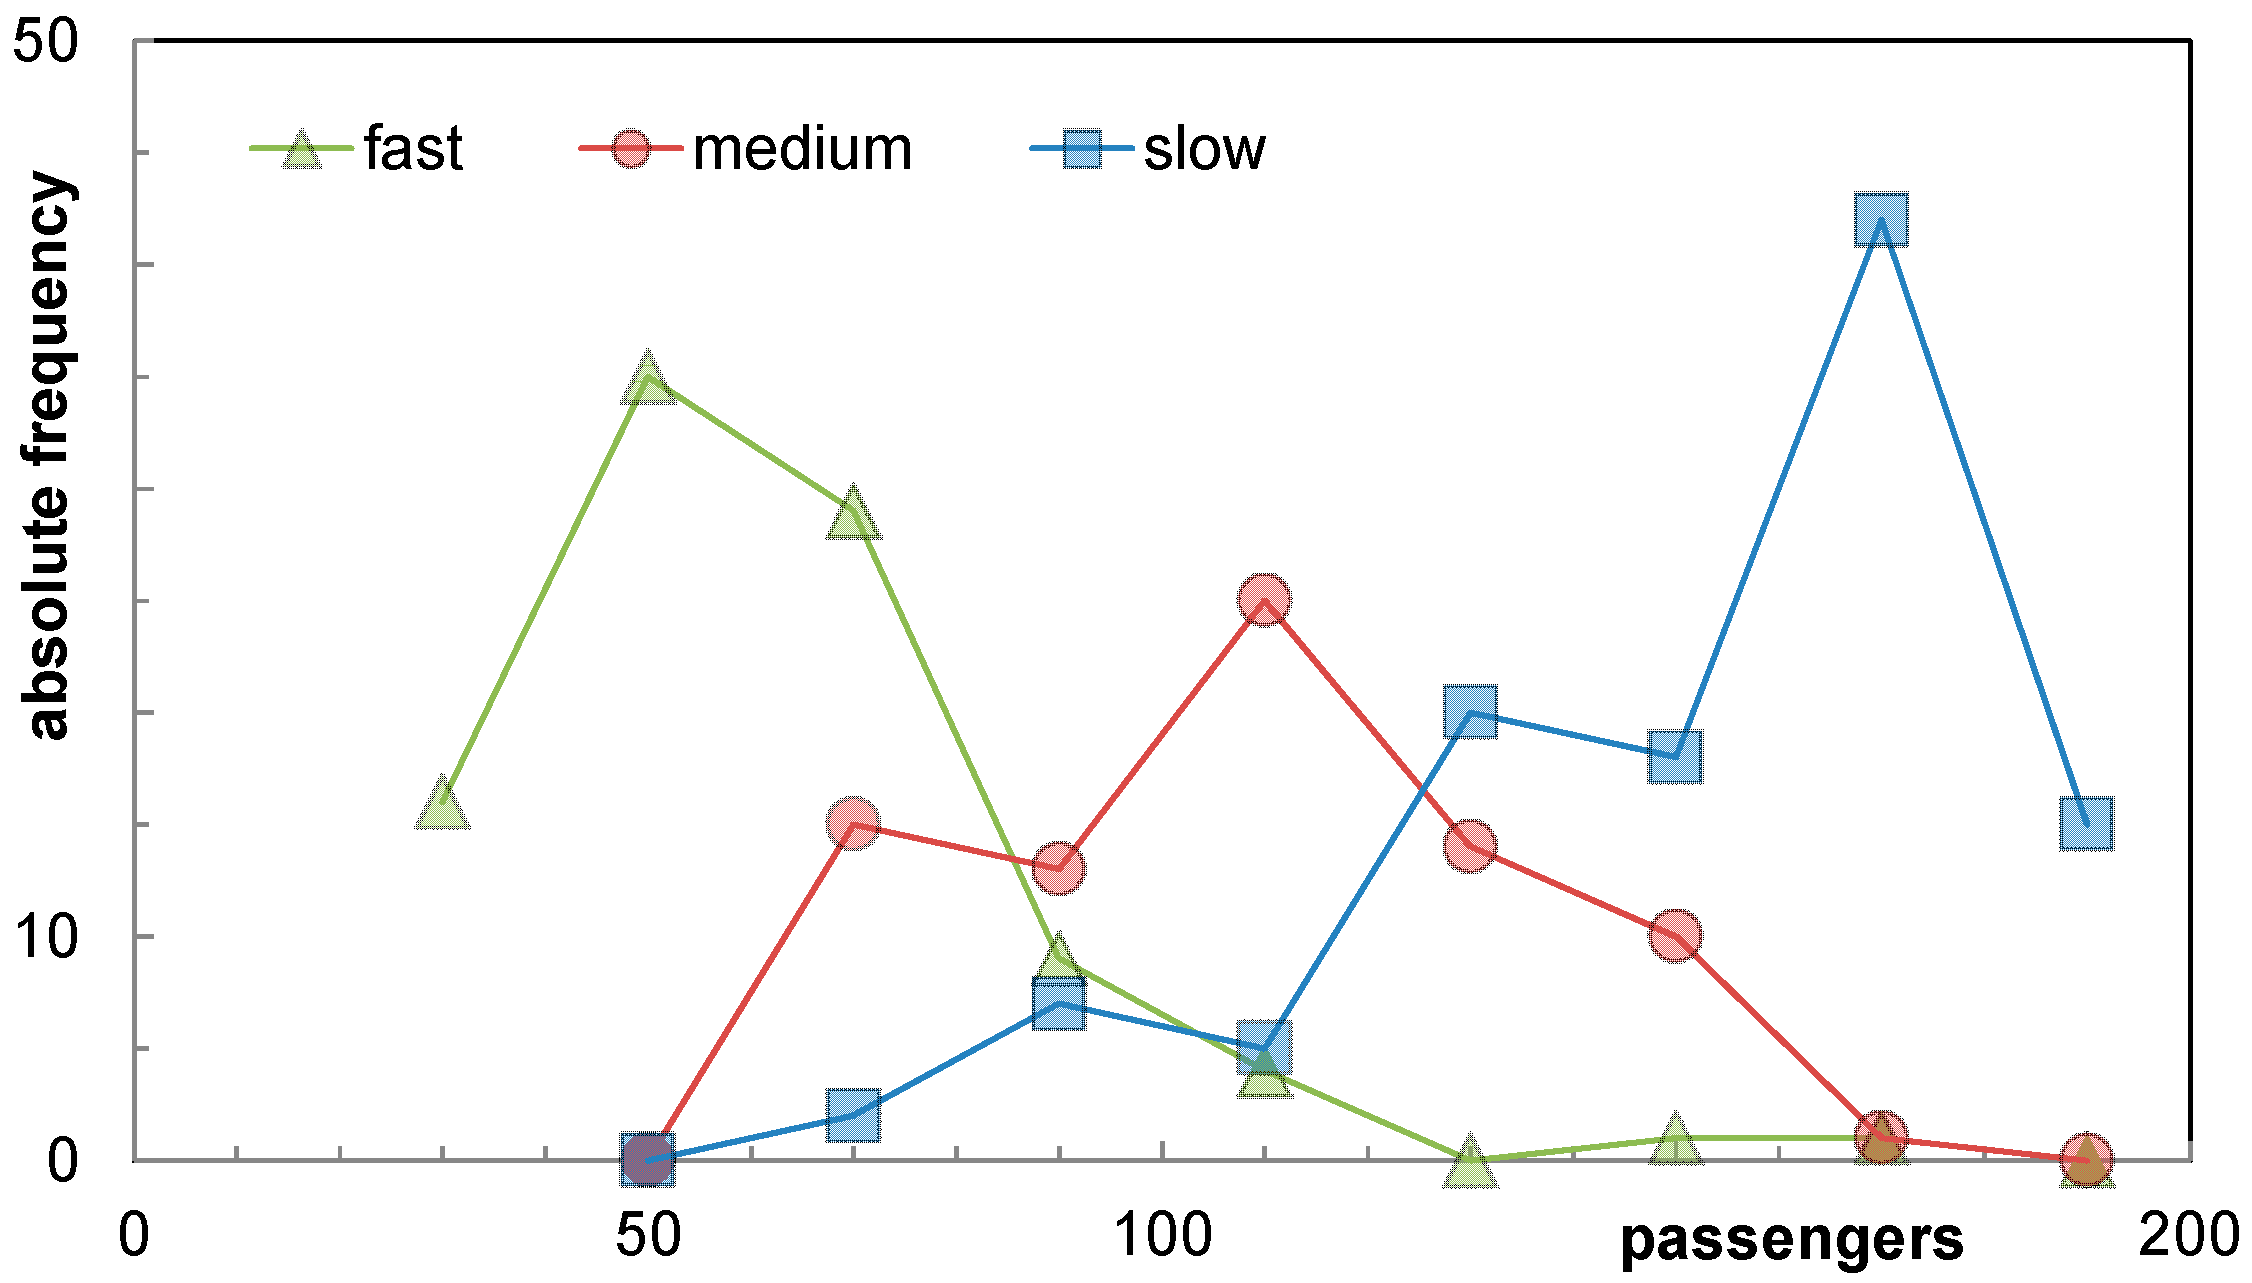
Figure 6.
Progress of different boarding events measured in the field.

Figure 7.
Passenger arrival rates decrease during aircraft boarding (arrival at aircraft door or at corresponding queue). Coverage of flights (green dashes) is indicated on secondary y-axis.
Figure 7.
Passenger arrival rates decrease during aircraft boarding (arrival at aircraft door or at corresponding queue). Coverage of flights (green dashes) is indicated on secondary y-axis.

Figure 8.
Inter-arrival times clustered in 5 s intervals and exponential distributed values.

Figure 9.
Expected amount arriving passengers in 5 s interval considering field measurement data and Poisson distribution (λ = 0.74).
Figure 9.
Expected amount arriving passengers in 5 s interval considering field measurement data and Poisson distribution (λ = 0.74).
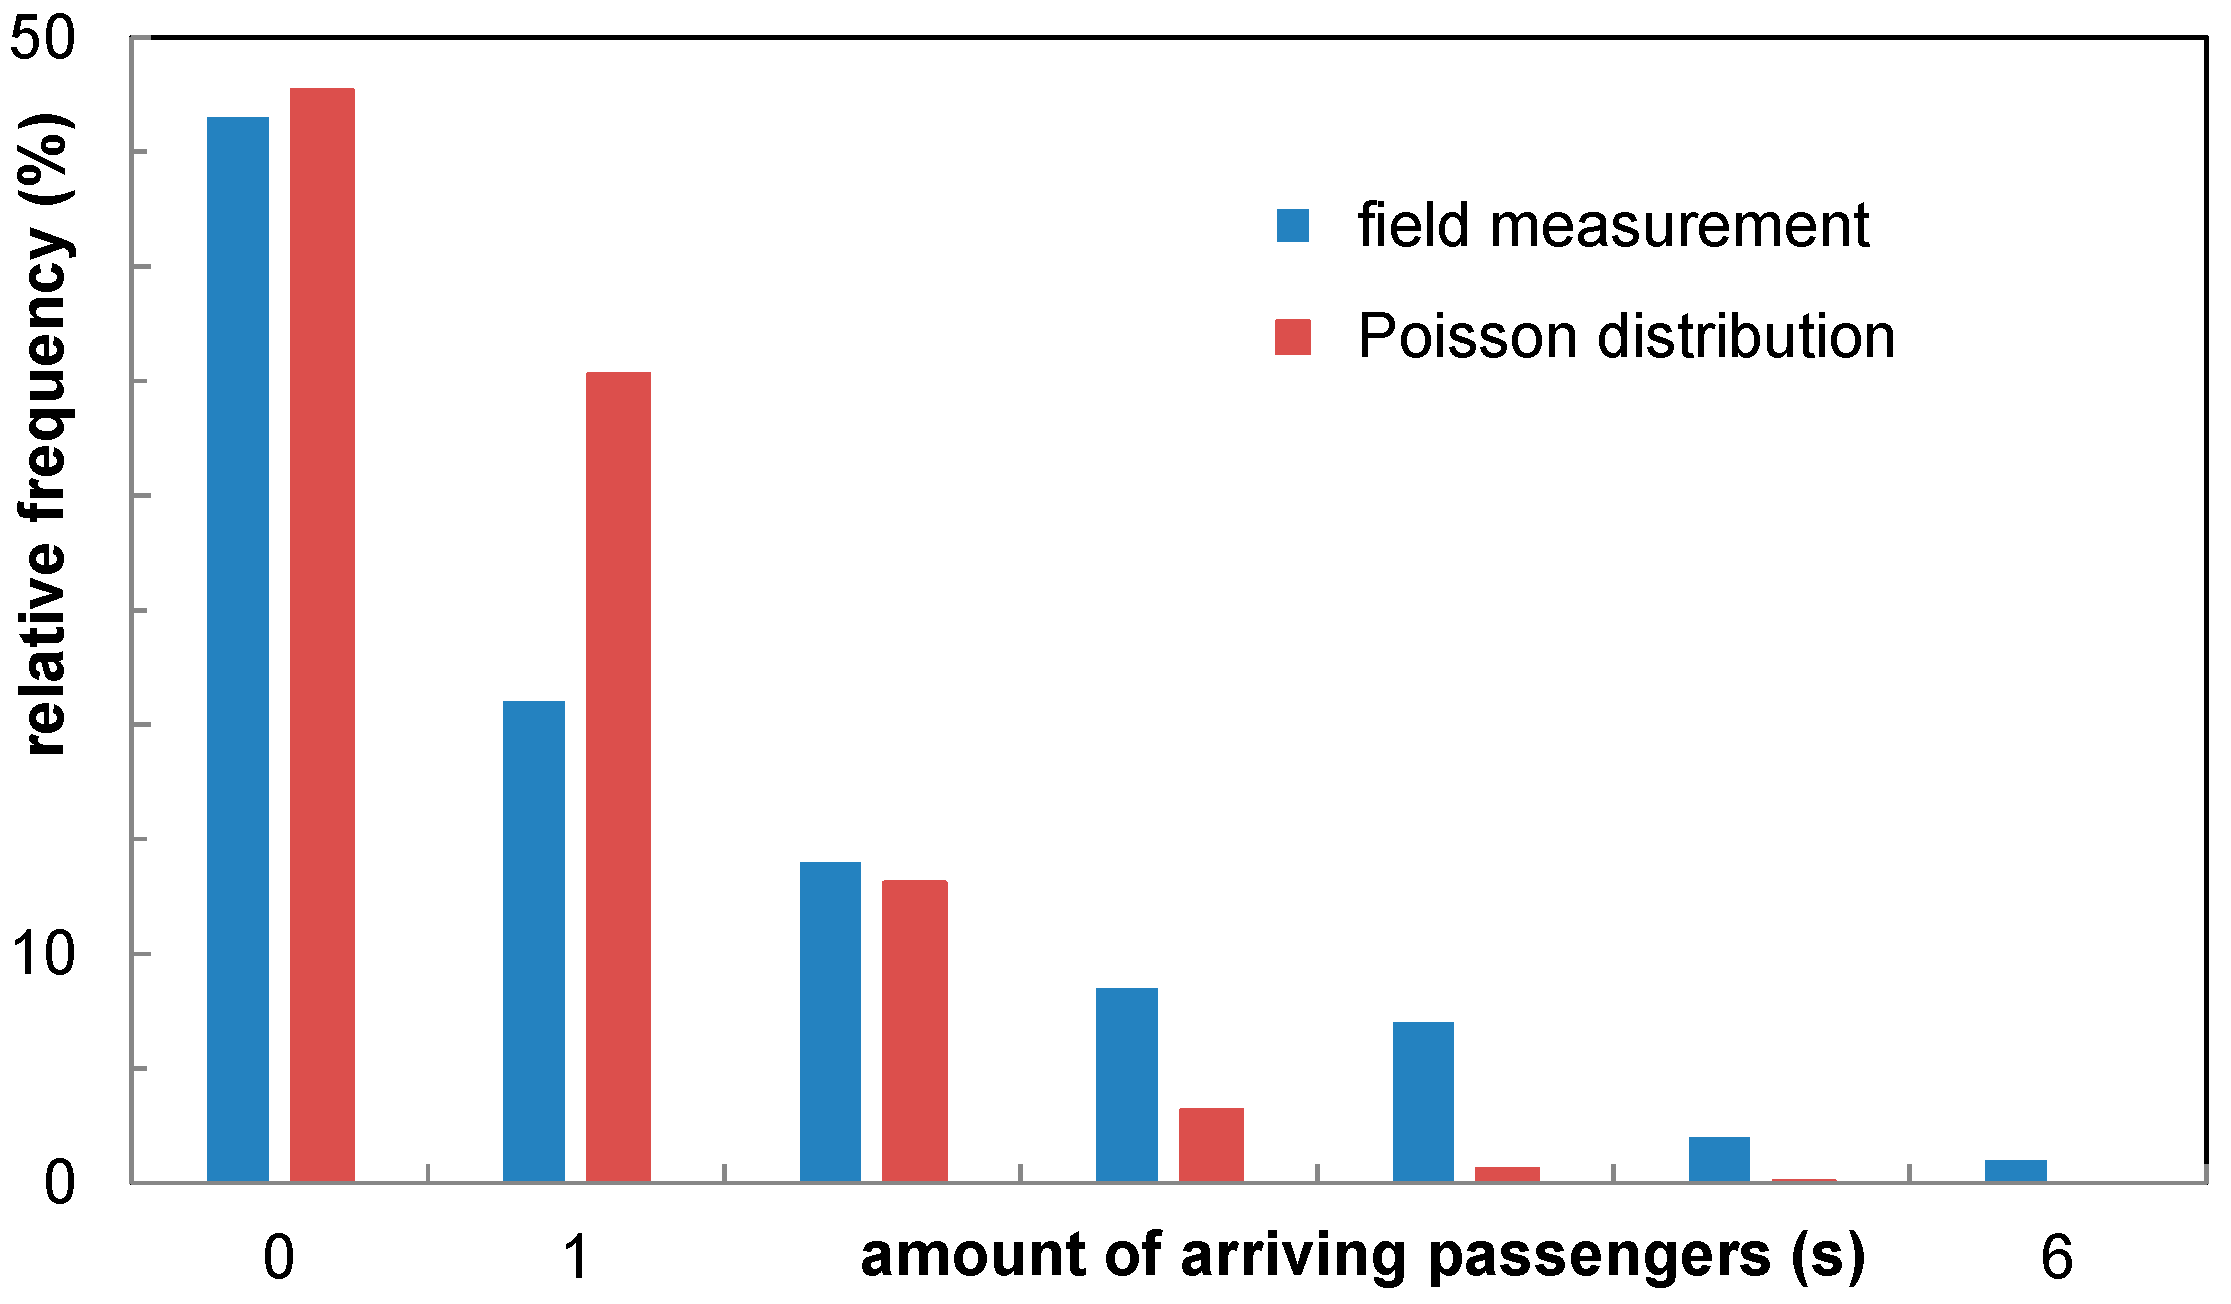
Figure 10.
Deboarding outflow rates of passengers during the deboarding progress (measured at aircraft door). Coverage of flights (green dashes) is indicated on secondary y-axis.
Figure 10.
Deboarding outflow rates of passengers during the deboarding progress (measured at aircraft door). Coverage of flights (green dashes) is indicated on secondary y-axis.
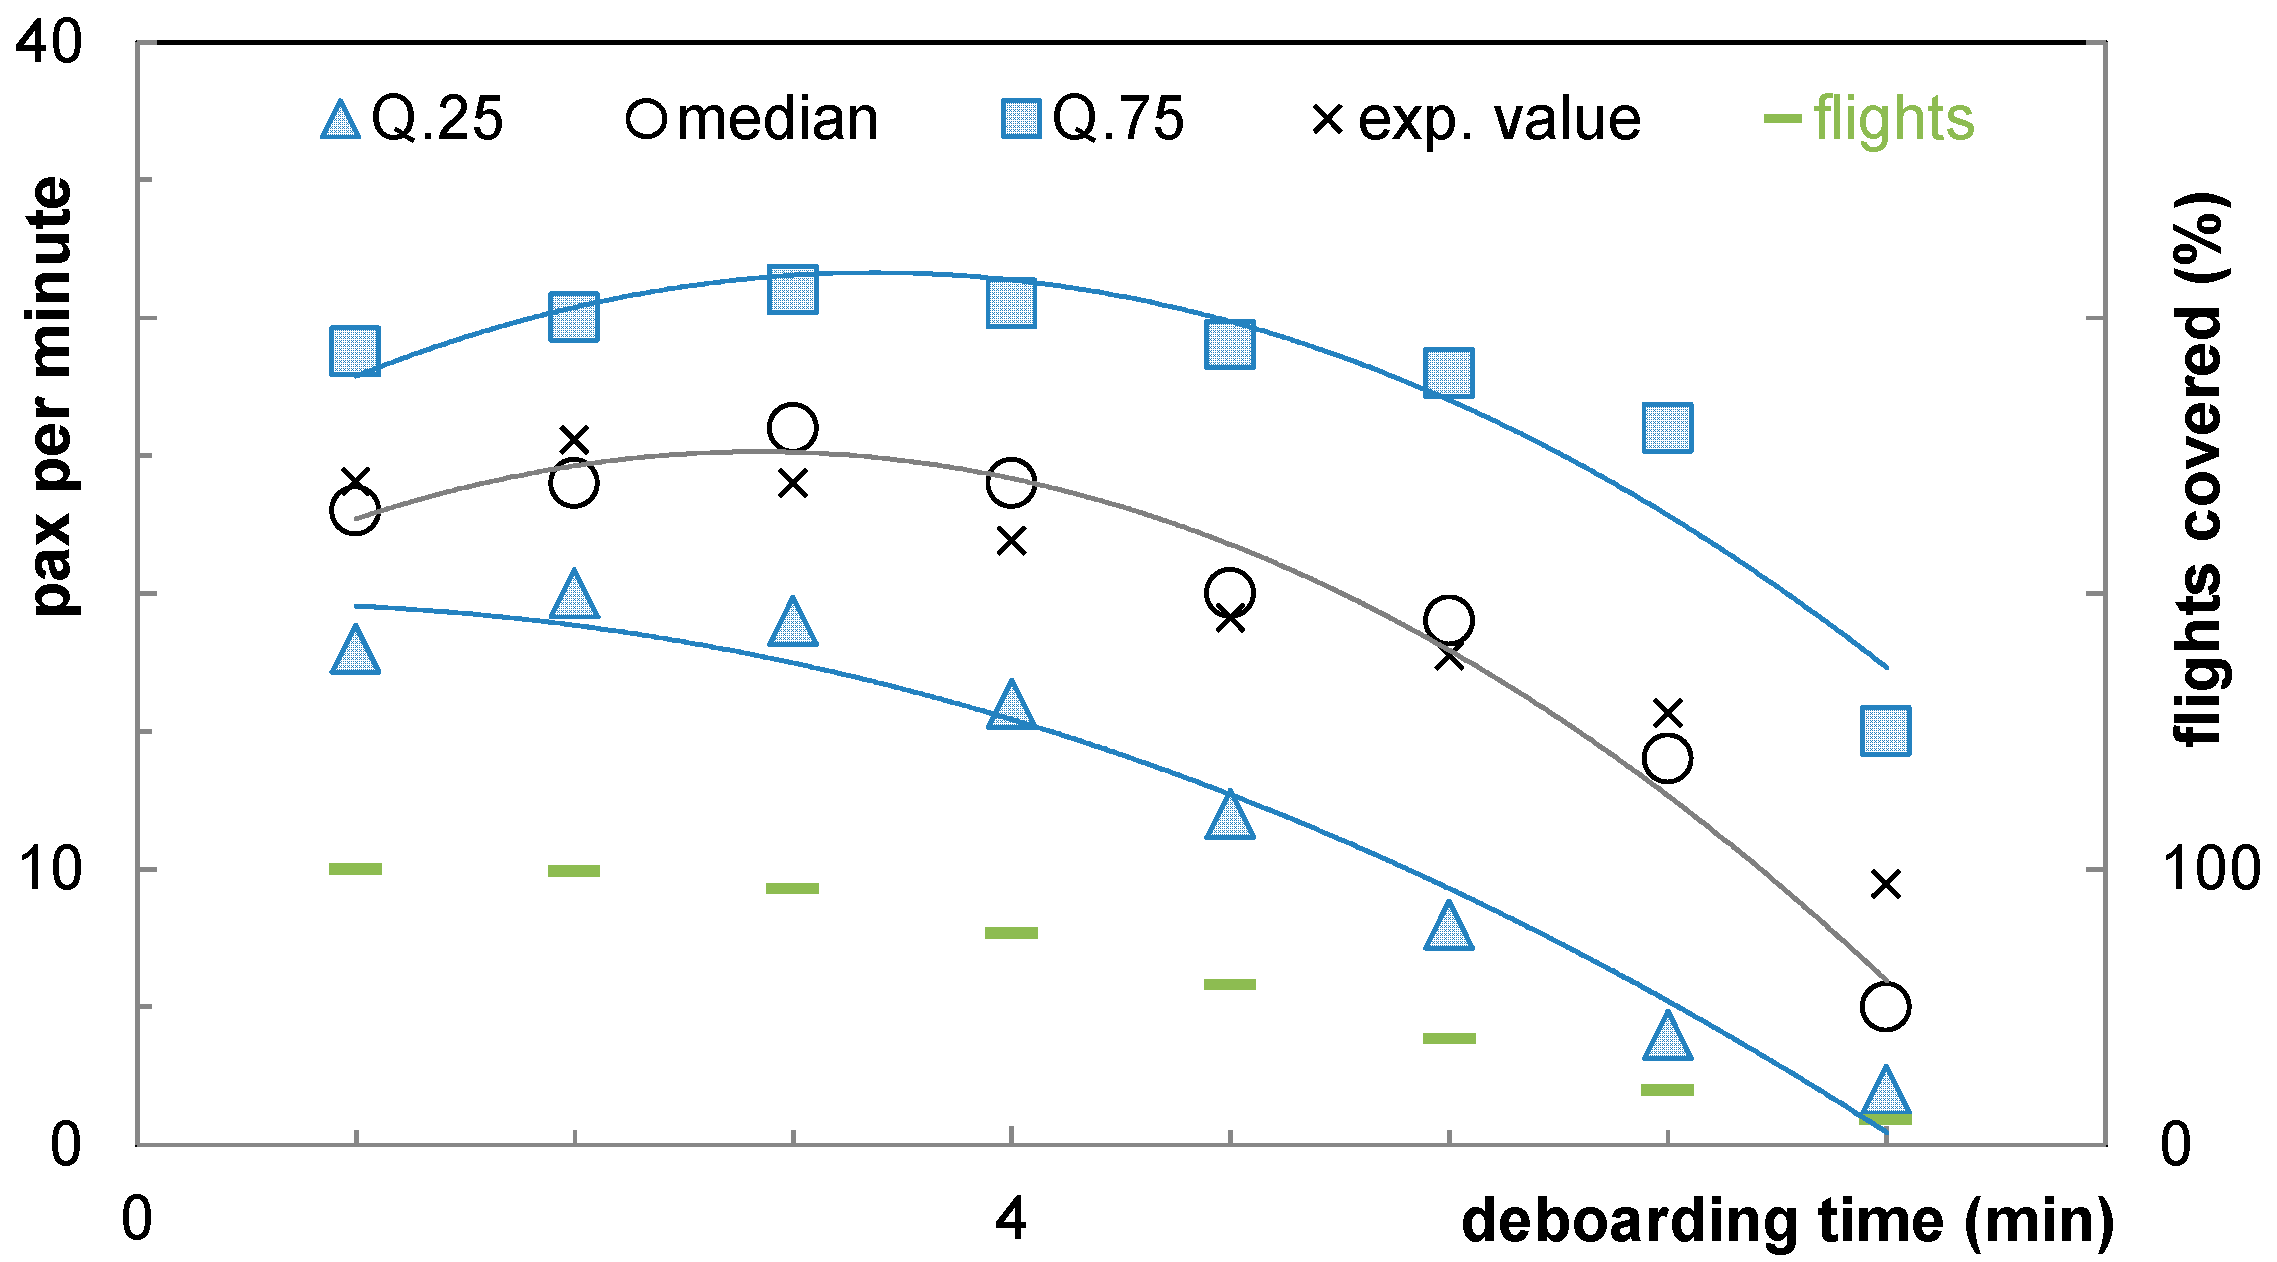
Figure 11.
Time needed to store the individual amount of hand luggage.
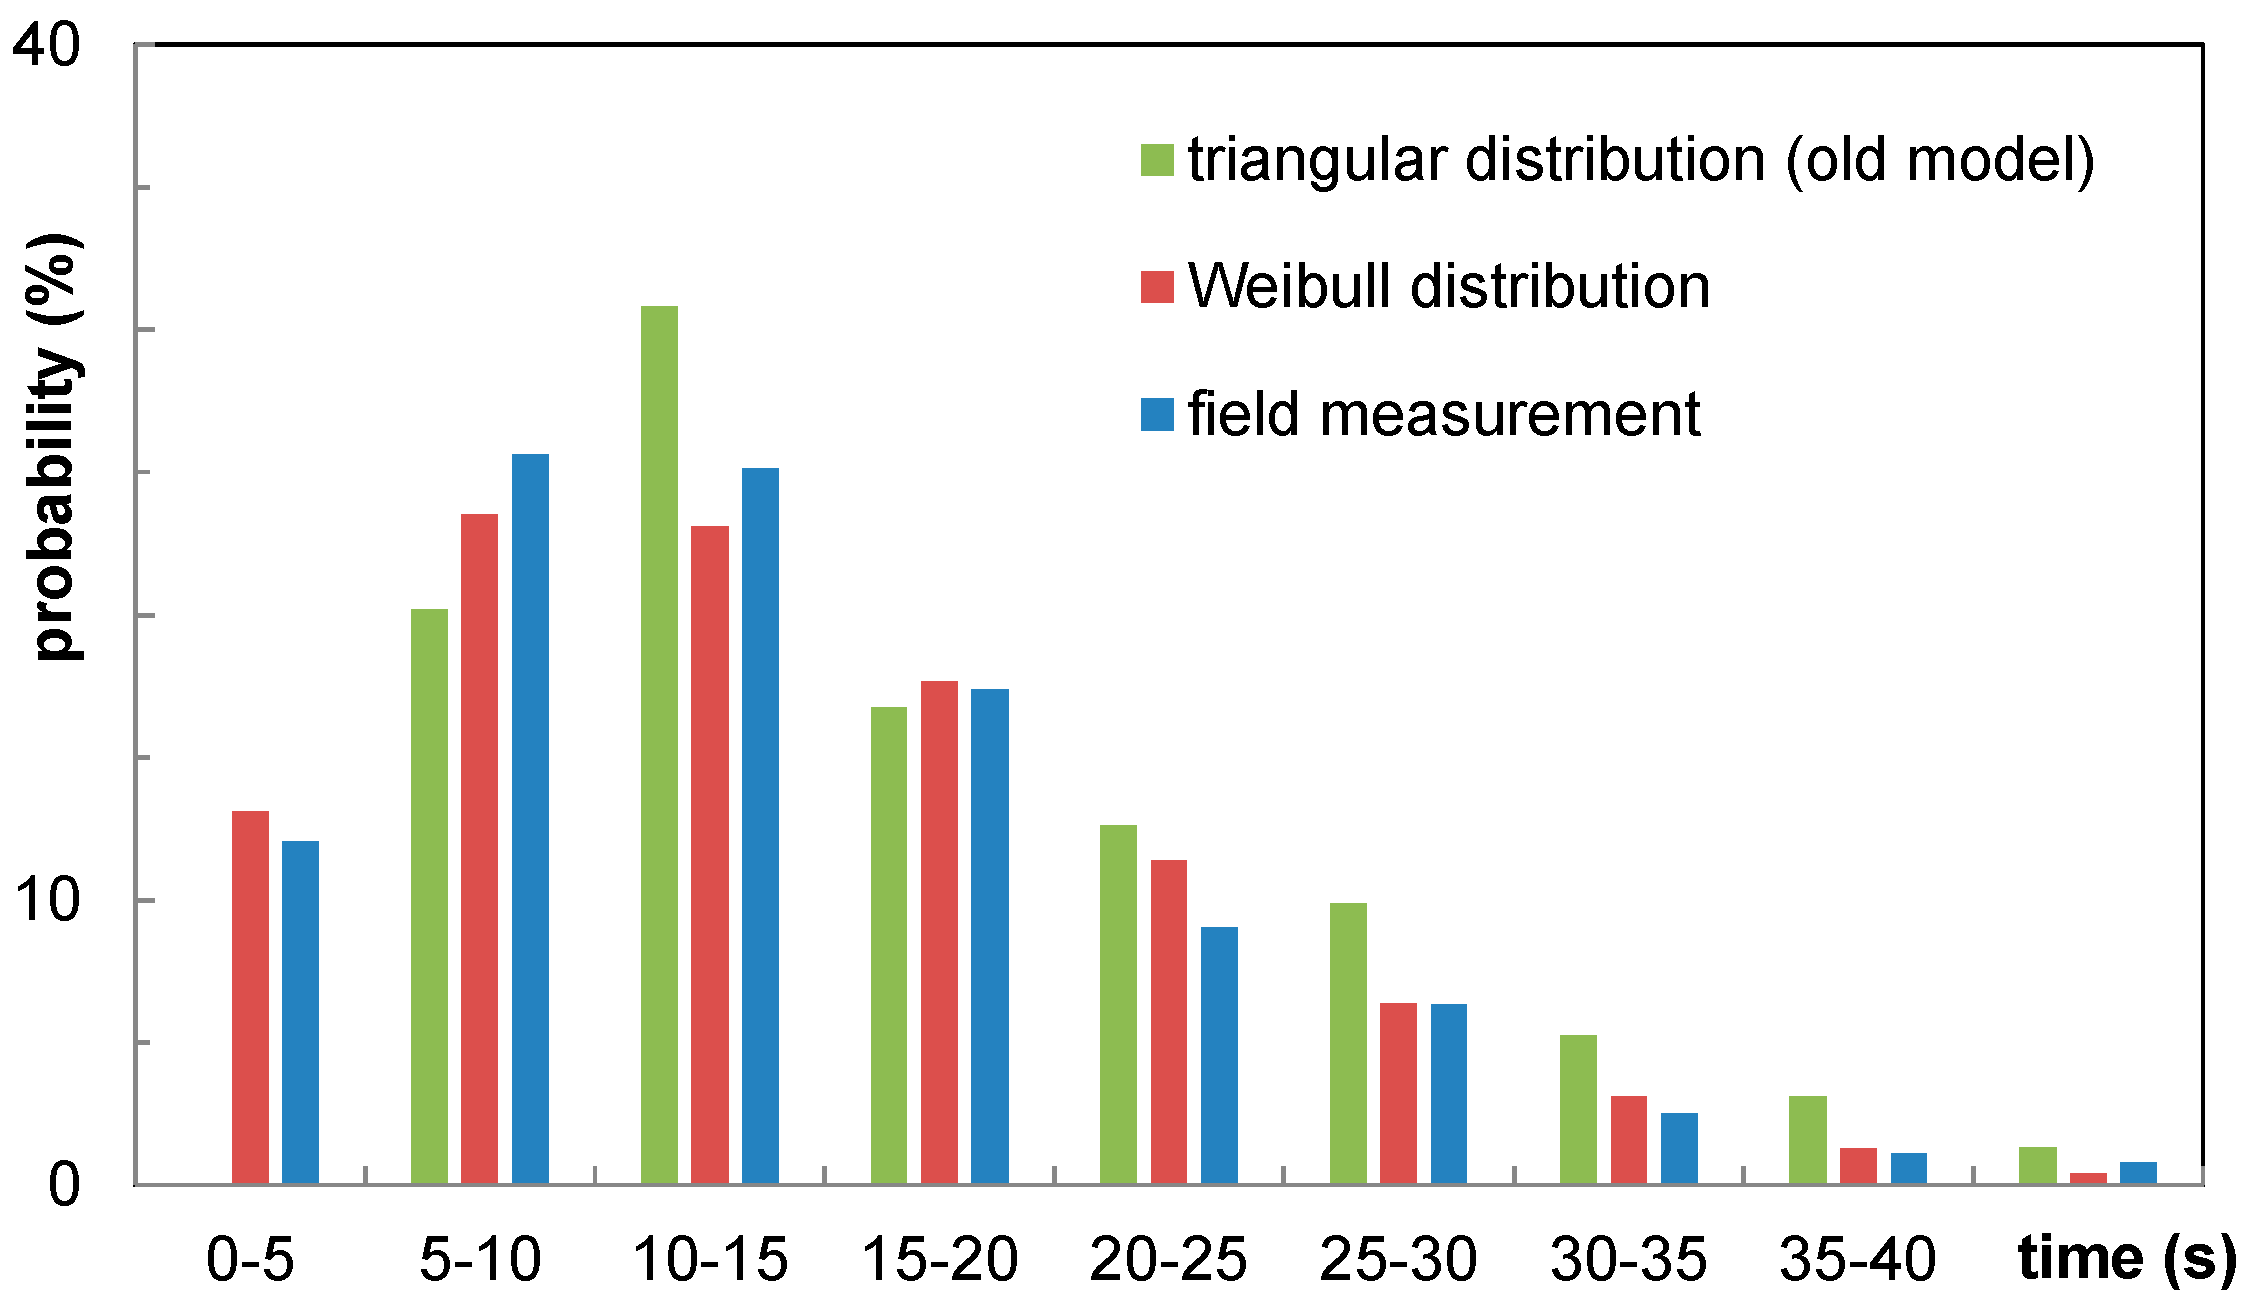
Figure 12.
Seat interference: measurement vs. simulation.
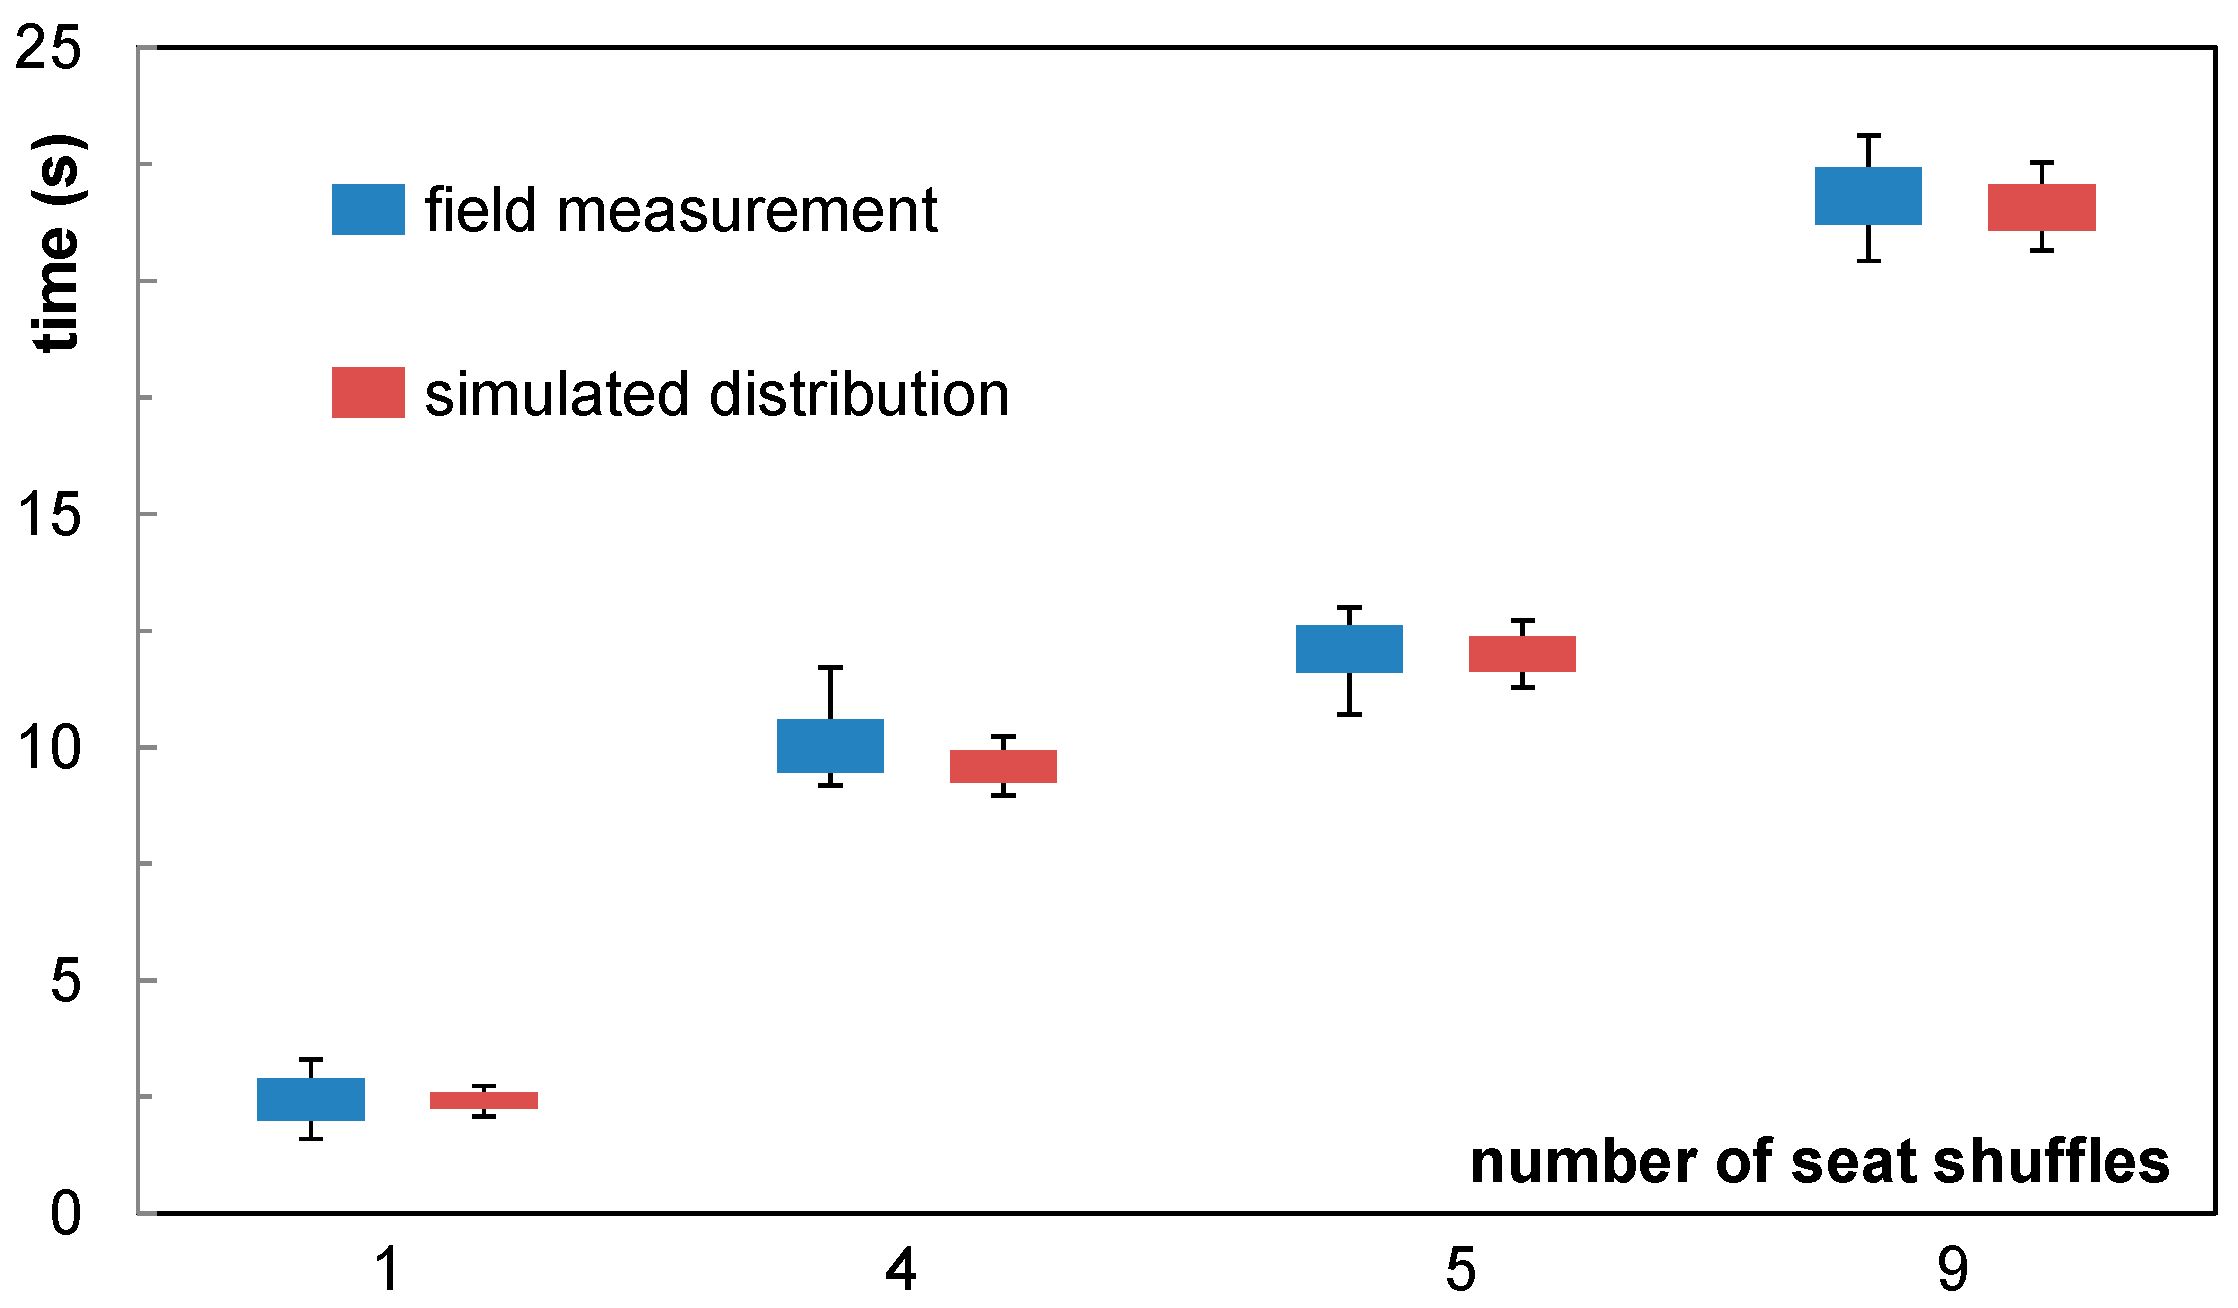
Figure 13.
Airline boarding strategies for validation trials: Scenario 1 and Scenario 2.
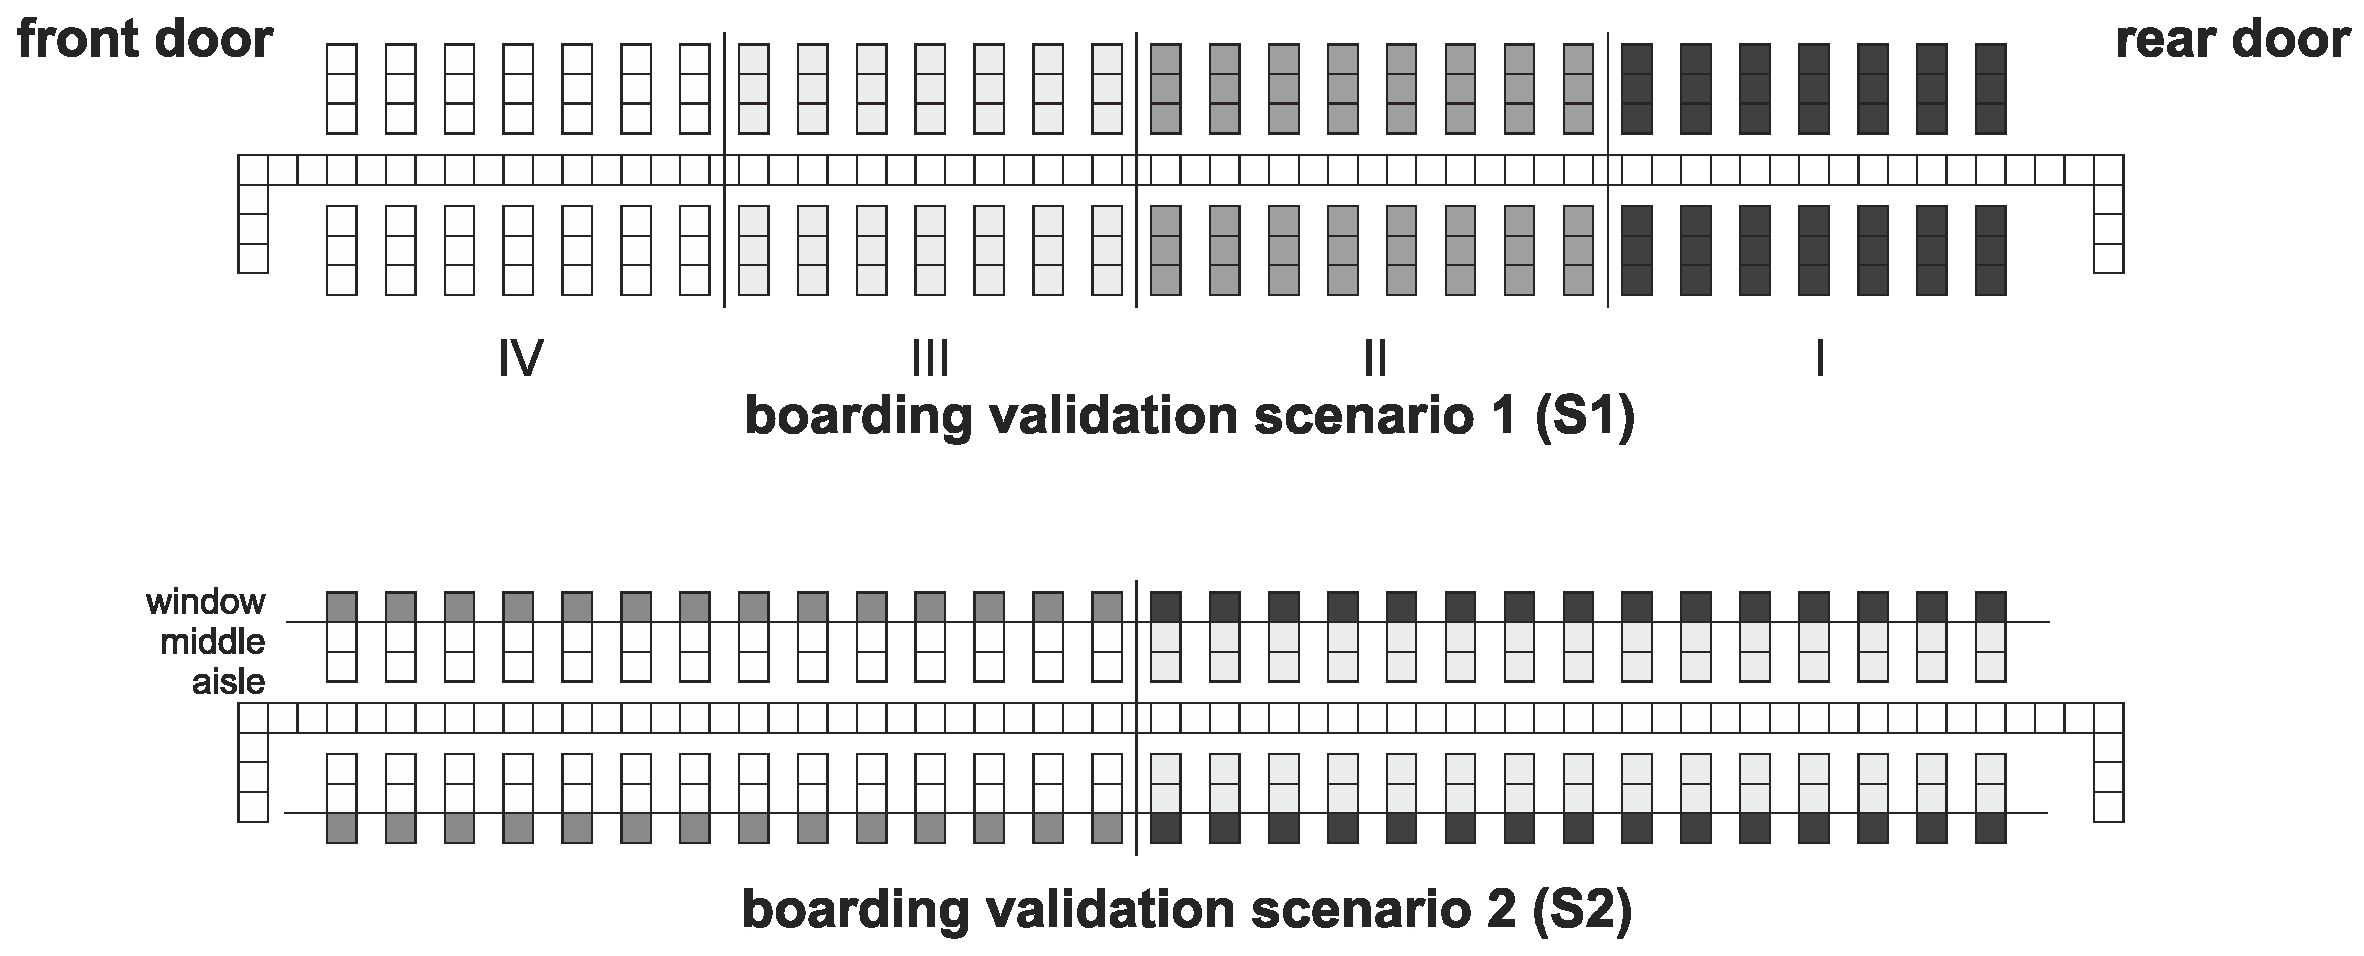
Figure 14.
Usage of the front door at the field trial.

Figure 15.
Amount of pre-boarding passengers.
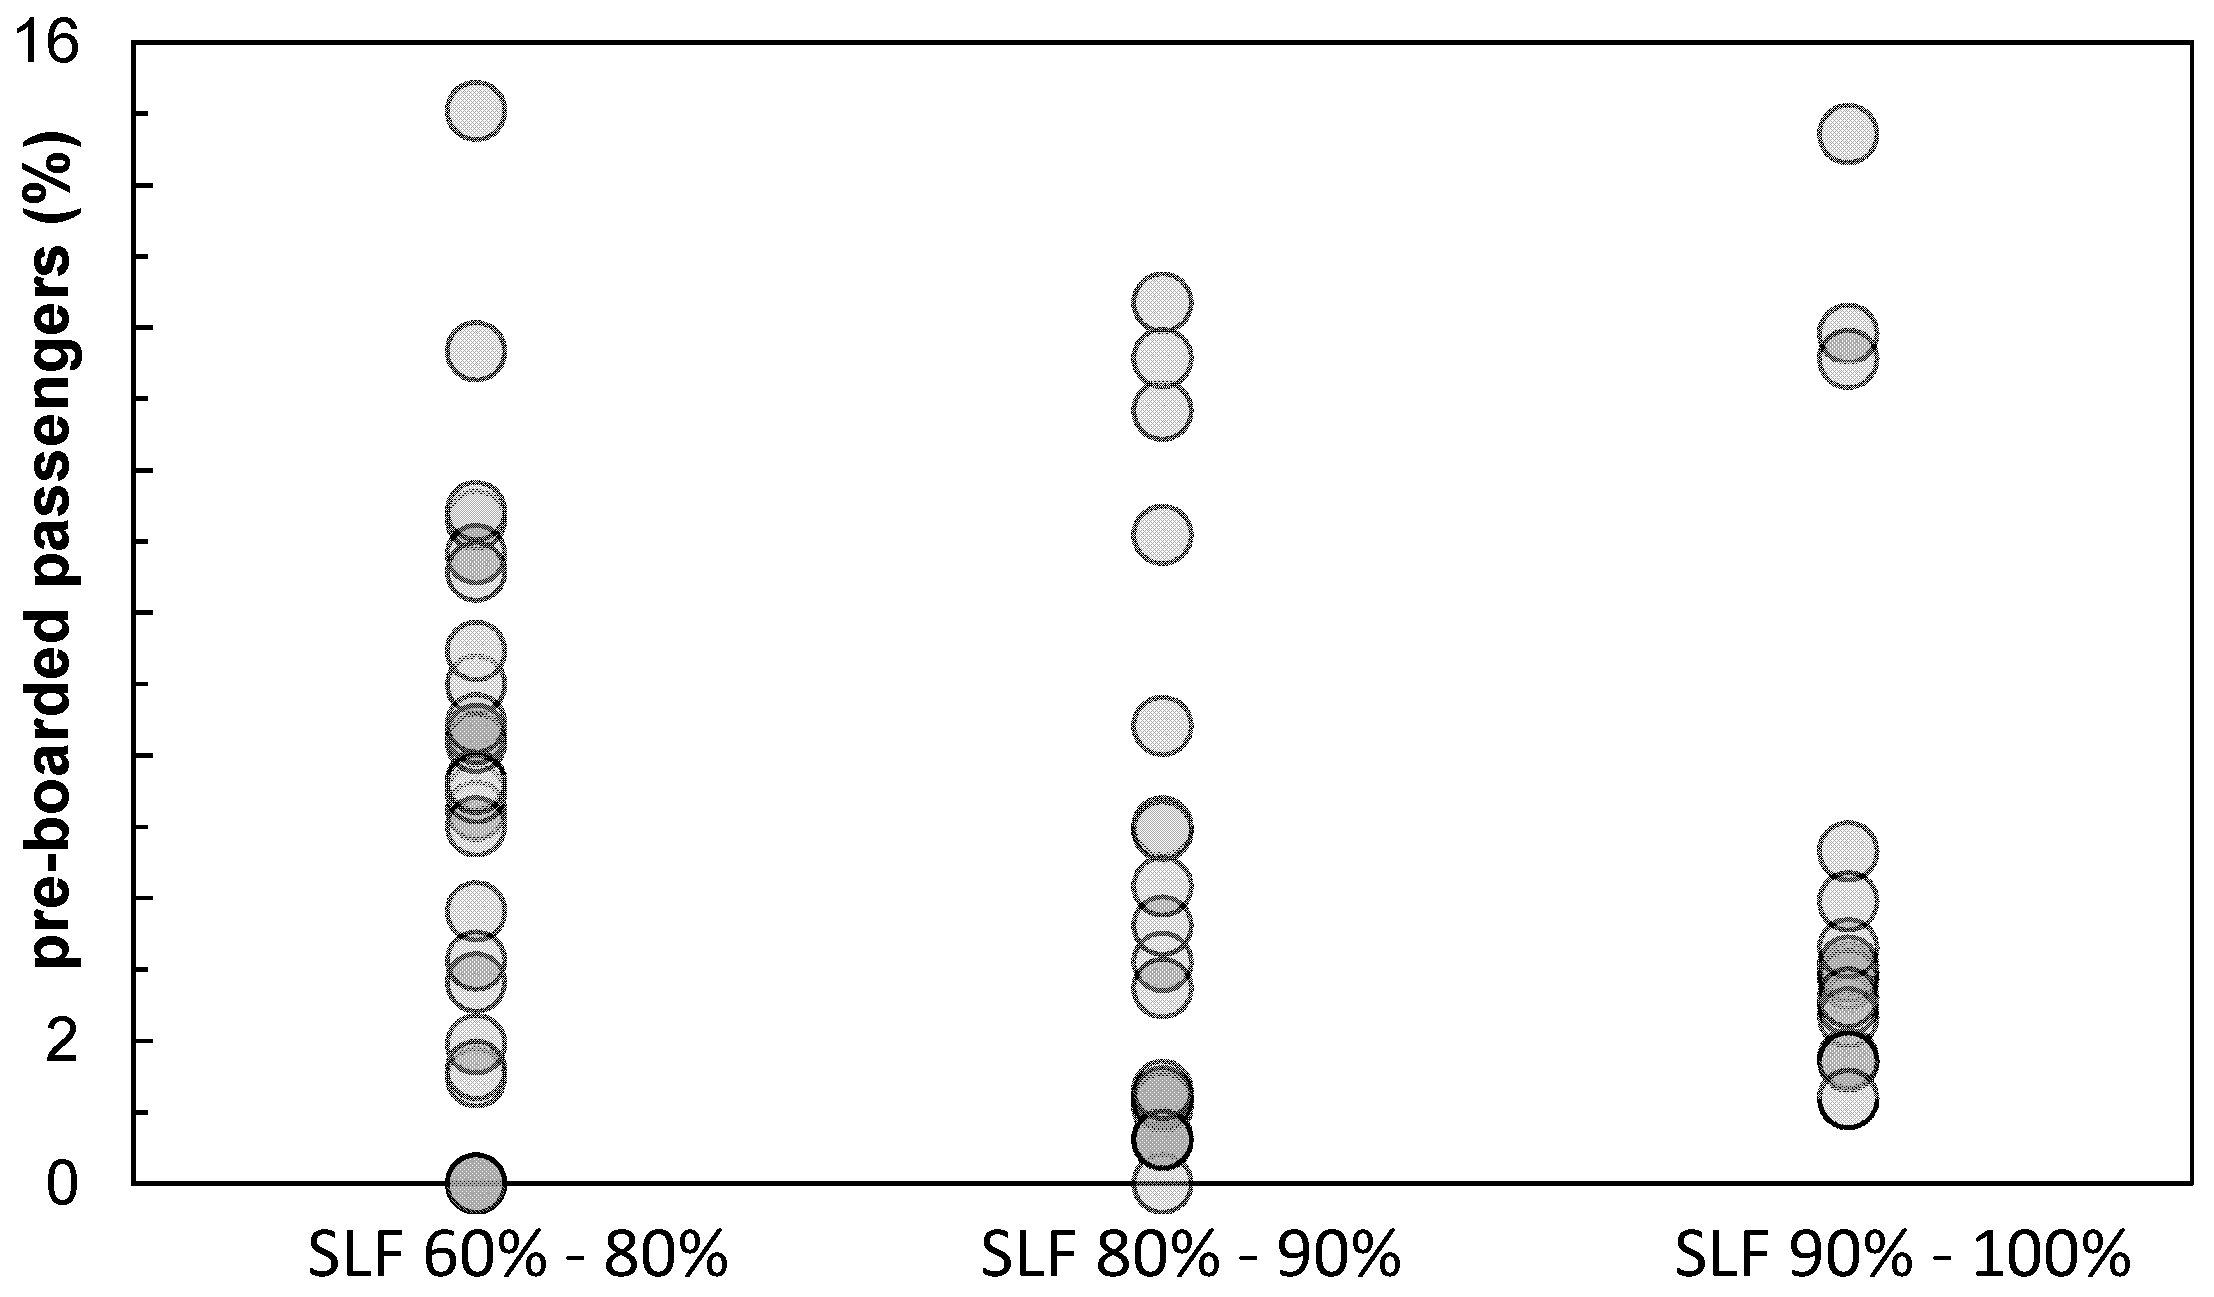
Figure 16.
Comparison of simulation results and measured boarding times using the block strategy (validation Scenario S1) and the standard outside-in boarding strategy.
Figure 16.
Comparison of simulation results and measured boarding times using the block strategy (validation Scenario S1) and the standard outside-in boarding strategy.
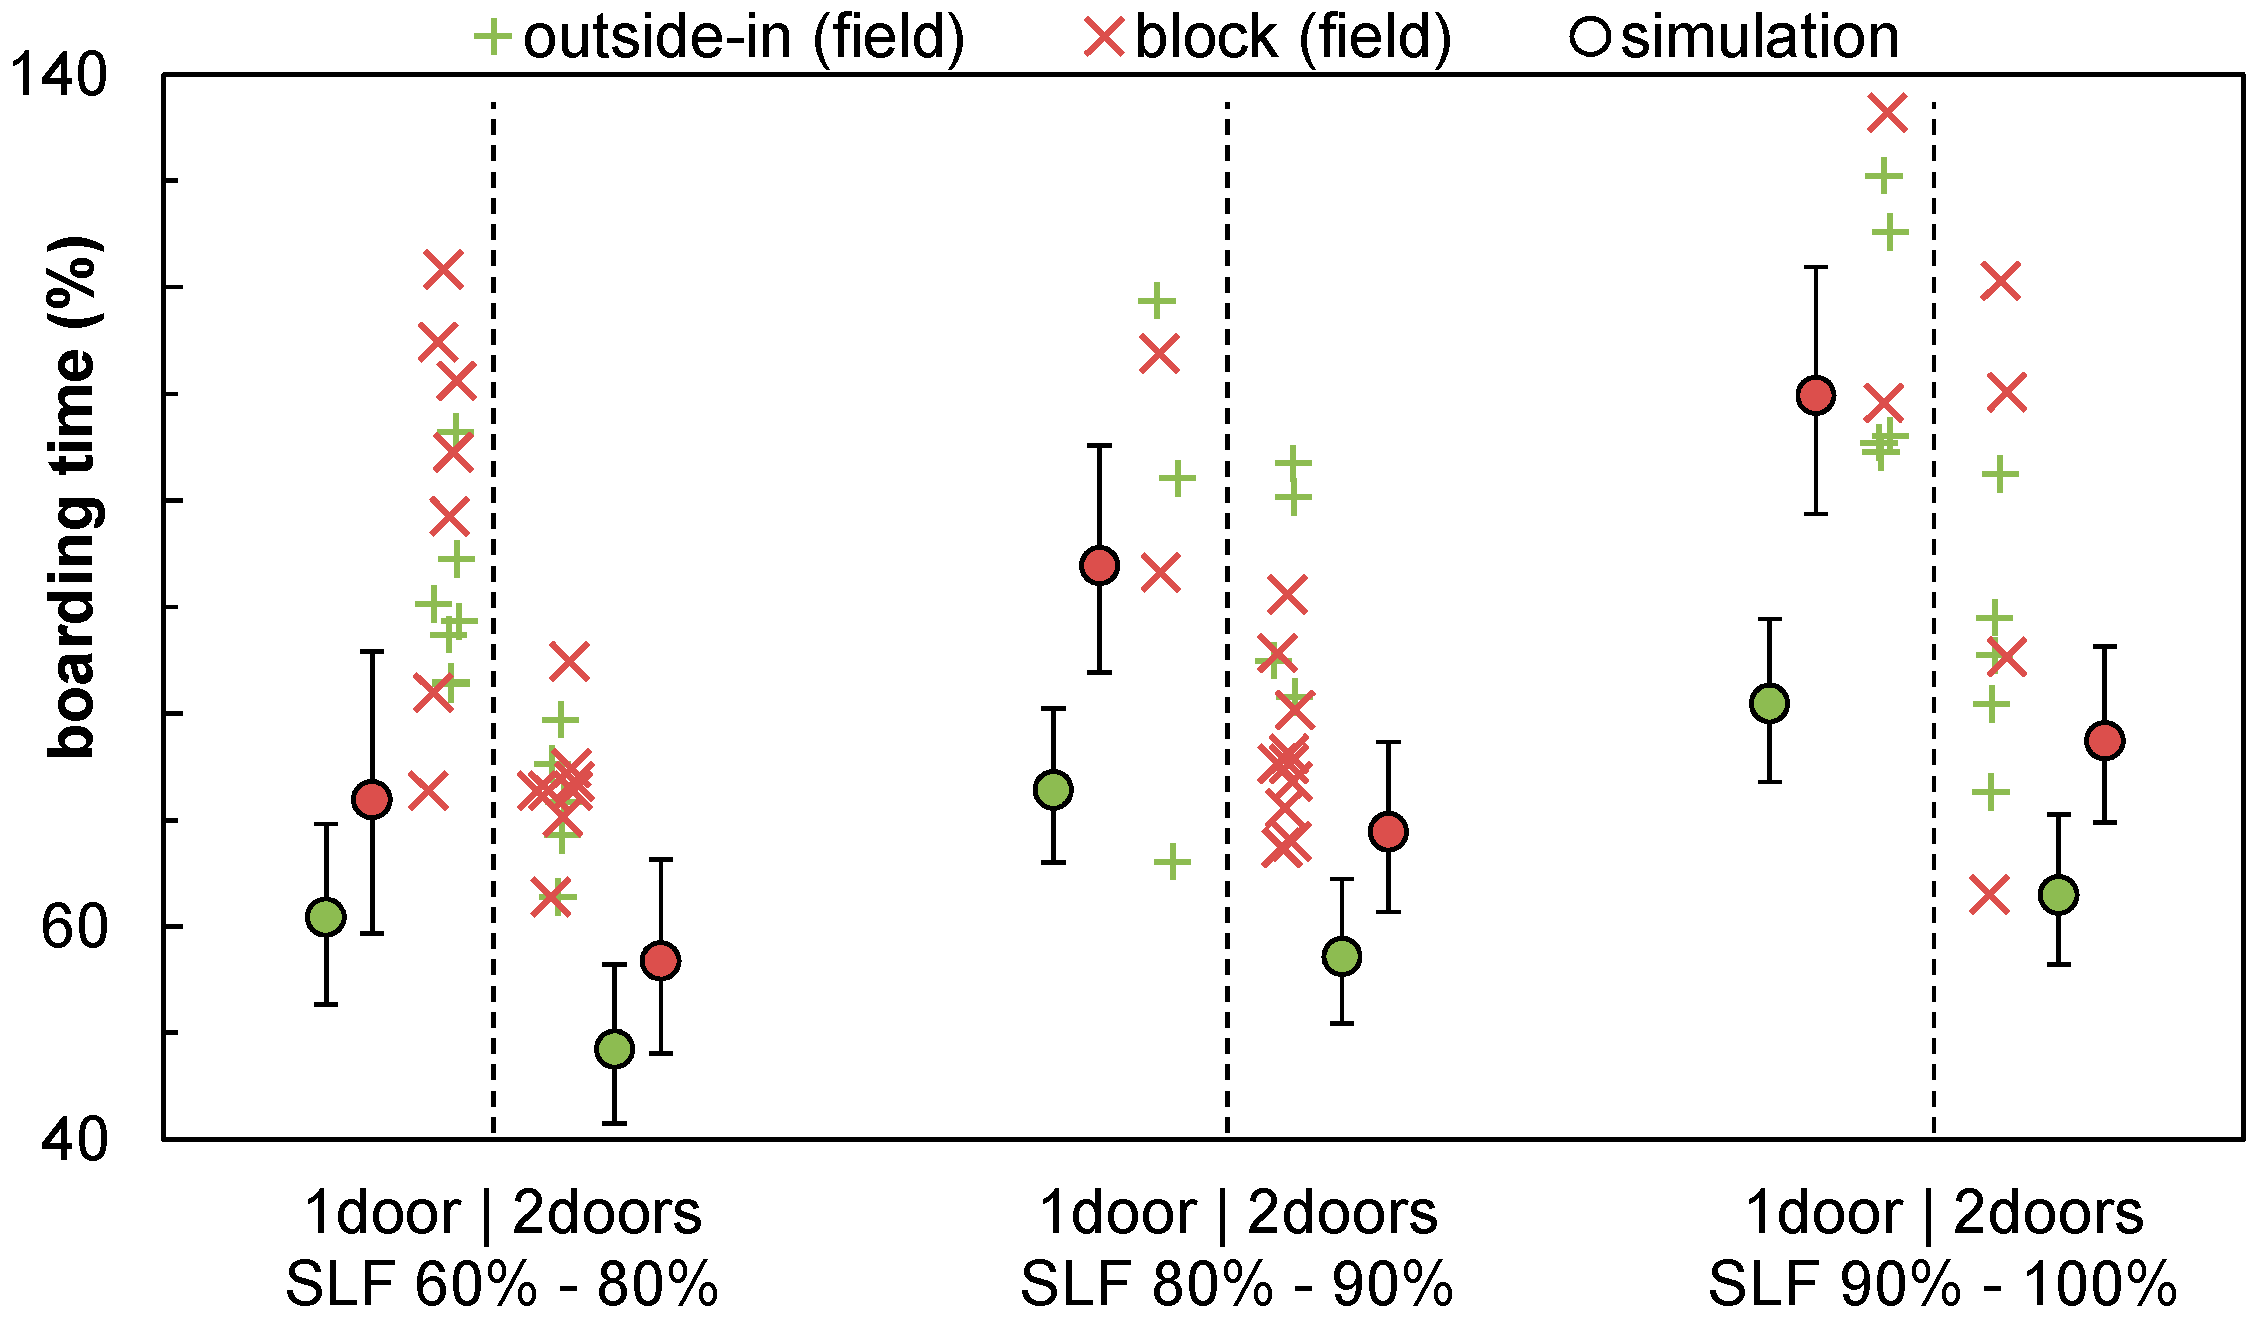
Figure 17.
Combination of boarding strategies block + alternation to support the implementation of the Side-Slip Seat [49,50].


Table 1.
Boarding time using different classifications of linear behavior (slow, medium, fast, and average).
Table 1.
Boarding time using different classifications of linear behavior (slow, medium, fast, and average).
| Boarding Classification | Boarding Time (min) | |||||
|---|---|---|---|---|---|---|
| Boarding Rate rnB (pax/s) | Offset (min) | Passengers | ||||
| 80 | 110 | 140 | 170 | |||
| slow | 1.0 | 12.3 | 13.6 | 14.0 | 14.5 | 15.0 |
| medium | 1.2 | 8.2 | 9.9 | 10.5 | 11.1 | 11.7 |
| fast | 2.2 | 3.5 | 6.4 | 7.5 | 8.6 | 9.7 |
| average—no offset | 5.5 | 0 | 7.3 | 10.1 | 12.8 | 15.6 |
| average—best fit | 4.5 | 2.3 | 8.3 | 10.5 | 12.7 | 15.0 |
Table 2.
Comparison of simulated aircraft boarding strategies using real data for calibration.
| Boarding Scenario | Boarding Strategies | |||
|---|---|---|---|---|
| 1 door/2 doors | random | outside-in | back-to-front | block |
| Boarding time (%) | ||||
| 1 door, non-calibrated | 100 (reference) | 80.9 | 110.5 | 96.2 |
| 1 door, calibrated | 100 (reference) | 79.5 | 109.2 | 95.3 |
| 2 doors, non-calibrated | 74.2 | 63.8 | 75.3 | 76.2 |
| 2 doors, calibrated | 74.1 | 62.5 | 75.0 | 76.2 |
| Standard deviation (%) | ||||
| 1 door, non-calibrated | 7.1 | 5.5 | 7.9 | 6.6 |
| 1 door, calibrated | 7.3 | 5.7 | 8.1 | 6.9 |
| 2 doors, non-calibrated | 4.6 | 2.9 | 4.8 | 5.3 |
| 2 doors, calibrated | 5.9 | 5.5 | 5.9 | 5.8 |
Table 3.
Comparison of boarding progress using data from airline trials.
| Boarding Strategies | Boarding Time (%) | ||||||
|---|---|---|---|---|---|---|---|
| Field Measurements | Simulation Results | Difference | Quantiles | ||||
| Q.10 | Q.25 | Q.75 | Q.90 | ||||
| Seat load factor 90% | |||||||
| random | 101.4 | 100 (reference) | −1.4 | −8.6 | −4.6 | 4.9 | 9.5 |
| Scenario S1 | 93.7 | 104.5 | 10.8 | −9.3 | −5.1 | 5.2 | 10.2 |
| Scenario S2 | 87.0 | 83.8 | −3.2 | −7.4 | −4.0 | 4.4 | 8.4 |
| Scenario S2* | 80.5 | ||||||
| Seat load factor 76% ± 5% | |||||||
| random | 102.6 | 100.0 | −2.6 | −10.6 | −5.7 | 6.2 | 11.8 |
| Scenario S1 | 94.8 | 98.7 | 3.9 | −11.5 | −6.3 | 6.6 | 12.7 |
| Scenario S2 | 88.0 | 83.4 | −4.6 | −8.9 | −4.8 | 5.2 | 10.2 |
| Scenario S2* | 80.8 | ||||||
Table 4.
Flight categorization.
| Seat Load Factor | Transfer Mode | Destination | |||||
|---|---|---|---|---|---|---|---|
| Bus | Gate | Walk | Tourist | EU | Germany | No Tag | |
| 60–80% | 1 | 14 | 13 | 7 | 7 | 12 | 2 |
| 80–90% | 0 | 4 | 16 | 6 | 5 | 6 | 4 |
| 90–100% | 0 | 7 | 10 | 6 | 5 | 5 | 1 |
© 2018 by the author. Licensee MDPI, Basel, Switzerland. This article is an open access article distributed under the terms and conditions of the Creative Commons Attribution (CC BY) license (http://creativecommons.org/licenses/by/4.0/).
Share and Cite
MDPI and ACS Style
Schultz, M. Field Trial Measurements to Validate a Stochastic Aircraft Boarding Model. Aerospace 2018, 5, 27. https://doi.org/10.3390/aerospace5010027
AMA Style
Schultz M. Field Trial Measurements to Validate a Stochastic Aircraft Boarding Model. Aerospace. 2018; 5(1):27. https://doi.org/10.3390/aerospace5010027
Chicago/Turabian StyleSchultz, Michael. 2018. "Field Trial Measurements to Validate a Stochastic Aircraft Boarding Model" Aerospace 5, no. 1: 27. https://doi.org/10.3390/aerospace5010027
Note that from the first issue of 2016, this journal uses article numbers instead of page numbers. See further details here.