
Predictive Modeling of Factors Influencing Adherence to SGLT-2 Inhibitors in Ambulatory Care: Insights from Prescription Claims Data Analysis

Abstract
:1. Introduction
2. Materials and Methods
2.1. Study Design
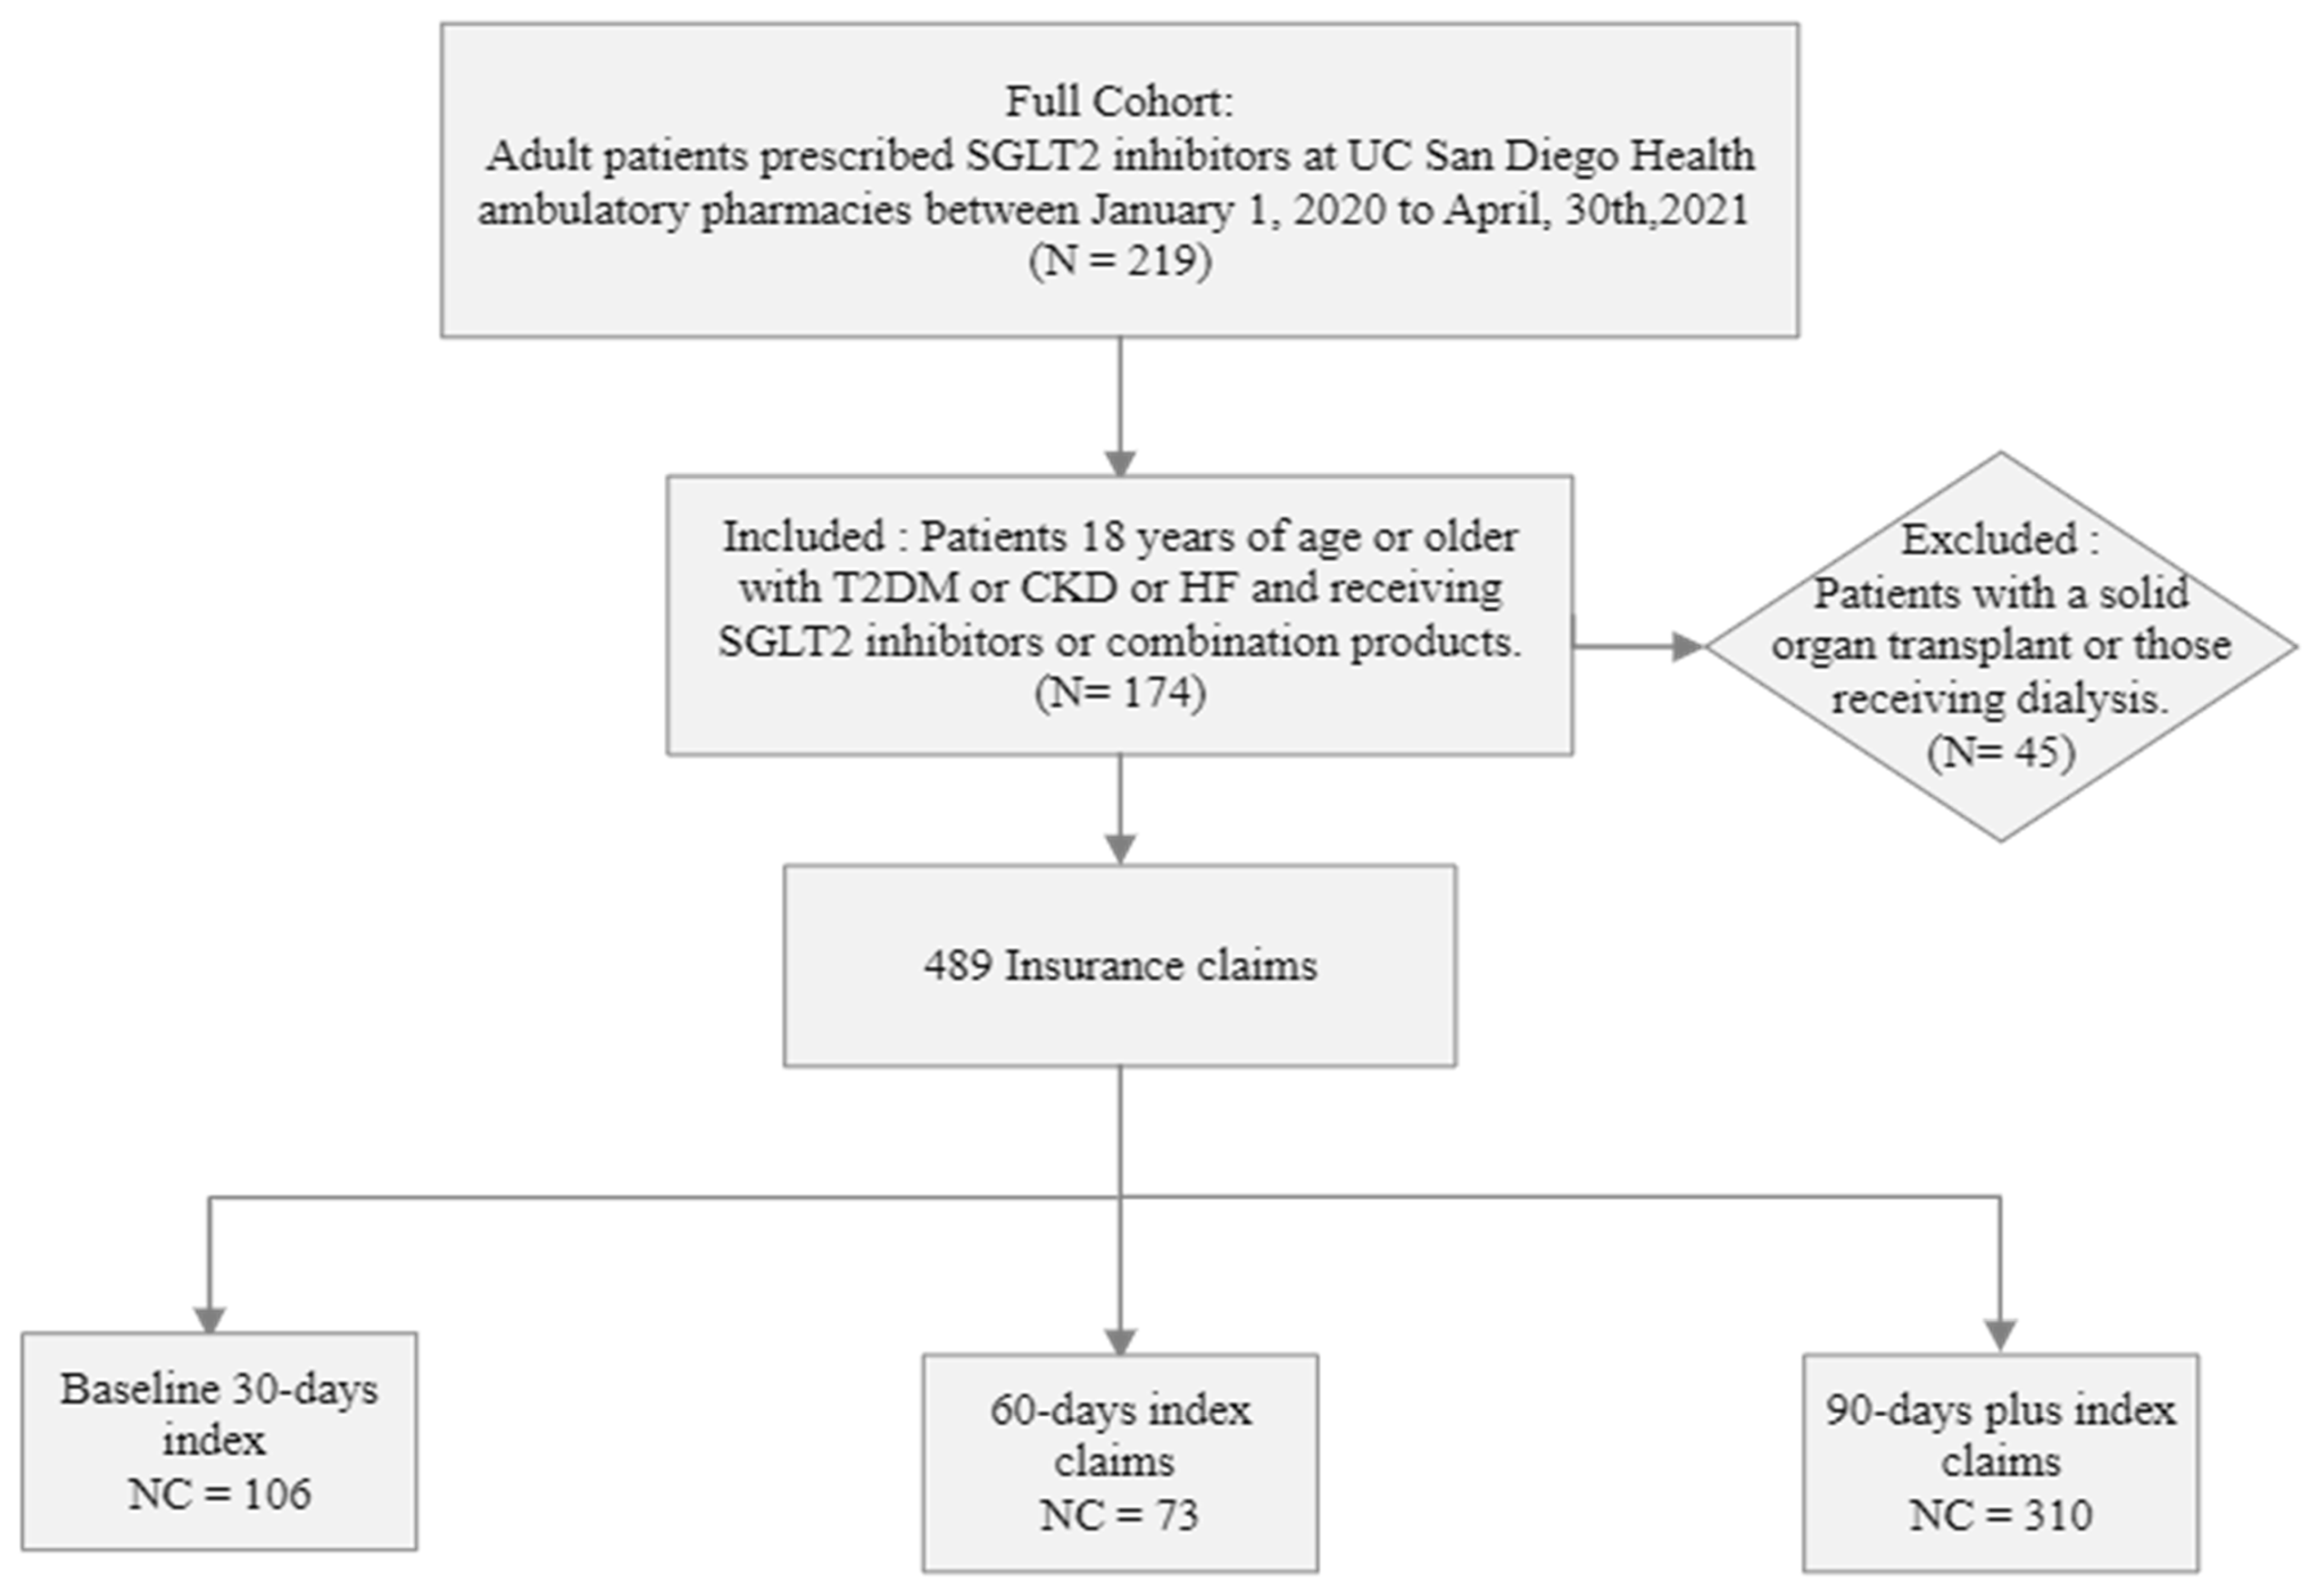
2.2. Participants
2.3. Data Collection and Outcomes
2.3.1. Statistical Analysis
2.3.2. Predictors
2.3.3. Predictive Model
2.3.4. Software
2.3.5. Comparative Analysis
3. Results
3.1. Cohort Characteristics
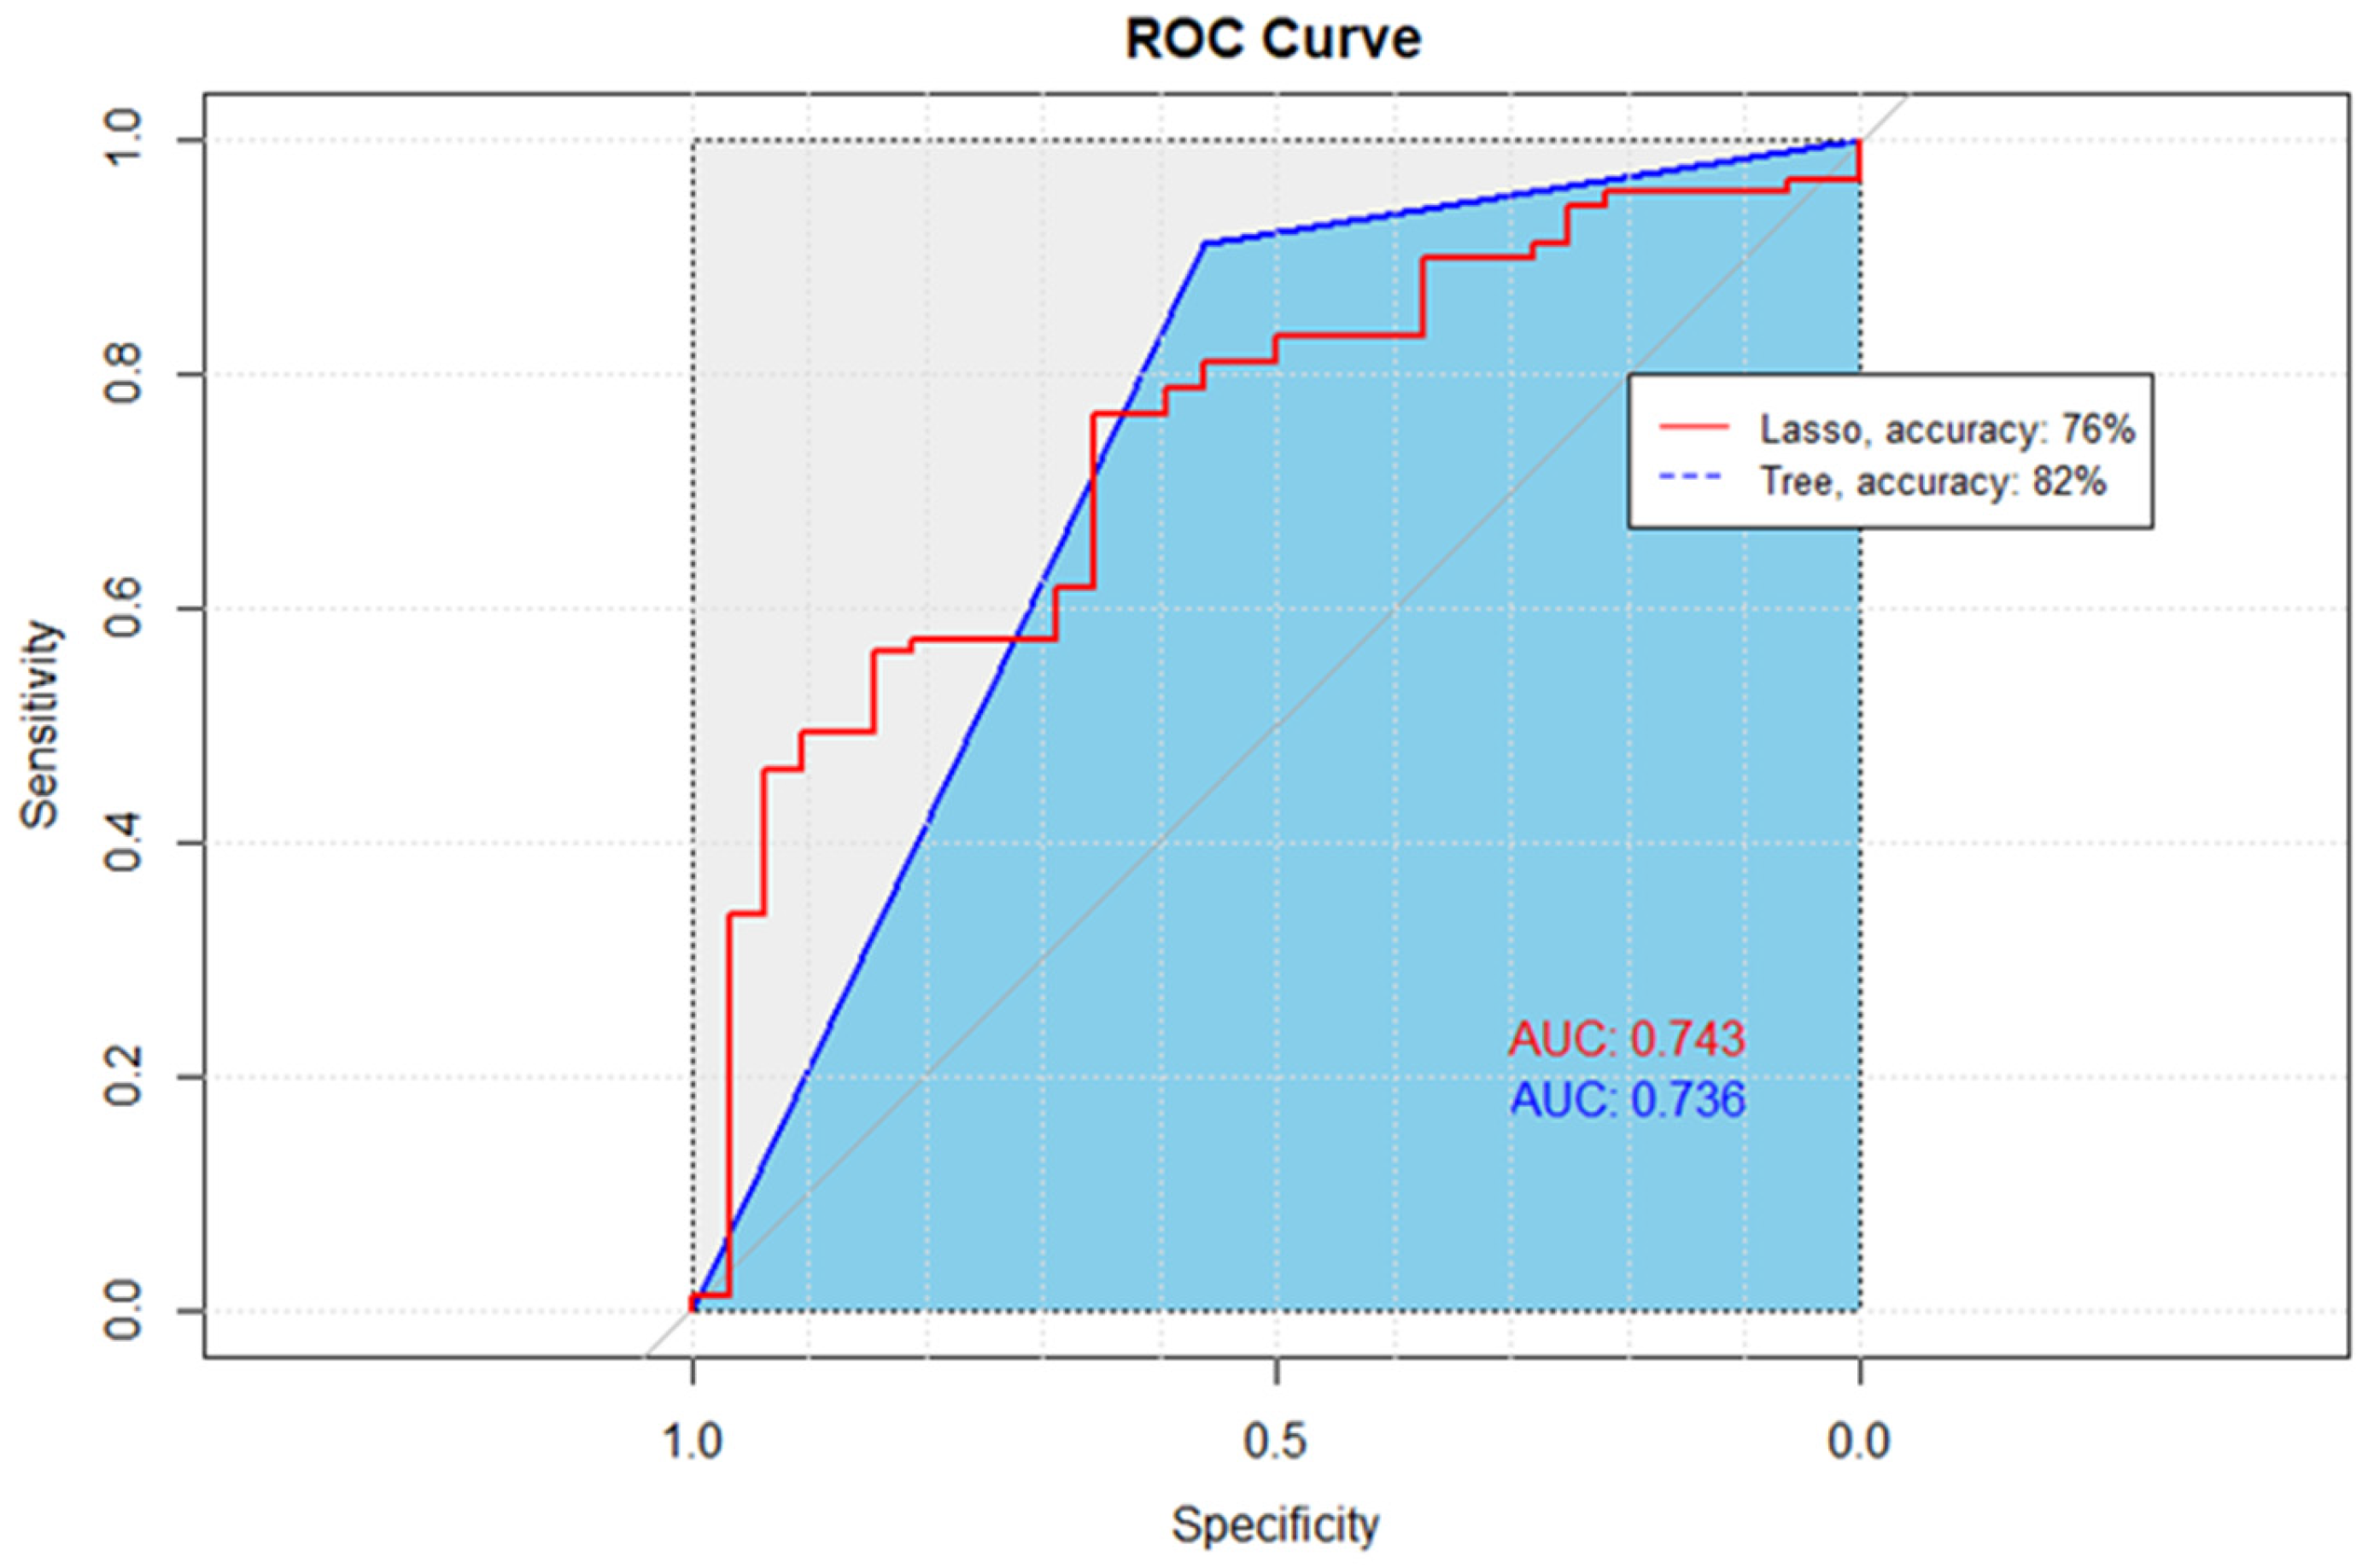
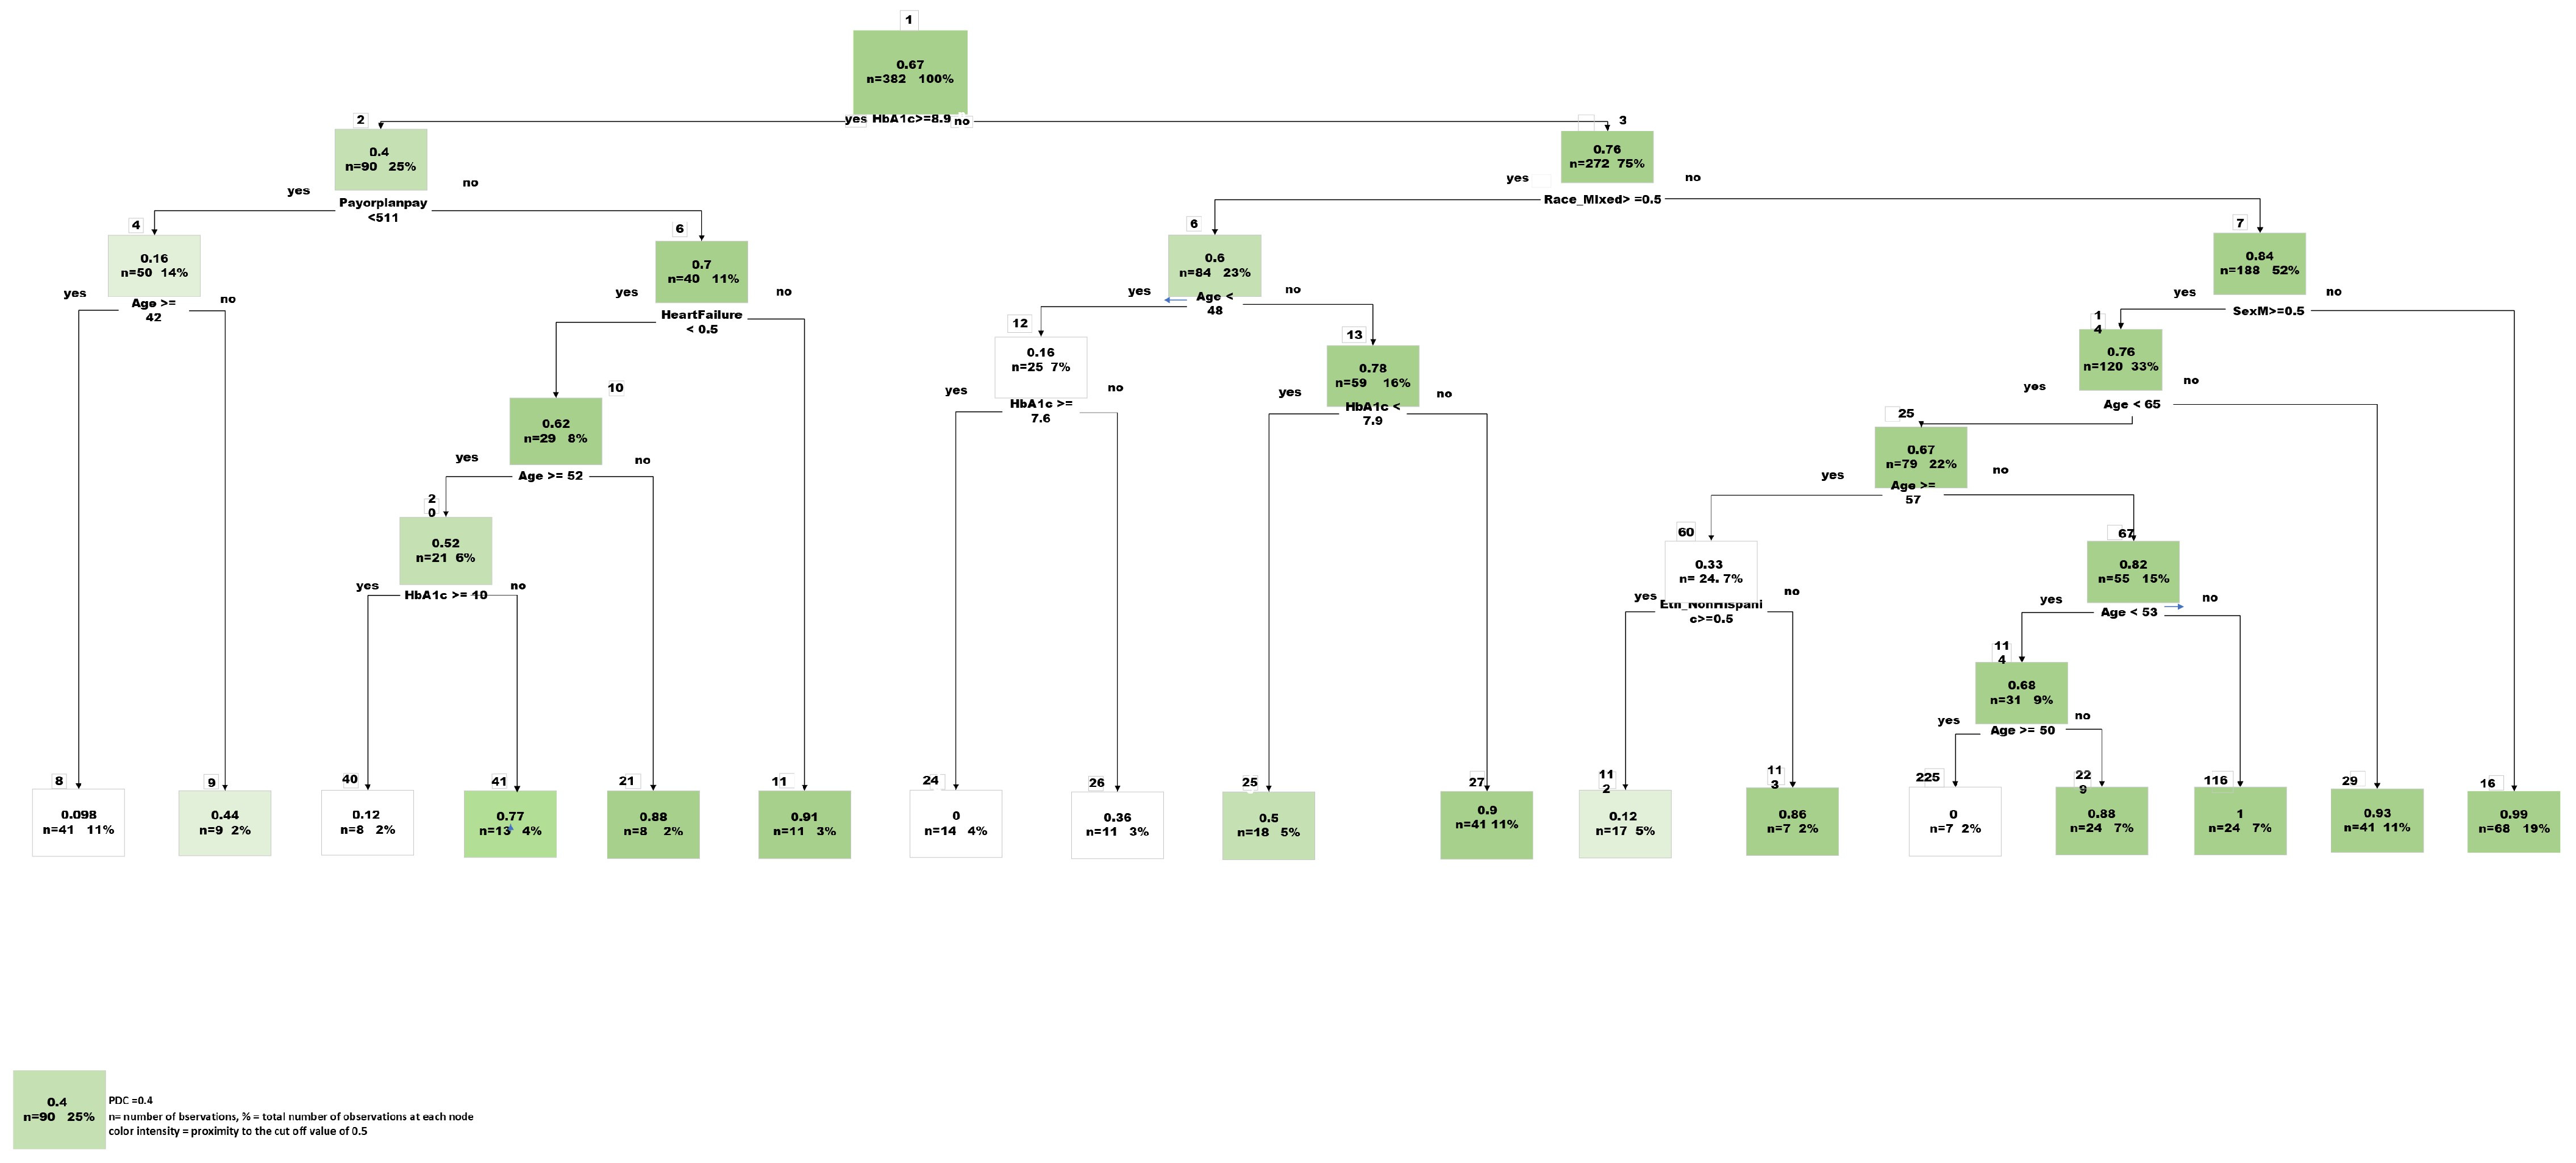
3.2. Predictive Modeling
Feature Selection
4. Discussion
5. Conclusions
Author Contributions
Funding
Institutional Review Board Statement
Informed Consent Statement
Data Availability Statement
Acknowledgments
Conflicts of Interest
Appendix A

| Estimate | Std. Error | t Value | Pr (>|t|) | |
|---|---|---|---|---|
| (Intercept) | 9.04 × 10⁻¹ | 4.06 × 10⁻¹ | 2.228 | 0.026353 |
| Age | 2.73 × 10⁻³ | 2.07 × 10⁻³ | 1.319 | 0.187991 |
| HbA1c | −4.96 × 10⁻² | 1.09 × 10⁻² | −4.548 | 6.97 × 10⁻⁶ |
| PayorPlanPay | 3.04 × 10⁻⁴ | 8.01 × 10⁻⁵ | 3.79 | 0.000171 |
| SexM | −1.04 × 10⁻¹ | 4.73 × 10⁻² | −2.205 | 0.027934 |
| Race_Asian | 2.87 × 10⁻¹ | 3.01 × 10⁻¹ | 0.954 | 0.340608 |
| Race_White | 1.38 × 10⁻¹ | 2.97 × 10⁻¹ | 0.466 | 0.641451 |
| Federal | −3.32 × 10⁻¹ | 2.56 × 10⁻¹ | −1.299 | 0.194441 |
| Race_Mixed | 8.23 × 10⁻² | 3.02 × 10⁻¹ | 0.273 | 0.785327 |
| Commercial | −3.35 × 10⁻¹ | 2.42 × 10⁻¹ | −1.385 | 0.166883 |
| Eth_NonHispanic | 1.08 × 10⁻¹ | 6.96 × 10⁻² | 1.552 | 0.121452 |
| Race_AfricanAmerican | 1.89 × 10⁻¹ | 2.98 × 10⁻¹ | 0.634 | 0.526556 |
| Diabetes | −5.76 × 10⁻² | 6.94 × 10⁻² | −0.831 | 0.4066 |
| Empagliflozin | 8.02 × 10⁻² | 5.85 × 10⁻² | 1.371 | 0.171036 |
| Ertugliflozin | −8.56 × 10⁻¹ | 1.95 × 10⁻¹ | −4.386 | 1.43 × 10⁻⁵ |
| AssistancePay | 2.56 × 10⁻³ | 1.36 × 10⁻³ | 1.877 | 0.061142 |
| PatPay | 1.96 × 10⁻³ | 8.46 × 10⁻⁴ | 2.319 | 0.020844 |
| Assistance_Prog | −4.48 × 10⁻¹ | 2.99 × 10⁻¹ | −1.496 | 0.135427 |
| Empagliflozin/metformin | 9.33 × 10⁻¹ | 2.58 × 10⁻¹ | 3.621 | 0.000326 |
| Canagliflozin | 4.59 × 10⁻¹ | 1.15 × 10⁻¹ | 3.985 | 7.85 × 10⁻⁵ |
| Commercial_Assis | −1.88 × 10⁻¹ | 2.67 × 10⁻¹ | −0.702 | 0.482787 |
References
- Packer, M.; Anker, S.D.; Butler, J.; Filippatos, G.; Ferreira, J.P.; Pocock, S.J.; Carson, P.; Anand, I.; Doehner, W.; Haass, M.; et al. Effect of Empagliflozin on the Clinical Stability of Patients with Heart Failure and a Reduced Ejection Fraction: The EMPEROR-Reduced Trial. Circulation 2021, 143, 326–336. [Google Scholar] [CrossRef] [PubMed]
- ElSayed, N.A.; Aleppo, G.; Aroda, V.R.; Bannuru, R.R.; Brown, F.M.; Bruemmer, D.; Collins, B.S.; Cusi, K.; Das, S.R.; Gibbons, C.H.; et al. Summary of Revisions: Standards of Care in Diabetes—2023. Diabetes Care 2022, 46, S5–S9. [Google Scholar] [CrossRef] [PubMed]
- Talha, K.M.; Anker, S.D.; Butler, J. SGLT-2 Inhibitors in Heart Failure: A Review of Current Evidence. Int. J. Heart Fail. 2023, 5, 82–90. [Google Scholar] [CrossRef] [PubMed]
- Delanaye, P.; Scheen, A.J. [EMPA-KIDNEY: Empagliflozin in chronic kidney disease]. Rev. Med. Liege 2023, 78, 24–28. [Google Scholar] [PubMed]
- Herrington, W.G.; Staplin, N.; Wanner, C.; Green, J.B.; Hauske, S.J.; Emberson, J.R.; Preiss, D.; Judge, P.; Mayne, K.J.; Ng, S.Y.A.; et al. Empagliflozin in Patients with Chronic Kidney Disease. N. Engl. J. Med. 2023, 388, 117–127. [Google Scholar] [CrossRef] [PubMed]
- Sangha, V.; Lipska, K.; Lin, Z.; Inzucchi, S.E.; McGuire, D.K.; Krumholz, H.M.; Khera, R. Patterns of Prescribing Sodium-Glucose Cotransporter-2 Inhibitors for Medicare Beneficiaries in the United States. Circ. Cardiovasc. Qual. Outcomes 2021, 14, e008381. [Google Scholar] [CrossRef] [PubMed]
- Delamater, A.M. Improving Patient Adherence. Clin. Diabetes 2006, 24, 71–77. [Google Scholar] [CrossRef]
- World Health Organization. Adherence to Long-Term Therapies: Evidence for Action; World Health Organization: Geneva, Switzerland, 2003. [Google Scholar]
- Maffoni, M.; Traversoni, S.; Costa, E.; Midão, L.; Kardas, P.; Kurczewska-Michalak, M.; Giardini, A. Medication adherence in the older adults with chronic multimorbidity: A systematic review of qualitative studies on patient’s experience. Eur. Geriatr. Med. 2020, 11, 369–381. [Google Scholar] [CrossRef] [PubMed]
- Al-Noumani, H.; Al-Harrasi, M.; Jose, J.; Al-Naamani, Z.; Panchatcharam, S.M. Medication Adherence and Patients’ Characteristics in Chronic Diseases: A National Multi-Center Study. Clin. Nurs. Res. 2021, 31, 426–434. [Google Scholar] [CrossRef] [PubMed]
- Peh, K.Q.E.; Kwan, Y.H.; Goh, H.; Ramchandani, H.; Phang, J.K.; Lim, Z.Y.; Loh, D.H.F.; Østbye, T.; Blalock, D.V.; Yoon, S.; et al. An Adaptable Framework for Factors Contributing to Medication Adherence: Results from a Systematic Review of 102 Conceptual Frameworks. J. Gen. Intern. Med. 2021, 36, 2784–2795. [Google Scholar] [CrossRef] [PubMed]
- Eaddy, M.T.; Cook, C.L.; O’Day, K.; Burch, S.P.; Cantrell, C.R. How patient cost-sharing trends affect adherence and outcomes: A literature review. Pharm. Ther. 2012, 37, 45–55. [Google Scholar]
- Briesacher, B.A.; Gurwitz, J.H.; Soumerai, S.B. Patients at-risk for cost-related medication nonadherence: A review of the literature. J. Gen. Intern. Med. 2007, 22, 864–871. [Google Scholar] [CrossRef] [PubMed]
- Dusetzina, S.B.; Besaw, R.J.; Whitmore, C.C.; Mattingly, T.J., II; Sinaiko, A.D.; Keating, N.L.; Everson, J. Cost-Related Medication Nonadherence and Desire for Medication Cost Information among Adults Aged 65 Years and Older in the US in 2022. JAMA Netw. Open 2023, 6, e2314211. [Google Scholar] [CrossRef] [PubMed]
- Lim, M.T.; Ab Rahman, N.; Teh, X.R.; Chan, C.L.; Thevendran, S.; Ahmad Hamdi, N.; Lim, K.K.; Sivasampu, S. Optimal cut-off points for adherence measure among patients with type 2 diabetes in primary care clinics: A retrospective analysis. Ther. Adv. Chronic Dis. 2021, 12, 2040622321990264. [Google Scholar] [CrossRef] [PubMed]
- Karve, S.; Cleves, M.A.; Helm, M.; Hudson, T.J.; West, D.S.; Martin, B.C. Good and poor adherence: Optimal cut-point for adherence measures using administrative claims data. Curr. Med. Res. Opin. 2009, 25, 2303–2310. [Google Scholar] [CrossRef] [PubMed]
- Zullig, L.L.; Jazowski, S.A.; Wang, T.Y.; Hellkamp, A.; Wojdyla, D.; Thomas, L.; Egbuonu-Davis, L.; Beal, A.; Bosworth, H.B. Novel application of approaches to predicting medication adherence using medical claims data. Health Serv. Res. 2019, 54, 1255–1262. [Google Scholar] [CrossRef] [PubMed]
- Gu, Y.; Zalkikar, A.; Liu, M.; Kelly, L.; Hall, A.; Daly, K.; Ward, T. Predicting medication adherence using ensemble learning and deep learning models with large scale healthcare data. Sci. Rep. 2021, 11, 18961. [Google Scholar] [CrossRef] [PubMed]
- Wu, X.W.; Yang, H.B.; Yuan, R.; Long, E.W.; Tong, R.S. Predictive models of medication non-adherence risks of patients with T2D based on multiple machine learning algorithms. BMJ Open Diabetes Res. Care 2020, 8, e001055. [Google Scholar] [CrossRef] [PubMed]
- Franklin, J.M.; Krumme, A.A.; Shrank, W.H.; Matlin, O.S.; Brennan, T.A.; Choudhry, N.K. Predicting adherence trajectory using initial patterns of medication filling. Am. J. Manag. Care 2015, 21, e537–e544. [Google Scholar] [PubMed]
- Hung, A.; Blalock, D.V.; Miller, J.; McDermott, J.; Wessler, H.; Oakes, M.M.; Reed, S.D.; Bosworth, H.B.; Zullig, L.L. Impact of financial medication assistance on medication adherence: A systematic review. J. Manag. Care Spec. Pharm. 2021, 27, 924–935. [Google Scholar] [CrossRef] [PubMed]
- Nichols, G.A.; Rosales, A.G.; Kimes, T.M.; Tunceli, K.; Kurtyka, K.; Mavros, P. The Change in HbA1c Associated with Initial Adherence and Subsequent Change in Adherence among Diabetes Patients Newly Initiating Metformin Therapy. J. Diabetes Res. 2016, 2016, 9687815. [Google Scholar] [CrossRef] [PubMed]
- Scarton, L.; Nelson, T.; Yao, Y.; DeVaughan-Circles, A.; Legaspi, A.B.; Donahoo, W.T.; Segal, R.; Goins, R.T.; Manson, S.M.; Wilkie, D.J. Association of Medication Adherence with HbA1c Control among American Indian Adults with Type 2 Diabetes Using Tribal Health Services. Diabetes Care 2023, 46, 1245–1251. [Google Scholar] [CrossRef] [PubMed]
- Santa, C.; Milheiro Tinoco, E.; Barreira, P.; Lima, R. Predictive factors of non-adherence to asthma medication in pregnancy. Eur. Ann. Allergy Clin. Immunol. 2022, 54, 84–89. [Google Scholar] [CrossRef] [PubMed]
- Aziz, H.; Hatah, E.; Bakry, M.M. How payment scheme affects patients’ adherence to medications? A systematic review. Patient Prefer. Adherence 2016, 10, 837–850. [Google Scholar] [CrossRef] [PubMed]
- Fusco, N.; Sils, B.; Graff, J.S.; Kistler, K.; Ruiz, K. Cost-sharing and adherence, clinical outcomes, health care utilization, and costs: A systematic literature review. J. Manag. Care Spec. Pharm. 2023, 29, 4–16. [Google Scholar] [CrossRef] [PubMed]
- Habib, F.; Durrani, A.M. Effect of Age and Socio-Economic Status on Compliance among Type 2 Diabetic Patients. Curr. Res. Diabetes Obes. J. 2018, 7, 62–66. [Google Scholar] [CrossRef]
- Salah, H.M.; Al’Aref, S.J.; Khan, M.S.; Al-Hawwas, M.; Vallurupalli, S.; Mehta, J.L.; Mounsey, J.P.; Greene, S.J.; McGuire, D.K.; Lopes, R.D.; et al. Effects of sodium-glucose cotransporter 1 and 2 inhibitors on cardiovascular and kidney outcomes in type 2 diabetes: A meta-analysis update. Am. Heart J. 2021, 233, 86–91. [Google Scholar] [CrossRef] [PubMed]
- Menne, J.; Dumann, E.; Haller, H.; Schmidt, B.M.W. Acute kidney injury and adverse renal events in patients receiving SGLT2-inhibitors: A systematic review and meta-analysis. PLoS Med. 2019, 16, e1002983. [Google Scholar] [CrossRef]
- Heerspink, H.J.L.; Stefánsson, B.V.; Correa-Rotter, R.; Chertow, G.M.; Greene, T.; Hou, F.-F.; Mann, J.F.E.; McMurray, J.J.V.; Lindberg, M.; Rossing, P.; et al. Dapagliflozin in Patients with Chronic Kidney Disease. N. Engl. J. Med. 2020, 383, 1436–1446. [Google Scholar] [CrossRef] [PubMed]
- Meraz-Muñoz, A.Y.; Weinstein, J.; Wald, R. eGFR Decline after SGLT2 Inhibitor Initiation: The Tortoise and the Hare Reimagined. Kidney360 2021, 2, 1042–1047. [Google Scholar] [CrossRef] [PubMed]
- Pednekar, P.; Heller, D.A.; Peterson, A.M. Association of Medication Adherence with Hospital Utilization and Costs among Elderly with Diabetes Enrolled in a State Pharmaceutical Assistance Program. J. Manag. Care Spec. Pharm. 2020, 26, 1099–1108. [Google Scholar] [CrossRef] [PubMed]
- Kim, Y.-Y.; Lee, J.-S.; Kang, H.-J.; Park, S.M. Effect of medication adherence on long-term all-cause-mortality and hospitalization for cardiovascular disease in 65,067 newly diagnosed type 2 diabetes patients. Sci. Rep. 2018, 8, 12190. [Google Scholar] [CrossRef] [PubMed]
| Variable | Total Cohort (n = 174) | PDC ≥ 0.8 (n = 88) | PDC < 0.8 (n = 86) | p-Value |
|---|---|---|---|---|
| Age, median (IQR) | 58 (51–66) | 59 (48–68) | 58 (52–65) | 0.78 |
| Sex, n (%) | ||||
| Female | 39 (22.4%) | 24 (27.3%) | 15 (17.4%) | 0.12 |
| Male | 135 (77.6%) | 64 (72.7%) | 71 (82.6%) | |
| Ethnicity, n (%) | ||||
| Hispanic | 55 (31.6%) | 24 (27%) | 31 (36%) | 0.21 |
| Non-Hispanic | 119 (68.3%) | 64 (73%) | 55 (64%) | |
| Race, n (%) | ||||
| White | 74 (42.5%) | 42 (47.7%) | 32 (37.2%) | 0.099 |
| African American | 20 (11.5%) | 13 (14.7%) | 7 (8.1%) | |
| American Indian | 2 (1.1%) | 0 (0%) | 2 (2.3%) | |
| Asian | 13 (7.5%) | 4 (4.5%) | 9 (10.5%) | |
| Mixed | 65 (37.4%) | 29 (32.9%) | 36 (41.8%) | |
| Prescribing Indication, n (%) | ||||
| Diabetes Mellitus | 151 (86.8%) | 69 (78.4%) | 82 (95.3%) | 0.12 |
| Heart Failure | 66 (37.9%) | 40 (4.5%) | 26 (30.2%) | |
| Kidney Disease | 21 (12.1%) | 10 (11.4%) | 11 (12.5%) | |
| Baseline HbA1c (SD) | 8.04 (2.39) | 7.1 (1.5) | 8.98 (2.3) | <0.001 |
| Baseline eGFR (SD) | 53.6 (7.4) | 50.3 (11.1) | 57 (6.4) | <0.001 |
| Medication/Insurance Plan Type | Total Claims (n = 489) | PDC ≥ 0.8 (n = 338) | PDC < 0.8 (n = 151) | p Value |
|---|---|---|---|---|
| Dapagliflozin, n (%) | 107 (21.9%) | 82 (24%) | 25 (17%) | <0.0001 |
| Canagliflozin, n (%) | 22 (4.5%) | 22 (7%) | 0 (0%) | |
| Empagliflozin, n (%) | 349 (71.3%) | 229 (68%) | 120 (79%) | |
| Empagliflozin/metformin, n (%) | 5 (1%) | 5 (1%) | 0 (0%) | |
| Ertugliflozin, n (%) | 6 (1.2%) | 0 (0%) | 6 (4%) | |
| Insurance Plan Type, n (%) | ||||
| Commercial, n (%) | 428 (87.5%) | 303 (90%) | 125 (83%) | <0.001 |
| Commercial with Assistance, n (%) | 20 (4.1%) | 16 (5%) | 4 (3%) | |
| Federally Funded, n (%) | 32 (6.5%) | 14 (4%) | 18 (12%) | |
| Federally Funded with Assistance, n (%) | 3 (0.6%) | 3 (1%) | 0 (0%) | |
| Assistance Program, n (%) | 6 (1.2%) | 2 (1%) | 4 (3%) | |
| Patient Copay, mean (SD) | $9.76 (26.17) | $12.27 ($30.31) | $4.15 ($10.81) | <0.001 |
| Payor Plan Pay, mean (SD) | $509.22 (282.45) | $547.3 ($305.38) | $423.99 ($197.99) | <0.001 |
| Assistance Pay, mean (SD) | $3.92 (16.45) | $4.97 ($18.18) | $1.6 ($11.34) | 0.255 |
| Predictive Model | Accuracy | Sensitivity | Specificity | AUC |
|---|---|---|---|---|
| Lasso | 76% | 94% | 25% | 74% |
| CART | 82% | 85% | 69% | 74% |
Disclaimer/Publisher’s Note: The statements, opinions and data contained in all publications are solely those of the individual author(s) and contributor(s) and not of MDPI and/or the editor(s). MDPI and/or the editor(s) disclaim responsibility for any injury to people or property resulting from any ideas, methods, instructions or products referred to in the content. |
© 2024 by the authors. Licensee MDPI, Basel, Switzerland. This article is an open access article distributed under the terms and conditions of the Creative Commons Attribution (CC BY) license (https://creativecommons.org/licenses/by/4.0/).
Share and Cite
Khartabil, N.; Morello, C.M.; Macedo, E. Predictive Modeling of Factors Influencing Adherence to SGLT-2 Inhibitors in Ambulatory Care: Insights from Prescription Claims Data Analysis. Pharmacy 2024, 12, 72. https://doi.org/10.3390/pharmacy12020072
Khartabil N, Morello CM, Macedo E. Predictive Modeling of Factors Influencing Adherence to SGLT-2 Inhibitors in Ambulatory Care: Insights from Prescription Claims Data Analysis. Pharmacy. 2024; 12(2):72. https://doi.org/10.3390/pharmacy12020072
Chicago/Turabian StyleKhartabil, Nadia, Candis M. Morello, and Etienne Macedo. 2024. "Predictive Modeling of Factors Influencing Adherence to SGLT-2 Inhibitors in Ambulatory Care: Insights from Prescription Claims Data Analysis" Pharmacy 12, no. 2: 72. https://doi.org/10.3390/pharmacy12020072