
Intraday Patterns of Liquidity on the Warsaw Stock Exchange before and after the Outbreak of the COVID-19 Pandemic


1
Department of Economic and Financial Analysis, University of Economics in Katowice, 1 Maja Street 50, 40-287 Katowice, Poland
2
Department of Banking and Financial Markets, University of Economics in Katowice, 1 Maja Street 50, 40-287 Katowice, Poland
*
Author to whom correspondence should be addressed.
Int. J. Financial Stud. 2022, 10(1), 13; https://doi.org/10.3390/ijfs10010013
Submission received: 27 December 2021
/
Revised: 10 February 2022
/
Accepted: 10 February 2022
/
Published: 16 February 2022
(This article belongs to the Special Issue Explaining Volatility Patterns and Speculation Incentives in Sophisticated Investments by Behavioural Finance)
Abstract
:A highly significant feature of the stock market is its efficiency, which is associated with information efficiency. However, the liquidity of stock on the market is its essential characteristic. The inflow of information in highly liquid markets allows for the maintenance of high information efficiency. The COVID-19 pandemic affected many aspects related to stock markets, including their liquidity. The impact of the pandemic is so multidimensional that there are still areas that need to be investigated. One of them is the intraday liquidity patterns on the stock markets. Therefore, the present paper aims to verify the existence of intraday liquidity patterns on the Warsaw Stock Exchange in three periods: before, during and after the panic caused by the first wave of the COVID-19 pandemic. The results confirmed the existence of a U-shaped intraday distribution of the number of transactions and their trading. This outcome highlights the importance of the first and last minutes of a trading session. The COVID-19 pandemic resulted in the domination of WSE transactions of small individual investors who feared the loss of value of their assets, selling them on the stock exchange. In the pandemic, the average percentage change between transactions increased.
1. Introduction
Liquidity is one of the fundamental characteristics, which can describe a stock market. This notion is vastly discussed in the scientific literature, especially in terms of liquidity measurements (Chang et al. 2018; Xu et al. 2022), liquidity patterns (Angerer et al. 2018; Weigerding and Hanke 2018) or information efficiency determined by market liquidity (Miloș et al. 2021). In the simplest terms, liquidity is understood as the time needed to exchange an asset for money (Ranaldo 2001). The provision of liquidity through the viability of an order-driven market lies in the profitability of liquidity trading (Biais et al. 1995; Ranaldo 2001). The advancement of information technology allowed for real-time transactions and thus ensured greater liquidity. Consequently, it increased the market efficiency as investors were able to monitor stock prices on an ongoing basis, as well as make decisions as soon as they obtained new information (Amihud and Mendelson 1987).
The digitization of trading in securities has increased the availability of data, and thus made it possible to detect certain relationships more accurately when trading (Jin et al. 2019). One of the most important market features is the analysis of trading time in intraday financial studies (Ranaldo 2001). The availability of intraday data allows for the exploration of the market microstructure (Kholisoh and Hermawati 2011). Anghel et al. (2020) emphasized the value of studies concerning the understanding of intraday patterns in the developing markets. The Warsaw Stock Exchange (WSE) represents a stock market that is developing in terms of its participants, volume and available financial instruments (Włosik 2017; Kubiczek 2020). Furthermore, WSE is the biggest and one of the most emerging stock markets in Central and Eastern Europe (Glavina 2015; Będowska-Sójka and Kilber 2019; Tuszkiewicz 2022). It is also a stock market of particular importance in the region (Buszko et al. 2021). However, there is no study to date that would examine the issue of intraday patterns on the WSE and include potential COVID-19 impact (for another study concerning intraday patterns on WSE see Będowska-Sójka 2013). This article partially fills this research gap by investigating intraday patterns in transactions in terms of their number, value (turnover) and time difference, as well as the price changes between transactions during the session on the main market of the WSE. Moreover, this study is of distinct value, due to an indication of the intraday pattern formation during the beginning of the COVID-19 pandemic. Moreover, the situation that occurred in the WSE during the first phase of the pandemic was of particular interest, because of the emergence of a vast number of companies from the gaming sector (Tuszkiewicz 2022). Those enterprises, which were indexed on the WSE, recorded remarkable profits, which translated as a significant impact on the whole market (Kubiczek and Derej 2021).
The paper aims to verify the existence of intraday liquidity patterns on the Warsaw Stock Exchange. Hence, the following research questions were raised: did the intraday liquidity patterns show a pattern of distribution? If so, how was the distribution formed? What could be the reason for this? How did the pandemic outbreak impact the intraday patterns?
The structure of this paper is as follows. Section 2 presents the literature review on the multidimensional aspects of the stock markets’ liquidity, with particular emphasis on the intraday patterns and impact of COVID-19. In this section, the characteristics of the Warsaw Stock Exchange is also presented. Section 3 includes a description of the methodology used in the research, i.e., the justification for the selection of the analysis period, measures and statistical tests used. Section 4 introduces the research results. The article ends with the Discussion and Conclusion, which are developed in Section 5 and Section 6, respectively.
2. Literature Review
2.1. Stock Markets and Liquidity
In developed capitalist economies, the stock exchange is a key element of the financial market because it fulfills its main functions—it ensures mobilization, transformation and capital valuation (Levine and Zervos 1996; El Wassal 2013). By providing a mechanism, the stock exchange enables the transformation of savings into a financial source for the real sector. Furthermore, enabling the effective transformation of capital encourages investment and thereby mobilizes entities to invest capital (El Wassal 2013). A wide range of investment opportunities allows investors to find a financial instrument that meets their expectations and preferences.
It should be noted that the price formation and the development of the stock market are determined by the dynamics of economic activity. At the same time, the situation on the stock market can influence or be an indicator of social mood. According to Nofsinger (2005), the emotions of financial decision-makers reflect the general level of optimism/pessimism in society. The emotions between market participants are related (Nofsinger 2005). Therefore, it causes moods to be influenced by the decisions of all market actors, especially investors, positive mood-drive investments and thus an increase in economic activity.
The stock market is inextricably linked with economic development. The influence of the stock market on economic development takes place through many channels (Garcia and Liu 1999; El Wassal 2013). Understanding the strength of the impact of individual determinants of the development of both stock markets and economic markets has been one of the broader subjects of research over the past decades. Levine and Zervos (1996), using cross-country growth regressions, showed that the long-run economic growth is positively and robustly connected with the predefined component of stock market development. Studies by Caporale et al. (2004) indicate that the stock market supports economic development in the long term, strengthening economic power and transaction efficiency.
The development of the stock market is influenced by many determinants. According to the research by Garcia and Liu (1999), the most important ones are real income, saving rate, financial intermediary development and stock market. According to Levine (1991), liquidity in the stock market—the ability to trade shares quickly—is essential for its development. A large number of economic entities significantly supports the liquidity of the stock exchange, but it is the number of transactions that determines it. The foundation of a well-functioning market is liquidity, which encourages more investors (Singh 2011). Stock market liquidity enables the shares to be sold without affecting their price (Hanselaar et al. 2019).
As a result of the numerous advantages that liquid markets provide, they are generally regarded as desirable, and thus they continue to develop. Sarr and Lybek (2002) showed that liquid markets:
- Allow a central bank to deploy indirect monetary instruments, resulting in a more stable monetary transmission mechanism;
- Enable financial institutions to accept larger asset-liability mismatches, both in terms of maturity and currency, leading to more efficient crisis management by individual institutions;
- Help financial assets become more appealing to investors by making it easier for them to trade.
Liquidity is one of the key aspects of a stock market; it ensures its development (Naes et al. 2011) and efficiency (Fama 1965). The stock exchange’s advanced technology infrastructure allows for the rapid, efficient and prompt fulfillment of buy and sell transactions; transactional efficiency determines information efficiency. It also immediately presents feedback on the status of a transaction’s completion (Czerwonka and Gorlewski 2012, pp. 135–36). The efficiency of the stock market is considered to be its most important feature. It is also equated with efficiency as the whole concept of market optimality. The market, according to Fama (1970), must meet the following assumptions in order to be efficient:
- Investors are rational and wealth-maximizing.
- No buyer or seller can affect the price themselves.
- All information is available to all investors and there are no transaction costs.
Some claim that it is the foundation (Ramos and Righi 2020) and the blood circulatory system of the financial markets (Kumar and Misra 2015). However, it should be noted that each segment of the stock market has a different liquidity that changes over time (Sadka and Schrebina 2007). Therefore, the research on market liquidity may cover the entire stock exchange or its individual segments.
2.2. Intraday Patterns of Liquidity on the Stock Markets
In classical terms, liquidity is considered as the sum of three components: tightness, depth and resiliency (Kyle 1985; Bernstein 1987). Ranaldo (2001) adds trading time to this triad. There are, alas, no universal measures of market liquidity and, for years, there have been debate concerning this matter (Emery and Cogger 1982; Ranaldo 2001; Goyenko et al. 2009; Ramos and Righi 2020).
One of the suggested measures is a trading volume (Admati and Pfleiderer 1988). Ranaldo (2001) examined liquidity in terms of market depth (using the order ratio), the trading volume, the flow ratio, tightness (through the actual spread size) and trading time (via the waiting time between subsequent trades). The development of research on the topic of liquidity resulted in the definition of new measures. It should be emphasized that although more than 100 measures of liquidity have been created, those defined by Admati and Pfleiderer (1988) and Ranaldo (2001) are considered to be the best when it comes to describing the actual behavior of the market. In investment practice, the analysis of stock exchange trading, the frequency of transactions and the market depth are most often used.
Considering the aims of this study, an important observation should be stressed: when the liquidity of assets turns out to be lower than expected, their price should decline (Amihud et al. 1990). This relationship is a consequence of the situation where investors are willing to lower the price of an asset in order to sell it quickly. It should be noted that lower liquidity causes a permanent drop in a company’s valuation (Amihud et al. 1990). The decrease in liquidity during the financial crisis in 2008–2009 resulted in a decrease in the prices of securities (Dang and Nguyen 2020). In turn, the analysis of intraday patterns of liquidity allows for he selection of the appropriate moment of a transaction, so that the time related to liquidity is as minimal as possible. Consequently, it is critical for investors to understand the liquidity patterns of an asset during each part of a session.
Most financial markets are closed overnight, causing high liquidity on the stock market at the opening (Miwa 2019). A large number of orders at the beginning of a session translates into high liquidity, because investors’ abilities to execute the order increases (Kholisoh and Hermawati 2011). Therefore, opening returns have greater dispersion and deviations from normality, and a more negative and significant autocorrelation pattern than closing returns (Amihud and Mendelson 1987). Bildik (2001) explained that higher mean returns and standard deviations at the openings of the trading sessions seem to be generated by the information accumulated overnight and the closed-market effect of trade. Large day-end returns are strongly affected by the activities of fund managers and speculators for the window-dressing, around the time of the closing of the market.
Kumar and Misra (2015, p. 35) emphasized that “commonality and intraday behavior of liquidity in various markets is discussed under the umbrella of market microstructures”. The intraday pattern includes the bid-ask spreads, return volatility and trading volume, resulting primarily from the asymmetry of information between informed and uninformed investors (Chelley-Steeley and Park 2011). It should be noted that both the market liquidity and its patterns may change over time (Malik and Ng 2014). A greater interconnection of markets with each other, along with the possibility of parallel trade on them, makes the liquidity of one market closely correlate with the other (Klein and Song 2021). A broader discussion of the intraday patterns can be found in many studies (Bildik 2001; Chelley-Steeley and Park 2011; Krishnan and Mishra 2013; Kumar and Misra 2015).
2.3. The COVID-19 Impact on the Stock Markets
The impact of the COVID-19 pandemic on the stock markets is widely discussed in the literature. First of all, it should be noted that the COVID-19 pandemic is regarded as one of the most devastating global events since the Great Depression and the 2008 global financial crisis (GFC) (Arif et al. 2021). The internationalization of markets facilitates the shocks to spread to other markets. Contessi and De Pace (2021) showed that the shock caused by the outbreak of the COVID-19 pandemic in the Chinese stock market transmitted to other markets.
The outbreak of the pandemic was random and unexpected and translated into the emotional behavior of investors, which then resulted in drastic fluctuations in the stock prices on the stock markets around the world (Zhang et al. 2020). Nonetheless, stock markets did not react in the same way in every country (Ashraf 2021). The greatest impact of the COVID-19 pandemic on stock markets was observed in Asia, and the least in European emerging markets (Topcu and Gulal 2020).
Furthermore, not all stock groups reacted equally. Research by Mazur et al. (2021) showed that natural gas, food, healthcare and software stocks had high positive returns, while petroleum, real estate, entertainment and hospitality stocks decreased significantly (Mazur et al. 2021). However, the most unexpected movement in stock prices was observed on 20 April 2020, when WTI crude oil futures suddenly dropped to an unprecedented low of USD −37.63 per barrel, shocking both the traders and policymakers (Arif et al. 2021).
Research on the impact of COVID-19 on stock markets also applies to other segments of financial market segments, such as the bond markets (Haddad et al. 2020) or cryptocurrencies (Salisu and Ogbonna 2021). Others focus on studying the impact of the pandemic on financial market returns (Baker et al. 2020) or the impact of the pandemic on financial market volatility (Lyócsa et al. 2020; Bai et al. 2021). The studies related to financial contagions between markets in times of the coronavirus pandemic (Akhtaruzzaman et al. 2021a, 2021b) should also be mentioned.
Particular attention should be paid to the study by Al-Awadhi et al. (2020), who showed that the daily growth in the total confirmed cases and total deaths caused by COVID-19 had significant negative effects on stock returns. One of the reasons for this relationship may be the method of reporting COVID-19 daily cases and presenting them to society. According to Kubiczek and Hadasik (2021), the results of COVID-19 incidence rates had a large impact, which affected social behavior, and thus influenced the behavior of investors on the stock market.
2.4. Warsaw Stock Exchange
The Warsaw Stock Exchange (WSE) is the only Polish stock exchange. Its purpose is to ensure the possibility of exchange, trading in securities and financial instruments that are not securities admitted to exchange trading. The Warsaw Stock Exchange is the main element of the secondary market and, in addition to the main market, it runs the NewConnect small companies market, the Catalyst bond market and the POEE energy market. The most important stock exchange indices of the main market are WIG, WIG20, MWIG40 and SWIG80. WSE is the largest exchange of financial instruments in the region of Central and Eastern Europe. In 2020, 433 equities (384 domestic and 49 foreign) were listed on the WSE with a total capitalization of EUR 236,050.99 million.
The Warsaw Stock Exchange operates within a strictly defined time frame. The standard trading session lasts from 9:00 a.m. to 4:50 p.m., and the sessions are held only on business days. Apart from Saturdays and Sundays, there are no trading sessions on the WSE on public holidays. The breakdown of hours in the individual session phases on the WSE is as follows:
- 08:30–09:00—opening call;
- 09:00—opening;
- 09:00–16:50—trading session;
- 16:50–17:00—closing call;
- 17:00—closing;
- 17:00–17:05—trading at last.
Half an hour before the official opening of a session (8:30), one is able to place orders, but no transactions are concluded during this time. At the end of a session, the closing call phase (16: 50–17:00) takes place. Similar to before the session, the orders are accepted in this phase, but no transactions are concluded. Finally, there is a five-minute overtime (until 17:05), during which one can only place orders with a limit equal to the closing price.
As for the Warsaw Stock Exchange, Będowska-Sójka (2018) proved that the introduction of the UTP system in WSE in 2013 increased the liquidity of this market and caused a decrease in the transaction cost. The WSE can be considered as information efficient because the changes in market liquidity and prices are related to the changes in the actual economic situation (Stereńczak 2018). The research of Kszczotek et al. (2021) showed that the WSE is, from time to time, ineffective, and these periods last for up to two years and occur throughout nearly 40% of the analyzed time period.
3. Methodology
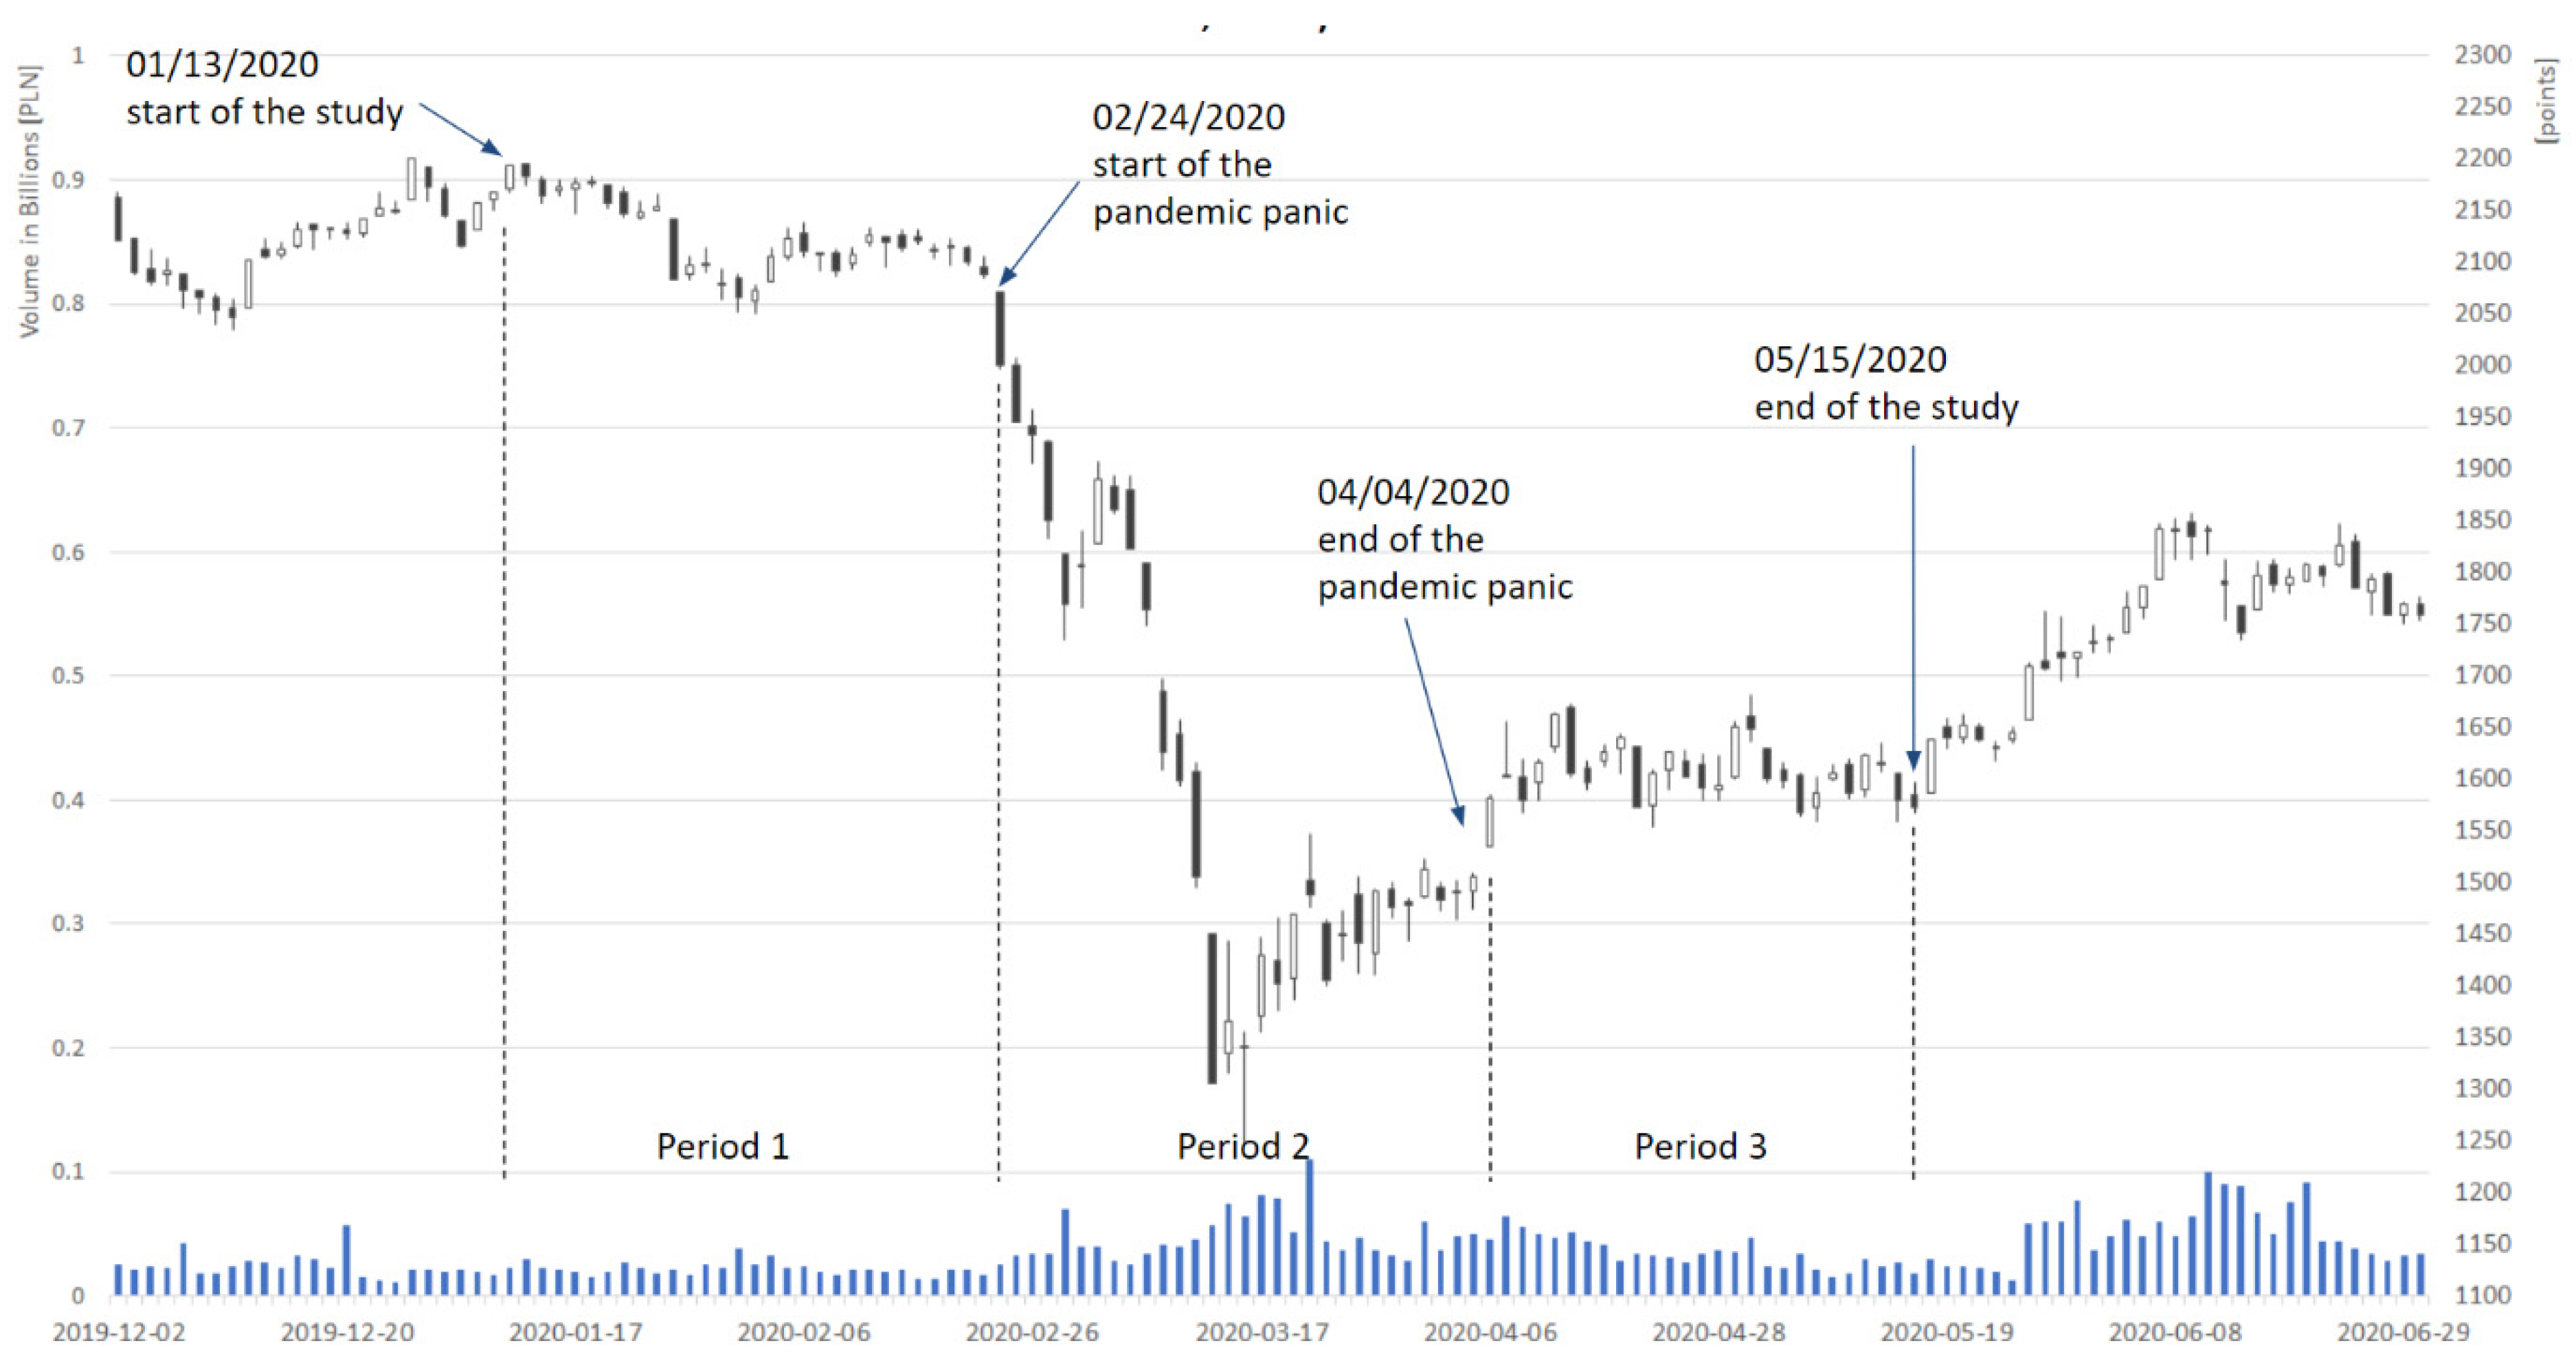
The analysis covers the period from 13 January 2020 to 15 May 2020. The choice of such an analysis period is due to the fact that although the first case of the coronavirus was recorded in China at the end of 2019, the outbreak of COVID-19 was still not acknowledged as a pandemic by the World Health Organization (2020) on 11 March 2020. Furthermore, these dates indicate the timeframes for the downturn caused by the COVID-19 pandemic in Poland (Figure 1). On 24 February 2020, the decline in the WIG20 index amounted to 4.2%, which was 5.9 times the change from the average of the 250 sessions preceding that day. A strong downward trend started. It lasted until the session on 6 April 2020, when the WIG20 index increased by 4.9%, compared to the previous day, breaking the previous local maximum. Thus, the period of increased volatility and declines lasted for 6 weeks (see Figure 1).
While the World Health Organization announced the COVID-19 pandemic on 11 March 2020, it is noted that investors began reacting fairly earlier, so the bear market was taken as a reference point. In order to maintain the comparability of the analyzed periods, an analogous period of 6 weeks was set, both before and after the first significant drops in the Warsaw Stock Exchange. The analyzed periods consist of the following intervals:
- From 13 January 2020 to 21 February 2020 (Period 1);
- From 24 February 2020 to 4 April 2020 (Period 2);
- From 6 April 2020 to 15 May 2020 (Period 3).
The WSE is considered as an effective market because it is sufficiently liquid (Stereńczak 2018). The subject of the present study is the transactions of the companies listed on the main market of the Warsaw Stock Exchange. Due to the non-market nature of block trades, they were excluded from the study. From among 424 companies noted on the WSE, companies in the single-price auction system, as well as IPOs and companies withdrawn from trading sometime within the study period, were excluded. As a result, 386 companies being in the continuous trading system throughout the whole study period were selected for the analyses.
The following data was collected and, at the very beginning, aggregated into minute data and weekly periods:
- The number of transactions made;
- The sum of the transaction volume;
- Total turnover;
- The sum of differences between transactions in seconds;
- The sum of the percentage changes caused by transactions.
As a result, 18-week observations (for the above-mentioned periods) were obtained. Then, the values of the above data for the minute intervals in Periods 1, 2 and 3 were summed up. The following indices were also calculated for the minute data and individual periods:
- The average time interval between transactions in seconds;
- The average percentage change between transactions;
- The average transaction value.
The last step was to eliminate the non-significant unit changes and additionally aggregate the data into five-minute intervals, in order to better illustrate the trends prevailing during the session.
On the basis of such a preliminary analysis (including Figure 2, Figure 3, Figure 4 and Figure 5), first conclusions were drawn, and then the number of transactions was statistically verified. The session time was divided into the first 5 min (F5, 9:00–9:05), the last 5 min (L5, 16:45–16:50) and the remaining session duration (CL, 9:05–16:45). To relativize CL, the values ere averaged based on the use of 5 min intervals (92 intervals).
For statistical verification, non-parametric tests for the paired samples were used, and the session time was taken as an influencing factor. The choice of this group of tests resulted from the lack of assumption of normal distribution and the insufficient number of observations (aggregated data in daily intervals). First, it was checked whether the analyzed values in the session time intervals were dissimilar; therefore, the hypothesis (Friedman’s rank test (Friedman 1937)) verified that there was no difference between the analyzed values in the three considered session time intervals. If differences were found, a pairwise verification (Wilcoxon test (Wilcoxon 1945)) was performed on the hypothesis that there was no divergence between the analyzed values in each pair of session time intervals. A Monte Carlo approach (10,000 replicates) was performed simultaneously. The results were interpreted for the three significance levels: 0.1, 0.05 and 0.01.
4. Results
Based on the analysis of the minute ranges, it can be observed that between 09:00:00 and 09:00:59, most of the transactions were made during the continuous trading phase (CT). The number of transactions in this period exceeds the average number of transactions in the entire continuous trading phase by 1055%, 1086% and 1191% for Periods 1, 2 and 3, respectively.
The value of the turnover made in the first minute of trading is higher than the average by 483.9% in Period 1, 764.35% in Period 2 and by 869.6% in Period 3. Table 1 provides data on the share of the first minute and the first five minutes, in terms of the volume of trading throughout the CT phase. Moreover, the value of the turnover in the post-time phase and its share in the turnover during the entire session in the individual periods are presented.
The first minute accounted for 1.24% of the total turnover in the continuous trading phase in Period 1, while with each subsequent period this share grew up to 2.06%. On the other hand, the situation with overtime in trading throughout the session is noteworthy. In each subsequent period, this share decreased and the nominal value of turnover in Period 3 also fell in relation to Period 1.
The relation of transactions in individual session hours is slightly different. Table 2 presents the share of transactions made in the first minute and in the first five minutes of the session in the number of transactions during the continuous trading phase. The number of transactions during the trading-at-last phase was also compared to the total number of transactions.
The number of transactions in the first minute accounted for 2.46% of the total number of transactions in the continuous trading phase in Period 1, and as much as 2.75% in Period 3. The dominance of overtime in this ranking is no longer visible, and the trend is decreasing. The difference between Periods 1, 2 and 3 equals to 1 pp. The next step in the study was the analysis of the changes in the average transaction value in individual periods, as shown in Table 3.
An increasing average trade value can be observed in the first minute of the session, and a decreasing average in the extra time, especially between Periods 2 and 3. It is worth noting that there is a significant decrease in the average transaction value throughout the session between Periods 1 and 2.
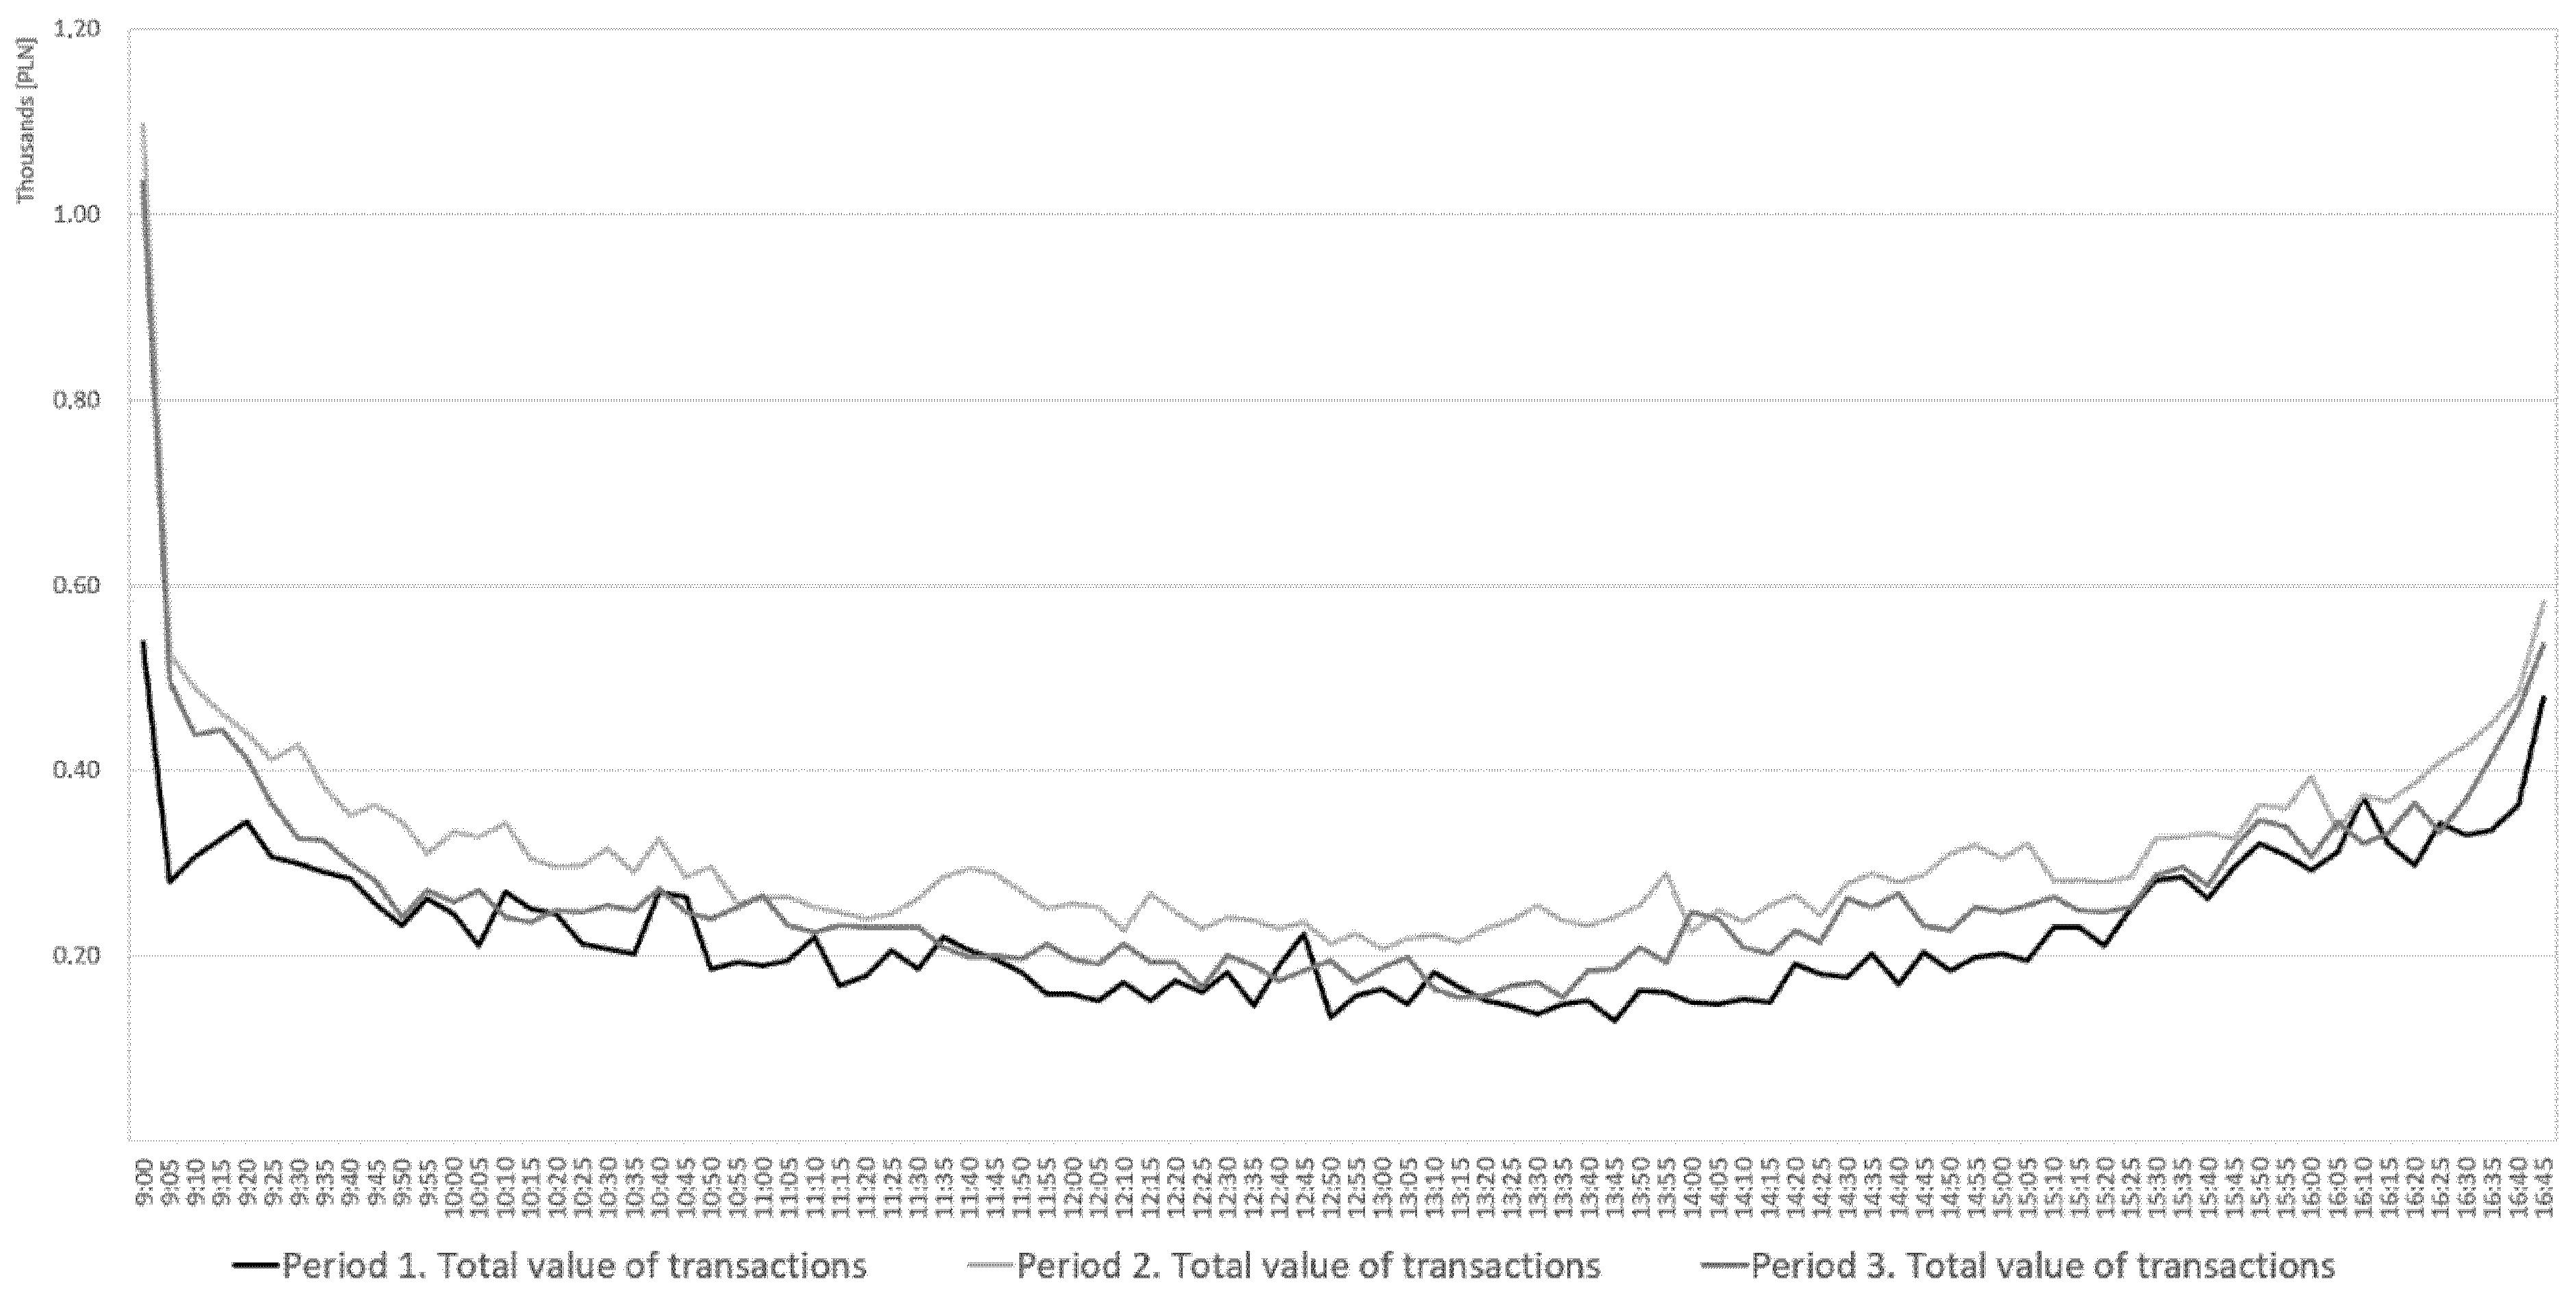
Data from 5 min periods were used to present the course of the entire session. However, attention was focused on the continuous trading phase while ignoring the trading-at-last period. As indicated in Table 1, Table 2 and Table 3, the trading-at-last period is a significant phase of the session in terms of the number of trades and their value. However, it is characterized by the fact that all trades are made at a predetermined price resulting from the pre-close market rebalancing phase, resulting in the percentage change between transactions always being equal to 0. Simultaneously, the time distance between the transactions is close to zero for most transactions, as the vast majority of them result from orders placed in the pre-close market balancing phase and is settled at 5:00 p.m., at the closing price. Figure 2 shows the transaction distribution of the trading value in the successive 5 min windows for Periods 1, 2 and 3.
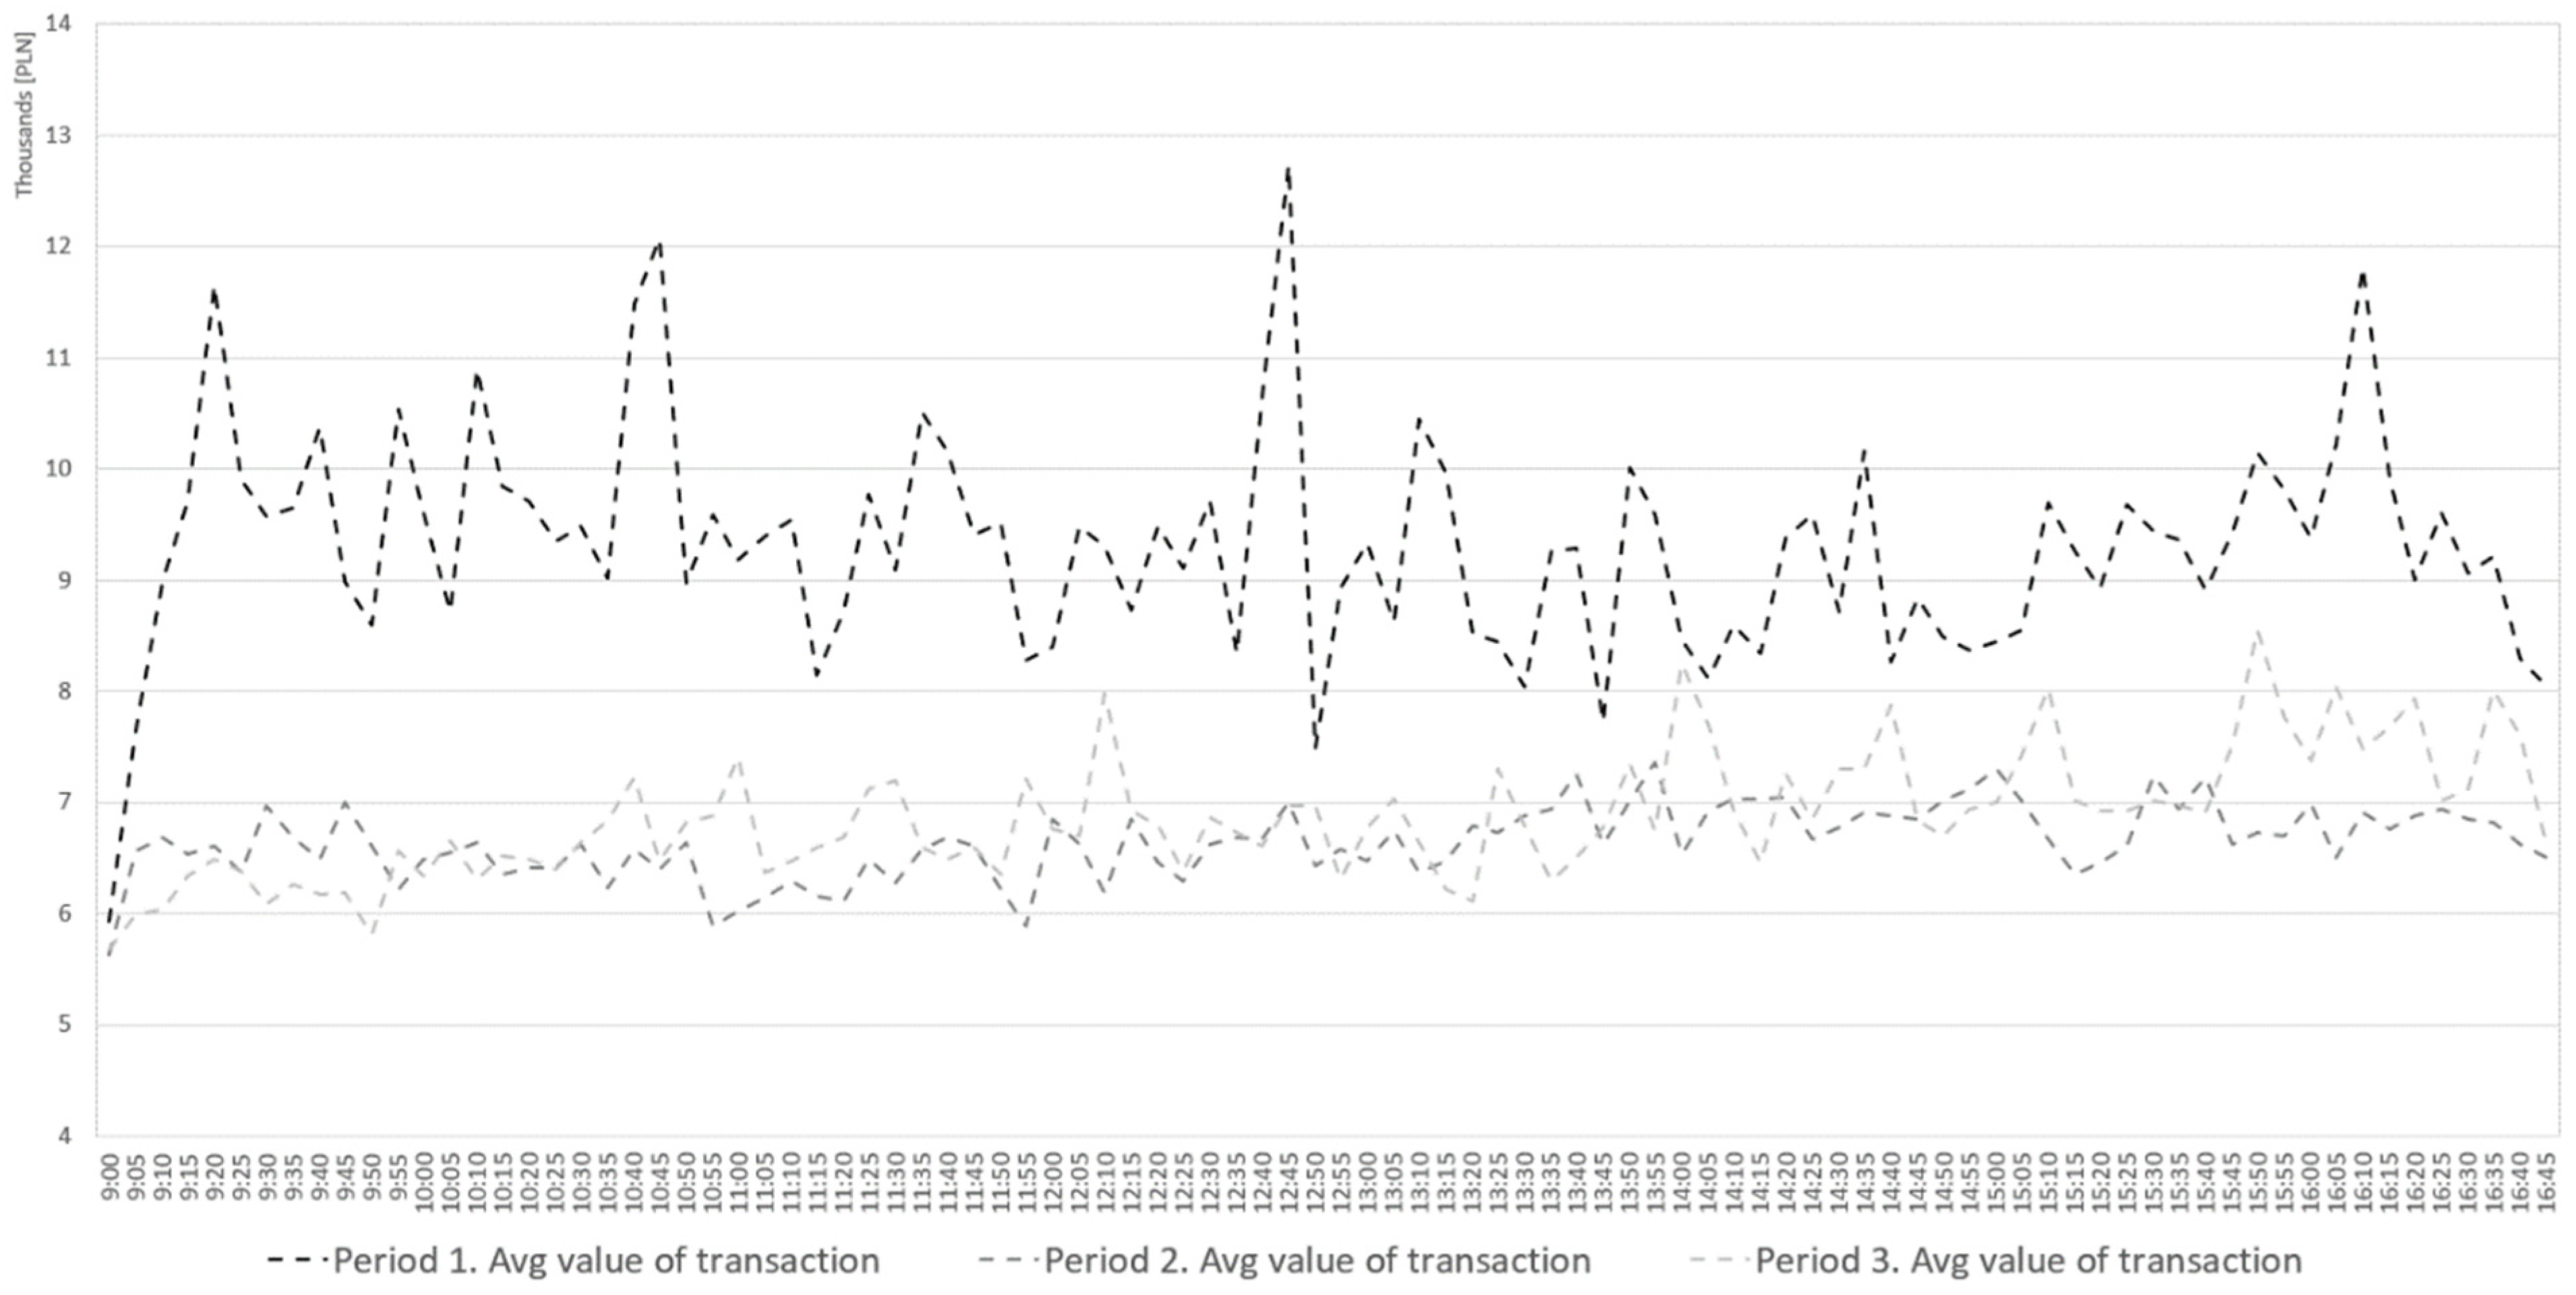
Figure 2 confirms that a U-shaped distribution of the trading value exists during the session, regardless of the chosen period. In the crisis period (Period 2) and after the crisis (Period 3), the initial phase of the session (the first 20 min) was characterized by a much higher value of share turnover than in the pre-crisis period. Figure 3 presents the average transaction value in the successive 5 min windows for Periods 1, 2 and 3.
The average transaction value in the initial phase of the session is similar in each analyzed period, while the following minutes and hours leave no doubt that the average transaction value in Period 1 is much higher than in Periods 2 and 3. It is worth noting how equal the average values of the trades are in Periods 2 and 3.
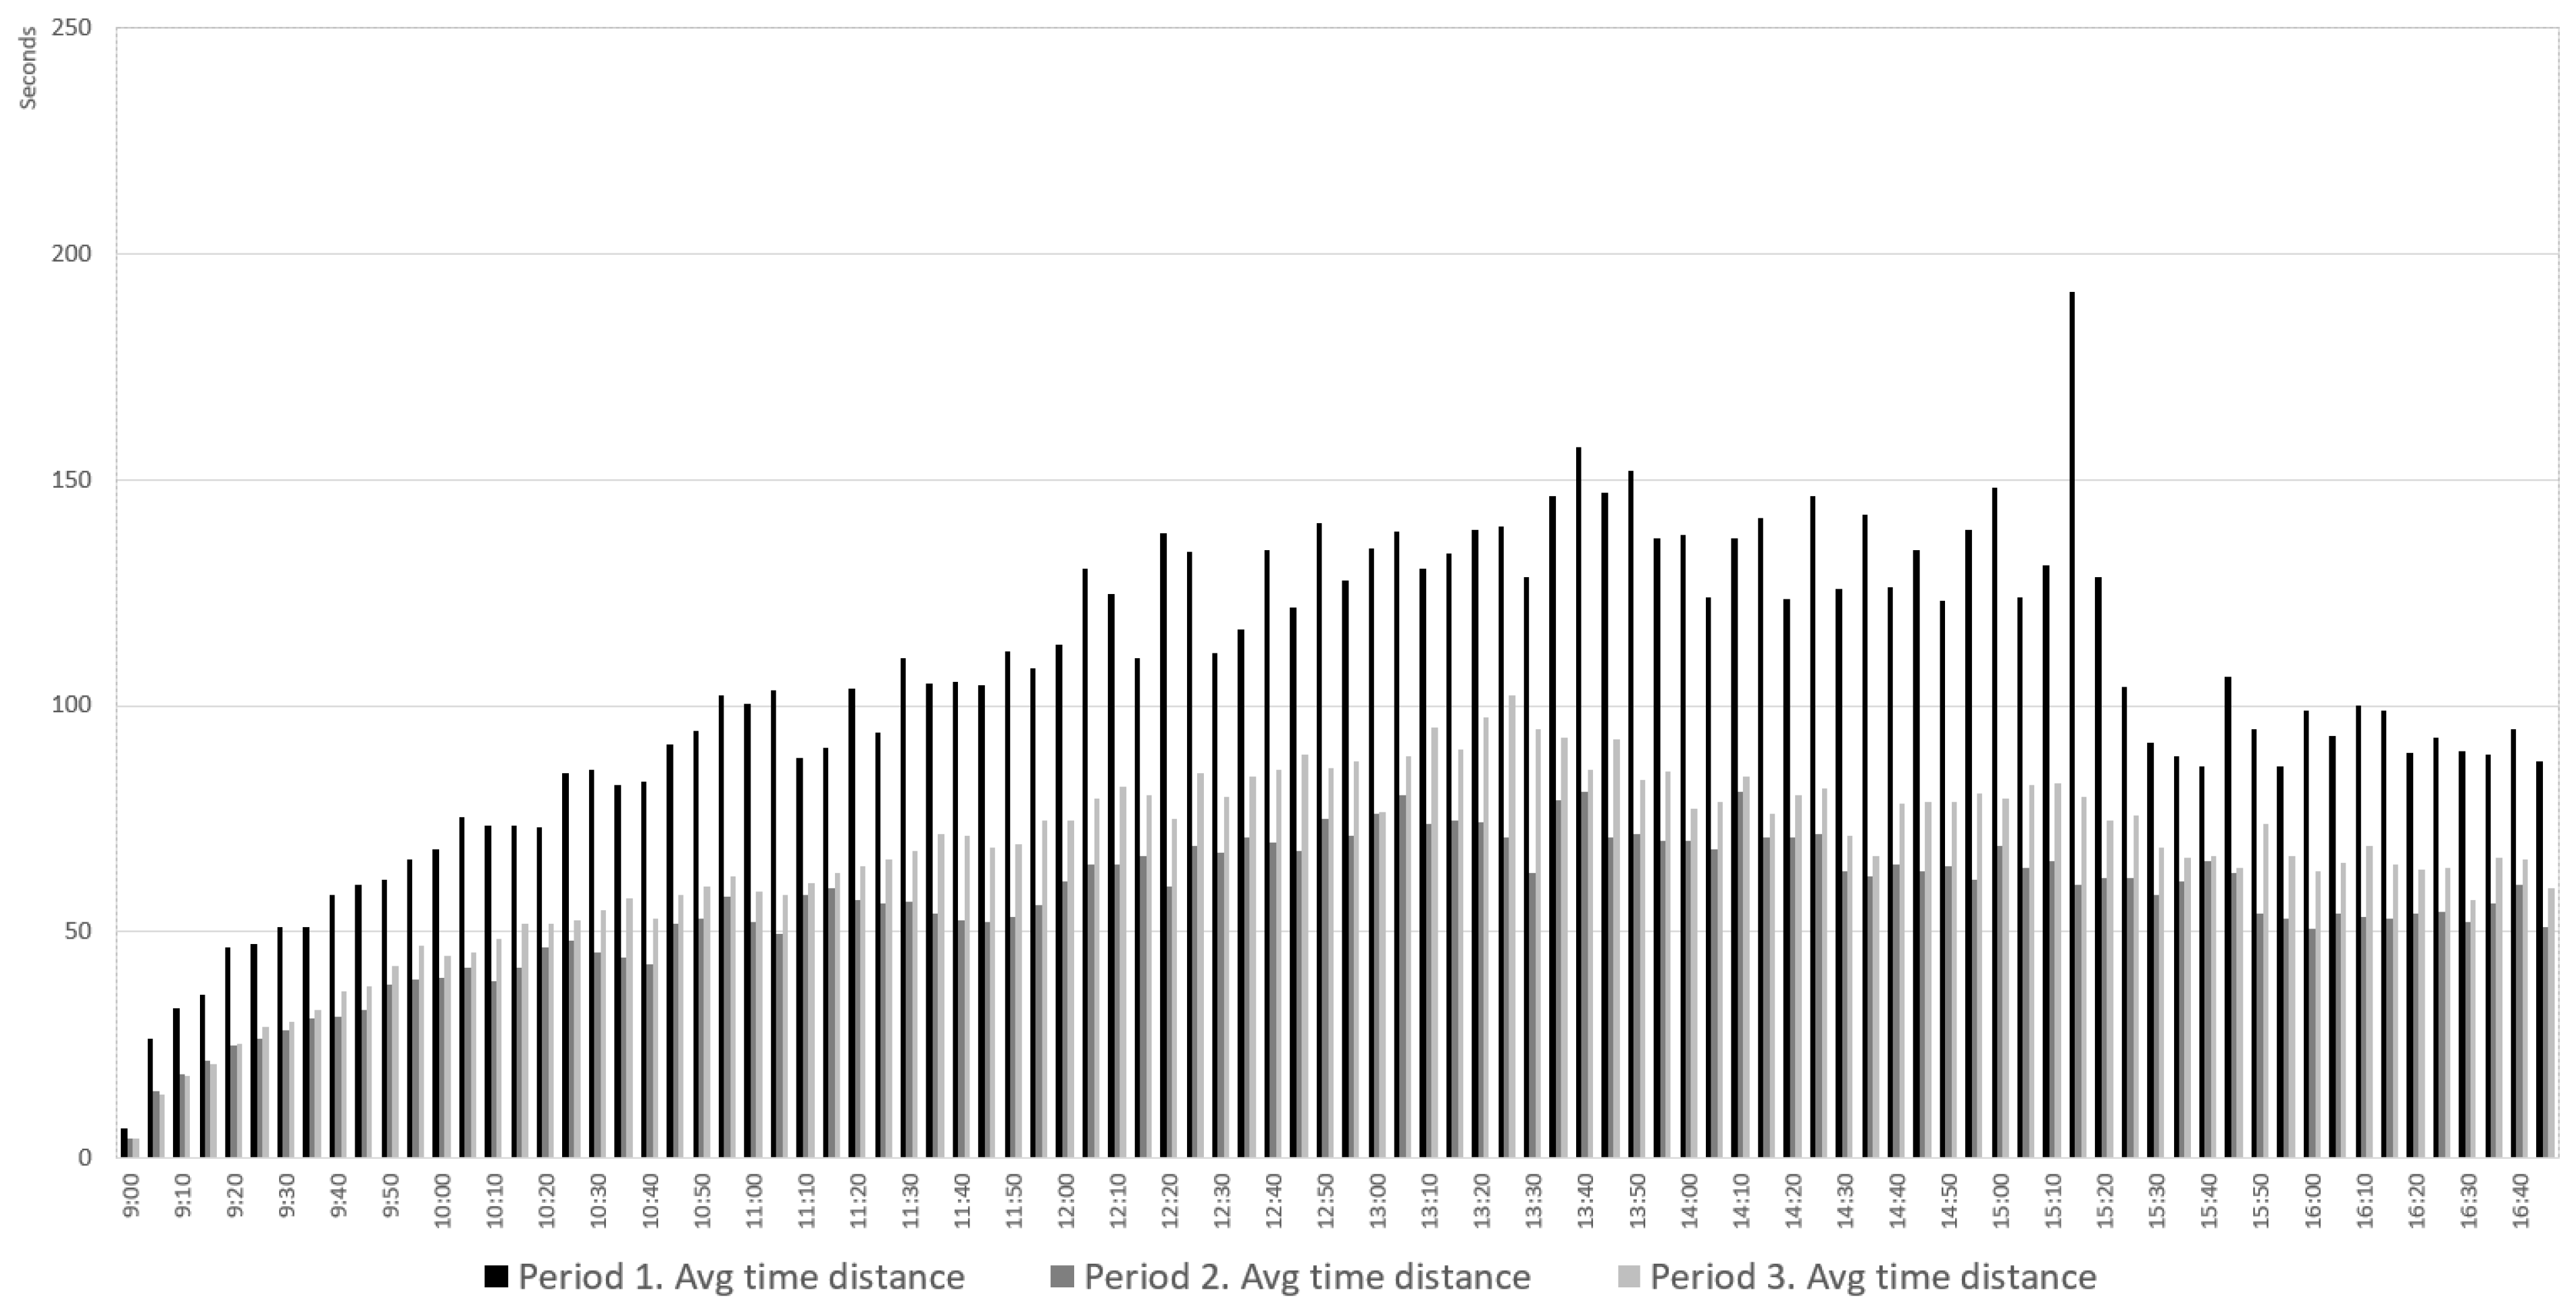
It suggests that in Period 2, which is crucial in this paper, some deviation occurs in the investor’s behavior. If compared with the average time between subsequent transactions, which is clearly higher in Period 1 and the lowest in Period 2, it can be concluded that the activity of investors with less capital increased in Period 2. In Figure 4, it can be seen that, in addition to the drop in average time distance in Period 2, Period 1 is distinguished by a significant decrease in the time interval between transactions from 3:30 p.m.
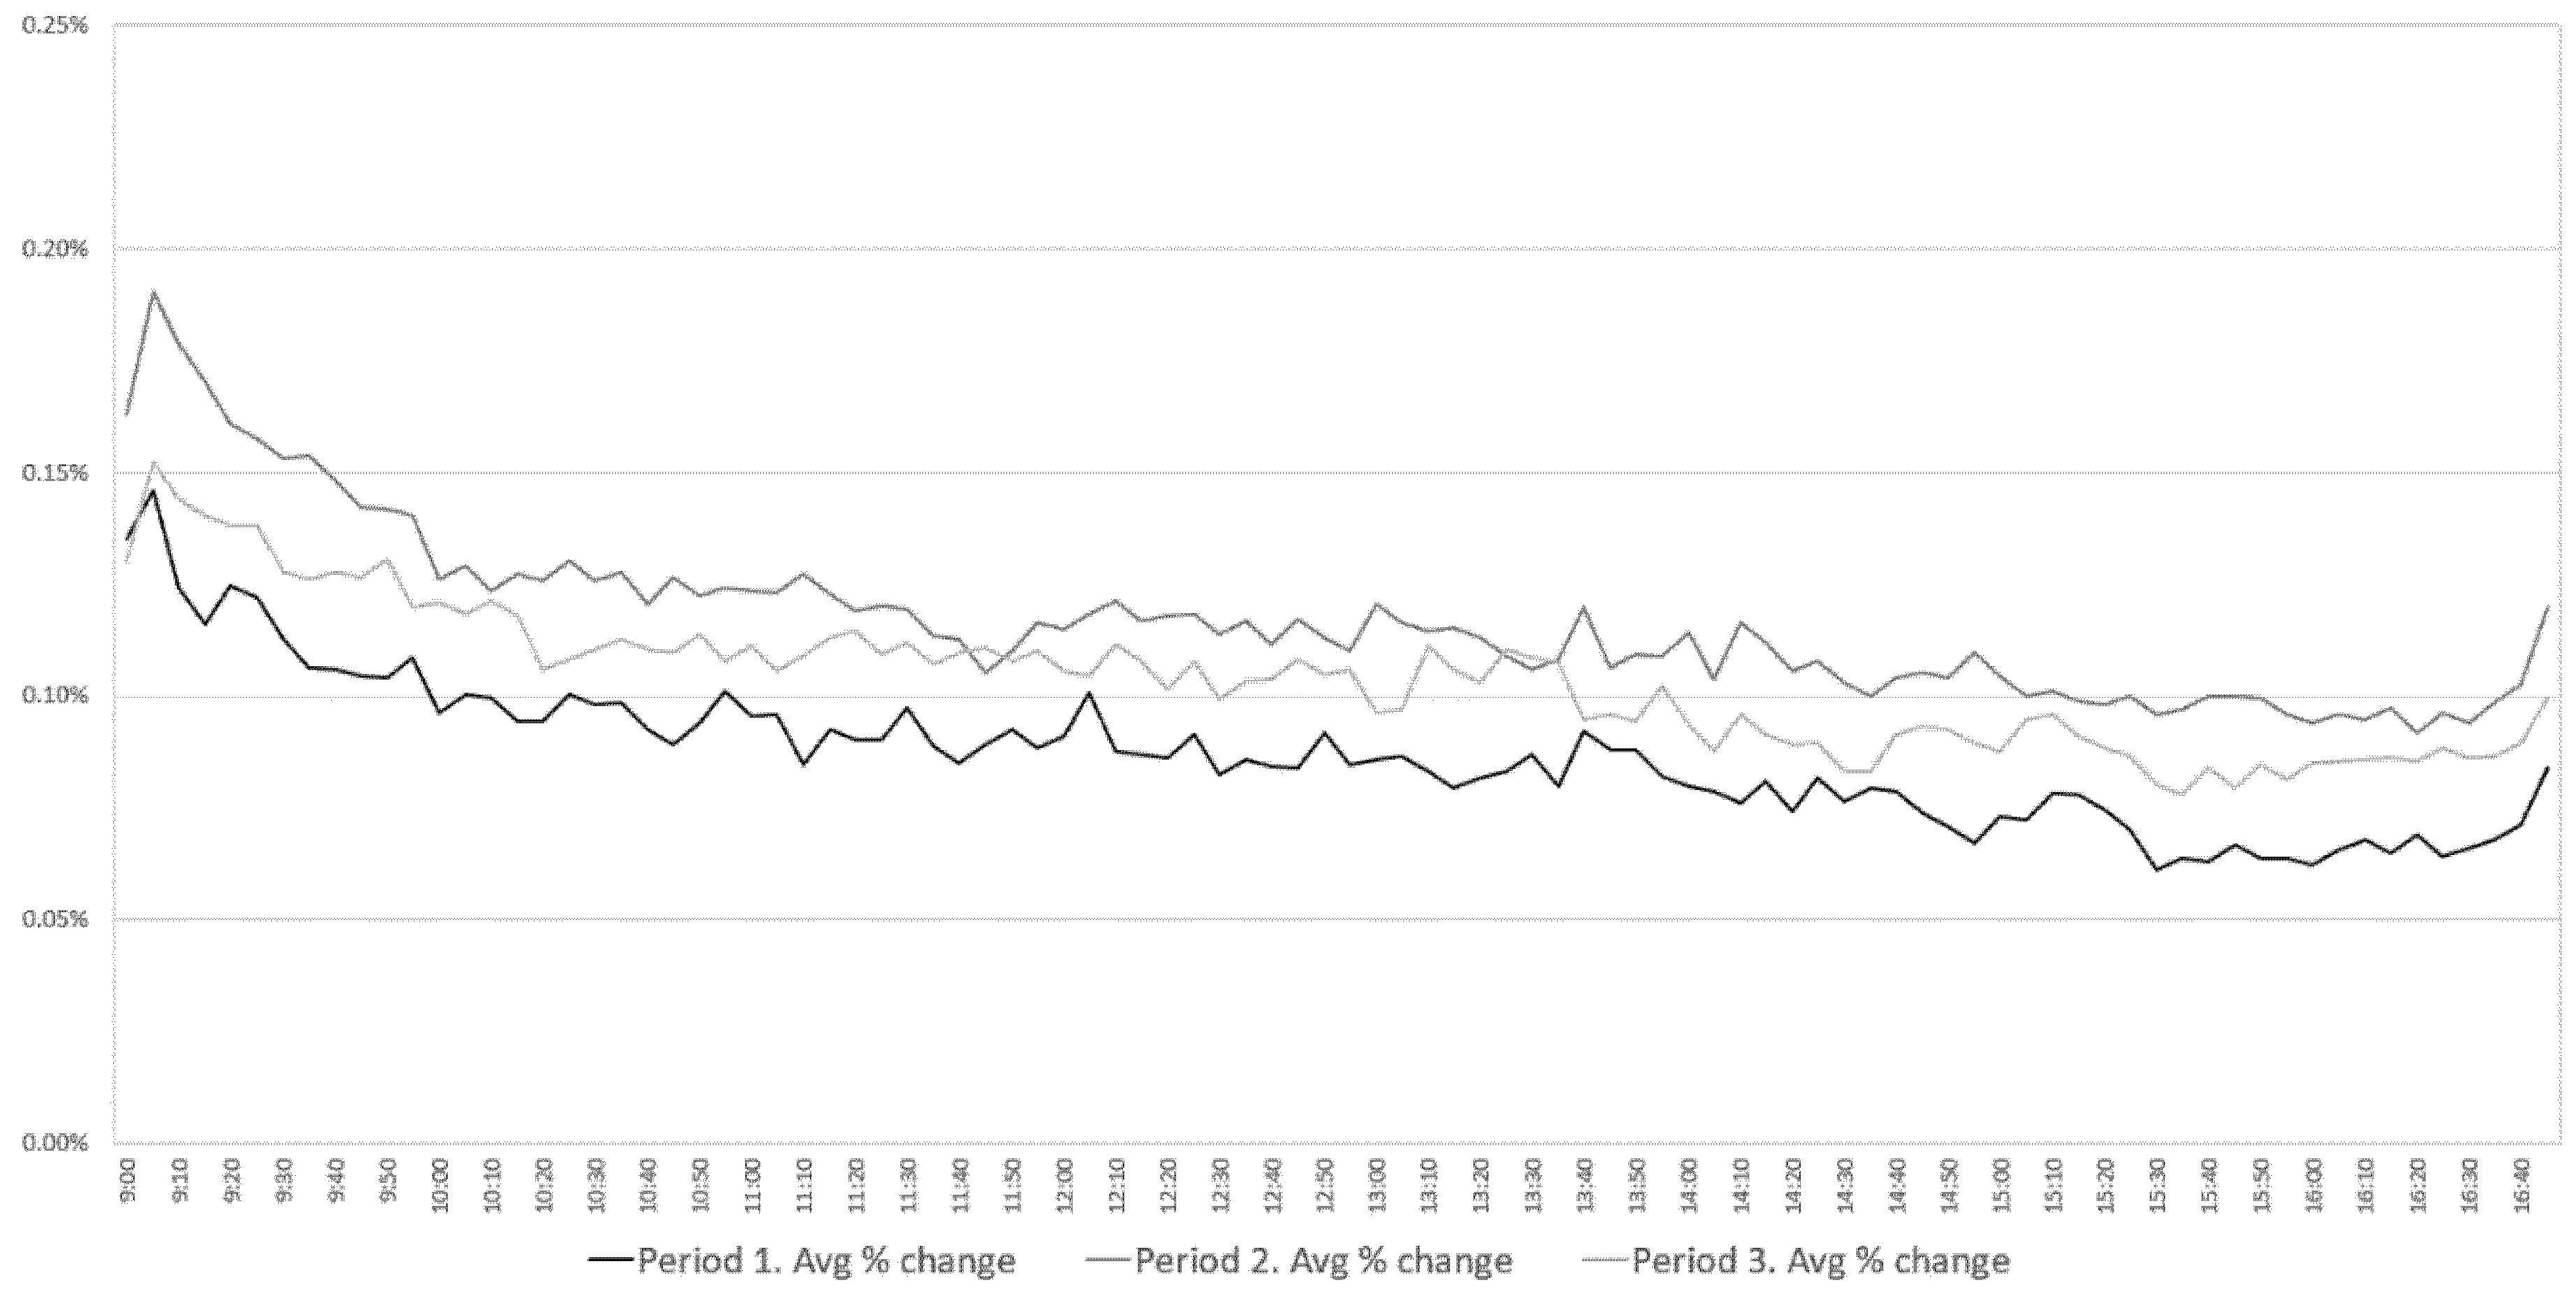
The average percentage distance between transactions shown in Figure 4 increased in Period 2 by 36%, and remained higher in Period 3 than in Period 1 by 20.5%. This means that the realized spread between transactions increased during the COVID-19 crisis and remained higher after it was over. Its smallest value appears at 3:30 p.m. and this is related to the pattern observable in the time distance between the transactions ratio. Moreover, in the case of the distance between transactions, the minimum amount is observed at the same hour in each of the analyzed periods. It is worth noting that during the pandemic, the fact that the lowest distances between trades occurred by hours, the start of the session on stocks in the United States did not change.
Furthermore, the highest level of percent distance between transactions was observed at 9:05 a.m. Therefore, it can be assumed that after the first transactions are settled directly after the opening of the session, investors agreed to bear the higher cost of a transaction, if one was carried out.
The results show that the most active period during a session is its beginning. Then, the trades have the highest average value, time distance is the shortest and high volatility is observed. An explanation of this phenomenon can be found in the investors’ discounting of the information published between the closing of one session and the opening of another.
This behavior was observed throughout each period considered in this study. However, there are differences in behavior between periods in the later hours of the session. The significant decrease in the time distance between transactions observed in Period 1 at 3:30 p.m. was reduced in subsequent periods to insignificant in Periods 2 and 3. The overall liquidity in Period 2 was the highest, while in Period 3 it was higher than in Period 1.
Statistical Verification
The graphical representation of the formation of the liquidity patterns in the U-shape can be confirmed, assuming that at the beginning and at the end of the session the number of transactions is, on average, higher than it is during the remaining session time. The average number of transactions is presented in Table 4.
The average number of transactions in the analyzed moments of the session in all of them is the highest in the first 5 min of the session (F5), then in the last 5 min of the session (L5) and the lowest in the remaining moments (CL). The Friedman’s rank test was used to verify the value of the number in a particular moment of the session. The results are presented in Table 5.
At the significance level of 0.01, it should be argued that the number of transactions varies in at least one session period. It is worth noting that this is a conclusion for all the analyzed periods. The Wilcoxon test was used to verify between the two individual sessions, the results of which are presented in Table 6.
When analyzing the liquidity patterns throughout the whole period, it should be stated that all pairwise differences in the number of transactions are significant at the level of 0.01, which confirms the presence of the U-shape of liquidity patterns. In Period 1 and Period 2, assuming a significance level of 0.05, the existence of a U-shaped relationship is also confirmed. However, in Period 3 a significance level of 0.1 should be adopted to confirm the occurrence of a U-shape in the liquidity patterns based on the average number of transactions. This indicates that there is a strong difference between F5 and CL and F5, however the difference between CL and F5 is decreasing and therefore the U shape is less visible but still exists.
5. Discussion
Knowing the distribution of liquidity during the session allows a trader to optimize their investment decisions. The best time to trade with high volume is in the first minutes of a session, followed by the hours 15:30 to 16:50. The period of the lowest liquidity is between 1.30 p.m. and 1.50 p.m. The hypothesis about the U-shape intraday pattern of liquidity, put forward by the conducted preliminary analysis, was confirmed by statistical verification based on the number of transactions in the first 5 min, the last 5 min and the remaining duration of the session. It is worth noting that these liquidity patterns were confirmed in all three analyzed periods.
Furthermore, regarding to observations made by Madhavan (1992), this study confirms that spreads, measured by the percentage changes between transactions, decrease during the day. Madhavan (1992) defines this phenomenon as the increasing reduction in the information asymmetry between dealers and traders. The results of the study are similar to those of the research of the depth and spread at the Stock Exchange of Hong Kong (Ahn and Cheung 1999). Our findings prove that, regardless of the way the spread is interpreted (the difference between the best bid and asking prices or the difference in price between consecutive transactions), the liquidity patterns are analogous.
The decrease in the average interval between transactions around 3:30 p.m. in Period 1 is extremely unusual, as there are no regular cyclical events in Poland or Europe that could directly affect the liquidity of the WSE. Moreover, the detection of such behavior is a novelty because, in the results of a similar study on intraday patterns of the stock liquidity, Będowska-Sójka (2013) did not observe it. However, the explanation for this behavior can be found in the impact of stock exchanges in the United States, because this is when the session opens. An analogical decrease was also observed in Periods 2 and 3, but to a much lesser extent.
Another observation is the increase in the average percentage change between transactions in Periods 2 and 3 as compared to Period 1. This, in turn, can be associated with a decrease in liquidity on the stock exchange with the simultaneous improvement of all other parameters, i.e., transaction speed as well as their size and total number. This could be explained by the increased overall volatility in the market, especially since a decrease in the percentage change in Period 3 relative to Period 2 can be observed with a simultaneous increase in the intervals between transactions.
The findings of the study concerning the liquidity behavior of shares are similar to Olbryś and Mursztyn (2017) research, in which they analyzed the period of the previous financial crisis of 2007–2009. Therefore, it can be assumed that the behavior of retail investors trading on the Warsaw Stock Exchange during the crisis is similar, regardless of its duration and circumstances.
In-depth research could also confirm the observed increase in the percentage difference between transactions in Periods 2 and 3 in relation to Period 1. Thus, it could be determined whether it is characteristic of the stock market crash, as Amihud et al. (1990) claimed. Authors suggests that the key reason for the crash in 1987 was a lack of liquidity caused inter alia by the trading mechanism (Amihud et al. 1990). Nevertheless, authors also highlighted that a few days before the biggest price decline, a lower liquidity level was observed.
6. Conclusions
The aim of this study was to verify if intraday liquidity patterns existed on the Warsaw Stock Exchange before, during and after the panic caused by the COVID-19 pandemic. The findings confirmed the existence of a U-shaped intraday distribution of transaction numbers, emphasizing the importance of the first and last minutes of the trading session. The COVID-19 pandemic dominated the WSE transactions—the average percentage change between transactions increased during the pandemic.
The value of the study is its universal character due to the use of simple liquidity measures. The conclusions of the research presented in the study concern the WSE, which is an order-driven exchange and, to a large extent, fill the identified research gap. It should be emphasized that this gap still exists as there is no extensive research of similar markets around the world. One of the reasons for this state of affairs is different models of the stock exchange, e.g., quote-driven, represented by American stock markets.
6.1. Practical Implications
The article provides knowledge on the frequency of transactions, and their volume allows for better planning, especially for large institutional investors. It should be noted that liquidity intraday patterns are identical even in periods of strong market turmoil, and thus it confirms their relevance and applicability in practice. In addition, as investors are aware of liquidity patterns, they reduce the cost of trades as they trade with a tighter spread (i.e., the difference between the ask and bid).
6.2. Limitations
The limitation of the study was its relatively short period of analysis. The adoption of such a short period in the analysis was caused by the fact that the financed markets’ crisis caused by COVID-19 was exceedingly short. This makes it puzzling to generalize the conclusions about the durability of the demonstrated distribution tendency.
6.3. Further Study
Further research may focus on examining the liquidity in specific sectors (stock indices) over the same period. Moreover, researchers can conduct similar studies by modifying the time intervals. It would also be worth considering the liquidity of other exchanges applying the methodology used in this study, adjusting it to the specificity of the analyzed market.
Author Contributions
Conceptualization, J.K. and M.T.; methodology, J.K. and M.T.; validation, J.K.; formal analysis, M.T.; investigation, J.K. and M.T.; resources, M.T.; data curation, M.T.; writing—original draft preparation, J.K. and M.T.; writing—review and editing, J.K.; visualization, J.K. and M.T.; supervision, J.K.; project administration, J.K. All authors have read and agreed to the published version of the manuscript.
Funding
This research received no external funding.
Conflicts of Interest
The authors declare no conflict of interest.
References
- Admati, Anat R., and Paul Pfleiderer. 1988. A theory of intraday patterns: volume and price variability. Review of Financial Studies 1: 3–40. [Google Scholar] [CrossRef]
- Ahn, Hee-Joon, and Yan-Leung Cheung. 1999. The Intraday Patterns of the Spread and Depth in a Market without Market Makers: The Stock Exchange of Hong Kong. Pacific-Basin Finance Journal 7: 539–56. [Google Scholar] [CrossRef]
- Akhtaruzzaman, Md, Sabri Boubaker, and Ahmet Sensoy. 2021a. Financial Contagion during COVID–19 Crisis. Finance Research Letters 38: 101604. [Google Scholar] [CrossRef] [PubMed]
- Akhtaruzzaman, Md, Sabri Boubaker, Brian M. Lucey, and Ahmet Sensoy. 2021b. Is Gold a Hedge or a Safe-Haven Asset in the COVID–19 Crisis? Economic Modelling 102: 105588. [Google Scholar] [CrossRef]
- Al-Awadhi, Abdullah M., Khaled Alsaifi, Ahmad Al-Awadhi, and Salah Alhammadi. 2020. Death and Contagious Infectious Diseases: Impact of the COVID-19 Virus on Stock Market Returns. Journal of Behavioral and Experimental Finance 27: 100326. [Google Scholar] [CrossRef] [PubMed]
- Amihud, Yakov, and Haim Mendelson. 1987. Trading Mechanisms and Stock Returns: An Empirical Investigation. The Journal of Finance 42: 533–53. [Google Scholar] [CrossRef]
- Amihud, Yakov, Haim Mendelson, and Robert A. Wood. 1990. Liquidity and the 1987 Stock Market Crash. The Journal of Portfolio Management 16: 65–69. [Google Scholar] [CrossRef]
- Angerer, Michael, Georg Peter, Sebastian Stoeckl, Thomas Wachter, Matthias Bank, and Marco Menichetti. 2018. Bid-Ask Spread Patterns and the Optimal Timing for Discretionary Liquidity Traders on Xetra. Schmalenbach Business Review 70: 209–30. [Google Scholar] [CrossRef]
- Anghel, Dan Gabriel, Elena Valentina Ţilică, and Victor Dragotă. 2020. Intraday Patterns in Returns on the Romanian and Bulgarian Stock Markets. Romanian Journal of Economic Forecasting 23: 92. [Google Scholar]
- Arif, Muhammad, Mudassar Hasan, Suha M. Alawi, and Muhammad Abubakr Naeem. 2021. COVID-19 and Time-Frequency Connectedness between Green and Conventional Financial Markets. Global Finance Journal 49: 100650. [Google Scholar] [CrossRef]
- Ashraf, Badar Nadeem. 2021. Stock Markets’ Reaction to COVID-19: Moderating Role of National Culture. Finance Research Letters 41: 101857. [Google Scholar] [CrossRef]
- Bai, Lan, Yu Wei, Guiwu Wei, Xiafei Li, and Songyun Zhang. 2021. Infectious Disease Pandemic and Permanent Volatility of International Stock Markets: A Long-Term Perspective. Finance Research Letters 40: 101709. [Google Scholar] [CrossRef]
- Baker, Scott, Nicholas Bloom, Steven Davis, Kyle Kost, Marco Sammon, and Tasaneeya Viratyosin. 2020. The Unprecedented Stock Market Impact of COVID-19. Working Paper No. 26945. National Bureau of Economic Research: Available online: https://www.nber.org/papers/w26945 (accessed on 26 December 2021).
- Będowska-Sójka, Barbara. 2013. Intraday Stealth Trading and Volatility: The Evidence from the Warsaw Stock Exchange. SSRN Electronic Journal. [Google Scholar] [CrossRef]
- Będowska-Sójka, Barbara. 2018. The Coherence of Liquidity Measures. The Evidence from the Emerging Market. Finance Research Letters 27: 118–23. [Google Scholar] [CrossRef]
- Będowska-Sójka, Barbara, and Agata Kilber. 2019. The causality between liquidity and volatility in the Polish stock market. Finance Research Letters 30: 110–115. [Google Scholar] [CrossRef]
- Bernstein, Peter L. 1987. Liquidity, Stock Markets, and Market Makers. Financial Management 16: 54. [Google Scholar] [CrossRef]
- Biais, Bruno, Pierre Hillion, and Chester Spatt. 1995. An Empirical Analysis of the Limit Order Book and the Order Flow in the Paris Bourse. The Journal of Finance 50: 1655–89. [Google Scholar] [CrossRef]
- Bildik, Recep. 2001. Intra-Day Seasonalities on Stock Returns: Evidence from the Turkish Stock Market. Emerging Markets Review 2: 387–417. [Google Scholar] [CrossRef]
- Buszko, Michał, Witold Orzeszko, and Marcin Stawarz. 2021. COVID-19 pandemic and stability of stock market—A sectoral approach. PLoS ONE 16: e0250938. [Google Scholar] [CrossRef]
- Caporale, Guglielmo Maria, Peter G. Howells, and Alaa Soliman. 2004. Stock market development and economic growth: the causal linkage. Journal of Economic Development 29: 33–50. [Google Scholar]
- Chang, Kai, Rongda Chen, and Julien Chevallier. 2018. Market fragmentation, liquidity measures and improvement perspectives from China’s emissions trading scheme pilots. Energy Economics 75: 249–60. [Google Scholar] [CrossRef]
- Chelley-Steeley, Patricia, and Keebong Park. 2011. Intraday Patterns in London Listed Exchange Traded Funds. International Review of Financial Analysis 20: 244–51. [Google Scholar] [CrossRef]
- Contessi, Silvio, and Pierangelo De Pace. 2021. The International Spread of COVID-19 Stock Market Collapses. Finance Research Letters 42: 101894. [Google Scholar] [CrossRef] [PubMed]
- Czerwonka, Monika, and Bartłomiej Gorlewski. 2012. Finanse Behawioralne. Warszawa: Oficyna Wydawnicza SGH. [Google Scholar]
- Dang, Tung Lam, and Thi Minh Hue Nguyen. 2020. Liquidity Risk and Stock Performance during the Financial Crisis. Research in International Business and Finance 52: 101165. [Google Scholar] [CrossRef]
- El Wassal, Kamal A. 2013. The development of stock markets: In search of a theory. International Journal of Economics and Financial Issues 3: 606–24. [Google Scholar]
- Emery, Gary W., and Kenneth O. Cogger. 1982. The Measurement of Liquidity. Journal of Accounting Research 20: 290. [Google Scholar] [CrossRef]
- Fama, Eugene F. 1965. The behavior of stock-market prices. Journal of Business 38: 34–105. [Google Scholar] [CrossRef]
- Fama, Eugene F. 1970. Efficient Capital Markets: A Review of Theory and Empirical Work. The Journal of Finance 25: 383. [Google Scholar] [CrossRef]
- Friedman, Milton. 1937. The Use of Ranks to Avoid the Assumption of Normality Implicit in the Analysis of Variance. Journal of the American Statistical Association 32: 675–701. [Google Scholar] [CrossRef]
- Garcia, Valeriano F., and Lin Liu. 1999. Macroeconomic Determinants of Stock Market Development. Journal of Applied Economics 2: 29–59. [Google Scholar] [CrossRef] [Green Version]
- Glavina, Sofya. 2015. Influence of globalization on the regional capital markets and consequences: Evidence from Warsaw stock exchange. European Research Studies Journal 18: 117–34. [Google Scholar] [CrossRef] [Green Version]
- Goyenko, Ruslan Y., Craig W. Holden, and Charles A. Trzcinka. 2009. Do liquidity measures measure liquidity? Journal of Financial Economics 92: 153–81. [Google Scholar] [CrossRef]
- Haddad, Valentin, Alan Moreira, and Tyler Muir. 2020. When Selling Becomes Viral: Disruptions in Debt Markets in the COVID-19 Crisis and the Fed’s Response. Working Paper No. 27168. National Bureau of Economic Research: Available online: https://www.nber.org/papers/w27168 (accessed on 26 December 2021).
- Hanselaar, Rogier M., René M. Stulz, and Mathijs A. van Dijk. 2019. Do Firms Issue More Equity When Markets Become More Liquid? Journal of Financial Economics 133: 64–82. [Google Scholar] [CrossRef] [Green Version]
- Jin, Muzhao, Fearghal Kearney, Youwei Li, and Yung Chiang Yang. 2019. Intraday Time-series Momentum: Evidence from China. Journal of Futures Markets 40: 632–50. [Google Scholar] [CrossRef] [Green Version]
- Kholisoh, Luluk, and Sri Hermawati. 2011. New Liquidity Measurement: Mechanical Approach (Case of Pre Opening Session on IDX). SSRN Electronic Journal. [Google Scholar] [CrossRef] [Green Version]
- Klein, Olga, and Shiyun Song. 2021. Commonality in intraday liquidity and multilateral trading facilities: Evidence from Chi-X Europe. Journal of International Financial Markets, Institutions and Money 73: 101349. [Google Scholar] [CrossRef]
- Krishnan, Rajaram, and Vinod Mishra. 2013. Intraday liquidity patterns in Indian stock market. Journal of Asian Economics 28: 99–114. [Google Scholar] [CrossRef]
- Kszczotek, Mikołaj, Błażej Kiermasz, and Michał Cisek. 2021. Efektywność informacyjna polskiego rynku kapitałowego w formie słabej na przykładzie spółek z indeksu WIG20. Studia Prawno-Ekonomiczne 118: 249–64. [Google Scholar] [CrossRef]
- Kubiczek, Jakub. 2020. Corporate Bond Market in Poland—Prospects for Development. Journal of Risk and Financial Management 13: 306. [Google Scholar] [CrossRef]
- Kubiczek, Jakub, and Wojciech Derej. 2021. Financial performance of businesses in the COVID-19 pandemic conditions–comparative study. Polish Journal of Management Studies 24: 183–201. [Google Scholar] [CrossRef]
- Kubiczek, Jakub, and Bartłomiej Hadasik. 2021. Challenges in reporting COVID-19 daily cases and presenting them to society. Journal of Data and Information Quality 13: 1–7. [Google Scholar] [CrossRef]
- Kumar, Gaurav, and Arun Kumar Misra. 2015. Closer View at the Stock Market Liquidity: A Literature Review. Asian Journal of Finance & Accounting 7: 35. [Google Scholar] [CrossRef]
- Kyle, Albert S. 1985. Continuous Auctions and Insider Trading. Econometrica 53: 1315. [Google Scholar] [CrossRef] [Green Version]
- Levine, Ross. 1991. Stock Markets, Growth, and Tax Policy. The Journal of Finance 46: 1445–65. [Google Scholar] [CrossRef]
- Levine, R., and S. Zervos. 1996. Stock Market Development and Long-Run Growth. The World Bank Economic Review 10: 323–39. [Google Scholar] [CrossRef] [Green Version]
- Lyócsa, Štefan, Eduard Baumöhl, Tomáš Výrost, and Peter Molnár. 2020. Fear of the Coronavirus and the Stock Markets. Finance Research Letters 36: 101735. [Google Scholar] [CrossRef] [PubMed]
- Madhavan, Ananth. 1992. Trading mechanisms in securities markets. The Journal of Finance 47: 607–41. [Google Scholar] [CrossRef]
- Malik, Azeem, and Wing Lon Ng. 2014. Intraday liquidity patterns in limit order books. Studies in Economics and Finance 31: 46–71. [Google Scholar] [CrossRef]
- Mazur, Mieszko, Man Dang, and Miguel Vega. 2021. COVID-19 and the March 2020 Stock Market Crash. Evi-dence from S&P1500. Finance Research Letters 38: 101690. [Google Scholar] [CrossRef]
- Miloș, Marius Cristian, Laura Raisa Miloș, Flavia Barna, and Claudiu Boțoc. 2021. Impact of MiFID II on Romanian Stock Market Liquidity—Comparative Analysis with a Developed Stock Market. International Journal of Financial Studies 9: 69. [Google Scholar] [CrossRef]
- Miwa, Kotaro. 2019. Trading Hours Extension and Intraday Price Behavior. International Review of Economics & Finance 64: 572–85. [Google Scholar] [CrossRef]
- Naes, Randi, Johannes A. Skejltorp, and Bernt Arne Ødegaard. 2011. Stock Market Liquidity and the Business Cycle. The Journal of Finance 66: 139–76. [Google Scholar] [CrossRef]
- Nofsinger, John R. 2005. Social Mood and Financial Economics. Journal of Behavioral Finance 6: 144–60. [Google Scholar] [CrossRef]
- Olbryś, Joanna, and Michał Mursztyn. 2017. Measurement of Stock Market Liquidity Supported by an Algorithm Inferring the Initiator of a Trade. Operations Research and Decisions 27: 111–27. [Google Scholar] [CrossRef]
- Ramos, Henrique Pinto, and Marcelo Brutti Righi. 2020. Liquidity, Implied Volatility and Tail Risk: A Comparison of Liquidity Measures. International Review of Financial Analysis 69: 101463. [Google Scholar] [CrossRef]
- Ranaldo, Angelo. 2001. Intraday Market Liquidity on the Swiss Stock Exchange. Financial Markets and Portfolio Management 15: 309–27. [Google Scholar] [CrossRef]
- Sadka, Ronnie, and Anna Schrebina. 2007. Analyst Disagreement, Mispricing, and Liquidity. The Journal of Finance 62: 2367–403. [Google Scholar] [CrossRef]
- Salisu, Afees A., and Ahamuefula E. Ogbonna. 2021. The Return Volatility of Cryptocurrencies during the COVID-19 Pandemic: Assessing the News Effect. Global Finance Journal, 100641, in press. [Google Scholar] [CrossRef]
- Sarr, Abdourahmane, and Tonny Lybek. 2002. Measuring Liquidity in Financial Markets. Available online: https://www.imf.org/en/Publications/WP/Issues/2016/12/30/Measuring-Liquidity-in-Financial-Markets-16211 (accessed on 26 December 2021). IMF Working Paper. WP/02/232.
- Singh, Mahipal. 2011. Security Analysis with Investment and Portfolio Management. New Delhi: Gyan Publishing House. [Google Scholar]
- Stereńczak, Szymon. 2018. Stock Liquidity on the Warsaw Stock Exchange in the 21st Century: Time-Series and Cross-Sectional Dependencies. Zeszyty Naukowe Uniwersytetu Szczecińskiego Finanse Rynki Finansowe Ubezpieczenia 91: 281–92. [Google Scholar] [CrossRef] [Green Version]
- Topcu, Mert, and Omer Serkan Gulal. 2020. The Impact of COVID-19 on Emerging Stock Markets. Finance Research Letters 36: 101691. [Google Scholar] [CrossRef]
- Tuszkiewicz, Marcin. 2022. Wpływ pandemii COVID-19 na płynność akcji notowanych na Giełdzie Papierów Wartościowych w Warszawie. Journal of Finance and Financial Law, in press. [Google Scholar]
- Weigerding, Michael, and Michael Hanke. 2018. Drivers of seasonal return patterns in German stocks. Business Research 11: 173–96. [Google Scholar] [CrossRef] [Green Version]
- Wilcoxon, Frank. 1945. Individual Comparisons by Ranking Methods. Biometrics Bulletin 1: 80–83. [Google Scholar] [CrossRef]
- World Health Organization. 2020. Media briefing on COVID-19—11 March 2020. Geneva: World Health Organization. [Google Scholar]
- Włosik, Katarzyna. 2017. Płynność Przy Wycenie Akcji Na Giełdzie Papierów Wartościowych w Warszawie. Ruch Prawniczy, Ekonomiczny i Socjologiczny 79: 127–41. [Google Scholar] [CrossRef] [Green Version]
- Xu, Yuanyuan, Jian Li, Linjie Wang, and Chongguang Li. 2022. Liquidity of China’s agricultural futures market: Measurement and cross-market dependence. China Agricultural Economic Review, ahead-of-print. [Google Scholar]
- Zhang, Dayong, Min Hu, and Qiang Ji. 2020. Financial Markets under the Global Pandemic of COVID-19. Finance Research Letters 36: 101528. [Google Scholar] [CrossRef] [PubMed]
Figure 1.
WIG20 changes between December 2019 and June 2020 (key moments marked). Source: own elaboration based on the WSE data.
Figure 1.
WIG20 changes between December 2019 and June 2020 (key moments marked). Source: own elaboration based on the WSE data.

Figure 2.
Turnover in 5 min time intervals in Periods 1, 2 and 3. Source: own elaboration.

Figure 3.
The transaction average value in 5 min time intervals in Periods 1, 2 and 3. Source: own elaboration.
Figure 3.
The transaction average value in 5 min time intervals in Periods 1, 2 and 3. Source: own elaboration.

Figure 4.
Time distance between transactions in 5 min time intervals in Periods 1, 2 and 3. Source: own elaboration.
Figure 4.
Time distance between transactions in 5 min time intervals in Periods 1, 2 and 3. Source: own elaboration.

Figure 5.
Percentage distance between transactions in 5 min time intervals in Periods 1, 2 and 3. Source: own elaboration.
Figure 5.
Percentage distance between transactions in 5 min time intervals in Periods 1, 2 and 3. Source: own elaboration.


Table 1.
Turnover value of transactions in the first minutes of the session, in absolute (PLN) and relative terms.
Table 1.
Turnover value of transactions in the first minutes of the session, in absolute (PLN) and relative terms.
| Data | Period 1 | Period 2 | Period 3 | |
|---|---|---|---|---|
| Value | First minute (M1) | 263,746,689.17 | 540,641,475.30 | 516,385,355.91 |
| First five minutes (M5) | 537,539,837.56 | 1,095,353,523.02 | 1,034,603,648.34 | |
| Continuous trading phase (CT) | 21,265,524,794.31 | 29,397,949,841.01 | 25,029,530,275.01 | |
| Trading-at-last (TL) | 3,374,133,211.27 | 4,515,754,203.99 | 3,304,741,228.59 | |
| Ratio | M1/CT | 1.24% | 1.84% | 2.06% |
| M5/CT | 2.53% | 3.73% | 4.13% | |
| TL/(CT+TL) | 13.69% | 13.32% | 11.66% | |
Source: own elaboration.
Table 2.
Number of transactions in the first minutes of the session, in absolute and relative terms.
Table 2.
Number of transactions in the first minutes of the session, in absolute and relative terms.
| Period 1 | Period 2 | Period 3 | |
|---|---|---|---|
| First minute (M1) | 56,708 | 112,297 | 100,957 |
| First five minutes (M5) | 90,590 | 194,716 | 182,308 |
| Continuous trading phase (CT) | 2,307,175 | 4,449,096 | 3,675,064 |
| Trading-at-last (TL) | 81,189 | 108,975 | 90,434 |
| M1/CT | 2.46% | 2.52% | 2.75% |
| M5/CT | 3.93% | 4.38% | 4.96% |
| TL/(CT+TL) | 3.40% | 2.39% | 2.40% |
Source: own elaboration.
Table 3.
Summary information for the average transactions value in particular periods (in PLN).
| Period 1 | Period 2 | Period 3 | |
|---|---|---|---|
| First minute (M1) | 4650.96 | 4814.39 | 5114.90 |
| First five minutes (M5) | 5933.77 | 5625.39 | 5675.03 |
| Continuous trading phase (CT) | 9217.13 | 6607.62 | 6810.64 |
| Trading-at-last (TL) | 41,558.99 | 41,438.82 | 36,543.13 |
Source: own elaboration.
Table 4.
Average number of transactions and standard deviations over a 5 min interval depending on the moment of the session.
Table 4.
Average number of transactions and standard deviations over a 5 min interval depending on the moment of the session.
| Mean | Standard Deviation | |||||||
|---|---|---|---|---|---|---|---|---|
| Period 1–Period 3 | Period 1 | Period 2 | Period 3 | Period 1–Period 3 | Period 1 | Period 2 | Period 3 | |
| F5 | 5649 | 3020 | 6703 | 7069 | 10,054 | 5146 | 11,851 | 11,404 |
| CL | 1271 | 782 | 1548 | 1467 | 1901 | 979 | 2473 | 1927 |
| L5 | 2833 | 1988 | 3086 | 3362 | 4932 | 3407 | 5575 | 5499 |
Source: own elaboration.
Table 5.
Comparison of the number of transactions at the particular moment of the session (Friedman’s test results).
Table 5.
Comparison of the number of transactions at the particular moment of the session (Friedman’s test results).
| Period 1–Period 3 | Period 1 | Period 2 | Period 3 | |
|---|---|---|---|---|
| F5 | 2.68 | 2.77 | 2.52 | 2.74 |
| Cl | 1.52 | 1.43 | 1.55 | 1.56 |
| L5 | 1.81 | 1.8 | 1.93 | 1.71 |
| Chi-square | 67.935 | 28.467 | 13.724 | 27.941 |
all significant at 0.01 (also in the Monte Carlo approach). Source: own elaboration.
Table 6.
Pairwise comparison of the number of transactions at a particular moment in the session (Wilcoxon test results).
Table 6.
Pairwise comparison of the number of transactions at a particular moment in the session (Wilcoxon test results).
| Period 1–Period 3 | Period 1 | Period 2 | Period 3 | |
|---|---|---|---|---|
| F5/L5 | −7.069 | −4.576 | −3.146 | −4.616 |
| CL/L5 | −3.473 | −2.047 * | −2.216 * | −1.633 ** |
| CL/F5 | −7.265 | −4.535 | −3.579 | −4.419 |
* significant at 0.05; ** significant at 0.1; otherwise significant at 0.01. The results were the same in the Monte Carlo approach. Source: own elaboration.
Publisher’s Note: MDPI stays neutral with regard to jurisdictional claims in published maps and institutional affiliations. |
© 2022 by the authors. Licensee MDPI, Basel, Switzerland. This article is an open access article distributed under the terms and conditions of the Creative Commons Attribution (CC BY) license (https://creativecommons.org/licenses/by/4.0/).
Share and Cite
MDPI and ACS Style
Kubiczek, J.; Tuszkiewicz, M. Intraday Patterns of Liquidity on the Warsaw Stock Exchange before and after the Outbreak of the COVID-19 Pandemic. Int. J. Financial Stud. 2022, 10, 13. https://doi.org/10.3390/ijfs10010013
AMA Style
Kubiczek J, Tuszkiewicz M. Intraday Patterns of Liquidity on the Warsaw Stock Exchange before and after the Outbreak of the COVID-19 Pandemic. International Journal of Financial Studies. 2022; 10(1):13. https://doi.org/10.3390/ijfs10010013
Chicago/Turabian StyleKubiczek, Jakub, and Marcin Tuszkiewicz. 2022. "Intraday Patterns of Liquidity on the Warsaw Stock Exchange before and after the Outbreak of the COVID-19 Pandemic" International Journal of Financial Studies 10, no. 1: 13. https://doi.org/10.3390/ijfs10010013
Note that from the first issue of 2016, this journal uses article numbers instead of page numbers. See further details here.