Review

Forecasting Stock Market Prices Using Machine Learning and Deep Learning Models: A Systematic Review, Performance Analysis and Discussion of Implications

by
Gaurang Sonkavde
1,
Deepak Sudhakar Dharrao
2,*,
Anupkumar M. Bongale
1,*,
Sarika T. Deokate
3,
Deepak Doreswamy
4 and
Subraya Krishna Bhat
5
1
Department of Artificial Intelligence and Machine Learning, Symbiosis Institute of Technology, Symbiosis International Deemed University, Pune 412115, Maharashtra, India
2
Department of Computer Science & Engineering, Symbiosis Institute of Technology, Symbiosis International Deemed University, Pune 412115, Maharashtra, India
3
Department of Computer Engineering, Pimpri Chinchwad College of Engineering, Pune 411044, Maharashtra, India
4
Department of Mechatronics, Manipal Institute of Technology, Manipal Academy of Higher Education, Manipal 576104, Karnataka, India
5
Department of Mechanical and Industrial Engineering, Manipal Institute of Technology, Manipal Academy of Higher Education, Manipal 576104, Karnataka, India
*
Authors to whom correspondence should be addressed.
Int. J. Financial Stud. 2023, 11(3), 94; https://doi.org/10.3390/ijfs11030094
Submission received: 22 April 2023 / Revised: 13 July 2023 / Accepted: 19 July 2023 / Published: 26 July 2023

Abstract

:
The financial sector has greatly impacted the monetary well-being of consumers, traders, and financial institutions. In the current era, artificial intelligence is redefining the limits of the financial markets based on state-of-the-art machine learning and deep learning algorithms. There is extensive use of these techniques in financial instrument price prediction, market trend analysis, establishing investment opportunities, portfolio optimization, etc. Investors and traders are using machine learning and deep learning models for forecasting financial instrument movements. With the widespread adoption of AI in finance, it is imperative to summarize the recent machine learning and deep learning models, which motivated us to present this comprehensive review of the practical applications of machine learning in the financial industry. This article examines algorithms such as supervised and unsupervised machine learning algorithms, ensemble algorithms, time series analysis algorithms, and deep learning algorithms for stock price prediction and solving classification problems. The contributions of this review article are as follows: (a) it provides a description of machine learning and deep learning models used in the financial sector; (b) it provides a generic framework for stock price prediction and classification; and (c) it implements an ensemble model—“Random Forest + XG-Boost + LSTM”—for forecasting TAINIWALCHM and AGROPHOS stock prices and performs a comparative analysis with popular machine learning and deep learning models.

1. Introduction

The performance of a country’s financial market is a crucial determinant of its overall economic condition, enabling economists and financial experts to gauge the country’s current economic health. Among the various financial markets, the stock market stands out as a key driving force. A country’s economic situation directly or indirectly impacts sectors such as finance, agriculture, metal, and investment banking, among others. The growth of these sectors hinges on their volatility, which follows the fundamental principle of supply and demand. The demand for a particular sector directly influences the stock market, with increased supply prompting traders and financial institutions to invest in that sector or stock, driving up prices. Additionally, regular dividend payments contribute to the generation of profits and returns on invested capital. It is imperative for investors to identify the opportune moment to sell shares and achieve their desired returns. Financial markets encompass various types of market, including stock markets, derivatives markets, bond markets, and commodity markets (Obthong et al. 2020). The stock market serves as a platform for investors to invest in and own a portion or fraction of a company. As companies grow, they often require additional funding to support their future endeavors. Following the approval of current shareholders, who face diluted ownership due to the issuance of new shares, companies can sell these shares to investors to raise capital. Successful outcomes result in increased stock market value for the shares.
Shares listed on the stock market can be bought for both short-term and long-term investment strategies. Long-term investment involves holding shares over an extended period, while short-term investments involve buying and selling shares within shorter timeframes, with investors aiming for profits within days or weeks. Traders employ a wide range of trading strategies, including swing trading, day trading, position trading, and scalping (Mann and Kutz 2016).
Due to the unpredictable nature of the stock market, it is highly difficult for individuals to obtain returns on their investments. Primary, fundamental, and technical analysis are popular approaches to understanding market trends (Manish and Thenmozhi 2014), but they possess inherent limitations due to the involvement of lagging indicators and prediction inaccuracy. This has motivated researchers to develop improved techniques for real-time market scenarios based on machine learning and deep learning models. In the current era, machine learning and deep learning algorithms offer substantial advantages over traditional techniques such as technical and fundamental analysis. Leveraging the power of machine learning and artificial intelligence, these algorithms facilitate the forecasting of stock prices and indices. Machine learning serves as an additional approach alongside technical and fundamental analysis, with the combination of these tools forming a powerful trading platform. Machine learning models can provide solutions to problems such as stock price forecasting and classification, portfolio management, algorithmic trading, stock market sentiment analysis, risk assessment, etc. Of these problems, this review article is focused on exploring different approaches described for stock price forecasting and classification.
The typical steps of a machine learning model pipeline for predicting stock price involve several phases: collecting historical data via an API, pre-processing the data, creating a forecasting model, and evaluating the model. Pre-processing entails removing zero values, eliminating duplicates, and scaling features. Subsequently, important features are shortlisted, and valid data are selected for stock price prediction or forecasting (Raghavendra et al. 2021). In this article, numerous popular machine learning and deep learning algorithms, such as linear regression, random forest, logistic regression, k-nearest neighbor, support vector machine, naïve Bayes, ARIMA (autoregressive integrated moving average), FB Prophet (Facebook Prophet), LSTM (long short-term memory), GRU (gated recurrent network), as well as ensemble algorithms such as random forest and XG-Boost (extreme gradient boosting), are described (Zhong and Enke 2019; Sidra and Sen 2020; Parray et al. 2020). For evaluating a classification model’s accuracy, recall, precision, and F-score, are commonly preferred metrics, and for regression or price forecasting models, root mean square error (RMSE) and mean absolute percentage error (MAPE) are often employed (Jose et al. 2019).
There are a significant number of review articles on stock price prediction and forecasting (Polamuri et al. 2019; Kumar et al. 2021; Soni et al. 2022). But due to the boom in artificial intelligence and machine learning, the frequency of publications has increased considerably. Hence, this review article presents recent state-of-the-art machine learning and deep learning techniques for stock price prediction. The salient contributions and uniqueness of this review article are listed below:
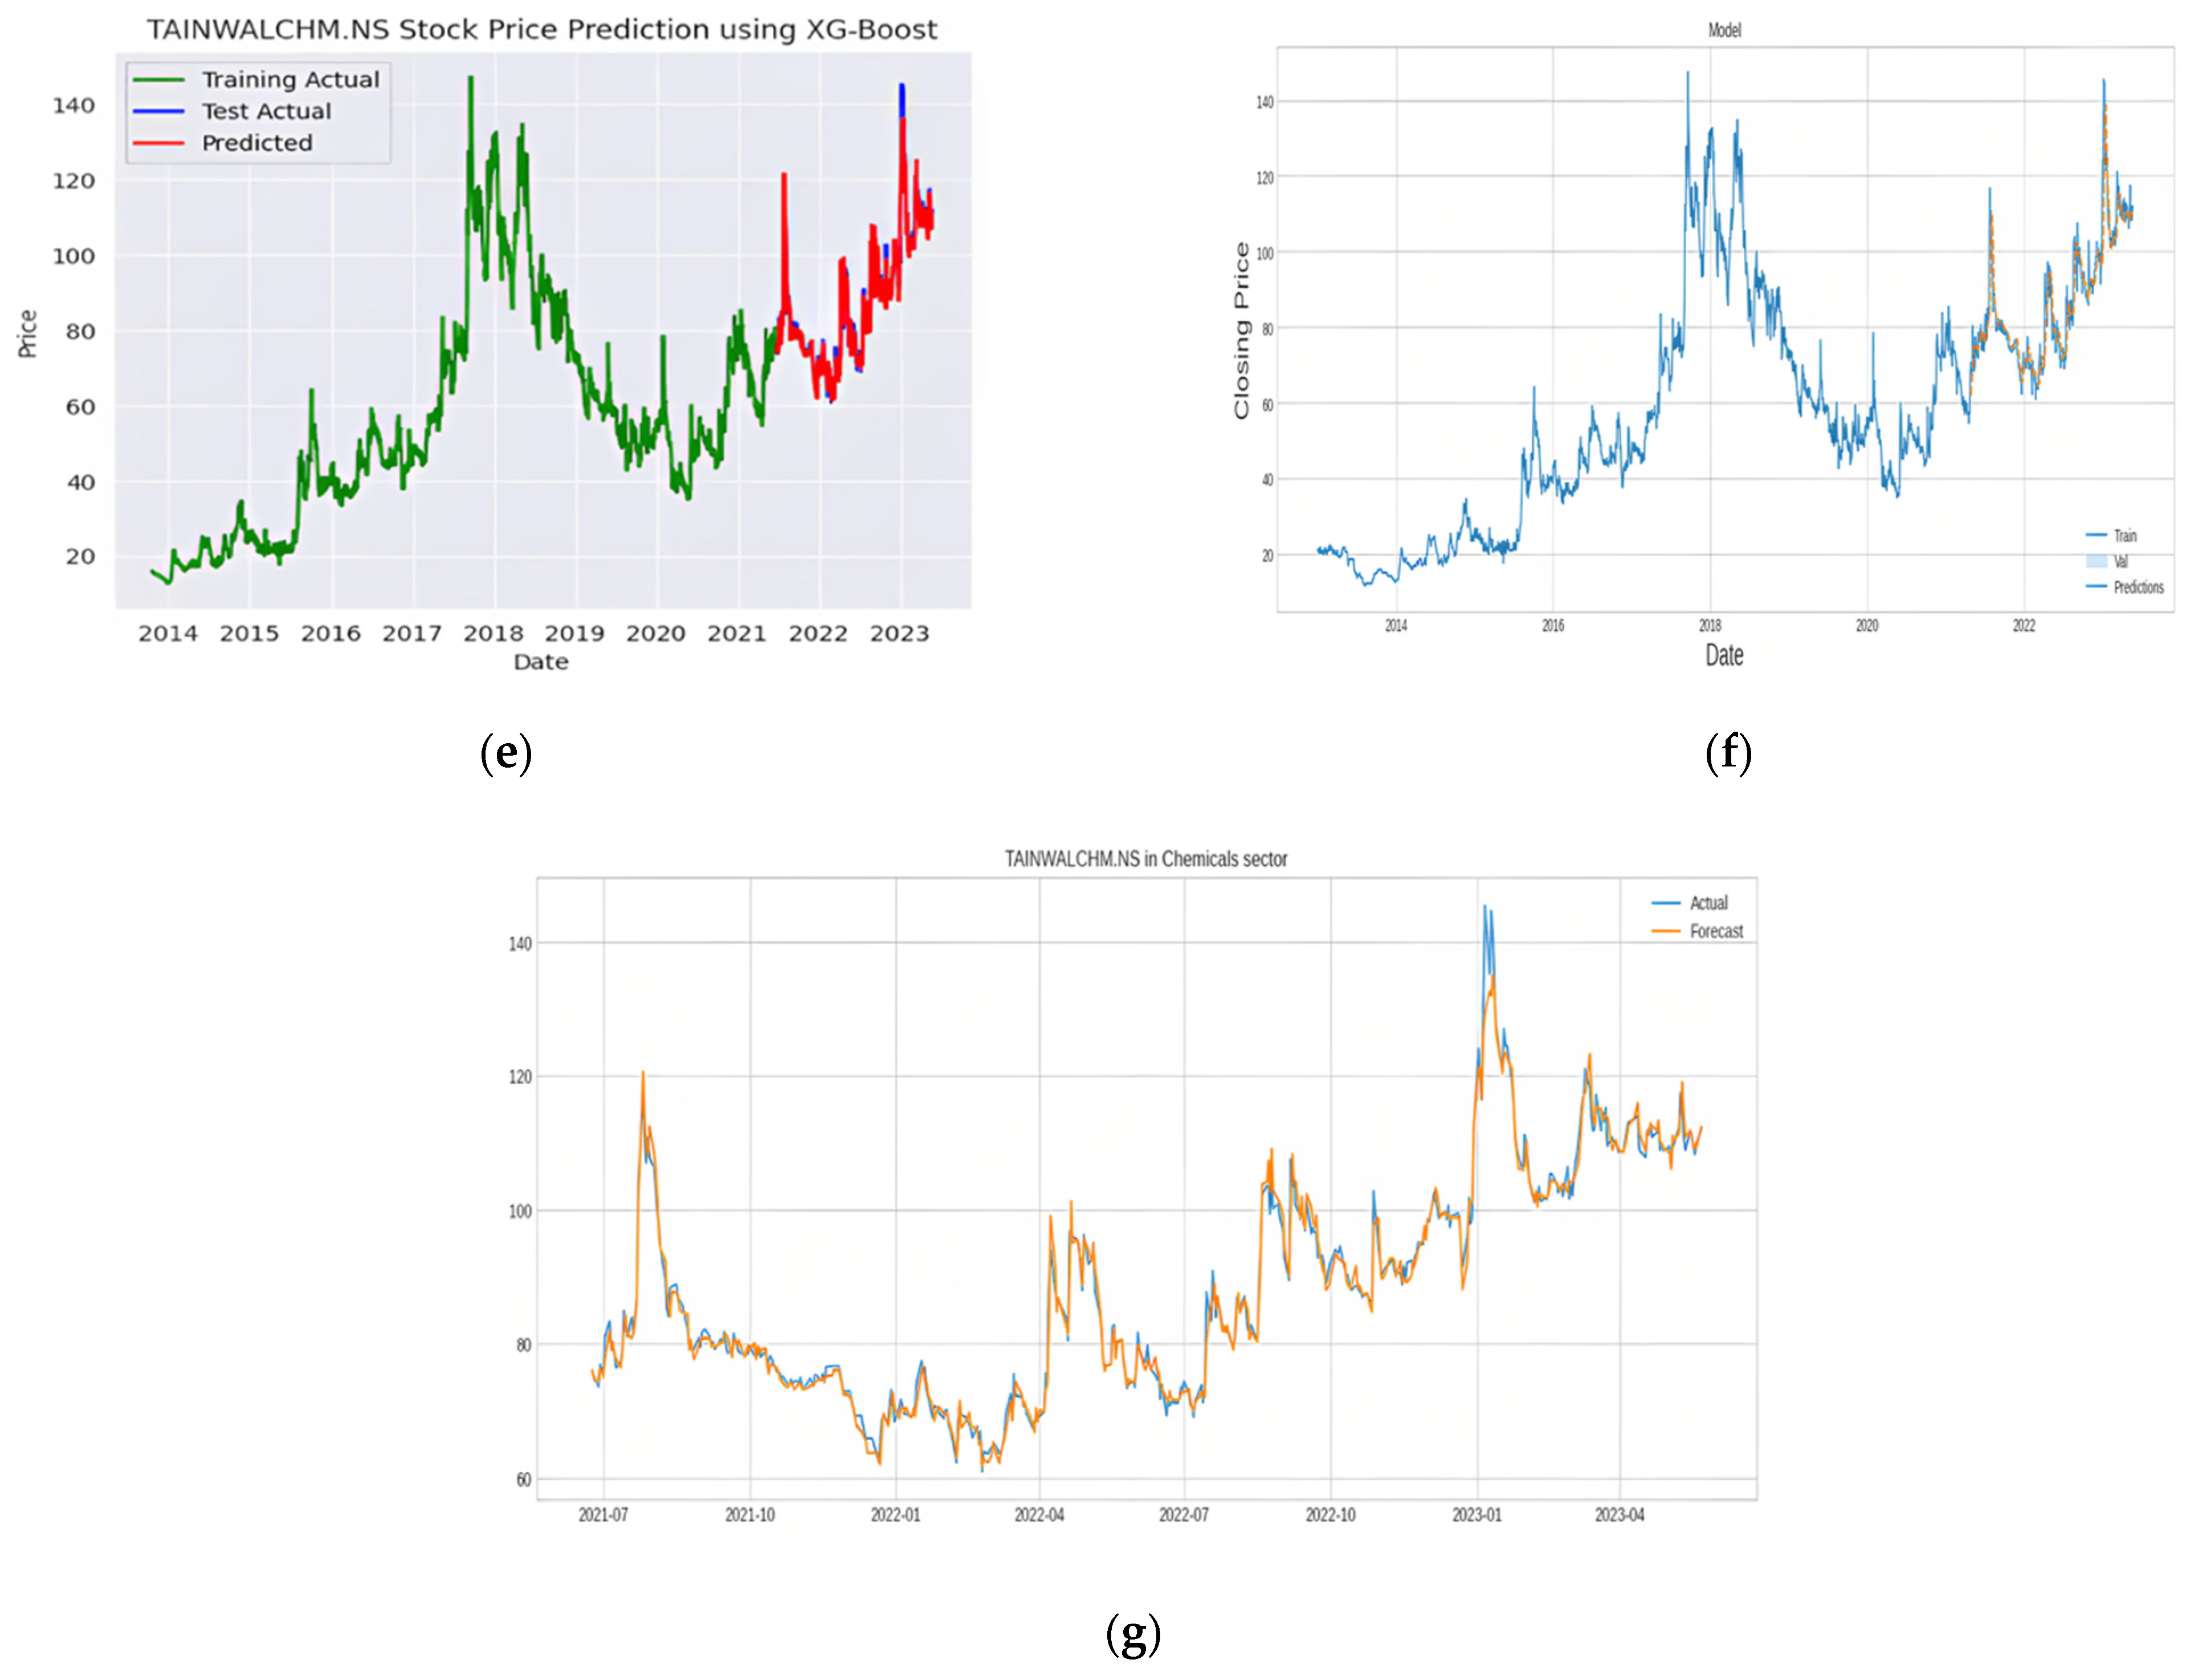
  • One of the unique contributions of this review article is that it is not just limited to summarizing the research articles. Extra effort is put into implementing the well-known machine learning and deep learning models to understand their nature and performance. Along with our review, a comparative analysis of various algorithms is presented in this article. The machine learning and deep learning ensemble algorithms are tested on TAINIWALCHM and AGROPHOS stock data, which fall under the umbrella of the chemical industry market sector.
  • In this review article, detailed future research directions are included. Future research avenues for researchers are identified based on the conducted study stock trend analysis and classification, pattern identification, and candlestick chart pattern analysis using computer vision.
The rest of the article is organized as follows. Section 2 describes the complete theoretical background of machine learning and deep learning models. A generic structure of the machine learning modeling pipeline is presented in Section 3. The importance of the ensemble model “Random Forest + XG-Boost + LSTM” for forecasting TAINIWALCHM and AGROPHOS stock prices and a comparative analysis with popular machine learning and deep learning models are mentioned in Section 4. Section 5 discusses the implications and limitations of the current review. Future research directions are given in Section 6. Finally, the paper is concluded in Section 7.

2. Comprehensive Summary of Theoretical Basis

Forecasting stock prices and predicting market trends are challenging tasks. Over the years, researchers have proposed several solutions to these challenges (Obthong et al. 2020; Hu et al. 2021; Polamuri et al. 2019), and these methods are briefly explained below. Machine learning, deep learning, time series forecasting, and ensemble algorithms are some of the most popular approaches to solving the mentioned problems. Ensemble algorithms can improve accuracy and reduce RMSE. Hadoop architectures can also handle large volumes of stock data (Jose et al. 2019) and deep learning algorithms can predict financial markets (Hu et al. 2021). Stock forecasting using LSTM, a unique recurrent neural network (RNN), overcomes long-term dependency (Qiu et al. 2020; Banik et al. 2022). But the vanishing gradient and exploding gradient problems often need to be addressed in RNN-based architectures (Li and Pan 2021; Zhu 2020). Khan et al., in (Khan et al. 2020), used Pyspark, MLlib, linear regression, and random forest to achieve 80–98% accuracy.
Multiple algorithms have been used to forecast stock prices, including neural networks, which train data on layers of connected neurons, and support vector machines, which predict stock price movement using hyperplanes. Random forest, trained on multiple decision trees and Naïve Bayes, predicts stock movement based on negative or positive probability using Reliance and Infosys’ 10-year historical data (Patel et al. 2015). Random forest is compared to other algorithms on 5767 European companies. These algorithms include neural networks, which are multiple layers of neurons connected with each other; logistic regression, which outputs a binary value to predict whether the stock will move up or down based on probability; support vector machines; and K-Nearest neighbor, which finds the k nearest data points using Euclidean similarity metrics. Random forest is the best algorithm, followed by SVM (Ballings et al. 2015).
Stock market forecasting is a regression use case because stock prices are continuous (Seethalakshmi 2018). (Di Persio and Honchar 2017), used RNN for forecasting Google stock prices. RNN, LSTM, and GRU are the three most efficient neural networks for sequential data. RNN is used for historical data. LSTM and GRU can avoid the vanishing gradient problem based on forget, reset, and update gates. GRU is found to be faster as it operates on reset and update gates (Di Persio and Honchar 2017).
Another study involves the use of ARIMA, LSTM, and random forest for price forecasting, and XG-Boost, an ensemble learning algorithm like random forest. Based on the evaluation parameters, XG-Boost outperformed ARIMA and LSTM (Zhu and He 2022). Isaac et al. also used ensemble machine learning to improve stock market forecasting results. Cooperative and competitive classifier algorithms use stacking and blending. Bagging and boosting techniques are used to reduce variance and bias. Most ensemble classifiers and regressors are developed by combining decision trees, support vector machines, and neural networks (Nti et al. 2020). Similarly, (Xu et al. 2020) also used bagging ensemble learning techniques to predict Chinese stocks. This approach combines a two-stage prediction model called “Ensemble Learning SVR and Random Forest (E-SVR&RF)” with KNN to cluster it with ten technical indicators. Another proposed method uses Ensemble LSTM with CNN on stock indexes for training adversarial networks, which can help forecast high-frequency stock and has advantages like adversarial training and reducing direction prediction loss and forecast error loss (Zhou et al. 2018). To enhance the effectiveness of ensemble model of XG-Boost and LSTM, XG-Boost is used to select features applied to high-dimensional time series data and LSTM is used for stock price forecasting (Vuong et al. 2022).
Not only have machine learning ensemble methods helped to improve forecasting performance, but in some research work, it has also been observed that neural network blending ensemble models also perform well. (Yang 2019) implemented a model consisting of two layers of RNN. The first one was an LSTM-based blending ensemble algorithm, and the second one was GRU-based. The model showed the lowest RMSE value of 186.32, a precision of 60%, and an F1-score of 66.47 (Li and Pan 2021).
Sometimes, price movement is primarily affected by sentiments. These sentiments can be positive, leading to a bullish movement, or negative, leading to a bearish movement. Hence, stock sentiment analysis is important to understand stock price forecasting and trend classification. Further, in this section, we explore some forecasting techniques based on sentiment analysis. Social media data, company news, and trend analysis can classify investors’ stock sentiments as positive, negative, or neutral (Yadav and Vishwakarma 2019).
Since stock prices respond to news and global events, price variation alone cannot be used to train ML models. ANN- and LSTM-based deep learning techniques can also be trained using price values and text data. Word2vec and NGram are used to convert text data to numerical data and train the model together with price-sentiment data. Diversified data can predominantly increase accuracy and lower inaccurate results. An algorithm like a random forest approach is also a good choice for Twitter sentiment analysis (Kumar and Ningombam 2018; Reddy et al. 2020).
Financial news and user-generated text, such as comments on social media platforms, can trigger new trends in the stock market. For example, “Monday has the lowest average return” shows a statement representing a weak or negative sentiment.
While creating the dataset for training the model, a rolling window approach on historical data works well with news-based text data. Ren et al. showed an increase in accuracy of up to 18.6% to 89.93% points when multimodal data were considered (Ren et al. 2019).
When text data are collected, they can include correct and fake data. In one study, the authors used feature selection to eliminate fake news and spam tweets collected from social media data. This improved the data quality for training, and a classification algorithm, the random forest algorithm, was used to train the model. Sentiments can be positive, neutral, or negative, which helps people decide whether to buy or sell stock (Baheti et al. 2021). Negative sentiments affect market conditions. Lim et al. considered a use case in which a comparison of two stocks, Tesla and Nio, based on sentiments, was carried out. It was found that negative events, such as Tesla’s 2021 protest, affected its competitor, Nio, as well. This research was based on historical data using time series forecasting with 10, 15, and 20 days of data (Lim and Tan 2021).
In (Sharaf et al. 2022), news headlines pertaining to TSLA, AMZ, and GOOG stock were considered to obtain good-quality data to reduce spam tweets through feature selection methods. Sentiment analysis was also used for polarity detection and historical data mining, for which DL algorithms were used. Similar feature engineering- and deep learning-based approaches are presented in (Shen and Shafiq 2020; Nabipour et al. 2020; Mohapatra et al. 2022).
(Khairi et al. 2019) showed that technical analysis with sentiment analysis can also provide prominent investment opportunities. Technical indicators like stochastic oscillators, moving average convergence divergence (MACD), Bollinger bands, and relative strength indicators (RSI) are good for short-term analysis but not long-term. In cases of negative news, generally, market trends will be bearish, and the stock price will fall. To address this issue, initial sentiment analysis can be performed to find the negative news using PoS (part of speech) tags in the news statement. Programming libraries like SentiWordNet can be used for PoS tagging. This approach has resulted in high profitability and low loss-making situations (Khairi et al. 2019). In another approach proposed by Li et al. (Li and Bastos 2020), a technical analysis of historical data and a fundamental analysis using a deep learning approach were conducted to generate better returns. Here, LSTM is chosen for prediction as it can store memory and does not have a vanishing gradient issue (Li and Bastos 2020). Similar work is presented in (Agrawal et al. 2022; Sathish Kumar et al. 2020; Umer et al. 2019).
Based on the studies presented so far, the best stock market forecasting solution is derived from fundamental analysis and technical analysis with sentiment analysis and deep learning models. Ensemble techniques provide especially promising forecasting outcomes. The algorithms that are used for stock market prediction by considering research papers are given in Figure 1.

2.1. Basic Machine Learning Algorithm

2.1.1. Linear Regression

Linear regression is used for stock or financial market prediction to forecast the future price of stock regression and uses a model based on one or more attributes, such as closed price, open price, volume, etc., to forecast the stock price. Regression modeling aims to simulate the linear relationship between the dependent and independent variables. The linear regression model produces a best-fit line that describes the connection between the independent factors and the dependent variable.
In this technique, a straight line represented by Equation (1) is drawn, ensuring that the line crosses the highest possible number of the dataset’s data points. When charting the dataset’s values on a graph, a straight line is mathematically fitted between the points so that the square of the distance or difference between each point and the line is as small as possible. For each given x, the hypothesis line is used to forecast the value of y. This forecasting method is known as linear regression. For the evaluation of the results and to check how well the model fits the line, parameters such as RMSE, MAE, MSE, and R-squared are used (Gururaj et al. 2019; Dospinescu and Dospinescu 2019).
O = S x + K
where O is the output, S x represents the slope, and K is a constant.

2.1.2. K-Nearest Neighbor (KNN)

KNN is a classification and regression technique and has been termed as a lazy learner because it does not need a huge time period for learning. One of KNN’s advantages is that it is one of the easiest ML algorithms. The only action that needs to be taken for KNN is to calculate the value of K and the Euclidean distance. This algorithm’s slow learning aspect makes it quicker than other algorithms. It may not generalize well for big data since it skips the learning step (Tanuwijaya and Hansun 2019). The euclidean distance calculation is given in Equation (2),
D ( h i , p r ) = l ¨ = 1 n ( P r h i ) 2
where Pr represents the predicted value and hi represents the data value.

2.1.3. Support Vector Machine (SVM)

Stock market prediction using an SVM can be the most useful technique for predicting stock price, as it can be used as a classification and regression algorithm. The comparison of SVM and its variants, such as “Peeling + SVM” and “CC + SVM”, shows that its prediction can be improved by advanced SVM methods (Grigoryan 2017). A support vector machine involves supervised learning used to categorize aspects using a separator. The separator is then discovered when the data are initially mapped to a high-dimensional feature space. It finds the categorization of data points occurring in an n-dimensional space and finds the optimal hyperplane. The data points are grouped according to their location in relation to the hyperplanes. The performance of the SVM algorithm can be elevated by tuning parameters such as regularization, gamma, and kernel parameters (Bustos et al. 2017). SVM can also be used for sentiment analysis to assess investors’ sentiments, which would indirectly affect market conditions. It is well suited to both high-dimensional datasets and small-scale datasets.

2.1.4. Naïve Bayes Algorithm

Naïve Bayes is a supervised machine learning technique that can be used to forecast prices of various stocks in research on banking stock.
Naïve Bayes is a classification algorithm in which a combination of probability summing up the frequencies and value combinations is taken from a dataset. Depending on the values of the class variables, the Bayes theorem makes an assumption regarding whether the attributes of naïve Bayes are independent or interdependent. The basic concept of naïve Bayes is that attribute values are independent in the presence of an output value (Setiani et al. 2020). The set up GNB models were graded based on their performance using Kendall’s test of concordance for several assessment parameters. The outcomes showed that the GNB LDA predictive model (Kardani et al. 2020) performed better than all other GNB models. The posterior probability was calculated as shown in Equation (3) (Ampomah et al. 2021).
P ( H | U ) = P ( U | H ) P ( H ) P ( U )
where   U   is unknown class data, H is the hypothesis for data of certain class, P ( H ) is the hypothesis probability, P ( U | H )   is the probability of U being dependent on the condition in hypothesis H , and   P ( U ) is the probability of U .
The formula for naïve Bayes used in stock prediction is given by Equation (4):
P ( A i = a 1 | B = b i ) = 1 2 π e ( a i µ i j ) 2 2 4 i j ˙
where π represents pi (3.14), e is the exponential (2.7183), µ represents the mean, and € is the standard deviation.

2.1.5. Logistic Regression

Logistic regression is a supervised method of machine learning. By utilizing variables for logistic curves, logistic regression groups several independent factors into two or more mutually exclusive groups and forecasts the likelihood of equities that perform well (Ali et al. 2018). To classify stock performance using logistic regression, the maximum likelihood is calculated as per Equation (5):
Z i t = β 1 + β 2 E P S i t + β 2 P B i t + β 2 R O E i t + β 2 C R i t + β 2 D E i t + β 2 s a l e s i t + V i t
where z = l o g l o g   ( P r 1 P r )   and P r = probability of outcome is positive.
There are variants, such as binary logistic regression, that can improve finance ratios and investors’ ability to anticipate stock price (Smita 2021).

2.2. Forecasting of Stock Market Using Time Series Forecasting

Stock price data are time series data. Some of the classical methods, such as autoregressive moving average (ARIMA) and FB Prophet, are discussed in this subsection. These methods were very well adopted before the success of deep learning models.

2.2.1. ARIMA

ARIMA is an algorithm that uses time series forecasting to predict the future value of stocks. In a study presented by Tamerlan et al., in (Mashadihasanli 2022), it is demonstrated that the ARIMA model best fits the stock market index. The ARIMA model comprises three steps—identify, estimate, and diagnose. These steps can be used for forecasting any finance market such as equity, derivative, etc. (Mashadihasanli 2022). ARIMA can be combined with another algorithm, symmetric generalized autoregressive conditional heteroskedasticity (SGARCH), to improve forecasting performance. This combination has been modeled and tested on the S&P500 Index (Vo and Ślepaczuk 2022). ARIMA has even been extended for stock sentiment analysis (Kedar 2021).
The formula of ARIMA, which combines AR (autoregression) and MA (moving average), is shown in Equation (6),
y ( t ) = k + β p * ω D   y t 1   + +   β p * ω D y t p + θ 1 ε t 1 + + θ q * ε ( t i q ) + ε t i
where p represents the autoregressive model’s given degree, D is the degree of different orders, and q is the moving average’s given degree.

2.2.2. FB Prophet Model

FB Prophet is a time series forecasting library developed by Facebook. FB Prophet better suits data that have a null value and it relatively shows more accurate results in such situations. The formula of FB Prophet is presented in Equation (7):
Y t = l ( t ) + s p ( t ) + v ( t ) + ε t ,   y   t = g ( t ) + s ( t ) + h ( t ) + ε n
where l ( t ) represents the linear trend, s p ( t ) represents seasonal patterns, v ( t ) represents holiday effects, and ε n is the white noise error. The algorithm designed based on FB Prophet is implemented using the PyStan library (Suresh et al. 2022). Researchers have extensively used FB Prophet in stock price forecasting (Kaninde et al. 2022; Shahi et al. 2020).

2.3. Deep Learning Methods

Deep learning models have wide-ranging popularity in many areas of science and engineering. They are especially widely adopted in stock price forecasting and trend prediction due to their ability to capture complex patterns, handle large volumes of data, and undertake feature learning and representation, and their adaptability to changing market conditions. In this subsection, some of the popular deep learning models are discussed in relation to the finance domain.

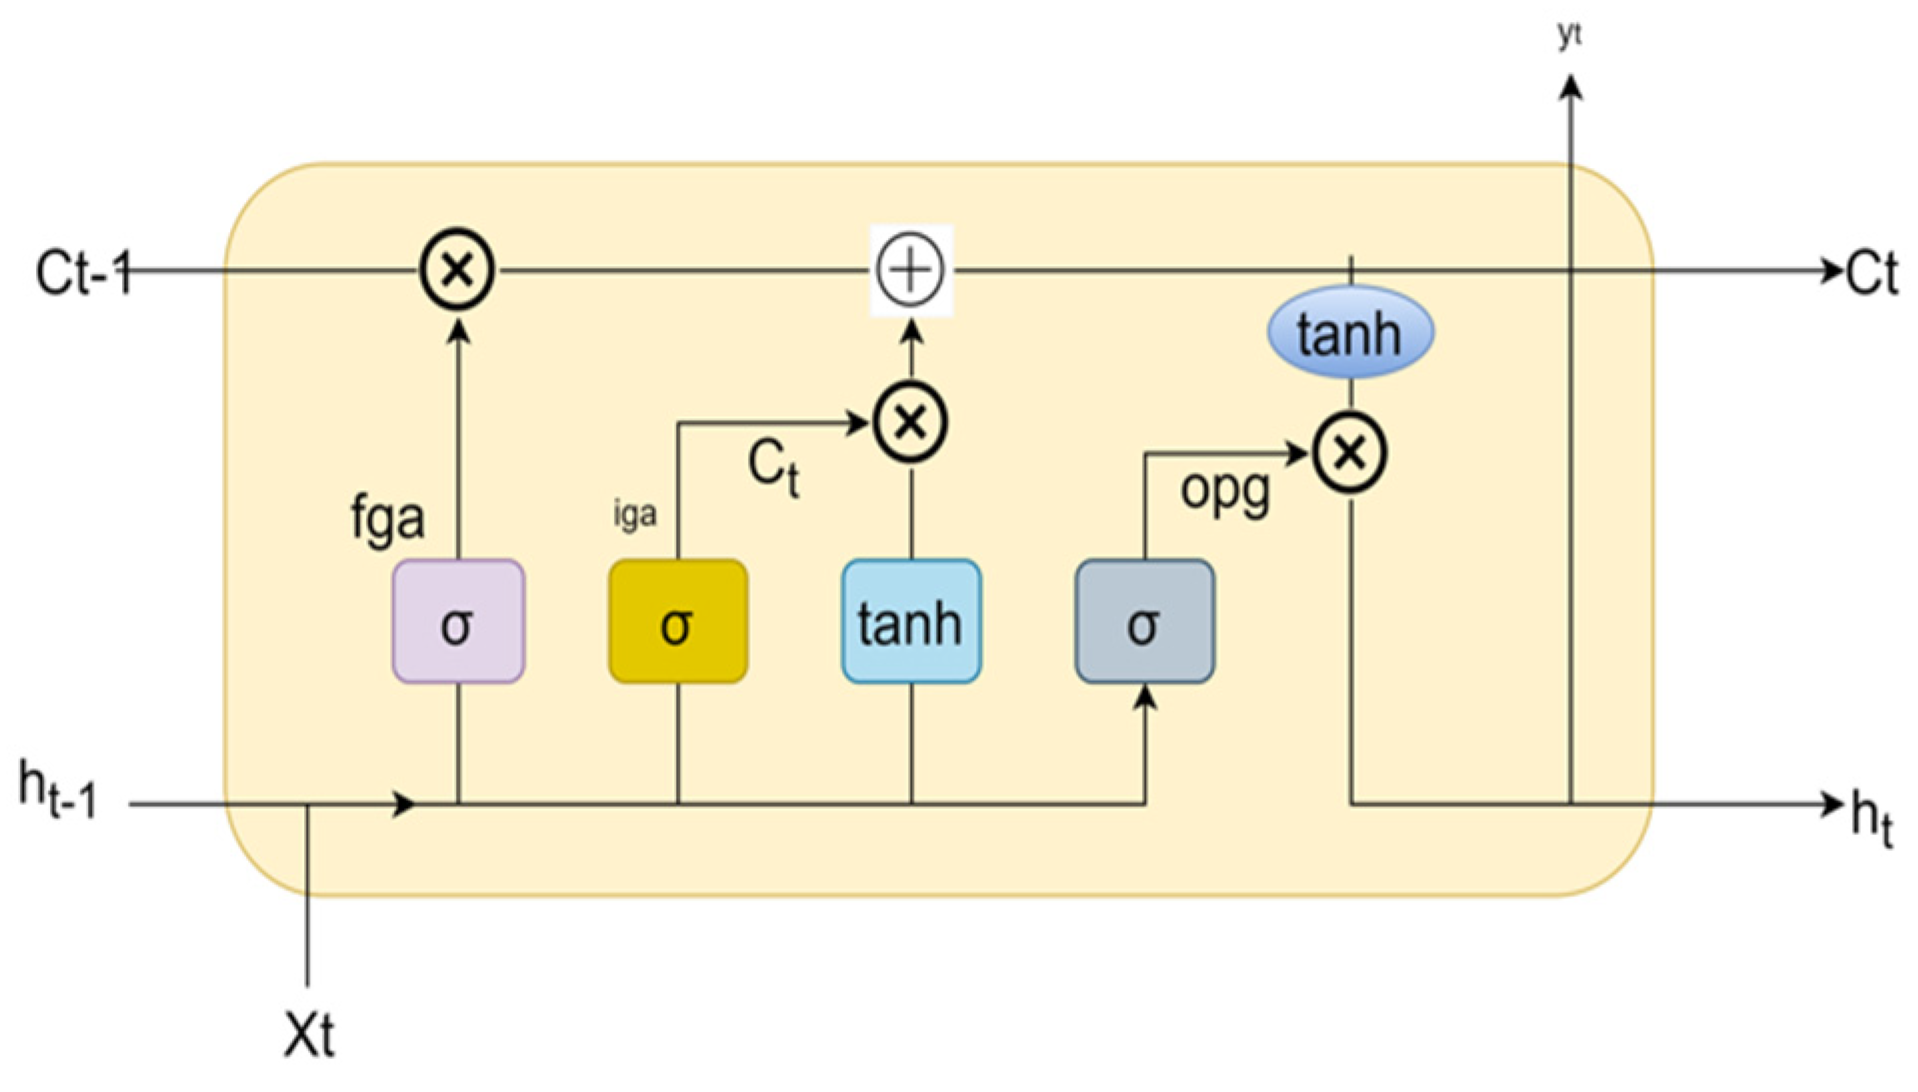
2.3.1. Long Short-Term Memory (LSTM)

LSTM is an advanced model of Recurrent Neural Networks (RNNs), a deep learning algorithm. An LSTM model can handle lengthy sequences of data units as it can remember the data sequence, which can be used for future inputs. Figure 2 shows a general LSTM cell structure. It comprises three gates—the input gate, the forget gate, and the output gate. All of the gates employ the sigmoid activation function. All of the gates used in the LSTM are mathematically represented as per Equations (8)–(10).
Input gate (New information in cell state):
i g a = σ   ( W i p   [ h t 1 ,   X c ] + b i )
Forget gate (useless information is eliminated):
f g a = σ   ( W f g   [ h t 1 ,   X c ] + b f )
Output gate (activation to last block of final output):
O p g = σ   ( W o p   [ h t 1 ,   X c ] + b o )
where σ is sigmoid,   W x   is the neuron gate ( x ) weight, h t 1 is the result of the preceding LSTM block, X t is the input, and b x is bias.
As shown in Figure 2, the top part of the memory line in every cell can be used to connect with the transport line with the help of the model, which can be used to handle the data from the prior memory to the current memory. Each LSTM node should have a set of cells that is used for storage of the data stream (Pramod and Pm 2021). In order to provide a recursive network with plenty of time to train and allow for the creation of a long-distance causal link, LSTM maintains errors at a more constant level (Mukherjee et al. 2021). In several cases, neural networks and deep neural networks have shown superior forecasting performance compared to other machine learning models. However, when it comes to predicting financial distress, the logistic regression model has exhibited better results in comparison to neural networks (Zizi et al. 2021).

2.3.2. Gated Recurrent Neural Network (GRU)

A GRU is yet another RNN-based model with comparable differences to LSTM. It is computationally efficient and faster to train than LSTM, while capturing long-term dependencies in sequential data. GRU utilizes gating mechanisms to control the flow of information between the current and previous time steps. However, it utilizes only two gates, a reset gate and an update gate, whereas LSTM has three gates. Figure 3 shows the general structure of a GRU.
The two gates that GRU uses are:
(1)
Update gate
Z [ t ] = σ   ( W ( z ) x t + U ( z ) h t 1 )
(2)
Reset gate
r [ t ] = σ   ( W ( r ) x t + U ( r ) h t 1 )
where Z [ t ] is update gate,   r [ t ] is reset gate, σ represents sigmoid function, W ( x ) is neuron gate, U ( x ) is previous weight, ht−1 is the result of the preceding GRU block, and x t   is the current input.
For stock price data, GRU receives the input as a sequence of historical stock prices and generates the output as a sequence of predicted stock prices. The input sequence is fed through the GRU network, which updates its internal state at each time step, and the network’s final state is used to generate the output (Di Persio and Honchar 2017) Both LSTM and GRU have their advantages due to their capability to eliminate the vanishing gradient problem and blend deep ensemble algorithms (Li and Pan 2021).

2.4. Ensemble Learning Methods

2.4.1. Random Forest Algorithm

Random forest is a supervised learning method and employs a technique called ensemble learning. It works well for both classification and regression use cases. It is derived from the concept of a decision tree as it creates several decision trees to provide results (Kaczmarek and Perez 2021). The process of random forest is shown in Figure 4. The generic steps of a random forest algorithm applied to stock market prediction (Yadav and Vishwakarma 2019) are:
Step 1: N random records are picked.
Step 2: A decision tree is built based on N inputs.
Step 3: The number of trees to be considered is picked.
Step 4: Based on the steps performed before, the output is predicted for each tree.
Random forest can perform well on large datasets, but the possibility of the formation of large number of trees can slow down the algorithm’s performance (Salles et al. 2018). The random forest approach can also be used for various other use cases, such as predicting the direction of stocks (Sadorsky 2021). This algorithm is used in the Zagreb Stock Exchange (Manojlović and Štajduhar 2015) and is compared with SVM, KNN, and logistic regression based on the evaluation parameters accuracy, precession, recall, and F-Score (Pathak and Pathak 2020).

2.4.2. XG-Boost Regression Algorithm

XG-Boost is an ensembled machine learning algorithm that is like random forest with subtle differences. It is a combination of weak learners such as decision trees. It is a good prediction model for stock forecasting as it works on a sequential model that considers the gradient for each iteration so that the weights are updated for each iteration of the decision tree (Zhu and He 2022). The process of XG-Boost is depicted in Figure 5.

2.4.3. E-SVR-RF (Ensemble Support Vector Machine–Random Forest)

Ensemble support vector regression with random forest is an ensemble technique that follows the bagging method. An ensemble learning algorithm that consists of a support vector regressor and random forest is used to handle the complex relationship for each cluster and individual forecast. These are finally combined using the bagging method to show the final prediction using a weighted average model (Xu et al. 2020). The suggested ensembling can leverage the advantages of both the support vector machine and random forest, where the support vector machine can capture complex relationships by finding the hyperplane that maximizes the margin between the forecasted and actual price, and random forest decreases the overfitting problem by combining the decision trees.
XG-Boost + LSTM, blending ensemble (LSTM + GRU) (Li and Pan 2021), and ensemble techniques for sentiment analysis (Gite et al. 2023) are proposed by the research community for financial instrument price forecasting. To summarize further, based on our review, it can be understood that deep learning- and machine learning-based ensemble techniques have gained popularity due to their performance.

3. General Machine Learning Pipeline

The general approach to training a machine learning model is given in Figure 6:
Training the ML model involves six steps, which are described in the following section:
Step 1: Load the data from a csv file or call the historical data with the help of an API. (examples: Yahoo Finance, Quandl, IEXFinance, etc.).
Step 2: Preprocess the historical data to remove any redundancies, null values, etc. and feature selection should be conducted.
Step 3: Before training the ML model, features such as open, close, adj close, volume, etc., can be selected along with secondary data.
Step 4: Divide the preprocessed data into training and testing data, preferably, where preferably 75% of the data should be used to train the model, while the remaining 25% should be used to evaluate the model’s performance.
Step 5: After splitting the data, use the training data to train the model; then, performance evaluation can be carried out based on the model’s output using the testing data.
Step 6: Once the model is constructed, the model’s respective evaluation parameters for regression or classification can be used to evaluate the model. The evaluation parameters are precision, recall, F1 Score, and accuracy. The mean absolute error, mean square error, root mean squared error, R-squared, chi square, and mean absolute percent error (mean absolute percentage error) can be used.
Step 7: Fine-tune the hyperparameters to improve the evaluation parameters of the model. Following hyperparameter tuning, the model should be evaluated to check for improved prediction parameters, after which the prediction can be plotted.

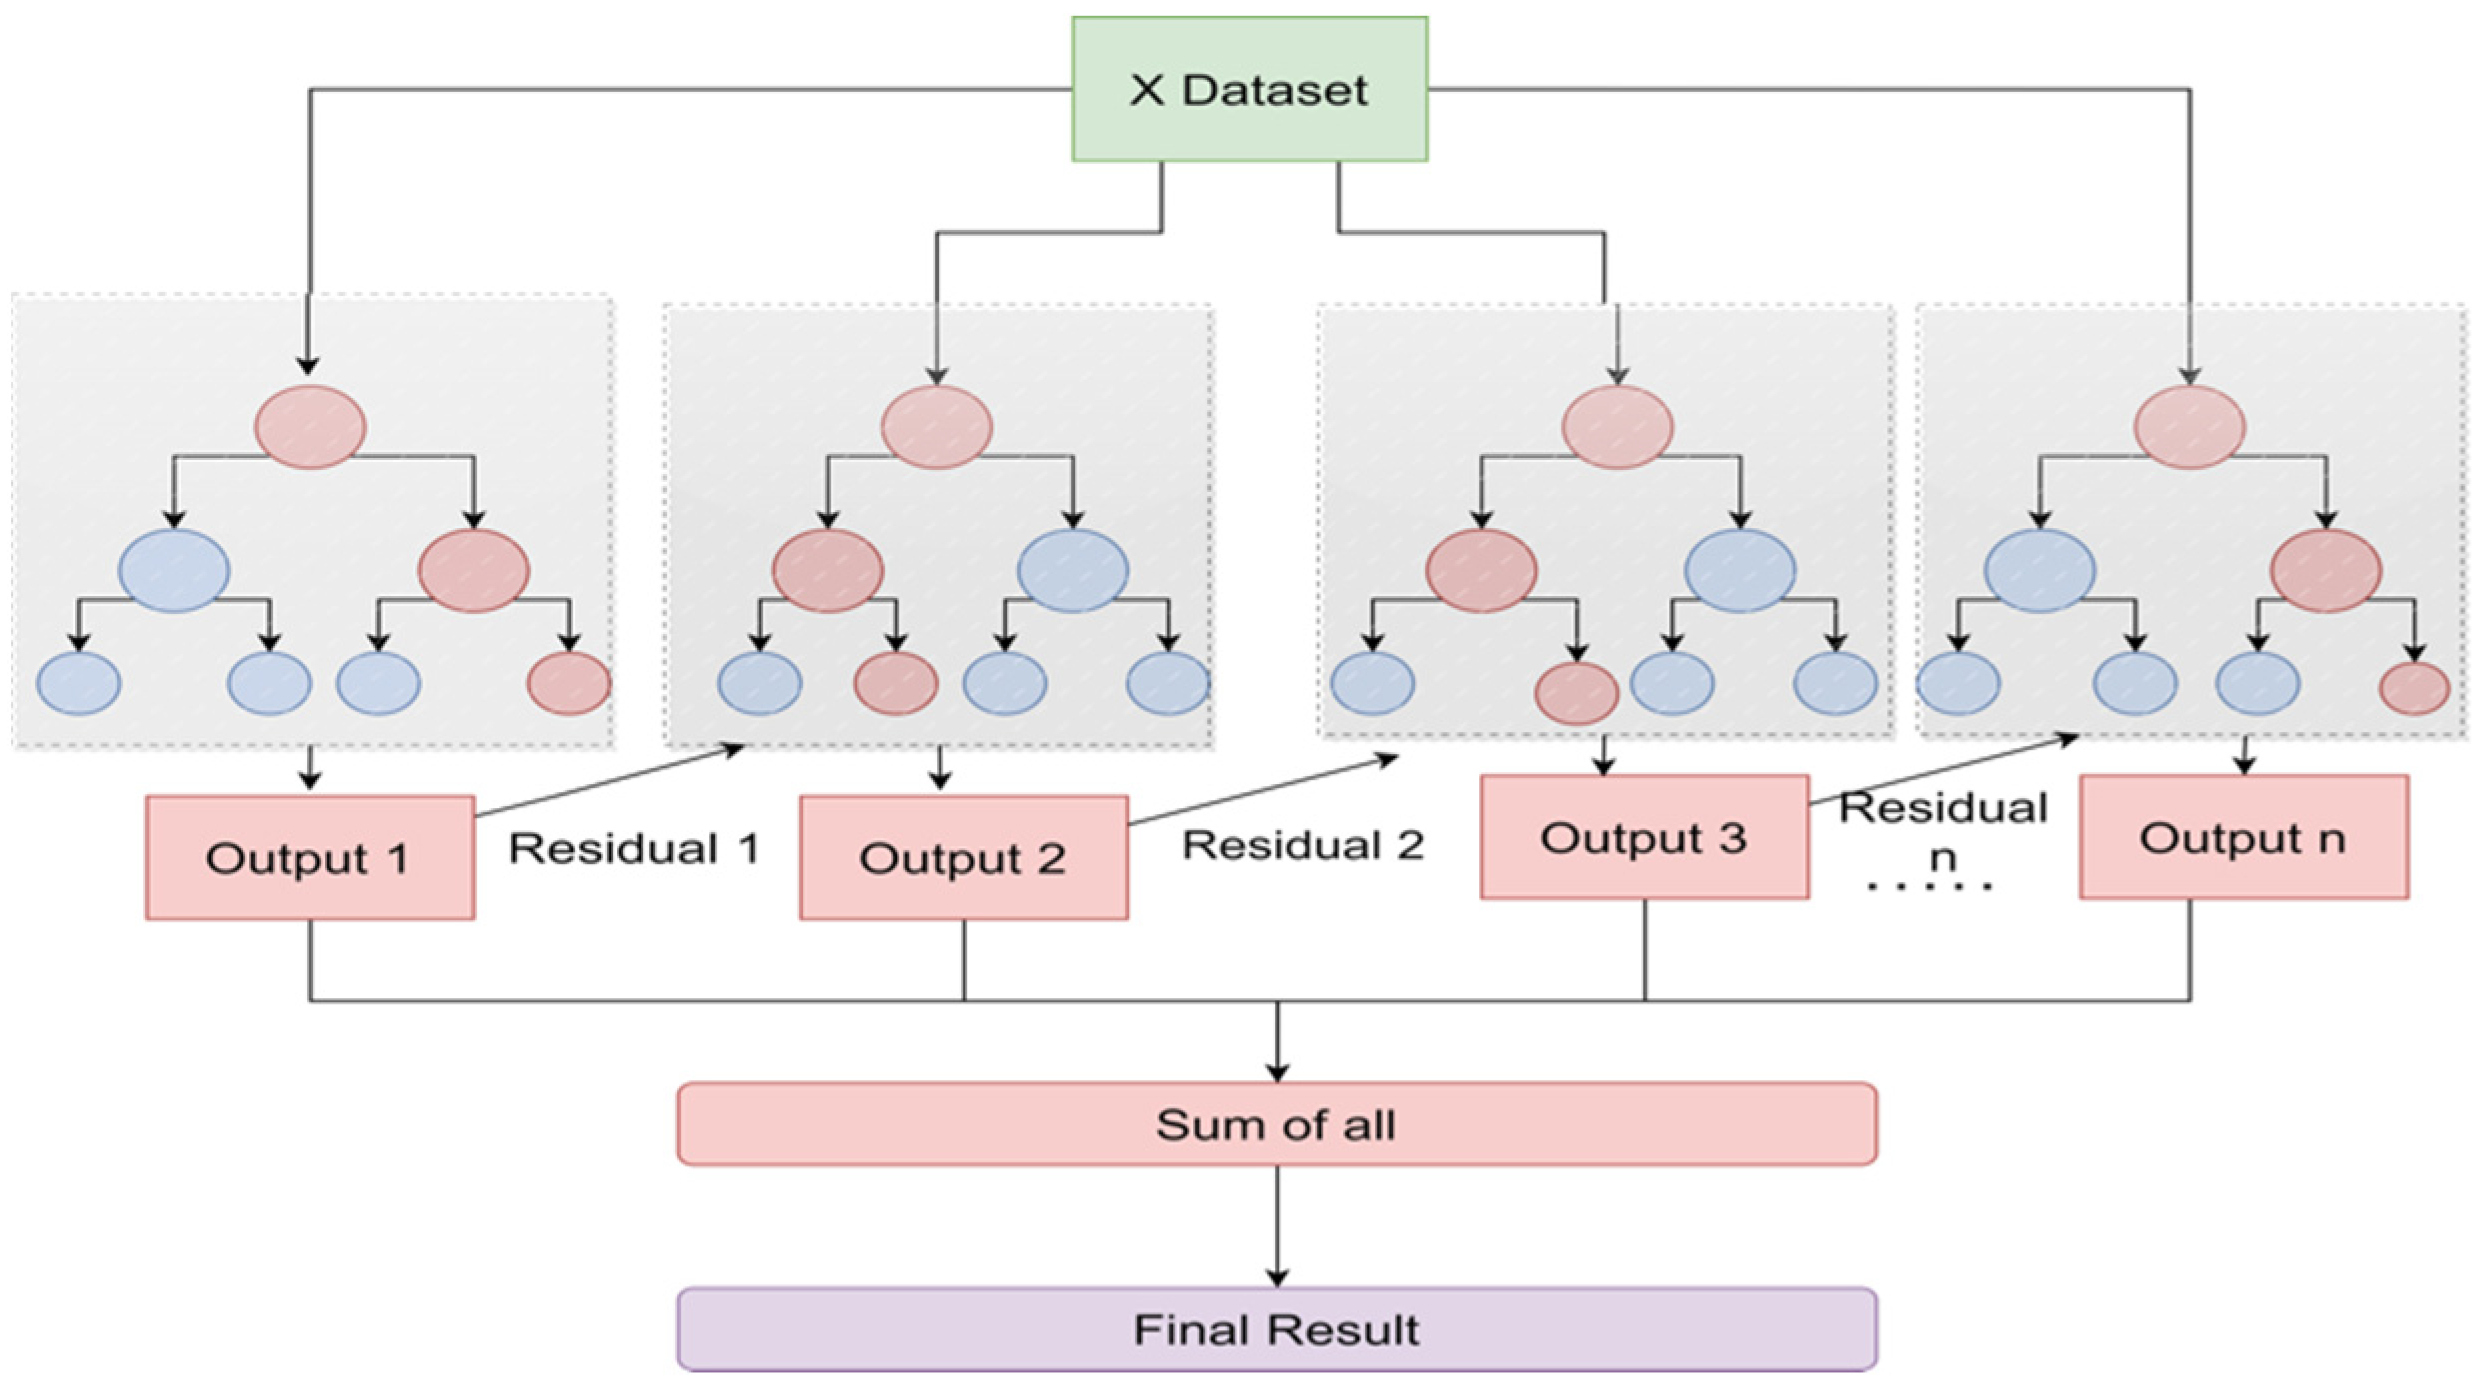
4. Significance of Ensemble Modeling

This section of the article is about the comparative analysis of the most significant methods explored in Section 2 and Section 3. Based on the study, it is observed that most common algorithms, such as SVR, MLPR, KNN, random forest, XG-Boost, and LSTM, are used by various researchers in their research work. In this review article, we attempted to use these algorithms for forecasting the stock price of two stocks, namely, Tainwala Chemicals and Plastics (Mumbai, India) Lt. (TAINIWALCHM) and Agro Phos (Indore, India) Ltd. (AGROPHOS), and proposed an ensemble algorithm based on “Random Forest + XG-Boost + LSTM”. The idea behind including a comparison of the algorithms is to understand the generic performance of the popular machine learning and deep learning algorithms identified during the literature review.
After studying various algorithms, we developed an ensemble model of random forest, XG-Boost, and LSTM. Random forest is simpler than the gradient boosting algorithm but has the ability to handle high-dimensional datasets and capture non-linear patterns common in stock market forecasting. Gradient boosting is a top choice algorithm for classification and regression predictive modeling projects because it often achieves the best performance, but it takes lot of time to converge to the solution. The ensemble of XG-Boost provides an efficient implementation of gradient boosting that can be configured to train random forest ensembles and address the speed problems of gradient boosting. In order to achieve the best performance in stock price forecasting, the LSTM is combined in this model due to its capability of storing past information. To make the most of the two models, it is good practice to combine these two and apply a higher weight to the model, which yields a lower loss function (mean absolute error). The parameter setting used for implementing the proposed ensemble model is mentioned Table 1.
The necessary comparison and evaluations are depicted in Figure 7 and Figure 8. We implemented all of these algorithms using Python programming language. Figure 7 shows the stock forecasting results of Tainwala Chemicals and Plastics (India) (TAINIWALCHM). The dataset for implementation was obtained from Yahoo Finance API, and we considered the dataset for TAINIWALCHM from the year 2014 to the year 2023. The RMSE and R2 scores were used for evaluating the performance of the various models.
Figure 8 shows the stock forecasting results of Agro Phos (India) Ltd. (AGROPHOS). The dataset for implementation was obtained from Yahoo Finance API, and we have considered the dataset for TAINIWALCHM from the year 2018 to the year 2023. The RMSE and R2 scores were used for evaluating the performance of the various models.
The analysis results in Table 2 indicate that the ensemble algorithm demonstrated the best performance compared to other distinct algorithms’.
From this study and experimental analysis, we observed that the modification of hyperparameters is a crucial stage in the process of stock forecasting as it can maximize the performance of machine learning models. Table 3 lists machine learning models that are frequently used in stock price forecasting. Nevertheless, the efficacy of these models is highly dependent on the choice of hyperparameters, which are parameters that are not learned from the data, but rather, defined before the learning process.
The next part of this section illustrates the comparative analysis of work conducted by multiple authors on various classification, regression, and time series-based algorithms to evaluate their performance in stock market forecasting, as shown in Table 3. The algorithms were assessed using various evaluation parameters, including accuracy, recall, precision, F1 Score, MSE, MAE, RMSE, and R-squared error. The aim was to identify effective algorithms that could benefit a wider audience, including general applied researchers and intelligent laypersons, enabling them to make informed investment decisions. These findings will also provide valuable insights for researchers, investors, and general audiences, enabling them to make well-informed decisions and navigate the complexities of the financial market.

5. Implications and Limitations of the Study

This study focused on the application of machine learning and deep learning models in stock forecasting. It can be noted that machine learning or deep learning models alone are not sufficient. Ensemble techniques are capable of providing superior performance. But merely developing a model is not enough, and emphasis should also be placed on hyperparameter tuning. The performance of the model can be improved using hyperparameters such as learning rates, regularization in cases of deep learning, the number of hidden layers, max_depth, n_estimators, and learning rate. Choosing the proper settings for these hyperparameters can considerably enhance the precision of stock forecasts. For instance, a model with a greater learning rate may converge more quickly but may also be susceptible to overfitting, whereas a model with a lower learning rate may converge more slowly but generalize better to new data. Tuning hyperparameters entails choosing the optimal combination of hyperparameters for a given dataset and model architecture. This procedure often entails training many models with distinct hyperparameter values and evaluating their performance on a validation dataset. Typically, the optimal combination of hyperparameters is determined by the model’s capacity to reduce the deviation between predicted and actual stock prices. The study of machine learning models and deep learning models and the comparative results presented in this article will guide researchers in choosing ideal and preferred machine learning and deep learning algorithms for their respective research work.

6. Future Research Directions

The presented review article is focused on the review of related and published articles on stock price prediction, forecasting, and classification. The analysis of financial instruments such as stocks and equities is a considerable challenge. It is said that the stock market evolves over a period of time (Lim and Brooks 2011), and hence, the approaches developed for handling specific problems will see low performance sooner or later even though their performance is found to be appreciated initially. As the stock market evolves under the influence of various factors such as geopolitical issues, equity trading, and investment, the underlying challenges also change, and so do the methodologies for addressing the new challenges (Sprenger and Welpe 2011; Shah et al. 2019). Sufficient research has been presented on stock price prediction and stock classification, which is the primary focus of this review article. Based on the study presented in this article, we have identified some of the key areas where researchers should focus their attention and explore better solutions. In this section, an attempt is made to open new research avenues for researchers in the field of stock market research.

6.1. Trend Analysis and Classification

Most researchers are inclined towards solving the problem of price prediction or forecasting stock value series. It is important to know the movement of stock prices, as well. We believe that researchers can explore the possible usage of state-of-the-art deep learning and machine learning algorithms in stock trend prediction and classification (Jiang 2021; Nikou et al. 2019).

6.2. Pattern Identification Using Computer Vision

Most researchers see stock price as time series data, which is true. But time series numerical data can be transformed into images, and patterns in the images can be identified to understand new trends occurring in the price changes (Barra et al. 2020). Due to the advancement of deep learning in the form of pre-trained models and transfer learning, researchers can explore opportunities to apply these models to understanding the images generated based on time series data.

6.3. Chart Pattern Analysis Using Computer Vision

Chart pattern analysis is one of the most-applied approaches among traders and investors. Candlesticks often form fascinating patterns (Cagliero et al. 2023; Hu et al. 2019), which helps traders in capturing price action well before it occurs. But the biggest drawback of chart pattern analysis is the perception of the viewer. Generally, these chart patterns are identified based on the perceptions of traders. Every trader will have a different perception of the market, and the emotions of traders tend to project different patterns for the same price action. For example, it is difficult to differentiate between double-top and triple-top candlestick patterns (Lambert 2009). Researchers can address the problem of candlestick pattern identification using suitable deep-learning techniques so that perception bias can be avoided amongst traders.

7. Conclusions

In this review, several conventional, machine learning, and deep learning techniques that are employed in stock market forecasting are investigated. This review describes various machine learning techniques, deep learning techniques, and time series forecasting techniques. This article presents recent applications of machine learning and deep learning models, and an ensemble model is also tested on the TAINIWALCHM and AGROPHOS stock datasets. Despite the existence of several popular methods for stock price forecasting, even today, there is no universal solution to accurately predict the stock price or trend of the market. There is still a possibility that AI-based models can also fail if they are not trained efficiently with fresh data. To conclude this article, we assert that researchers should keep exploring new avenues to solve price action problems using ensemble techniques. Stock forecasting models should be enhanced with suitable hyperparameter tuning so that they can serve as precise stock price prediction models. Traders and investment advisors can use machine learning and deep learning models as additional confirmation indicators to support their decisions, and decisions should not rely only on AI-based price forecasting methods. Along with stock forecasting techniques, researchers in the future can expand their studies to portfolio management, trading strategy design, and investment decision making.

Author Contributions

Conceptualization G.S., D.S.D. and A.M.B.; Visualization, G.S.; Writing—original draft, G.S., D.S.D. and A.M.B.; Supervision, D.S.D. and A.M.B.; Writing—review & editing, S.T.D., D.D., S.K.B. All authors have read and agreed to the published version of the manuscript.

Funding

This research received no external funding.

Informed Consent Statement

Not applicable.

Data Availability Statement

Not applicable.

Conflicts of Interest

The authors declare no conflict of interest.

References

  1. Agrawal, Manish, Piyush Kumar Shukla, Rajit Nair, Anand Nayyar, and Mehedi Masud. 2022. Stock Prediction Based on Technical Indicators Using Deep Learning Model. Computers, Materials & Continua 70: 287–304. [Google Scholar]
  2. Ali, Syed Shahan, Muhammad Mubeen, and Adnan Hussain. 2018. Prediction of stock performance by using logistic regression model: Evidence from Pakistan Stock Exchange (PSX). Asian Journal of Empirical Research 15: 212. [Google Scholar]
  3. Ampomah, Ernest Kwame, Gabriel Nyame, Zhiguang Qin, Prince Clement Addo, Enoch Opanin Gyamfi, and Micheal Gyan. 2021. Stock Market Prediction with Gaussian Naïve Bayes Machine Learning Algorithm. Informatica 45: 2. [Google Scholar] [CrossRef]
  4. Baheti, Radhika, Gauri Shirkande, Sneha Bodake, Janhavi Deokar, and Archana K. 2021. Stock Market Analysis from Social Media and News using Machine Learning Techniques. International Journal on Data Science and Machine Learning with Applications 1: 59–67. [Google Scholar]
  5. Ballings, Michel, Dirk Van den Poel, Nathalie Hespeels, and Ruben Gryp. 2015. Evaluating multiple classifiers for stock price direction prediction. Expert Systems with Applications 42: 7046–56. [Google Scholar] [CrossRef]
  6. Banik, Shouvik, Nonita Sharma, Monika Mangla, Sachi Nandan Mohanty, and Selvarajan Shitharth. 2022. LSTM based decision support system for swing trading in stock market. Knowledge-Based Systems 239: 107994. [Google Scholar] [CrossRef]
  7. Bansal, Malti, Apoorva Goyal, and Apoorva Choudhary. 2022. Stock Market Prediction with High Accuracy using Machine Learning Techniques. Procedia Computer Science 215: 247–65. [Google Scholar] [CrossRef]
  8. Barra, Silvio, Salvatore Mario Carta, Andrea Corriga, Alessandro Sebastian Podda, and Diego Reforgiato Recupero. 2020. Deep learning and time series-to-image encoding for financial forecasting. IEEE/CAA Journal of Automatica Sinica 7: 683–92. [Google Scholar] [CrossRef]
  9. Bustos, Oscar, Alexandra Pomares, and Enrique Gonzalez. 2017. A comparison between SVM and multilayer perceptron in predicting an emerging financial market: Colombian stock market. Paper presented at 2017 Congreso Internacional de Innovacion y Tendencias en Ingenieria (CONIITI), Bogotá, Colombia, October 4–6; pp. 1–6. [Google Scholar]
  10. Cagliero, Luca, Jacopo Fior, and Paolo Garza. 2023. Shortlisting machine learning-based stock trading recommendations using candlestick pattern recognition. Expert Systems with Applications 216: 119493. [Google Scholar] [CrossRef]
  11. Di Persio, Luca, and Oleksandr Honchar. 2017. Recurrent neural networks approach to the financial forecast of Google assets. International Journal of Mathematics and Computers in Simulation 11: 7–13. [Google Scholar]
  12. Dospinescu, Nicoleta, and Octavian Dospinescu. 2019. A Profitability Regression Model In Financial Communication Of Romanian Stock Exchange’s Companies. Ecoforum Journal 8: 4. [Google Scholar]
  13. Gite, Shilpa, Shruti Patil, Deepak Dharrao, Madhuri Yadav, Sneha Basak, Arundarasi Rajendran, and Ketan Kotecha. 2023. Textual Feature Extraction Using Ant Colony Optimization for Hate Speech Classification. Big Data and Cognitive Computing 7: 45. [Google Scholar] [CrossRef]
  14. Grigoryan, Hakob. 2017. Stock Market Trend Prediction Using Support Vector Machines and Variable Selection Methods. Advances in Intelligent Systems Research (AISR) 2017: 210–13. [Google Scholar] [CrossRef] [Green Version]
  15. Gururaj, Vaishnavi, V. R. Shriya, and K. Ashwini. 2019. Stock Market Prediction using Linear Regression and Support Vector Machines. International Journal of Applied Engineering Research 14: 1931–34. [Google Scholar]
  16. Hu, Weilong, Yain-Whar Si, Simon Fong, and Raymond Yiu Keung Lau. 2019. A formal approach to candlestick pattern classification in financial time series. Applied Soft Computing 84: 105700. [Google Scholar] [CrossRef]
  17. Hu, Zexin, Yiqi Zhao, and Matloob Khushi. 2021. A survey of forex and stock price prediction using deep learning. Applied System Innovation 4: 9. [Google Scholar] [CrossRef]
  18. Jiang, Weiwei. 2021. Applications of deep learning in stock market prediction: Recent progress. Expert Systems with Applications 184: 115537. [Google Scholar] [CrossRef]
  19. Jose, Jithina, Suja Cherukullapurath Mana, and B. Keerthi Samhitha. 2019. An Efficient System to Predict and Analyze Stock Data using Hadoop Techniques. International Journal of Recent Technology and Engineering (IJRTE) 8: 1039–43. [Google Scholar] [CrossRef]
  20. Kaczmarek, Tomasz, and Katarzyna Perez. 2021. Building portfolios based on machine learning predictions. Economic Research-Ekonomska Istraživanja 35: 19–37. [Google Scholar] [CrossRef]
  21. Kaninde, Sumedh, Manish Mahajan, Aditya Janghale, and Bharti Joshi. 2022. Stock Price Prediction Using Facebook Prophet. International Journal of Research in Engineering and Science 44: 03060. [Google Scholar] [CrossRef]
  22. Kardani, Navid, Annan Zhou, Majidreza Nazem, and Shui-Long Shen. 2020. Improved prediction of slope stability using a hybrid stacking ensemble method based on finite element analysis and field data. Journal of Rock Mechanics and Geotechnical Engineering 13: 188–201. [Google Scholar] [CrossRef]
  23. Kedar, S. V. 2021. Stock Market Increase and Decrease using Twitter Sentiment Analysis and ARIMA Model. Turkish Journal of Computer and Mathematics Education (TURCOMAT) 12: 146–61. [Google Scholar] [CrossRef]
  24. Khairi, Teaba W. A., Rana M. Zaki, and Wisam A. Mahmood. 2019. Stock Price Prediction using Technical, Fundamental and News based Approach. Paper presented at 2019 2nd Scientific Conference of Computer Sciences (SCCS), Baghdad, Iraq, March 27–28. [Google Scholar]
  25. Khan, Wasiat, Mustansar Ali Ghazanfar, Muhammad Awais Azam, Amin Karami, Khaled H. Alyoubi, and Ahmed S. Alfakeeh. 2020. Stock market prediction using machine learning classifiers and social media, news. Journal of Ambient Intelligence and Humanized Computing 13: 3433–56. [Google Scholar] [CrossRef]
  26. Kumar, Deepak, Pradeepta Kumar Sarangi, and Rajit Verma. 2021. A systematic review of stock market prediction using machine learning and statistical techniques. Materials Today: Proceedings 49: 3187–91. [Google Scholar] [CrossRef]
  27. Kumar, Saurav, and Dhruba Ningombam. 2018. Short-Term Forecasting of Stock Prices Using Long Short Term Memory. Paper presented at 2018 International Conference on Information Technology (ICIT), Hong Kong, China, December 29–31. [Google Scholar]
  28. Lambert, Clive. 2009. Candlestick Charts: An Introduction to Using Candlestick Charts. Petersfield: Harriman House Limited. [Google Scholar]
  29. Li, Audeliano Wolian, and Guilherme Sousa Bastos. 2020. Stock Market Forecasting Using Deep Learning and Technical Analysis: A Systematic Review. IEEE Access 8: 185232–242. [Google Scholar] [CrossRef]
  30. Li, Yang, and Yi Pan. 2021. A novel ensemble deep learning model for stock prediction based on stock prices and news. International Journal of Data Science and Analytics 13: 139–49. [Google Scholar] [CrossRef] [PubMed]
  31. Lim, Kian-Ping, and Robert Brooks. 2011. The evolution of stock market efficiency over time: A survey of the empirical literature. Journal of Economic Surveys 25: 69–108. [Google Scholar] [CrossRef]
  32. Lim, Yi Xuan, and Consilz Tan. 2021. Do negative events really have deteriorating effects on stock performance? A comparative study on Tesla (US) and Nio (China). Journal of Asian Business and Economic Studies 29: 105–19. [Google Scholar] [CrossRef]
  33. Manish, Kumar, and M. Thenmozhi. 2014. Forecasting stock index returns using ARIMA-SVM, ARIMA-ANN, and ARIMA-random forest hybrid models. International Journal of Banking Accounting and Finance 5: 284–308. [Google Scholar]
  34. Mann, Jordan, and J. Nathan Kutz. 2016. Dynamic mode decomposition for financial trading strategies. Quantitative Finance 16: 1643–55. [Google Scholar] [CrossRef] [Green Version]
  35. Manojlović, Teo, and Ivan Štajduhar. 2015. Predicting stock market trends using random forests: A sample of the Zagreb stock exchange. Paper presented at International Convention on Information and Communication Technology Electronics and Microelectronics, Opatija, Croatia, May 25–29. [Google Scholar]
  36. Mashadihasanli, Tamerlan. 2022. Stock Market Price Forecasting Using the Arima Model: An Application to Istanbul, Turkiye. Journal of Economic Policy Researches 9: 439–54. [Google Scholar] [CrossRef]
  37. Mohapatra, Sabyasachi, Rohan Mukherjee, Arindam Roy, Anirban Sengupta, and Amit Puniyani. 2022. Can Ensemble Machine Learning Methods Predict Stock Returns for Indian Banks Using Technical Indicators? Journal of Risk and Financial Management 8: 350. [Google Scholar] [CrossRef]
  38. Mukherjee, Somenath, Bikash Sadhukhan, Nairita Sarkar, Debajyoti Roy, and Soumil De. 2021. Stock market prediction using deep learning algorithms. CAAI Transactions on Intelligence Technology 8: 82–94. [Google Scholar] [CrossRef]
  39. Nabipour, Mojtaba, Pooyan Nayyeri, Hamed Jabani, S. Shahab, and Amir Mosavi. 2020. Predicting Stock Market Trends Using Machine Learning and Deep Learning Algorithms Via Continuous and Binary Data; a Comparative Analysis. IEEE Access 8: 150199–212. [Google Scholar] [CrossRef]
  40. Nikou, Mahla, Gholamreza Mansourfar, and Jamshid Bagherzadeh. 2019. Stock price prediction using DEEP learning algorithm and its comparison with machine learning algorithms. Intelligent Systems in Accounting, Finance and Management 26: 164–74. [Google Scholar] [CrossRef]
  41. Nti, Isaac Kofi, Adebayo Felix Adekoya, and Benjamin Asubam Weyori. 2020. A comprehensive evaluation of ensemble learning for stock-market prediction. Journal of Big Data 7: 1–40. [Google Scholar] [CrossRef] [Green Version]
  42. Obthong, Mehtabhorn, Nongnuch Tantisantiwong, Watthanasak Jeamwatthanachai, and Gary Wills. 2020. A Survey on Machine Learning for Stock Price Prediction: Algorithms and Techniques. Paper presented at 2nd International Conference on Finance, Economics, Management and IT Business, Prague, Czech Republic, May 5–6. [Google Scholar]
  43. Parray, Irfan Ramzan, Surinder Singh Khurana, Munish Kumar, and Ali A. Altalbe. 2020. Time series data analysis of stock price movement using machine learning techniques. Soft Computing 24: 16509–17. [Google Scholar] [CrossRef]
  44. Patel, Jigar, Sahil Shah, Priyank Thakkar, and Ketan Kotecha. 2015. Predicting stock and stock price index movement using Trend Deterministic Data Preparation and machine learning techniques. Expert Systems with Applications 42: 259–68. [Google Scholar] [CrossRef]
  45. Pathak, Ashwini, and Sakshi Pathak. 2020. Study of Machine learning Algorithms for Stock Market Prediction. International Journal of Engineering Research & Technology (IJERT) 9: 6. [Google Scholar]
  46. Polamuri, Subba Rao, Kudipudi Srinivas, and A. Krishna Mohan. 2019. Stock Market Prices Prediction using Random Forest and Extra Tree Regression. International Journal of Recent Technology and Engineering 8: 1224–28. [Google Scholar] [CrossRef]
  47. Pramod, B. S., and Mallikarjuna Shastry Pm. 2021. Stock Price Prediction Using LSTM. Test Engineering and Management 83: 5246–51. [Google Scholar]
  48. Qiu, Jiayu, Bin Wang, and Changjun Zhou. 2020. Forecasting stock prices with long-short term memory neural network based on attention mechanism. PLoS ONE 15: e0227222. [Google Scholar] [CrossRef] [PubMed] [Green Version]
  49. Raghavendra, Kumar, Pardeep Kumar, and Yugal Kumar. 2021. Analysis of financial time series forecasting using deep learning model. Paper presented at 2021 11th International Conference on Cloud Computing, Data Science & Engineering (Confluence), Uttar Pradesh, India, January 28–29; pp. 877–81. [Google Scholar]
  50. Reddy, Niveditha N., E. Naresh, and Vijaya Kumar B. P. 2020. Predicting Stock Price Using Sentimental Analysis Through Twitter Data. Paper presented at 2020 IEEE International Conference on Electronics, Computing and Communication Technologies (CONECCT), Bangalore, India, July 2–4. [Google Scholar]
  51. Ren, Rui, Desheng Dash Wu, and Tianxiang Liu. 2019. Forecasting Stock Market Movement Direction Using Sentiment Analysis and Support Vector Machine. IEEE Systems Journal 13: 760–70. [Google Scholar] [CrossRef]
  52. Sadorsky, Perry. 2021. A Random Forests Approach to Predicting Clean Energy Stock Prices. Journal of Risk and Financial Management 14: 48. [Google Scholar] [CrossRef]
  53. Salles, Thiago, Marcos Gonçalves, Victor Rodrigues, and Leonardo Rocha. 2018. Improving random forests by neighborhood projection for effective text classification. Information Systems 77: 1–21. [Google Scholar] [CrossRef]
  54. Sathish Kumar, R., R. Girivarman, S. Parameshwaran, and V. Sriram. 2020. Stock Price Prediction Using Deep Learning and Sentimental Analysis. JETIR 7: 346–54. [Google Scholar]
  55. Seethalakshmi, Ramaswamy. 2018. Analayis of stock market predictor variables using linear regression. International Journal of Pure and Applied Mathematics 119: 369–78. [Google Scholar]
  56. Setiani, Ida, Meilany Nonsi Tentua, and Sunggito Oyama. 2020. Prediction of Banking Stock Prices Using Naïve Bayes Method. Journal of Physics Conference Series 1823: 012059. [Google Scholar] [CrossRef]
  57. Shah, Dev, Haruna Isah, and Farhana Zulkernine. 2019. Stock Market Analysis: A Review and Taxonomy of Prediction Techniques. International Journal of Financial Studies 7: 26. [Google Scholar] [CrossRef] [Green Version]
  58. Shahi, Tej Bahadur, Ashish Shrestha, Arjun Neupane, and William Guo. 2020. Stock Price Forecasting with Deep Learning: A Comparative Study. Mathematics and Computer Science 8: 1441. [Google Scholar] [CrossRef]
  59. Sharaf, Marwa, Ezz El-Din Hemdan, Ayman El-Sayed, and Nirmeen A. El-Bahnasawy. 2022. An efficient hybrid stock trend prediction system during COVID-19 pandemic based on stacked-LSTM and news sentiment analysis. Multimedia Tools and Applications 28: 1–33. [Google Scholar] [CrossRef]
  60. Shen, Jingyi, and M. Omair Shafiq. 2020. Short-term stock market price trend prediction using a comprehensive deep learning system. Journal of Big Data 7: 1–33. [Google Scholar] [CrossRef]
  61. Sidra, Mehtab, and Jaydip Sen. 2020. A time series analysis-based stock price prediction using machine learning and deep learning models. arXiv arXiv:2004.11697. [Google Scholar]
  62. Smita, Mrinalini. 2021. Logistic Regression Model For Predicting Performance of S&P BSE30 Company Using IBM SPSS. International Journal of Mathematics Trends and Technology 67: 118–34. [Google Scholar] [CrossRef]
  63. Soni, Payal, Yogya Tewari, and Deepa Krishnan. 2022. Machine Learning approaches in stock price prediction: A systematic review. Journal of Physics Conference Series 2161: 012065. [Google Scholar] [CrossRef]
  64. Sprenger, Timm O., and Isabell M. Welpe. 2011. News or noise? The stock market reaction to different types of company-specific news events. SSRN Electronic Journal. [Google Scholar] [CrossRef]
  65. Suresh, N., B. Priya, and G. Lakshmi. 2022. Historical Analysis and Forecasting of Stock Market Using Fbprophet. South Asian Journal of Engineering and Technology 12: 152–57. [Google Scholar] [CrossRef]
  66. Tanuwijaya, Julius, and Seng Hansun. 2019. LQ45 Stock Index Prediction using k-Nearest Neighbors Regression. International Journal of Recent Technology and Engineering 8: 2388–91. [Google Scholar] [CrossRef]
  67. Umer, Muhammad, Muhammad Awais, and Muhammad Muzammul. 2019. Stock Market Prediction Using Machine Learning (ML) Algorithms. ADCAIJ Advances in Distributed Computing and Artificial Intelligence Journal 8: 97–116. [Google Scholar] [CrossRef]
  68. Venkat, Projects. 2022. Stock Market Trend Prediction Using K-Nearest Neighbor (KNN) Algorithm. Journal of Engineering Sciences 3: 32–44. [Google Scholar]
  69. Vo, Nguyen, and Robert Ślepaczuk. 2022. Applying Hybrid ARIMA-SGARCH in Algorithmic Investment Strategies on S&P500 Index. Entropy 24: 158. [Google Scholar] [CrossRef] [PubMed]
  70. Vuong, Pham Hoang, Trinh Tan Dat, Tieu Khoi Mai, and Pham Hoang Uyen. 2022. Stock-Price Forecasting Based on XGBoost and LSTM. Computer Systems Science & Engineering 40: 237–46. [Google Scholar]
  71. Xu, Ying, Cuijuan Yang, Shaoliang Peng, and Yusuke Nojima. 2020. A hybrid two-stage financial stock forecasting algorithm based on clustering and ensemble learning. Applied Intelligence 50: 3852–67. [Google Scholar] [CrossRef]
  72. Yadav, Ashima, and Dinesh Kumar Vishwakarma. 2019. Sentiment analysis using deep learning architectures: A review. Artificial Intelligence Review 53: 4335–85. [Google Scholar] [CrossRef]
  73. Yang, Liu. 2019. Novel volatility forecasting using deep learning-long short term memory recurrent neural networks. Expert Systems with Applications 132: 99–109. [Google Scholar]
  74. Zhong, Xiao, and David Enke. 2019. Predicting the daily return direction of the stock market using hybrid machine learning algorithms. Financial Innovation 5: 1–20. [Google Scholar] [CrossRef]
  75. Zhou, Xingyu, Zhisong Pan, Guyu Hu, Siqi Tang, and Cheng Zhao. 2018. Stock Market Prediction on High-Frequency Data Using Generative Adversarial Nets. Mathematical Problems in Engineering 2018: 4907423. [Google Scholar] [CrossRef] [Green Version]
  76. Zhu, Yongqiong. 2020. Stock price prediction using the RNN model. Journal of Physics Conference Series 1650: 032103. [Google Scholar] [CrossRef]
  77. Zhu, Zhe, and Kexin He. 2022. Prediction of Amazon’s Stock Price Based on ARIMA, XGBoost, and LSTM Models. Proceedings of Business and Economic Studies 5: 127–36. [Google Scholar] [CrossRef]
  78. Zizi, Youssef, Amine Jamali-Alaoui, Badreddine El Goumi, Mohamed Oudgou, and Abdeslam El Moudden. 2021. An Optimal Model of Financial Distress Prediction: A Comparative Study between Neural Networks and Logistic Regression. Risks 9: 200. [Google Scholar] [CrossRef]
Figure 1. Stock forecasting algorithm.
Ijfs 11 00094 g001
Figure 2. LSTM structure.
Ijfs 11 00094 g002
Figure 3. GRU structure.
Ijfs 11 00094 g003
Figure 4. Random forest.
Ijfs 11 00094 g004
Figure 5. XG-Boost algorithm.
Ijfs 11 00094 g005
Figure 6. Workflow of basic ML model.
Ijfs 11 00094 g006
Figure 7. TANIWALCHM stock price forecasting: (a) SVR, (b) MLPR, (c) KNN, (d) random forest, (e) XG-Boost, (f) LSTM, (g) Ensemble Random Forest + XG-Boost + LSTM.
Ijfs 11 00094 g007aIjfs 11 00094 g007b
Figure 8. AGROPHOS stock price forecasting: (a) SVR, (b) MLPR, (c) KNN, (d) random forest, (e) XG-Boost, (f) LSTM, (g) Ensemble Random Forest + XG-Boost + LSTM.
Ijfs 11 00094 g008aIjfs 11 00094 g008b
Table 1. Ensemble model parameter configuration.
ParameterDescription
Model typeStacked ensemble model
LibrariesKeras, TensorFlow, sklearn
AlgorithmsRandom Forest + XG-Boost + LSTM
Training/testing size80% for training and 20% for testing
Loss functionMSE
OptimizerAdam
Maximum epochs50
Random Forest Configuration
Number of estimators[50, 100, 200]
Maximum depth[3, 5, 7]
Maximum features[‘sqrt’, ‘log2’]
Hyperparameter tuning methodGrid search
XG-Boost Configuration
Maximum depth[3, 4, 5]
Learning rate[0.1, 0.01, 0.001]
Number of estimators[50, 100, 150, 500, 1000]
Hyperparameter tuning methodGrid search
LSTM Configuration
LSTM Layers2
Dropout rate0.2
Dense layer25 units
Batch size32
Hyperparameter tuning methodGrid search
Table 2. RMSE and R2 scores of algorithms.
TANIWALCHMAGROPHOS
AlgorithmRMSER2RMSER2
SVR4.5250.92791.50740.9432
MLPR2.58930.96112.47640.9472
KNN4.42490.93114.78770.7262
LSTM5.62410.88675.24940.8809
Random forest87.88390.981898.56330.9428
XG-Boost2.06860.98421.76180.9379
Random Forest + XG-Boost + LSTM2.02470.99211.26580.9897
Table 3. Summary of existing stock prediction and forecasting algorithms with performance analysis.
Sr NoAlgorithm NameGap AnalysisPerformance Evaluation
1Linear regressionLinear regression assumes a linear relationship between dependent and independent variables and is not suitable for most real-time applications, and is used to perform observations on readily accessible sample data (Gururaj et al. 2019).This is a regression type of algorithm that shows graphs in a linear way, where in RMSE is 3.22, MAE is 2.53, MSE is 10.37, and R-squared is 0.73 (Gururaj et al. 2019).
2Support vector machineSVM’s excellent memory efficiency and effectiveness make it an ideal estimating technique in high-dimensional space. The shortcoming of SVM is that it might experience overfitting, but it performs exceptionally well on tiny datasets (Pathak and Pathak 2020; Grigoryan 2017).This is a classification type of algorithm, and when used for stock prediction, the results are as follows: accuracy is 68.2, recall is 65.2, precision is 64.2, and F1-Score is 64.9% (0.65).
When used as a support vector regression (SVR) algorithm, the evaluation parameters are as follows: SMAPE = 5.59, R-squared = 1.69, and RMSE = 43.36.
3K-nearest neighborKNN is an algorithm that skips the learning step, so it may not generalize effectively. With a huge dataset, it takes longer since it must sort all the distances from the unknown item (Tanuwijaya and Hansun 2019; Pathak and Pathak 2020).This is a classification type of ML algorithm in which the results of stock prediction are as follows: accuracy is 65.2, recall is 63.6, precision is 64.8, and F1 Score is 64.1% (0.64).
For KNN regressor, the evaluation parameters are as follows: SMAPE = 14.32, R-squared = −2.42, and RMSE = 56.44 (Venkat 2022).
4Gaussian naïve BayesModels with an integrated GNB algorithm will yield feature extraction and feature scaling outcomes that are superior to those already achieved using models that incorporate either the GNB algorithm or feature scaling (Setiani et al. 2020; Ampomah et al. 2021).Gaussian naïve Bayes used by authors in their research. Kendall’s Test of Concordance is used in this feature, which is scaled and extracted. The results are as follows: accuracy is 84, F1 Score is 62.44% (0.62), specificity is 0.70, and AUC values is 0.90 (Bansal et al. 2022).
5Logistic regressionBoth binary and multiclass classification use this algorithm. The findings obtained via logistic regression are the most accurate; however, identifying the best-fitting feature is necessary (Pathak and Pathak 2020; Ali et al. 2018).In this algorithm, with the help of research papers, various financial factors are considered through which factors are grouped for prediction. The results of this algorithm are as follows: accuracy is 78.6, recall is 76.6, precision is 77.8, and F1 Score is 77.1% (0.77) (Pathak and Pathak 2020; Ali et al. 2018).
6ARIMAARIMA can be considered because it is a unique model with significant coefficients and passes all the diagnostic tests (Mashadihasanli 2022).ARIMA is a time series forecasting technique for predicting market or stock prices. It is a combination or integration of autoregressive moving averages; the results are as follows: RMSE, 88.05; MAE, 65.88; and MAPE, 5.73, and if performed with sentiment analysis, the RMSE score is 6.41 (Kedar 2021).
7FB ProphetProphet can use regression models to determine seasonality on a daily, monthly, and annual basis, as well as effects related to holidays (Suresh et al. 2022; Kaninde et al. 2022).This algorithm was created by Facebook for time series forecasting. One of its advantages is that it does not consider holidays or null values. The result of its RMSE is achieved 93 (Suresh et al. 2022; Kaninde et al. 2022).
8GRUGRU is a neural network approach that is an improvement upon RNN but has fewer parameters than LSTM, so it trains faster. Also, the chances of overfitting are lower compared to RNN, and it can handle long-term dependency (Shahi et al. 2020).GRU is a deep learning algorithm that has fewer parameters and handles short-term data properly. The evaluation parameters of GRU are, without sentiment analysis, MAE = 42.8, RMSE = 47.31, and R-squared = 0.879, and with sentiment analysis based on news evaluation parameters, MAE = 24.472, RMSE = 29.153, and R-squared = 0.967 (Shahi et al. 2020).
9LSTMIn this algorithm, weights are adjusted for each long short-term memory data point via stochastic gradient descent.
LSTM can handle more very long-term dependency compared to any other neural network algorithm (Shahi et al. 2020; Pramod and Pm 2021; Mukherjee et al. 2021).
LSTM is a more developed type of RNN and is a deep learning technique. This is one of the most used ML algorithms for stock forecasting, and when used along with sentiment analysis, it shows better results than without sentiment analysis. The result without sentiment analysis are MAE = 48.47, RMSE = 55.993, and R-squared = 0.867, and with sentiment analysis based on news evaluation parameters, are MAE = 17.689, RMSE = 23.070, and R-squared = 0.867 (Shahi et al. 2020).
10Random forestThe effectiveness of random forest on large datasets is one of its advantages. It can be applied to classification and regression issues. The model becomes more random as a result, improving it. This model’s use of a huge number of trees slows it down, which is a drawback (Pathak and Pathak 2020; Polamuri et al. 2019).This is an ensemble type of algorithm that is used for stock forecasting. The results for random forest are as follows: accuracy is 80.7, recall is 78.3, precision is 75.2, and F1 Score is 76.7% (0.77) (Pathak and Pathak 2020; Polamuri et al. 2019).
11XG-BoostXG-Boost is an ensembled learning technique that uses decision trees but in a sequential manner and uses gradient boosting in an iterative manner to obtain better results.
XG-Boost is sensitive to hyperparameters and will not work as well on large datasets as random forest (Zhu and He 2022).
XG-Boost has the following evaluation parameter: MSE = 360.0 (Zhu and He 2022).
12E-SVR-RFEnsemble support vector regression and random forest shows improved accuracy as it leverages the advantages of both algorithms, and its robustness is increased, but due to the increased complexity of both algorithms, overfitting is an issue (Xu et al. 2020).The E-SVR-RF ensembled algorithm shows the following evaluation parameters: MAPE = 1.335, MAE = 0.1537, RMSE = 0.0188, and MAE = 0.0485 (Xu et al. 2020).
13XG-Boost + LSTMEnsembling XG-Boost and LSTM can leverage the advantages of both algorithms. XG-Boost can handle linear and non-linear relationships and LSTM can handle long-term dependence. Due to this algorithm’s complexity, hyperparameter tuning can be an issue (Vuong et al. 2022).The ensemble algorithm of XG-Boost + LSTM shows the following evaluation parameter: MSE = 3.465 (Vuong et al. 2022).
14Blending ensemble (LSTM + GRU)Blending ensemble (LSTM+GRU) is a combination of two to of the most-used improvements to RNN and solves the vanishing gradient problem. Both of them can handle long-term dependence well, and combining them would improve forecasting; also, overfitting can be reduced. It may require high computational power and time to train both LSTM and GRU (Li and Pan 2021).The blending ensemble algorithm, which consists of a modified version of RNN, i.e., LSTM and GRU, has the following evaluation parameters:
MSE = 186.32, MPA = 99.65, precision = 60%, Recall = 75%, F1-Score = 66.67% (Li and Pan 2021).
Disclaimer/Publisher’s Note: The statements, opinions and data contained in all publications are solely those of the individual author(s) and contributor(s) and not of MDPI and/or the editor(s). MDPI and/or the editor(s) disclaim responsibility for any injury to people or property resulting from any ideas, methods, instructions or products referred to in the content.

