
Uncovering the Effect of News Signals on Daily Stock Market Performance: An Econometric Analysis


1
School of Management, Harbin Institute of Technology, Harbin 150001, China
2
SDGs Unit, Ministry of Planning, Development and Special Initiatives, Islamabad 44030, Pakistan
*
Author to whom correspondence should be addressed.
Int. J. Financial Stud. 2023, 11(3), 99; https://doi.org/10.3390/ijfs11030099
Submission received: 1 April 2023
/
Revised: 29 May 2023
/
Accepted: 30 May 2023
/
Published: 4 August 2023
(This article belongs to the Special Issue Macroeconomic and Financial Markets)
Abstract
:The stock markets in developing countries are highly responsive to breaking news and events. Our research explores the impact of economic conditions, financial policies, and politics on the KSE-100 index through daily market news signals. Utilizing simple OLS regression and ARCH/GARCH regression methods, we determine the best model for analysis. The results reveal that political and global news has a significant impact on KSE-100 index. Blue chip stocks are considered safer investments, while short-term panic responses often overshadow rational decision-making in the stock market. Investors tend to quickly react to negative news, making them risk-averse. Our findings suggest that the ARCH/GARCH models are better at predicting stock market fluctuations compared to the simple OLS method.
1. Introduction
The stock market is often seen as a barometer of a country’s economic health, with stock prices fluctuating based on a range of economic, financial, political, and global factors. In order to understand how these factors, impact stock market volatility, it is necessary to consider the influence of daily news signals and events. This is particularly important in the context of developing countries, where stock markets are often more volatile and susceptible to sudden changes. The impact of news events on stock market performance has been extensively explored in the literature, revealing the influence of various factors on stock prices and returns. Studies have shown that news events can lead to delayed and amplified effects on stock price movements, with considerations of investor sentiment, market liquidity, and trading volume (Christie-David et al. 2002; Libby et al. 2002; Tetlock 2007). Research has also focused on the relationship between news events and equity market volatility. Campbell and Hentschel (1992) and Engle and Ng (1993) have examined the effects of news events on volatility, with the latter suggesting that the absence of news can be positive for markets. Veronesi (1999) highlights stock market overreactions to negative news during favorable economic conditions. Nizer and Nievola (2012) investigate the influence of published news on the Brazilian stock market.
In addition, the impact of news events on stock market returns has been studied across different contexts. Zhou et al. (2023) analyze media coverage and stock market returns, explicitly focusing on the China–Pakistan Economic Corridor. Berry and Howe (1994) find that news events have a stronger impact during trading hours than non-trading hours. Shiller (1980) suggests a long-term influence of news events on stock prices, indicating that markets may not always fully adjust to new information. The nature of events, such as political events, elections, or government policy changes, can significantly affect stock market returns. Turning to the Pakistan Stock Exchange (PSX), (Raza and Kemal 2017) demonstrate the impact of political news on market returns, highlighting the greater influence of negative political news. Rashid et al. (2022) focus on macroeconomic news and its significant effect on market returns, with positive macroeconomic news positively impacting returns and negative macroeconomic news having a negative impact. Ghafoor et al. (2020) find that increased political competitiveness and democratic circumstances boost market returns in KSE.
Moreover, studies have examined the differential effects of positive and negative news events. De Oliveira Carosia et al. (2021) find that positive news events have a more substantial impact on stock returns than negative news events in the Brazilian stock market. Sajid Nazir et al. (2014) report a significant positive impact of positive news events on stock returns, while the impact of negative news events is statistically insignificant. Recent research has highlighted the role of investor sentiment in the relationship between news events and stock market returns. M. Baker and Wurgler (2006) find that positive news events have a stronger impact when investors are optimistic, while negative news events are more influential during pessimistic periods. Tang et al. (2013) demonstrate the greater impact of negative news events on the stock market, particularly during bear markets.
The stock market is a crucial aspect of the financial system and its dynamics have been the subject of extensive research. According to Fama (1981), the type of money supply determines the stock market. Changes in exchange rates can have an immediate and noticeable effect on the market, and monetary inflation can lower short-term interest rates. It is important to understand the stock market’s fundamental factors to fully comprehend its dynamics. Studies have established the significance of macroeconomic and structural factors that can impact financial markets. However, empirical research in this area is still limited and requires a more precise analysis of the analytical models. In developing countries, the stock exchange is vital to economic growth. Kemboi and Tarus (2012) investigated the macroeconomic factors that impact a nation’s stock market performance. Cherif and Gazdar (2010) conducted a recent analysis of the impact of macroeconomic variables on stock market growth. Despite its potential benefits, trading in the stock market can be risky and unpredictable. This is due to various signals, such as political and economic events, financial and global news, and institution-related news, that can cause fluctuations in stock prices.
To predict stock prices, research analysts frequently use two main approaches: the “chartist” or “scientific” approach and the concept of fundamental or intrinsic value analysis. As described by (Fama 1965), the chartist approach is based on the principle that experience continues to repeat itself, and historical price trends can be used to estimate stock prices. The sentiment indicators, derived from news wire articles, have become a popular source of information for established traders in the financial markets. Different studies (Dougal et al. 2011; Mitchell and Mulherin 1944; Press and Fang 2009) have investigated the effects of traditional media sources on stock prices, as well as the impact of economic, political, and social factors on the performance of stock markets in Pakistan.
Good news, such as positive economic indicators, profitable news, corporate growth, and political stability, can result in buying pressure and an increase in stock prices. On the other hand, negative news such as economic uncertainty, political turmoil, credit crisis, and selling pressure can lead to a decrease in stock prices as people tend to sell their shares in response to such news. The Pakistani stock market is subject to a range of economic, political, and social factors that can impact its performance. Good news such as strong GDP growth, low inflation, and stable interest rates can boost investor confidence and drive-up stock prices. Conversely, negative news such as economic uncertainty, political turmoil, financial scandals, and widespread credit crises can cause the market to decline.
In addition to domestic factors, the stock market is also influenced by global events such as geopolitical tensions, natural disasters, and changes in the world economy. For instance, the COVID-19 pandemic profoundly affected stock markets globally, including in Pakistan, where it led to a significant drop in value (Ali et al. 2023; Ashraf 2020). Despite these ups and downs, the Pakistani stock market has seen growth in recent years, reaching an all-time high of 42,000 points in 2019. However, the pandemic caused the market to hit its lowest point in 2020 before rebounding to new heights in 2021. While news and events can greatly impact the direction of the stock market, it is crucial to also take into consideration long-term economic and political trends. The stock market is a complex and dynamic system, and its performance is determined by a combination of multiple factors.
1.1. Problem Statement
The aim of this study is to investigate the impact of various signals or events on stock market movements, with a specific focus on daily news and events affecting the KSE-100 index in the context of changing political, financial, and economic situations in the country. While previous research has examined the effects of macroeconomic factors on stock market movements, there is still no consensus on which factor has the strongest influence. This study seeks to address this gap in the literature by employing ARCH/GARCH models to analyze the relationship between news and stock market performance, as the simple OLS method is not adequate for analyzing stock market volatility. The following research questions will guide this investigation: (a) Does the stock market performance vary based on different news and events in the country? (b) To what extent is this change associated with news and events? (c) Are the stock market movements more heavily influenced by positive or negative news and events?
1.2. Contribution to the Literature
This study aims to contribute to the current literature by examining the impact of daily news and events on stock market movements in a developing country. Previous studies have often neglected the news factor when investigating stock market volatility and have mainly focused on macro- and microeconomic analyses with stock data on a weekly, monthly, or annual basis. To fill the gap in the literature, this study investigates market volatility through eight major news factors, including political, economic, financial, institutions, global, profit-taking, blue chips, and foreign relations. The incorporation of these news factors with actual events can provide insights into the influence of news on stock market speculation. The findings of this novel research can serve as valuable input for future studies of financial markets and aid in understanding the complex relationship between news and stock market movements. Forecasting market volatility based on economic and financial data is a challenging task. However, this study provides a comprehensive examination of the role of daily news and events in determining stock market performance and contributes to the current body of knowledge in the field.
2. Literature Review
The stock market is often viewed as unpredictable due to its volatile nature. Researchers have studied the stock market’s daily fluctuations and concluded that it is a random walk (Dupernex 2007). However, recent studies have shown that news data can be a valuable source of information for predicting the stock market. Tonghui et al. (2020) found a strong correlation between the Sina Weibo Index and stock market volatility using Granger causality and time-delay detrended cross-correlation analysis (DCCA). Internet news and queries also have the predictive potential for stock market indexes (Zhao 2019). On the other hand, private information has been found to correlate with turnover and volatility negatively. The impact of news announcements on the stock market has been widely studied, with researchers finding that news significantly affects stock price return and uncertainty (Hussain and Omrane 2020). Another factor that affects the stock market is political and economic stability. The Pakistani stock market experienced crashes in 2005, 2006, and 2008–2009 due to political unrest and financial speculation. However, it has also been found that the market can recover with improved political stability (Nazir et al. 2010). Similarly, uncertainty in the foreign exchange market can impact the Islamic finance market (Erdogan et al. 2020). Research has also shown the impact of macroeconomic factors on the stock market. For example, Humpe and Macmillan (2009) found a positive relationship between industrial production and stock prices. Saeedian et al. (2019) showed the level of mutual involvement among 40 global stock exchange indices and economies with the largest GDP. The impact of shocks on the stock market has also been studied. Hussain et al. (2015) found that adverse shocks significantly impact the stock market more than positive shocks. Tule et al. (2018) found a solid one-way effect of shocks on both the stock and foreign exchange markets. Additionally, declining prices in Asia can impact risk in the U.S. market (Shen 2018).
The stock market is affected by various factors, including news data, political stability, macroeconomic factors, and shocks. Researchers have found that these factors can significantly affect stock price return and uncertainty. The news model proposes that new information, either positive or negative, can affect stock market returns by changing investors’ expectations (Nofsinger and Sias 1999). In other words, news events can revise market participants’ beliefs about future cash flows and risk, influencing their trading decisions and ultimately impacting market prices (Barberis et al. 1998). According to the efficient market hypothesis (EMH), stock prices fully reflect all publicly available information, including news, and therefore it is impossible to consistently earn abnormal returns by trading based on news events (Fama 1970). However, empirical evidence has challenged this assumption showing that news events impact stock prices, especially in the short term (Grossman and Stiglitz 1980; Jegadeesh and Titman 1993). One explanation for this phenomenon is that investors may suffer from cognitive biases, such as overconfidence, herding, or anchoring, which prevent them from completely processing and rationally incorporating all the available information (R. J. Shiller 2003). The news model suggests that the effect of news events on stock market returns is not uniform across time and stocks. For instance, some news events may have a stronger impact on the returns of certain sectors or industries, while others may be more relevant for specific companies or countries (Frazzini and Lamont 2007). The timing and frequency of news releases can also affect their market impact, as investors may have different expectations about when and how often news should arrive (Tetlock 2011). The news model is based on the idea that news events and announcements impact stock market returns. This model suggests that the market reacts to new information about companies and other economic factors, causing prices to adjust accordingly (Kavussanos and Visvikis 2006). News events can be categorized as either positive or negative and can include a range of factors such as economic indicators, corporate earnings announcements, and political developments (Wei and Nguyen 2020).
The impact of news events on stock market returns has been studied extensively in the finance literature. The efficient market hypothesis (EMH) suggests that stock prices reflect all available information, including news events, and therefore, it is impossible to consistently earn excess returns by trading on the news alone (Fama 1970). However, this theory has been challenged by the growing body of evidence suggesting that news events significantly impact stock market returns (Nizer and Nievola 2012). One theoretical framework proposed to explain the relationship between news events and stock market returns is the attention-based model (ABM) (Barber and Odean 2008). According to this model, investors are more likely to pay attention to and act on news events that are salient and easily understandable. Therefore, more salient news events will likely impact stock prices more (Bollen et al. 2011). Another theoretical framework that has been proposed is the sentiment-based model (SBM) (M. Baker and Wurgler 2006). This model suggests that news events can influence market sentiment, affecting stock prices. Positive news events are likely to increase market optimism and result in higher stock prices, while negative news events are likely to decrease market optimism and lower stock prices (Y. Liu and Yang 2017). Cevik et al. (2020) investigated the impact of crude oil prices on stock market returns in Turkey, taking into account uncertainty spillovers. The results showed that Brent crude oil prices significantly impact stock market returns in Turkey, as seen in 1993 and 2008–2009. During the financial crisis, there was a significant reversible inferred volatility spillover between oil and stock markets, increasing the association between the two. Liu et al. (2020) studied the competitive association and uncertainty transfer between the oil market and the U.S. stock market using volatility spillover indices, finding a solid time-varying positive association between oil and stock-implied volatility returns. Studies have shown that individual stock prices tend to decrease during extreme market conditions. The negative relationship between economic policy uncertainty and stock market co-movements has also been proven. The body of research conducted by (Al-Nefaie and Aldhyani 2022; Correa-Garcia et al. 2018; Dospinescu and Dospinescu 2019; Panyagometh 2020) significantly contributes to the existing literature by enhancing our comprehension of the intricate relationship between financial communication and stock exchanges. Panyagometh (2020) meticulous analysis of the pandemic’s impact on Thailand’s stock exchange uncovers its profound effects on market behavior, investor sentiment, and overall performance, thus shedding light on the exchange’s vulnerabilities and resilience during times of crisis. Dospinescu and Dospinescu (2019) delve into financial communication practices within the Romanian stock exchange, utilizing a comprehensive profitability regression model to discern the influence of communication strategies on company performance. The outcomes of their study underscore the pivotal role of transparent communication in shaping profitability and facilitating informed decision-making processes within the Romanian stock exchange context. Similarly, Correa-Garcia et al. (2018) highlight the importance of effective corporate social responsibility (CSR) communication for Colombian business groups operating in the stock exchange arena. Through an exhaustive analysis of corporate reports, their research establishes a clear link between responsible corporate behavior, financial performance, and stakeholders’ perceptions. This study accentuates the criticality of CSR communication in enhancing reputation and generating substantial value within the Colombian stock exchange. Al-Nefaie and Aldhyani (2022) employ sophisticated modeling techniques and historical data to predict close prices in the Saudi stock exchange. Their meticulous examination of intricate price patterns and dynamics provides invaluable insights that empower investors and market participants to make well-informed decisions and develop effective investment strategies within the Saudi stock exchange.
The spread of COVID-19, oil price instability, geopolitical crisis, and economic policy instability have been linked within a time-frequency system. COVID-19 significantly impacts global instability more than economic insecurity in the United States. Its vulnerability is regarded differently in the short and long term and can be viewed as a financial crisis at first. The increasing number of confirmed COVID-19 cases has a negative effect on stock market responses, but financial markets still react quickly to the pandemic. However, the timing of the reaction varies based on the epidemic level.
2.1. Hypothesis and Conceptual Framework
This study aims to investigate the relationship between news events and the Pakistan Stock Exchange. We have developed four hypotheses to guide our research, each of which will be tested using econometric models and statistical analysis. Our first hypothesis (H1a and H1b) explores the association between good(positive) and bad(negative) news events and the KSE-100 index, while the second hypothesis (H2a and H2b) examines the relationship between news events(eight major news events) and the KSE-100 index. We will discuss each hypothesis in detail and explain our approach to testing them.
2.2. Development of Hypotheses
The following null and alternative hypotheses have guided this study:
H1a.
There is no significant association between good (positive) and bad (negative) news events and Pakistan Stock Exchange.
H1b.
There is a significant association between good (positive), and bad (negative) news events and Pakistan Stock Exchange.
H2a.
There is no significant association between news events (political, economic, financial, global, institutions, profit taking, investment in blue chips, foreign relations) and Pakistan Stock Exchange.
H2b.
There is a significant association between news events (political, economic, financial, global, institutions, profit taking, investment in blue chips, foreign relations) and Pakistan Stock Exchange.
2.3. Testing of Hypotheses
H1a.
There is no significant association between good (positive) and bad (negative) news events and Pakistan Stock Exchange.
This hypothesis suggests that no significant relationship exists between good or bad news events and the Pakistan Stock Exchange. To test this hypothesis, We regularly collected data on news events and the KSE-100 index between 2012 and 2022 and performed the statistical analysis, such as regression analysis, to see if there is a significant relationship between the two variables. If the p-value of the regression analysis is more significant than 0.05, We will fail to reject the null hypothesis, indicating no significant association between good/bad news events and the KSE-100 index.
H1b.
There is a significant association between good (positive) and bad (negative) news events and Pakistan Stock Exchange.
This hypothesis suggests a significant association between good/bad news events and Pakistan Stock Exchange. Like the previous hypothesis, We collected data on news events and the KSE-100 index and conducted a regression analysis to test this hypothesis. If the p-value of the regression analysis is less than 0.05, We will reject the null hypothesis and conclude that there is a significant association between good/bad news events and the KSE-100 index.
H2a.
There is no significant association between news events (political, economic, financial, global, institutions, profit taking, investment in blue chips, foreign relations) and Pakistan Stock Exchange.
This hypothesis suggests no significant relationship exists between news events such as political, economic, financial, and global institutions, profit taking, investment in blue chips, foreign relations, and Pakistan Stock Exchange. We collected data on these news events and the KSE-100 index to test this hypothesis and performed a regression analysis. If the p-value of the regression analysis is more significant than 0.05, We will fail to reject the null hypothesis and conclude that there is no significant association between these determinants and the KSE-100 index.
H2b.
There is a significant association between the news events (political, economic, financial, global, institutions, profit taking, investment in blue chips, foreign relations) and Pakistan Stock Exchange.
This hypothesis suggests a significant association between news events and the KSE-100 index. Data were collected on these news events and the KSE-100 index and a regression analysis to test this hypothesis was performed. If the p-value of the regression analysis is less than 0.05, we will reject the null hypothesis and conclude that there is a significant association between these news events and the KSE-100 index.
3. Data and Methodology
3.1. Research Design
In this study, we utilize a quantitative research design to investigate the impact of news events on the stock market performance in Pakistan. The primary data source will be the KSE-100 index returns data from 2012 to 2022 obtained from the official website of the Pakistan Stock Exchange. Independent variables, including political, economic, financial, global, profit-taking, investment in blue chips, and foreign relations news events, will be gathered from “The News”, a weekly paper. The research group of this newspaper provides weekly graphs and explanations of the reasons behind fluctuations in the KSE-100 index as shown in below Figure 1. To analyze the data, we use statistical analysis to measure and examine the relationship between variables. The appropriateness of using quantitative research in this study is that it will allow researchers to thoroughly investigate and analyze the impact of news events on the stock market performance in Pakistan. Furthermore, this study provides information on the magnitude of positive and negative news on the KSE-100 index. The data collection process will entail gathering data from two sources and using a quantitative approach to analyze it.
Time series analysis of weekly fluctuations in KSE-100 index: An examination of the market’s performance from Monday to Friday.
3.2. Classification of Variables
The classification of variables seems to be generally correct, but some improvements can be made to the explanations:
- Political category:
Within the political category, we have identified several relevant sub-groups that serve as critical indicators of political stability. These sub-groups, which include political turmoil, Supreme Court orders, arrests of former leaders from the PTI party, political unrest within the country, delays in elections, incidents of blasts in cities, the prevailing law and order situation, and the National Reconciliation Ordinance, represent a selection of the specific aspects we consider when categorizing news events within the political domain. By incorporating these sub-groups, we aim to capture and assess the multifaceted nature of political dynamics and their potential implications for the market’s overall stability. Several studies have examined the impact of business and political news on stock markets. Al-Maadid et al. (2020) emphasize the importance of news releases in shaping the GCC stock markets. Önder and Şimga-Mugan (2006) investigate the effects of political and economic news on emerging markets. Sajid Nazir et al. (2014) analyze political events’ impact on Pakistan’s stock market returns.
- Economic category:
Within the economic environment category, we have identified a range of sub-groups that serve as pertinent indicators of economic conditions. These sub-groups, which encompass changes in oil, gas, and electric power prices, monetary policy decisions, uncertainties surrounding government securities rates, federal budget dynamics, corporate sector policy rates, inflation levels, fiscal deficit trends, discount rates, energy shortfalls, interest rates, and the implementation of value-added taxes, represent a selection of factors we consider when assessing news events within the economic sphere. By incorporating these sub-groups, we aim to capture and evaluate various facets of the economic environment, which can significantly influence the stock market and financial outcomes. Extensive research has examined stock market reactions to economic news. The role of stock market news sentiment in shaping economic policy uncertainty has been emphasized by Allen et al. (2019) and Baker et al. (2016). Additionally, Birz and Lott (2011) have provided evidence of the influence of macroeconomic news on emerging markets.
- Financial category:
Within the financial category, we have incorporated a comprehensive range of sub-groups that pertain to various aspects of the financial landscape. These sub-groups encompass factors such as foreign inflows and selling, foreign buying, mutual funds, MTS (margin trading system), taxes, rollover, T-bills (treasury bills), profit selling, investor behavior, range bonds, consolidations, rate cut, trade in low-price stocks, payouts, trade in oversold stock, value hunting, cherry-picking, lackluster trade, value buying, bargain hunting, and dull trading. These sub-groups serve as essential indicators within the financial domain, enabling us to capture and analyze significant events and trends that shape the financial market’s dynamics. Several studies have examined the relationship between stock market returns and financial news. Campbell and Hentschel (1992) found that no news is good news, indicating positive effects on stock prices. Cepoi (2020) explored the asymmetric dependence between stock returns and news. Fung (2017) focused on stock trend prediction using a financial news classification strategy. Using financial market news, (Wei and Nguyen 2020) investigated stock trend prediction.
- Global category:
We have identified several crucial sub-groups within the global category in assessing the international landscape. These sub-groups, including foreign dealings, inflows, joint funds, mobile telephony services, duties, and rollover, are considered pertinent indicators of the financial sector in a global context. By incorporating these sub-groups, we aim to gain insights into the dynamics and trends that shape the international financial environment. CPEC’s impact on the Pakistan Stock Exchange (PSX) has been examined by Ghafoor et al. (2020), while Padungsaksawasdi and Treepongkaruna (2023) studied investor attention to global stock market volatility. Studies such as these provide insight into how stock markets react to global events.
- Institutions category:
We have identified various sub-groups indicative of the institutional environment within the institutions category. These sub-groups encompass events related to prominent institutions such as the State Bank of Pakistan, Oil and Gas Regulatory Authority, Securities and Exchange Commission of Pakistan, Oil and Gas Development Company Limited, National Bank of Pakistan, Pakistan Petroleum Limited, as well as factors such as speculative buying, cement industry dynamics, future settlement activities, institutional support, and market consolidation. By considering these sub-groups, we aim to capture and analyze the key indicators that shape the institutional landscape within the context of our study. There has been some research on institutional news impact on the stock market Bouri and Harb (2022) and Wanidwaranan and Padungsaksawasdi (2022). Those studies contribute to our understanding of the subject matter and provide valuable insights.
- Profit-Taking category:
Within the profit-taking category, we have identified several sub-groups that serve as relevant indicators of profit-taking activity in the stock market. These sub-groups include profit-taking, selling pressure, earnings in shares, and stock market sales. By examining these indicators, we aim to gain insights into the dynamics of profit-taking behavior and its impact on the stock market. According to Al-Nassar (2014), trading rules are more profitable when they emphasize evidence from the GCC countries. Campbell and Hentschel (1992) conducted a study highlighting the impact of news on stock market dynamics and providing valuable insights into the influence of profit-taking news and its impact on the stock market.
- Investment in Blue Chips category:
Within the Investment in blue chips category, we have identified a sub-group that is a relevant indicator of investment activity in the stock market: investment made in blue chips. Blue chip stocks are widely recognized as stable and reliable investments, often considered safer due to their established track record and financial stability. By examining investment patterns in blue chip stocks, we can gain insights into investor behavior and the overall sentiment towards these renowned companies within the stock market. The studies by Conrad et al. (2002) and Gulen and Hwang (2012) provide valuable insights into investment in blue chip stocks. They investigate the impact of news, daily market swings, and investor response, revealing significant effects on the stock market dynamics. These findings enhance our understanding of the complexities involved in investing in blue chips.
- Foreign Relations category:
Within the foreign relations category, we have identified sub-groups that serve as relevant indicators of foreign relations and their impact on the stock market. These sub-groups include news related to foreign relations with key stakeholders such as NATO, the United States, the United Kingdom, and India. Understanding the dynamics and developments in foreign relations can provide valuable insights into the potential effects on the stock market, as geopolitical events and international relations often have far-reaching consequences on global economic and financial markets. Many studies have focused on the relationship between news sentiments, the importance of announcements, and institutional and macroeconomic drivers in the stock market. Studies show that the stock market has been severely influenced. These studies improve our understanding of how institutional, political, and news sentiment affect stock market dynamics (Allen et al. 2019; Al-Maadid et al. 2020; Cherif and Gazdar 2010).
4. Results and Discussions
4.1. ARCH and GARCH Models
In data analysis, we use various ARCH and GARCH models, such as testing the ARCH effect, forecasting the volatility of ARCH, and comparing the ARCH and GARCH models. The similarities and differences between these models will be discussed, and an evaluation approach will be used to assess the error constraints in the GARCH(1,1) models. Statistical modeling and validity analysis for variables were examined using error constructs.
4.2. Testing of the ARCH Effect
This study explores whether autoregressive conditional heteroskedasticity (ARCH) effects are present in a given data set before estimating the ARCH model. We will determine whether the data are better suited for estimation using the ARCH model or ordinary least squares (OLS) methods. Identifying ARCH effects is a crucial step in time series analysis since it enables proper accounting for the potential non-constant variance of the residuals. The generalized autoregressive conditional heteroskedasticity (GARCH) model is widely accepted for capturing such effects. We can ensure our analysis’s optimal statistical accuracy and rigor by first testing for ARCH effects and estimating the appropriate model. The autoregressive (AR) representation of squared residuals is given as:
In the context of time series analysis, autoregressive conditional heteroskedasticity (ARCH) effects are exciting. The significance of the parameters is evaluated to determine whether such effects are present. The significance of these parameters is an indicator of the presence of conditional volatility, which is synonymous with the presence of the ARCH effect. The null hypothesis assumes the absence of ARCH effects and the significance of the parameters This hypothesis confirms or rejects the presence of ARCH effects. Thus, evaluating parameter significance is crucial in general ARCH modeling and time series analysis.
Therefore, testing for ARCH(1) effects
This null hypothesis which means this model is homoscedastic against the alternative hypothesis which means it is heteroscedastic. The LaGrange multiplier (LM) is often used to test for the presence of ARCH effects, and if there is no ARCH effect, then implies that no ARCH effects fit of the H1 model will be poor, and R2 will also be low. However, if there are ARCH effects, will be significant, and R2 will be relatively high. The LM test statistic is where is the sample size, is the number of on the right side of the model, is the number of complete observations, is the coefficient of determination. If the H0 is true, then is distributed as , that is . If , then H0 is rejected, which employs that this model evidences the presence of the ARCH effect. This study aims to forecast the volatility of the returns of the KSE-100 index.
The graph illustrates the constrained evidence of volatility. The below Figure 2. illustrates the constrained evidence of volatility, where large and small changes often follow large changes followed by further small changes.
The corresponding Table 1 below reveals that and is statistically significant at a level of 1%. Consequently, we reject the null hypothesis that there are no ARCH effects and employ the alternative hypothesis. The next course of action is to assess the presence of the ARCH effect. We will utilize EViews for this purpose, setting the number of lags to one, as we are conducting an ARCH (1) test to determine the presence of ARCH in our specification (AR,1) as shown in Table 1 below.
The LM statistic, depicted above, yields a value of approximately 52.222, with a corresponding p-value of 0.000, indicating statistical significance at a 1% level. This finding carries substantial significance, as it allows us to reject the null hypothesis and accept the alternative hypothesis, which asserts the presence of ARCH effects. Based on the LM statistic of 52.222 and the corresponding p-value of 0.000, we reject the null hypothesis (H0) and accept the alternative hypothesis (H1), thus confirming the presence of the ARCH(1) effect in the data. Consequently, we must estimate an ARCH model to obtain more accurate results for our analysis.
4.3. ARCH vs. GARCH Models
4.3.1. Similarities
Both ARCH and GARCH models are used to capture the volatility of the variance, and they both focus on the behavior of the conditional variance to estimate the asset’s riskiness. They both deal with stationary (time-invariant mean) and nonstationary (time-varying mean) series and capture volatility clustering with a mean reverting process. However, there are some differences between the two models. The ARCH model is overparameterized and resembles an MA model, meaning it cannot capture the leverage and asymmetric effects of good and bad news. On the other hand, the GARCH model is a parsimonious extension of the ARCH model and can capture the leverage and asymmetric effects of good and bad news.
4.3.2. Differences between ARCH and GARCH Models
Differences between ARCH and GARCH models are summarized in the following Table 2 below.
4.4. An Evaluation Approach to Using Error Constraints in GARCH(1,1) Models
In selecting an analysis model, it is essential to consider several criteria. The preferred model should be parsimonious (economical) and have few parameters. Moreover, the models’ ARCH and GARCH coefficients should be statistically significant, while their adjusted R-squared and log-likelihood ratios should be high. The Schwartz Information Criterion (SIC) should also be low, as it imposes the most significant penalties for losing a degree of freedom. In addition, the model should pass the heteroscedasticity and autocorrelation residuals test after ensuring that these criteria, as mentioned earlier, are met. To this end, five error constraints are used for the GARCH model in the EViews interface, namely the Gaussian normal distribution, the Student t’s, the generalized error distribution (GED), the Student t’s with a fixed degree of freedom, and the generalized error distribution (GED) with a fixed degree of freedom. For this study, a GARCH(1,1) model will be run using these error constructs. We will run a GARCH(1,1) model using these error constructs.
4.5. Statistical Modeling and Validity Analysis for Variables Using Error Constructs
In statistical modeling, it is essential to determine the most appropriate model for the data. This study tested three different model specifications using three distinct error constructs. The goal was to select the model that best fits the data. The analysis revealed that all three models had significant coefficients, indicating they could capture the relationship between the variables under investigation. Additionally, all three models demonstrated significant ARCH and GARCH effects, suggesting they could accurately model the data’s volatility. To ensure the validity of the selected model, residual tests were conducted to detect any potential sources of heteroscedasticity and serial correlation. The results of the tests showed that all three models had passed the residual test, indicating the absence of any significant heteroskedasticity or serial correlation. This further confirms the validity of the selected model and provides valuable information on the relationship between the variables investigated.
The rigorous analysis conducted in this study ensures that any unexplained variation in the data is considered and that the selected model is valid. These findings are crucial for further analysis and decision-making processes and contribute to advancing statistical modeling techniques in the field.
4.6. Three Distinct Criteria Are Used to Determine the Optimal Model from the Three Available Options
Three distinct criteria are used to determine the optimal model from the three available options as shown in Table 3 below. These include the log-likelihood, adjusted R-squared, and Schwartz IC. The model with the highest log-likelihood statistics, which in this case is the Student t’s model with a value of 8541.428, is initially selected. The model with the highest adjusted R-squared value is then assessed, and it is found that the GED model has the highest value, at 0.017751. The Schwartz IC is then analyzed, and the model with the lowest value among the three options is chosen. Since these values are negative, the most negative value is considered the lowest, indicating the optimal choice. As a result, the Student t’s model is deemed the best option, with a value of −6.552183, which is the most negative compared to the other two models. The normal distribution is excluded from the comparative analysis by utilizing these three distinct criteria, and a choice is made between the Student t’s and GED models. The former has two values compared to the latter’s, so it is chosen as the optimal model. Using these criteria ensures a thorough and accurate assessment of the models, resulting in selecting the most appropriate model for the given data.
4.7. GARCH(1,1) Model
The GARCH model, developed by (Bollerslev 1986), is a popular specification in modeling financial time series data due to its ability to capture volatility dynamics. The GARCH(1,1) model, which contains one lagged term of the conditional variance (h) and one lagged term of the squared error (), is widely used because it can capture how volatility changes with lagged shocks and the momentum within the system via . The model can be expressed as:
This equation shows that the conditional variance (h) at time t depends on both the past values of the shocks captured by the lagged squared error term and past values of itself . The GARCH(1,1) model can be extended to a general specification known as the GARCH(p,q) model, where p is the number of lagged terms of the conditional variance, and q is the number of lagged terms of the squared error term. The GARCH(p,q) model can be expressed as GARCH(p,q):
If p = 0, Equation (2) reduces to the ARCH(q) model.
The figure below Figure 3 shows that a particular model, namely the GARCH(1,1) model, is leptokurtic and has fat tails. In statistics, leptokurtic distributions have a higher peak than the normal distribution and heavier tails, meaning extreme events are more likely. The term “fat tails” describes the same phenomenon, meaning that the tails of the distribution are thicker than those of a normal distribution. These features are often observed in financial time series, which exhibit high-frequency data and are known to be more volatile and unpredictable than other types of data. The KSE-100 index returns are used to demonstrate these characteristics. The fact that the GARCH(1,1) model can capture these characteristics is important because it suggests that the model is a good fit for financial time series data and can provide valuable insights into market behavior.
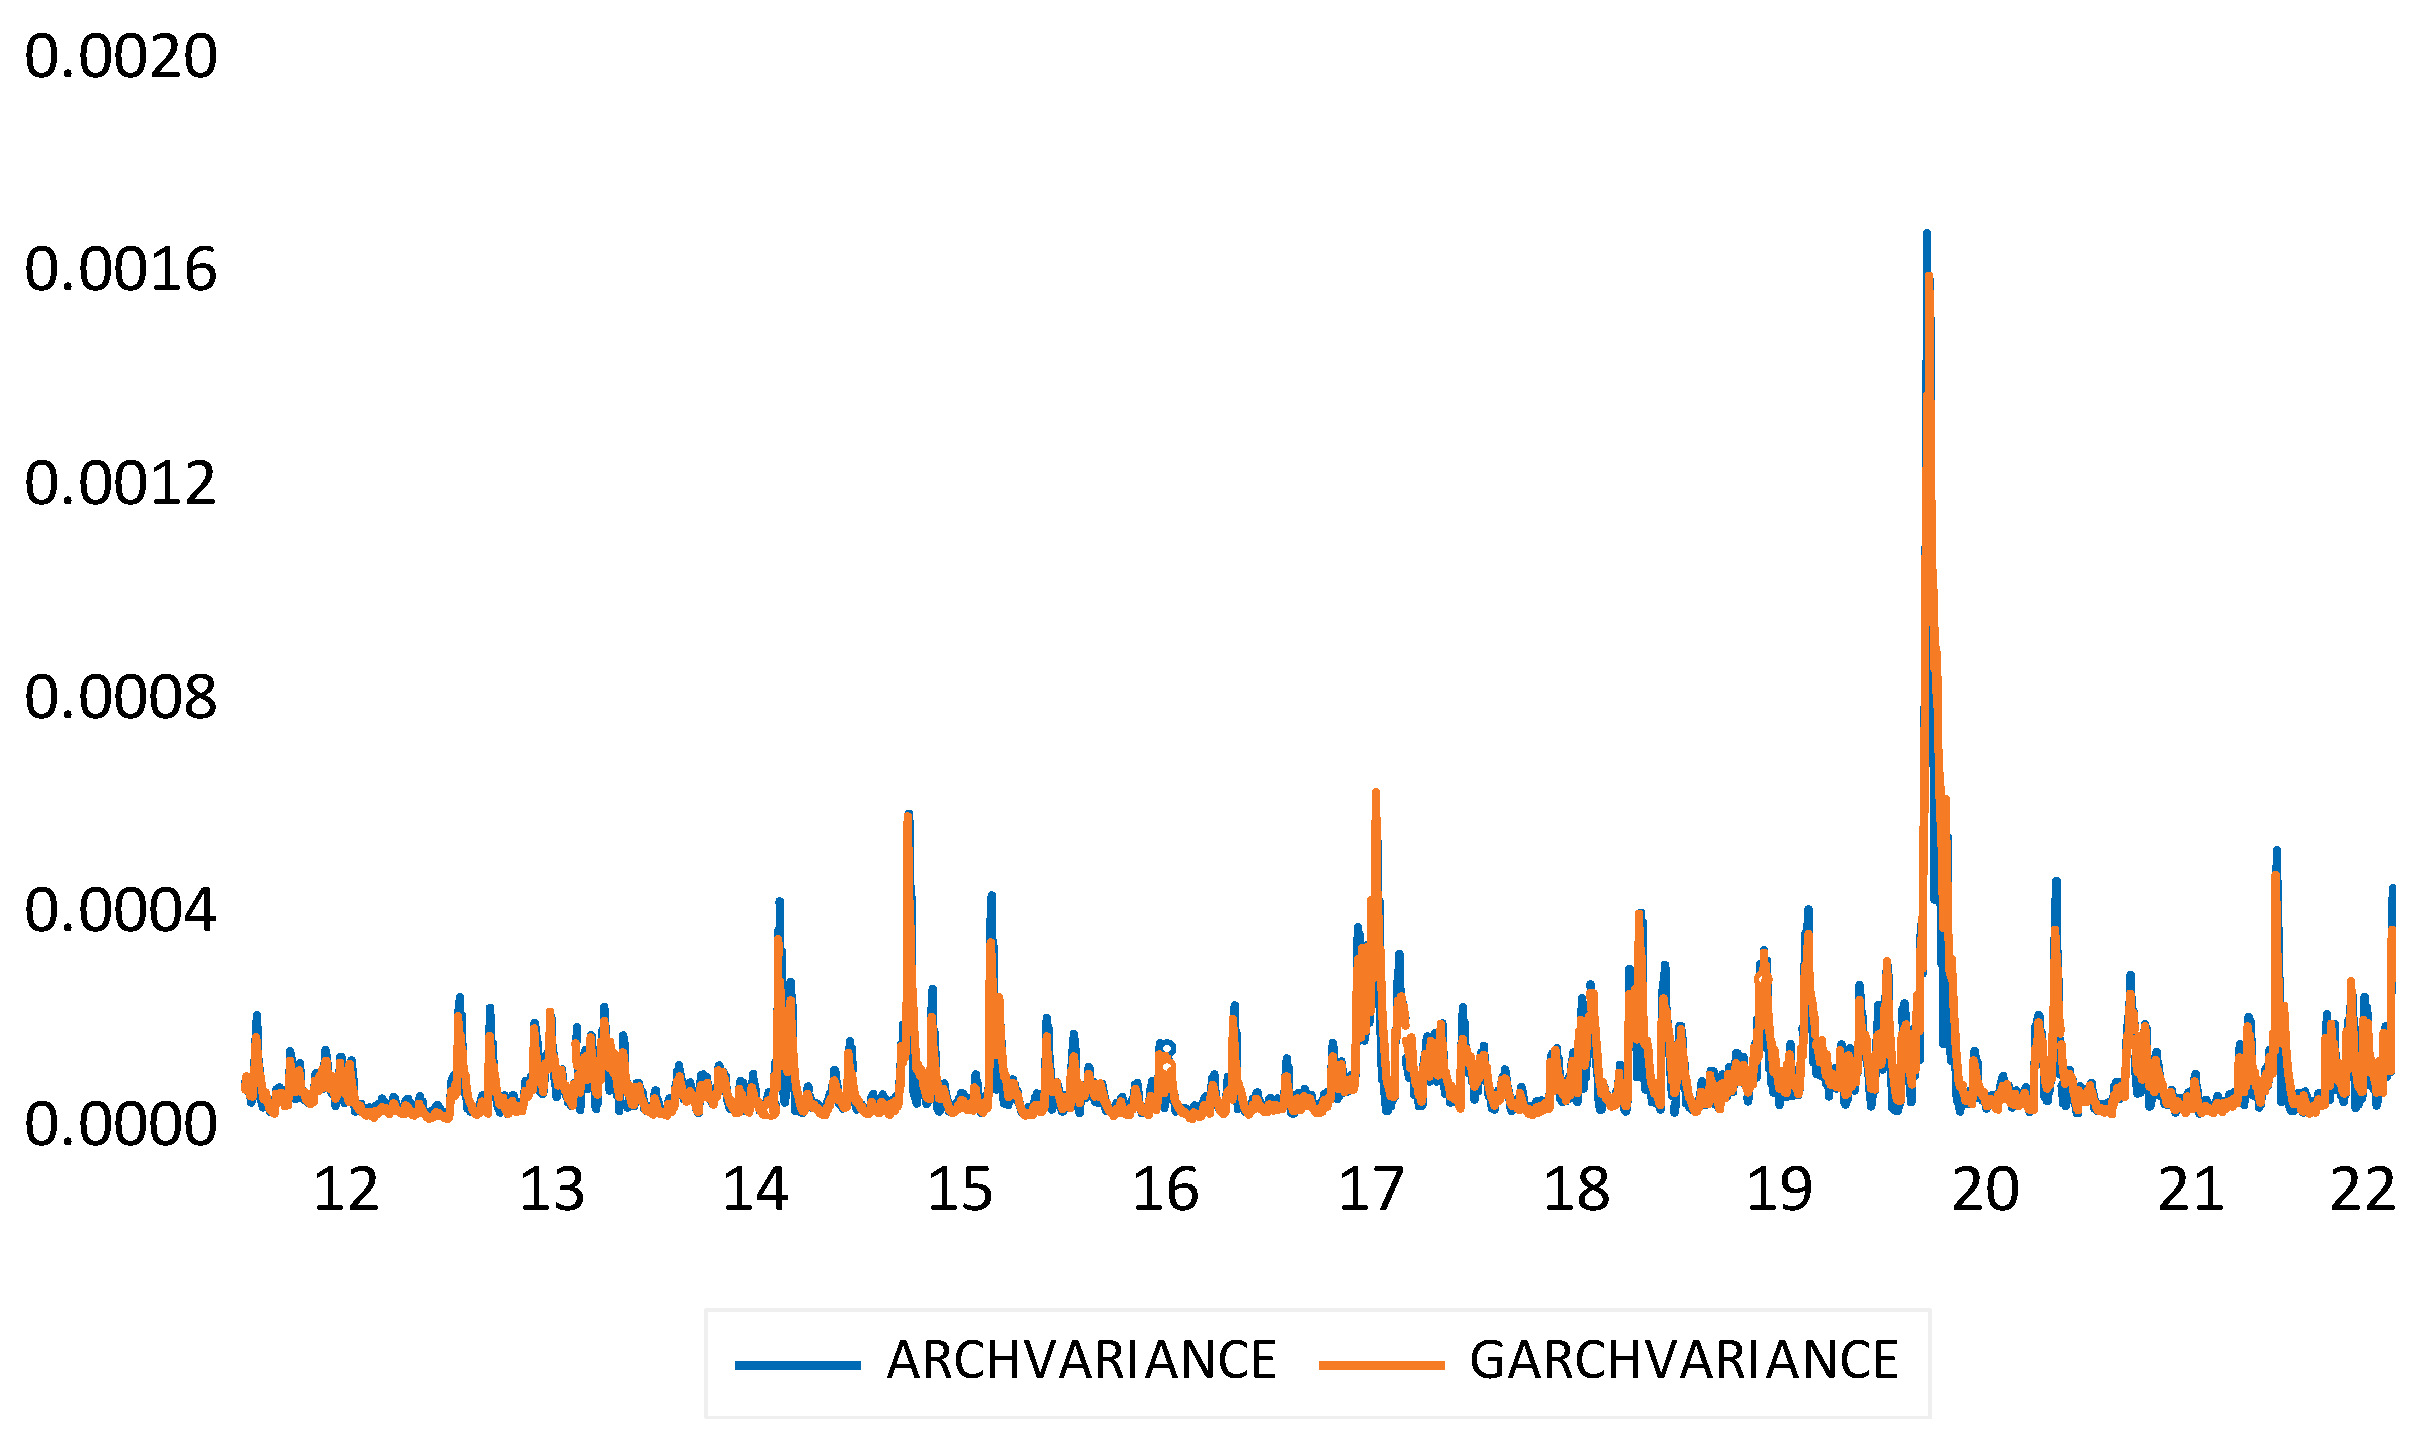
According to Table 4 and Table 5 below, it is observed that the ARCH and GARCH variances exhibit similar series behavior. This finding implies that the GARCH variance can be explained as equivalent to that of the ARCH variance with fewer parameters. Thus, it would be more appropriate to use a GARCH(1,1) model instead of an ARCH 6 model.
- ARCH Variance with seven parameters

Table 4.
ARCH variance with seven parameters.
| Variable | Coefficient | Std. Error | z-Statistic | Prob. |
|---|---|---|---|---|
| Variance Equation | ||||
| C | 3.65 × 10⁻⁵ | 1.95 × 10⁻⁶ | 18.73432 | 0.0000 |
| RESID(-1)^2 | 0.116388 | 0.021312 | 5.461225 | 0.0000 |
| RESID(-2)^2 | 0.140738 | 0.022903 | 6.145083 | 0.0000 |
| RESID(-3)^2 | 0.167742 | 0.021225 | 7.903090 | 0.0000 |
| RESID(-4)^2 | 0.051150 | 0.016489 | 3.102143 | 0.0019 |
| RESID(-5)^2 | 0.126873 | 0.018897 | 6.713979 | 0.0000 |
| RESID(-6)^2 | 0.067668 | 0.016265 | 4.160381 | 0.0000 |
- GARCH variance with three parameters
Table 5.
GARCH variance with three parameters.
| Variable | Coefficient | Std. Error | z-Statistic | Prob. |
|---|---|---|---|---|
| C | 4.31 × 10⁻⁶ | 7.00 × 10⁻⁷ | 6.155041 | 0.0000 |
| RESID(-1)^2 | 0.139006 | 0.012303 | 11.29893 | 0.0000 |
| GARCH(-1) | 0.824572 | 0.014686 | 56.14682 | 0.0000 |
Examining the variance equation shows that all coefficients are positively significant at the 1% level, indicating their substantial predictive power. No negative coefficients are present, and the focus is solely on the variance equation. Plotting the series’ variance to visualize any emerging patterns or trends would be appropriate as the next step.
Based on the presented Figure 4, it can be observed that the variances of ARCH and GARCH demonstrate similar series behavior. This discovery implies that the GARCH variance can be understood as equivalent to the ARCH variance but with fewer parameters. Thus, it would be more appropriate to use a GARCH(1,1) model instead of an ARCH 6 model, as the former provides a more substantial explanation, as evident from the variance plots. This evidence supports the superiority of the GARCH model over the ARCH model in explaining the volatility of the KSE-100 index returns. The similarity between the plots of the variance series is due to the GARCH term capturing a higher order of ARCH terms. Consequently, estimating a GARCH model instead of a higher-order ARCH model is preferred, as GARCH models use fewer parameters, provide better estimates, and use less degree of freedom.
4.8. T-GARCH Model
The T-GARCH model, or threshold GARCH model, was first introduced by (Zakoian 1990) and later by (Glosten et al. 1993). Its primary objective is to account for asymmetries related to negative and positive shocks in financial markets. The model accomplishes this by incorporating a multiplicative dummy variable into the variance equation to determine whether there is a statistically significant difference in the case of negative shocks. News, events, and other incidents significantly impact the decision-making of financial investors, leading to asymmetric effects on financial markets. These news items may include political instability, economic uncertainty, financial crisis, global news, investments in blue chips, foreign relations, terrorist attacks, and international financial markets. The standard ARCH and GARCH models treat positive “good news” () and negative shocks “bad news” () symmetrically, with their impact on asset volatility, , being the same . Basic models do not differentiate between good and bad news, so the absolute value of innovation is the only thing that matters. As a result, a large positive or negative shock has the same impact on the series’ volatility. Nonetheless, the impact of good and bad news on a financial asset or the market may be asymmetric.
Financial markets tend to experience volatility when hit with good or bad news, resulting in tranquility or turbulence where asset prices decrease or increase, respectively. To account for this phenomenon, financial econometricians have developed a way to measure the impact of news on financial assets using the GARCH threshold model (TGARCH). The conditional variance of a TGARCH(1,1) model is expressed as:
where the model includes a multiplicative dummy variable capture the asymmetry between the effects of negative and positive shocks on the variance. This allows the model to differentiate between good and bad news and determine the magnitude of their impact on the volatility of financial assets. In financial markets, good or bad news can lead to a state of tranquility or turbulence, causing volatility to decrease or increase, respectively. To capture the impact of news on financial assets, econometricians have developed the TGARCH threshold model. This model includes a multiplicative dummy variable, , which takes the value of 1 for negative shocks (i.e., bad news) and 0 otherwise. The TGARCH model distinguishes between the impact of positive and negative shocks on stocks, where positive shocks have an effect of and negative shocks have an impact of . , where γ_1 is known as the asymmetry or leverage term. A positive implies an asymmetry in the model, while corresponds to symmetry and the standard GARCH(1,1) model. If () is significant and positive, this implies negative shocks have more substantial effects on the conditional variance () than positive shocks. The TGARCH model can be extended to higher-order specifications by incorporating more lagged terms.
Therefore, the TGARCH(p,q) model is stated as
Table 6 above presents the results of a statistical analysis of the variance equation in the context of a GARCH model. The table shows the estimated coefficients for the different variables in the model, along with their standard errors, z-statistics, and p-values. One of the key findings from the analysis is that the coefficient for the asymmetric term (0.23296) is positive and statistically significant at the 1% level. This suggests that there are asymmetries in the news that affect the stock’s volatility. In particular, it implies that bad news has a larger impact on the stock’s volatility than good news, as the positive coefficient indicates that the effect of negative shocks on the stock’s volatility is stronger than positive shocks. This information can be useful for investors and analysts to understand how news and other events may impact a stock’s volatility and to develop investment strategies.
The computation of positive shocks through time series data involves estimating the time-varying volatility using the provided equation.
To define the estimated conditional volatility of the stock, we must include the constant terms, which consist of the GARCH term (0.835315), the ARCH term (0.006821), and the constant value (0.000000452). In this context, the ARCH term is represented by beta one (). The time-varying volatility is estimated using the following equation to compute negative shocks.
This equation considers the impact of the ARCH and GARCH terms and the asymmetry term (), represented by (0.232962), and is statistically significant at the 1% level. By estimating the time-varying volatility in this way, we can compute negative shocks and evaluate the effects of bad news on the conditional variance of the stock. To specify the estimated conditional volatility, including the constants, which are () and (), which is the GARCH term, and (0.006821), which is the ARCH term. The ARCH term, in this case, is beta one (). To estimate the volatility varying over time-varying over time for negative shocks, we must specify the asymmetry coefficient, represented by gamma (), which is (0.232962). This coefficient enables us to specify the negative shock in the model. In our case, the difference between the returns of good and bad news on the KSE-100 index is given by gamma (), the coefficient of the symmetric term. Our findings suggest that the model’s information, news, or events influence the stock market’s volatility. As expected, bad news has a greater impact than good news because beta one plus gamma is more effective than beta one alone (().
4.9. Regression Model
The regression model is used to analyze the impact of news and events on the movements of the KSE 100 index, a stock market index in Pakistan. The model had a dependent variable, the KSE 100 index, and eight independent variables specific to the news: political, economic, financial, global, institutions, profit taking, investment in blue chips, and foreign relations. The model aimed to determine how these news variables affected the KSE 100 index movements.
The regression model used two lagged variables for the dependent variable: the first and fifth lags. The first lag represented day-to-day trading, while the fifth lag captured the weekly effect of the stock market. In other words, the model accounted for both short- and long-term effects on the movements of the KSE 100 index.
where
ΔKSEt = α0 + α1ΔKSEt−1 + α2ΔKSEt−5 + β1Political + β2Economic +
β3Financial + β4Global + β5Instituitions + β6Profit Taking +
β7Investment in Blue Chips + β8Foreign Relations + εt
β3Financial + β4Global + β5Instituitions + β6Profit Taking +
β7Investment in Blue Chips + β8Foreign Relations + εt
- = the stock market’s value without “Political, Economic, Financial, Global, Institutions, Profit taking, Investment in blue chips, and Foreign relationships.”
- = Lagged dependent variable, which is daily trading
- = fifth lagged term of the dependent variables that the stock market also responds to the weekly effect of the stock market
- represents the difference between the actual KSE 100 index and the predicted values from the model.
The alpha values represent the stock market’s value without news variables. Beta values represent the coefficients for each of the eight news variables. The model also includes an error term, which represents the difference between the actual KSE 100 index and the predicted values from the model. The regression analysis aimed to determine how much news and events affected the KSE 100 index movements. By including specific news variables in the model, the researchers could analyze the impact of different types of news on the stock market. This type of analysis is essential for investors and policymakers who need to understand the factors that influence stock market performance. Using lagged variables allowed researchers to capture short- and long-term effects on KSE 100 index movements. The regression model provides a valuable tool for analyzing the relationship between news and stock market performance. By examining the impact of specific news variables on the movements of the KSE 100 index, researchers gained insight into the complex relationship between news and stock market speculation. These insights can inform future studies of financial markets and aid in forecasting market volatility. Our analysis showed that institutional news significantly affected movements in the stock market, with a 17% share. Financial changes accounted for 19%, economic changes for 18%, political changes for 17%, profit-taking for 13%, and global changes for 11% of all causes of changes in the stock market index over the past ten years. We also found that the impact of foreign relations and investment in blue chips on the stock market was minor compared to other causes.
4.9.1. Statistical Analysis of Eight Variables: An Examination of Mean Values
Table 7 below presents the statistical analysis of eight variables: economic, financial, foreign relations, global, institutional, blue chips, political, and profit-taking. The table provides each variable’s mean, standard deviation, minimum, and maximum values based on the examined data. The mean values for the eight variables range from −33.12 to 115.02, indicating that the institutional variable has the highest mean value while profit-taking has the lowest. The standard deviation values range from 195.94 to 372.01, implying that the political variable has the highest standard deviation while foreign relations has the lowest. The minimum and maximum values range from 2153 to 1566, implying that the institutional variable has the highest maximum value while the Political variable has the lowest minimum value. In general, the table provides valuable information on the statistical properties of the variables examined and can be useful to researchers and investors in the financial field.
Table 8 below provides a detailed analysis of the impact of eight key news/events on the KSE index, along with the corresponding positive and negative effects. In the past ten years, economic news had a positive impact, resulting in an average change of 24.62 with a high value of 1195 and a low value of −992. However, financial news had a negative impact, resulting in an average change of −4.41 with a high value of 1096 and a low value of −1811. Similarly, 825.56 and 115.02, respectively. In contrast, global, political, and profit-taking news had a negative impact, resulting in an average change of −29.07, −27.48, and −33.12, respectively. These results suggest that certain news/events significantly impact the stock market, which investors should consider when making investment decisions.
4.9.2. Model 1: Construction of an Ordinary Least Squares (OLS) Regression Model for the Parameters Using First and Fifth Lagged Data
Table 9 below presents the results of the ordinary least squares (OLS) regression model for several variables using first- and fifth-lagged data. The R-squared value of 0.06 indicates that only 6% of the variation in the dependent variable can be explained by the independent variables. The coefficient for KSE(-1) is positive, indicating a positive relationship between the value of the KSE-100 index of the previous day and the current day’s value. KSE(-5) also has a positive coefficient, indicating that the index value five days ago slightly affects the current day’s value. Institutional factors have the highest coefficient (181.04), followed by economic factors (92.69) and blue chips (138.53) factors. Political and profit-taking factors have the lowest coefficients, and their p-values are not statistically significant. The F-statistic is significant (p < 0.001), indicating that at least one of the independent variables has a significant relationship with the dependent variable. The Durbin–Watson statistic of 1.99 suggests no significant autocorrelation between residuals.
4.9.3. Model 2: Regression Model with Separated Positive and Negative Values Using First and Fifth Lag
Table 10 presents the results of a regression model with separated positive and negative values using data from the first and fifth lagged. The table shows each independent variable’s coefficients, standard errors, t-statistics, and probabilities. The dependent variable has a mean of 11.19 and a standard deviation 307.93. The R-squared value of the model is 0.44, indicating that the model explains 44% of the variability in the dependent variable. Variables that have a significant impact on the dependent variable are POLITICAL (+), ECONOMIC (+), FINANCIAL (+), INSTITUTIONS (+), GLOBAL (−), PROFIT TAKING (+), BLUE CHIPS (+), and FOREIGN RELATIONS (+), with p-values of 0.000 for each variable. In contrast, the variables POLITICAL (−), ECONOMIC (−), FINANCIAL (−), INSTITUTIONS (−), GLOBAL (−), PROFIT TAKING (−), BLUE CHIPS (−), and FOREIGN RELATIONS (−) do not have a significant impact on the dependent variable, with p-values above 0.05 for each variable. The model also includes a statistically significant intercept term with a t-value of −2.38 and a p-value of 0.017. The F-statistic for the model is 94.68, with a p-value of 0.000, indicating that the overall model is significant.
The regression model in this study involves running separate regressions for positive and negative values using first and fifth lagged data. This approach aims to examine the effects of the lagged variables on positive and negative values separately. By analyzing the effects separately, this model can provide a more nuanced understanding of the relationship between the variables of interest. After excluding the first and fifth lags, we discovered that the institutional, economic, and blue chip variables were significant, while the other variables were not. This was believed to be due to equalizing the values, and as a result, we performed separate regressions on positive and negative values. The first and fifth lags were evaluated in Model 2, and since the fifth lag was deemed insignificant, it was omitted.
4.10. A Regression Analysis Employs ARCH/GARCH Models
Table 11 below presents the regression analysis results using ARCH/GARCH models. This analysis aimed to determine the impact of various factors on the variance of a dependent variable. The results indicate that some independent variables have a statistically significant impact on the variance of the dependent variable. The coefficient of determination (R-squared) was found to be 0.36, indicating that the model’s independent variables can explain 36% of the variance in the dependent variable. The adjusted R-squared value is also 0.36, indicating that the model fits well. Among the independent variables, POLITICAL (−) had the strongest negative impact on the variance of the dependent variable with a coefficient of −90.34, followed by GLOBAL (−) with a coefficient of −103.25, ECONOMIC (−) with a coefficient of −85.92, and FINANCIAL (−) with a coefficient of −86.36. Conversely, FINANCIAL (+) had the highest positive impact on the dependent variable’s variance with a coefficient of 173.59, followed by GLOBAL (+) with a coefficient of 135.34, and INSTITUTIONS (+) with a coefficient of 160.06.
Furthermore, the results of the variance equation’s results indicate that RESID(-1)^2, RESID(-2)^2, RESID(-3)^2, RESID(-4)^2, and RESID(-5)^2 have a significant impact on the variance of the dependent variable. Additionally, GARCH(-1), GARCH(-2), GARCH(-3), GARCH(-4), and GARCH(-5) have significant negative and positive impacts on the variance of the dependent variable. Overall, this analysis provides insights into the factors that significantly influence the dependent variable’s variance and can assist in developing effective strategies for managing risk and uncertainty. Our findings revealed that all types of news, except economic news, had a negative impact on the stock market. Negative news was also seen to cause sudden changes in the stock market. On the contrary, the changes were more random when there was positive news, and investors were more attentive to investing, reflecting their risk-averse nature. Unlike Model 1 and Model 2, we found a more significant influence of political, financial, and economic news on positive fluctuations. The ARCH and GARCH coefficients revealed strong influences of these three types of news, signifying nonlinear inertia in stock market movements.
5. Conclusions
Many variables can contribute to the rapid nature of the stock market. Three distinct criteria are used to determine the optimal model from the three available options. These include the log-likelihood, adjusted R-squared, and Schwartz IC. The model with the highest log-likelihood statistics, which in this case is the Student t’s model with a value of 8541.428, is initially selected. The model with the highest adjusted R-squared value is then assessed, and it is found that the GED model has the highest value, at 0.017751. The Schwartz IC is then analyzed, and the model with the lowest value among the three options is chosen. Since these values are negative, the most negative value is considered the lowest, indicating the optimal choice. As a result, the Student t’s model is deemed the best option, with a value of −6.552183, which is the most negative compared to the other two models. The normal distribution is excluded from the comparative analysis by utilizing these three distinct criteria, and a choice is made between the Student t’s and GED models. The former has two values compared to the latter’s, so it is chosen as the optimal model. Using these criteria ensures a thorough and accurate assessment of the models, resulting in selecting the most appropriate model for the given data. It is observed that the ARCH and GARCH variances exhibit similar series behavior. This finding implies that the GARCH variance can explain as equivalent to that of the ARCH variance with fewer parameters. Thus, it would be more appropriate to use a GARCH(1,1) model instead of an ARCH 6 model, as the former provides a more substantial explanation, as evident from the variance plots. This evidence supports the superiority of the GARCH model over the ARCH model in explaining the volatility of the KSE-100 index returns. The similarity between the plots of the variance series is due to the GARCH term capturing a higher order of ARCH terms. Consequently, estimating a GARCH model instead of a higher-order ARCH model is preferred, as GARCH models use fewer parameters, provide better estimates, and use less degree of freedom.
One of the key findings from the analysis is that the coefficient for the asymmetric term (0.23296) is positive and statistically significant at the 1% level. This suggests that there are asymmetries in the news that affect the stock’s volatility. In particular, it implies that bad news has a larger impact on the stock’s volatility than good news, as the positive coefficient indicates that the effect of negative shocks on the stock’s volatility is stronger than positive shocks. This information can be useful for investors and analysts to understand how news and other events may impact a stock’s volatility and to develop investment strategies.
Economic factors often explain monthly movements, and predicting daily changes is much more challenging. A more effective approach is to examine the impact of news on daily stock market fluctuations. In our research, we evaluated the impact of different news categories on the stock market and found that global and political news had a substantial impact. This implies that individuals or institutions may exploit international and political news to influence the stock market. Investors respond quickly to negative news, creating a potentially hazardous stock market. In addition to political, economic, and financial news, negative news can result in a riskier stock exchange. On the other hand, investments in blue chips were observed as a result of stock market fluctuations rather than the cause.
To gain a deeper understanding of the stock market, it is essential to consider the influence of news and its impact. The findings from our research provide valuable insights into the relationship between news and the stock market and can aid individuals and institutions in making informed decisions. Additionally, it highlights the importance of monitoring international and political news and the potential risks associated with negative news. Many factors can contribute to the volatile nature of the stock market. While economic factors can explain monthly movements, daily changes can be challenging to predict and can only be approached through the analysis of news impact.
Our examination of daily fluctuations in the stock market found that global and political news substantially impact the stock market. Individuals or institutions can use international and political news to influence the stock market. Moreover, investors respond promptly to negative news, which can result in hazardous stock exchange conditions. It is important to note that investments in blue chips were a result rather than a cause of fluctuations in the stock market. In conclusion, our research provides a comprehensive analysis of the impact of news on the stock market and provides valuable insights for investors and decision-makers.
Based on our findings, we recommend the following actions for investors. Firstly, closely monitor global and political news due to their significant impact on the stock market. Secondly, diversify investments across sectors to mitigate risks from negative news. Seek professional advice for those unfamiliar with the stock market. Lastly, exercise caution when responding to negative news to avoid impulsive decisions. Our research emphasizes news impact and the role of global and political news in shaping stock exchange conditions. Stay informed, diversify portfolios, seek guidance, and exercise caution for successful investment outcomes.
6. Future Research Directions
Future research directions can encompass several aspects. Firstly, there is a scope for further exploration of the impact of specific news and events on the stock market, considering different sectors and market conditions. Secondly, developing advanced predictive models that integrate news data, utilizing sophisticated statistical techniques or machine learning algorithms, could enhance the accuracy of daily stock market forecasts. Additionally, research can focus on risk assessment and management strategies, providing frameworks or tools to assist investors and institutions in mitigating the effects of negative news on portfolios. Moreover, investigating the dynamics of international and political news and their influence on stock market behavior can provide valuable insights. Lastly, studying the long-term implications of news events on stock market performance over extended periods would be beneficial.
Author Contributions
Conceptualization, S.R. and S.B.; methodology, S.R.; software, M.A.K.; validation, S.R., S.B. and P.K.-K.; formal analysis, S.R.; investigation, S.R.; data curation, S.R.; writing—original draft preparation, S.R.; writing—review and editing, P.K.-K.; visualization, M.A.K.; supervision, S.B. All authors have read and agreed to the published version of the manuscript.
Funding
This research received no external funding.
Informed Consent Statement
Not applicable.
Data Availability Statement
Data will be available on request.
Conflicts of Interest
The authors declare no conflict of interest.
References
- Ali, Fahad, Ahmet Sensoy, and John W. Goodell. 2023. Identifying Diversifiers, Hedges, and Safe Havens among Asia Pacific Equity Markets during COVID-19: New Results for Ongoing Portfolio Allocation. International Review of Economics & Finance 85: 744–92. [Google Scholar] [CrossRef]
- Allen, David E., Michael McAleer, and Abhay K. Singh. 2019. Daily Market News Sentiment and Stock Prices. Applied Economics 51: 3212–35. [Google Scholar] [CrossRef] [Green Version]
- Al-Maadid, Alanoud, Guglielmo Maria Caporale, and Fabio Spagnolo. 2020. The Impact of Business and Political News on the GCC Stock Markets. Research in International Business and Finance 52: 101102. [Google Scholar] [CrossRef]
- Al-Nassar, Nassar Saleh. 2014. The Profitability of Trading Rules in Stock Markets: Evidence from GCC Countries. Melbourne: RMIT University. [Google Scholar]
- Al-Nefaie, Abdullah H., and Theyazn H. H. Aldhyani. 2022. Predicting Close Price in Emerging Saudi Stock Exchange: Time Series Models. Electronics 11: 3443. [Google Scholar] [CrossRef]
- Ashraf, Badar Nadeem. 2020. Stock Markets’ Reaction to COVID-19: Cases or Fatalities? Research in International Business and Finance 54: 101249. [Google Scholar] [CrossRef] [PubMed]
- Baker, Malcolm, and Jeffrey Wurgler. 2006. Investor Sentiment and the Cross-Section of Stock Returns. The Journal of Finance 61: 1645–80. [Google Scholar] [CrossRef] [Green Version]
- Baker, Scott R., Nicholas Bloom, and Steven J. Davis. 2016. Measuring Economic Policy Uncertainty. The Quarterly Journal of Economics 131: 1593–636. [Google Scholar] [CrossRef]
- Barber, Brad M., and Terrance Odean. 2008. All That Glitters: The Effect of Attention and News on the Buying Behavior of Individual and Institutional Investors. Review of Financial Studies 21: 785–818. [Google Scholar] [CrossRef] [Green Version]
- Barberis, Nicholas, Andrei Shleifer, and Robert Vishny. 1998. A Model of Investor Sentiment. Journal of Financial Economics 49: 307–43. [Google Scholar] [CrossRef]
- Berry, Thomas D., and Keith M. Howe. 1994. Public Information Arrival. The Journal of Finance 49: 1331–46. [Google Scholar] [CrossRef]
- Birz, Gene, and John R. Lott. 2011. The Effect of Macroeconomic News on Stock Returns: New Evidence from Newspaper Coverage. Journal of Banking & Finance 35: 2791–800. [Google Scholar] [CrossRef]
- Bollen, Johan, Huina Mao, and Xiaojun Zeng. 2011. Twitter Mood Predicts the Stock Market. Journal of Computational Science 2: 1–8. [Google Scholar] [CrossRef] [Green Version]
- Bollerslev, Tim. 1986. Generalized Autoregressive Conditional Heteroskedasticity. Journal of Econometrics 31: 307–27. [Google Scholar] [CrossRef] [Green Version]
- Bouri, Elie, and Etienne Harb. 2022. The Size of Good and Bad Volatility Shocks Does Matter for Spillovers. Journal of International Financial Markets, Institutions and Money 80: 101626. [Google Scholar] [CrossRef]
- Campbell, John Y., and Ludger Hentschel. 1992. No News Is Good News. Journal of Financial Economics 31: 281–318. [Google Scholar] [CrossRef] [Green Version]
- Cepoi, Cosmin-Octavian. 2020. Asymmetric Dependence between Stock Market Returns and News during COVID-19 Financial Turmoil. Finance Research Letters 36: 101658. [Google Scholar] [CrossRef]
- Cevik, Nuket Kirci, Emrah I. Cevik, and Sel Dibooglu. 2020. Oil Prices, Stock Market Returns and Volatility Spillovers: Evidence from Turkey. Journal of Policy Modeling 42: 597–614. [Google Scholar] [CrossRef]
- Cherif, Mondher, and Kaouthar Gazdar. 2010. Institutional and Macroeconomic Determinants of Stock Market Development in Mena Region: New Results from a Panel Data Analysis. International Journal of Banking and Finance 7: 139–59. [Google Scholar] [CrossRef]
- Christie-David, Rohan, Mukesh Chaudhry, and Walayet Khan. 2002. News Releases, Market Integration, and Market Leadership. Journal of Financial Research 25: 223–45. [Google Scholar] [CrossRef]
- Conrad, Jennifer, Bradford Cornell, and Wayne R. Landsman. 2002. When Is Bad News Really Bad News? The Journal of Finance 57: 2507–32. [Google Scholar] [CrossRef]
- Correa-Garcia, Jaime-Andres, Maria-Antonia Garcia-Benau, and Emma Garcia-Meca. 2018. Csr Communication Strategies of Colombian Business Groups: An Analysis of Corporate Reports. Sustainability 10: 1602. [Google Scholar] [CrossRef] [Green Version]
- De Oliveira Carosia, Arthur Emanuel, Guilherme Palermo Coelho, and Ana Estela Antunes Da Silva. 2021. Investment Strategies Applied to the Brazilian Stock Market: A Methodology Based on Sentiment Analysis with Deep Learning. Expert Systems with Applications 184: 115470. [Google Scholar] [CrossRef]
- Dospinescu, Nicoleta, and Octavian Dospinescu. 2019. A Profitability Regression Model in Financial Communication of Romanian Stock Exchange’s Companies. Ecoforum Journal 8: 639–79. Available online: http://www.ecoforumjournal.ro/index.php/eco/article/view/884 (accessed on 25 May 2023).
- Dougal, Casey, Joseph Engelberg, Diego Garcia, and Christopher A. Parsons. 2011. Journalists and the Stock Market. The Review of Financial Studies 25: 639–79. [Google Scholar] [CrossRef]
- Dupernex, Samuel. 2007. Why Might Share Prices Follow a Random Walk? Student Economic Review 21: 167–79. [Google Scholar]
- Engle, Robert F. 1982. Autoregressive conditional heteroscedasticity with estimates of the variance of united kingdom inflation. Econometrica 50: 987. [Google Scholar] [CrossRef]
- Engle, Robert F., and Victor K. Ng. 1993. Measuring and Testing the Impact of News on Volatility. The Journal of Finance 48: 1749–78. [Google Scholar] [CrossRef]
- Erdogan, Seyfettin, Ayfer Gedikli, and Emrah İsmail Çevik. 2020. Volatility Spillover Effects Between Islamic Stock Markets And Exchange Rates: Evidence From Three Emerging Countries. Borsa Istanbul Review 20: 322–33. [Google Scholar] [CrossRef]
- Fama, Eugene F. 1965. The behavior of stock-market prices. The Journal of Business 38: 34. [Google Scholar] [CrossRef] [Green Version]
- Fama, Eugene F. 1970. Efficient Capital Markets: A Review of Theory and Empirical Work. The Journal of Finance 25: 383–417. [Google Scholar] [CrossRef]
- Fama, Eugene F. 1981. Stock Returns, Real Activity, Inflation, and Money. The American Economic Review 71: 545–65. Available online: https://www.jstor.org/stable/1806180 (accessed on 25 May 2023).
- Frazzini, Andrea, and Owen A. Lamont. 2007. The Earnings Announcement Premium and Trading Volume. SSRN Scholarly Paper. Rochester. Available online: https://papers.ssrn.com/abstract=986940 (accessed on 25 May 2023).
- Fung, Divine. 2017. Stock Market Trend Prediction Using an Enhanced Financial News Classification Strategy. Master’s thesis, The University of Hong Kong, Hong Kong SAR, China. [Google Scholar] [CrossRef]
- Ghafoor, Muhammad Mudasar, Zahid Hussain, and Muhammad Yasir Saeed. 2020. The Impact of China-Pak Economic Corridor (CPEC) on Pakistan Stock Exchange (PSX). Journal of Business Social Review in Emerging Economies 6: 1323–33. [Google Scholar] [CrossRef]
- Glosten, Lawrence R., Ravi Jagannathan, and David E. Runkle. 1993. On the relation between the expected value and the volatility of the nominal excess return on stocks. The Journal of Finance 48: 1779–801. [Google Scholar] [CrossRef]
- Grossman, Sanford, and Joseph Stiglitz. 1980. On the Impossibility of Informationally Efficient Markets. American Economic Review 70: 393–408. Available online: https://econpapers.repec.org/article/aeaaecrev/v_3a70_3ay_3a1980_3ai_3a3_3ap_3a393-408.htm (accessed on 25 May 2023).
- Gulen, Huseyin, and Byoung-Hyoun Hwang. 2012. Daily Stock Market Swings and Investor Reaction to Firm-Specific News. SSRN Electronic Journal. [Google Scholar] [CrossRef]
- Humpe, Andreas, and Peter Macmillan. 2009. Can Macroeconomic Variables Explain Long-Term Stock Market Movements? A Comparison of the US and Japan. Applied Financial Economics 19: 111–19. [Google Scholar] [CrossRef]
- Hussain, M., B. Zaman, and N. Ahmad. 2015. Relationship between Stock Market Volatility and Macro Economic Variables: Evidence from Pakistan. Pakistan Business Review 16: 723–43. [Google Scholar]
- Hussain, Syed Mujahid, and Walid Ben Omrane. 2020. The Effect of US Macroeconomic News Announcements on the Canadian Stock Market: Evidence Using High-Frequency Data. Finance Research Letters 38: 101450. [Google Scholar] [CrossRef]
- Jegadeesh, Narasimhan, and Sheridan Titman. 1993. Returns to Buying Winners and Selling Losers: Implications for Stock Market Efficiency. The Journal of Finance 48: 65–91. [Google Scholar] [CrossRef]
- Kavussanos, Manolis G., and Ilias D. Visvikis. 2006. Shipping Freight Derivatives: A Survey of Recent Evidence. Maritime Policy & Management 33: 233–55. [Google Scholar] [CrossRef]
- Kemboi, Josphat Kipkorir, and Daniel Kipkirong Tarus. 2012. Macroeconomic Determinants of Stock Market Development in Emerging Markets: Evidence from Kenya. Research Journal of Finance and Accounting 3: 57–68. [Google Scholar]
- Libby, Robert, Robert Bloomfield, and Mark W. Nelson. 2002. Experimental Research in Financial Accounting. Accounting, Organizations and Society 27: 775–810. [Google Scholar] [CrossRef]
- Liu, Yang, and Xiaoguang Yang. 2017. Asymmetric Synchronicity in Extreme Stock Price Movements: Evidence from China’s Stock Market. Information Technology and Quantitative Management (ITQM 2017) 122: 1156–61. [Google Scholar] [CrossRef]
- Liu, Zhenhua, Hui-Kuan Tseng, Jy S. Wu, and Zhihua Ding. 2020. Implied Volatility Relationships between Crude Oil and the U.S. Stock Markets: Dynamic Correlation and Spillover Effects. Resources Policy 66: 101637. [Google Scholar] [CrossRef]
- Mitchell, Mark L., and J. Harold Mulherin. 1944. The Impact of Public Information on the Stock Market. The Journal of Finance 49: 923–50. [Google Scholar] [CrossRef]
- Nazir, Mian Sajid, Muhammad Musarat Nawaz, Waseem Anwar, and Farhan Ahmed. 2010. Determinants of Stock Price Volatility in Karachi Stock Exchange: The Mediating Role of Corporate Dividend Policy. International Research Journal of Finance and Economics 55: 100–7. [Google Scholar]
- Nizer, Philippe S. M., and Julio C. Nievola. 2012. Predicting Published News Effect in the Brazilian Stock Market. Expert Systems with Applications 39: 10674–80. [Google Scholar] [CrossRef]
- Nofsinger, John R., and Richard W. Sias. 1999. Herding and Feedback Trading by Institutional and Individual Investors. The Journal of Finance 54: 2263–95. [Google Scholar] [CrossRef]
- Önder, Zeynep, and Can Şimga-Mugan. 2006. How Do Political and Economic News Affect Emerging Markets? Evidence from Argentina and Turkey. Emerging Markets Finance and Trade 42: 50–77. [Google Scholar] [CrossRef]
- Padungsaksawasdi, Chaiyuth, and Sirimon Treepongkaruna. 2023. Investor Attention and Global Stock Market Volatility: Evidence from COVID-19. Journal of Emerging Market Finance 22: 85–104. [Google Scholar] [CrossRef]
- Panyagometh, Kamphol. 2020. The Effects of Pandemic Event on the Stock Exchange of Thailand. Economies 8: 90. [Google Scholar] [CrossRef]
- Press, Joel, and Lily Fang. 2009. Media Coverage and the Cross-Section of Stock Returns. The Journal of Finance 64: 2023–52. [Google Scholar]
- Rashid, Abdul, Aamir Javed, Zainab Jehan, and Uzma Iqbal. 2022. Time-Varying Impacts of Macroeconomic Variables on Stock Market Returns and Volatility: Evidence from Pakistan. Journal for Economic Forecasting 3: 144–66. [Google Scholar]
- Raza, Shahid, and M. Ali Kemal. 2017. Daily Stock Market Movements: From the Lens of News and Events. Islamabad: Pakistan Institute of Development Economics. [Google Scholar]
- Saeedian, M., T. Jamali, M. Z. Kamali, H. Bayani, T. Yasseri, and G. R. Jafari. 2019. Emergence of World-Stock-Market Network. Physica A 526: 120792. [Google Scholar] [CrossRef] [Green Version]
- Sajid Nazir, Mian, Hassan Younus, Ahmad Kaleem, and Zeshan Anwar. 2014. Impact of Political Events on Stock Market Returns: Empirical Evidence from Pakistan. Journal of Economic and Administrative Sciences 30: 60–78. [Google Scholar] [CrossRef] [Green Version]
- Shen, Yifan. 2018. International Risk Transmission of Stock Market Movements. Economic Modelling 69: 220–36. [Google Scholar] [CrossRef]
- Shiller, Robert J. 1980. Do Stock Prices Move Too Much to Be Justified by Subsequent Changes in Dividends? w0456. Cambridge: National Bureau of Economic Research. [Google Scholar] [CrossRef]
- Shiller, Robert J. 2003. From Efficient Markets Theory to Behavioral Finance. Journal of Economic Perspectives 17: 83–104. [Google Scholar] [CrossRef] [Green Version]
- Tang, Yong, Yong Luo, Jie Xiong, Fei Zhao, and Yi-Cheng Zhang. 2013. Impact of Monetary Policy Changes on the Chinese Monetary and Stock Markets. Physica A: Statistical Mechanics and Its Applications 392: 4435–49. [Google Scholar] [CrossRef] [Green Version]
- Tetlock, Paul C. 2007. Giving Content to Investor Sentiment: The Role of Media in the Stock Market. The Journal of Finance 62: 1139–68. [Google Scholar] [CrossRef]
- Tetlock, Paul C. 2011. All the News That’s Fit to Reprint: Do Investors React to Stale Information? Review of Financial Studies 24: 1481–512. [Google Scholar] [CrossRef]
- Tonghui, Zhang, Yuan Ying, and Wu Xi. 2020. Is Microblogging Data Reflected in Stock Market Volatility? Evidence from Sina Weibo. Finance Research Letters 32: 101173. [Google Scholar]
- Tule, Moses, Mela Dogo, and Godfrey Uzonwanne. 2018. Volatility of Stock Market Returns and the Naira Exchange Rate. Global Finance Journal 35: 97–105. [Google Scholar] [CrossRef]
- Veronesi, Pietro. 1999. Stock Market Overreaction to Bad News in Good Times: A Rational Expectations Equilibrium Model. The Review of Financial Studies; Oxford: Oxford University Press, vol. 12, pp. 975–1007. Available online: http://pietroveronesi.org/research/volat.pdf (accessed on 25 May 2023).
- Wanidwaranan, Phasin, and Chaiyuth Padungsaksawasdi. 2022. Unintentional Herd Behavior via the Google Search Volume Index in International Equity Markets. Journal of International Financial Markets, Institutions and Money 77: 101503. [Google Scholar] [CrossRef]
- Wei, Feng, and Uyen Nguyen. 2020. Stock Trend Prediction Using Financial Market News and Bert. Paper presented at the 12th International Joint Conference on Knowledge Discovery, Knowledge Engineering and Knowledge Management, Virtual Event, November 2–4; Budapest: SCITEPRESS—Science and Technology Publications, pp. 325–32. [Google Scholar] [CrossRef]
- Zakoian, Jean-Michel. 1990. Threshold heteroskedastic models. Journal of Economic Dynamics and Control 18: 931–55. [Google Scholar] [CrossRef]
- Zhao, Ruwei. 2019. Inferring Private Information from Online News and Searches: Correlation and Prediction in Chinese Stock Market. Physica A 528: 121450. [Google Scholar] [CrossRef]
- Zhou, Yuanyuan, Sonia Kumari, Muhammad Ilyas, Mujeeb-u-Rehman Bhayo, and Jahanzeb Marwat. 2023. Media Coverage and Stock Market Returns: Evidence from China Pakistan Economic Corridor (Cpec). Heliyon 9: e14204. [Google Scholar] [CrossRef]
Figure 1.
The figure above depicts a time series analysis of the stock market’s response to news/events, showcasing how the market experiences fluctuations and trends over time. The graph provides a visual representation of the volatility observed in the market as a result of external factors, such as news and events, allowing for an understanding of the market’s behavior and potential future performance. https://e.thenews.com.pk/pindi/27-02-2022/page15 (accessed on 28 February 2022).

Figure 2.
The graph illustrates the constrained evidence of volatility.

Figure 3.
The figure above shows that the expected to be leptokurtic and has fat tails, a feature of financial series.
Figure 3.
The figure above shows that the expected to be leptokurtic and has fat tails, a feature of financial series.

Figure 4.
The figure presented above, it is observed that the ARCH and GARCH variances exhibit similar series behavior.
Figure 4.
The figure presented above, it is observed that the ARCH and GARCH variances exhibit similar series behavior.

Table 1.
Conducted an ARCH(1) test to determine the presence of ARCH.
| Heteroskedasticity Test: ARCH | |||
|---|---|---|---|
| F-statistic | 53.25146 | Prob. F(12,597) | 0.0000 |
| Obs*R-squared | 52.22167 | Prob. Chi-Square(1) | 0.0000 |
Table 2.
Differences between ARCH and GARCH models.
| Differences | ARCH | GARCH |
|---|---|---|
| Development | Developed by (Engle 1982) | Developed by (Bollerslev 1986) |
| Model specification | It resembles more of an MA specification than AR ARCH(q): | It includes the lagged conditional variance terms as autoregressive terms. GARCH(p,q): |
| Parameters | Contains parameters to estimate | Uses few parameters to capture long-lagged effects and improve estimation efficiency |
| Model complexity | Over-parameterized model | Parsimonious model |
| Captures | Capture the volatility of variance, but do not capture the leverage and asymmetric effect of good and bad news. | Several extensions capture the leverage and asymmetric effect of good and bad news. |
| Conditional variance | Conditional variance = terms | Conditional variance = terms |
| Concerned with | Capture volatility clustering and a mean-reverting process. | Concerned with the behavior of the conditional variance of the asset to estimate its riskiness, it captures volatility clustering and a mean-reverting process. |
Table 3.
Three distinct criteria are used to determine the optimal model from the three available options.
Table 3.
Three distinct criteria are used to determine the optimal model from the three available options.
| Normal Distribution | Student t’s | GED | |
|---|---|---|---|
| Significant coefficients | All of them | All of them | All of them |
| ARCH Significant | Yes | Yes | Yes |
| GARCH Significant | Yes | Yes | Yes |
| Log-likelihood | 8482.548 | 8541.428 | 8537.481 |
| Adj. R2 | 0.014976 | 0.016725 | 0.017751 |
| Schwartz IC | −6.509915 | −6.552183 | −6.549147 |
| Heteroscedasticity | No | No | No |
| Autocorrelation | No | No | No |
Table 6.
The table above presents the results of a statistical analysis of the variance equation in the context of a GARCH model.
Table 6.
The table above presents the results of a statistical analysis of the variance equation in the context of a GARCH model.
| Variable | Coefficient | Std. Error | z-Statistic | Prob. |
|---|---|---|---|---|
| Variance Equation | ||||
| C | 4.52 × 10⁻⁶ | 6.03 × 10⁻⁷ | 7.502302 | 0.0000 |
| RESID(-1)^2 | 0.006821 | 0.010152 | 0.671861 | 0.5017 |
| RESID(-1)^2*(RESID(-1)<0) | 0.232962 | 0.022761 | 10.23507 | 0.0000 |
| GARCH(-1) | 0.835315 | 0.013676 | 61.07859 | 0.0000 |
Table 7.
Statistical analysis of eight variables: an examination of mean values.
| Variables | Mean | Std. Deviation | Minimum | Maximum |
|---|---|---|---|---|
| Economic | 24.62 | 280.69 | −992.00 | 1195.00 |
| Financial | −4.41 | 304.40 | −1811.00 | 1096.00 |
| Foreign relations | 25.56 | 195.94 | −644.00 | 387.00 |
| Global | −29.07 | 314.00 | −1855.00 | 1140.00 |
| Institutional | 115.02 | 277.58 | −1002.00 | 1566.00 |
| Blue chips | 79.66 | 239.63 | −702.00 | 533.00 |
| Political | −27.48 | 372.01 | −2153.00 | 1406.00 |
| Profit taking | −33.12 | 277.15 | −844.00 | 1556.00 |
| Total | 13.44 | 307.17 | −2153.00 | 1566.00 |
Table 8.
Exhaustive tabulation of eight key news/events and their corresponding positive and negative effects on the stock market.
Table 8.
Exhaustive tabulation of eight key news/events and their corresponding positive and negative effects on the stock market.
| No. | News Categories | Impact | Average Change | Highest | Lowest |
|---|---|---|---|---|---|
| 1 | Economic | Positive | 24.62 | 1195 | −992 |
| 2 | Financial | Negative | −4.41 | 1096 | −1811 |
| 3 | Foreign relations | Positive | 25.56 | 387 | −644 |
| 4 | Global | Negative | −29.07 | 1140 | −1855 |
| 5 | Institutional | Positive | 115.02 | 1566 | −1002 |
| 6 | Blue chips | Positive | 79.66 | 533 | −702 |
| 7 | Political | Negative | −27.48 | 1406 | −2153 |
| 8 | Profit taking | Negative | −33.12 | 1556 | −844 |
Table 9.
Construction of an ordinary least squares (OLS) regression model for parameters using first and fifth lagged data.
Table 9.
Construction of an ordinary least squares (OLS) regression model for parameters using first and fifth lagged data.
| Variable | Coefficient | Std. Error | t-Statistic | Prob. |
|---|---|---|---|---|
| C | −70.28 | 39.00 | −1.80 | 0.072 |
| KSE(-1) | 0.17 | 0.02 | 7.83 | 0.000 |
| KSE(-5) | 0.04 | 0.02 | 2.08 | 0.038 |
| POLITICAL | 40.76 | 42.15 | 0.97 | 0.334 |
| ECONOMIC | 92.69 | 42.01 | 2.21 | 0.028 |
| FINANCIAL | 64.86 | 41.92 | 1.55 | 0.122 |
| INSTITUTIONS | 181.04 | 42.18 | 4.29 | 0.000 |
| GLOBAL | 51.39 | 43.89 | 1.17 | 0.242 |
| PROFIT TAKING | 24.46 | 43.27 | 0.57 | 0.572 |
| BLUE CHIPS | 138.53 | 64.55 | 2.15 | 0.032 |
| FOREIGN RELATIONS | 97.96 | 56.41 | 1.74 | 0.083 |
| R-squared | 0.06 | Mean dependent var | 11.05 | |
| Adjusted R-squared | 0.06 | SD dependent var | 308.19 | |
| SE of regression | 299.55 | Akaike info criterion | 14.25 | |
| Sum squared resid | 185,000,000 | Schwarz criterion | 14.28 | |
| Log likelihood | −14763.89 | Hannan–Quinn criter. | 14.26 | |
| F-statistic | 13.13 | Durbin–Watson stat | 1.99 | |
| Prob(F-statistic) | 0.000 | |||
Table 10.
Regression model with separated positive and negative values using first and fifth lag.
| Variable | Coefficient | Std. Error | t-Statistic | Prob. |
|---|---|---|---|---|
| C | −71.78 | 30.16 | −2.38 | 0.017 |
| KSE(-1) | 0.07 | 0.02 | 4.30 | 0.000 |
| POLITICAL (−) | −187.87 | 34.71 | −5.41 | 0.000 |
| POLITICAL (+) | 292.49 | 35.07 | 8.34 | 0.000 |
| ECONOMIC (−) | −114.40 | 35.12 | −3.26 | 0.001 |
| ECONOMIC (+) | 268.52 | 34.29 | 7.83 | 0.000 |
| FINANCIAL (−) | −138.36 | 34.64 | −3.99 | 0.000 |
| FINANCIAL (+) | 262.57 | 34.44 | 7.62 | 0.000 |
| INSTITUTIONS (−) | −144.86 | 41.23 | −3.51 | 0.001 |
| INSTITUTIONS (+) | 265.56 | 33.19 | 8.00 | 0.000 |
| GLOBAL (−) | −167.28 | 37.85 | −4.42 | 0.000 |
| GLOBAL (+) | 231.84 | 36.89 | 6.29 | 0.000 |
| PROFIT TAKING (−) | −94.05 | 35.08 | −2.68 | 0.007 |
| PROFIT TAKING (+) | 269.84 | 38.76 | 6.96 | 0.000 |
| BLUE CHIPS (−) | −150.67 | 87.30 | −1.73 | 0.085 |
| BLUE CHIPS (+) | 236.66 | 53.83 | 4.40 | 0.000 |
| FOREIGN RELATIONS (−) | −68.76 | 56.96 | −1.21 | 0.228 |
| FOREIGN RELATIONS (+) | 222.13 | 51.40 | 4.32 | 0.000 |
| R-squared | 0.44 | Mean dependent var | 11.19 | |
| Adjusted R-squared | 0.43 | SD dependent var | 307.93 | |
| SE of regression | 231.66 | Akaike infocriterion | 13.74 | |
| Sum squared resid | 111,000,000 | Schwarz’s criterion | 13.79 | |
| Logarithmic likelihood | −14254.82 | Hannan–Quinn criter. | 13.75 | |
| F-statistic | 94.68 | Durbin–Watson stat | 2.01 | |
| Prob(F-statistic) | 0.000 | |||
Table 11.
A regression analysis employs ARCH/GARCH models.
| Variable | Coefficient | Std. Error | z-Statistic | Prob. |
|---|---|---|---|---|
| LOG(GARCH) | 10.09 | 5.27 | 1.91 | 0.056 |
| C | −127.76 | 55.69 | −2.29 | 0.022 |
| POLITICAL (−) | −90.34 | 21.13 | −4.28 | 0.000 |
| POLITICAL (+) | 169.25 | 22.33 | 7.58 | 0.000 |
| ECONOMIC (−) | −85.92 | 21.63 | −3.97 | 0.000 |
| ECONOMIC (+) | 144.81 | 22.40 | 6.46 | 0.000 |
| FINANCIAL (−) | −86.36 | 21.19 | −4.08 | 0.000 |
| FINANCIAL (+) | 173.59 | 21.58 | 8.04 | 0.000 |
| INSTITUTIONS (−) | −84.33 | 25.96 | −3.25 | 0.001 |
| INSTITUTIONS (+) | 160.06 | 21.06 | 7.60 | 0.000 |
| GLOBAL (−) | −103.25 | 22.18 | −4.65 | 0.000 |
| GLOBAL (+) | 135.34 | 25.07 | 5.40 | 0.000 |
| PROFIT TAKING (−) | −69.47 | 21.88 | −3.18 | 0.002 |
| PROFIT TAKING (+) | 136.99 | 27.83 | 4.92 | 0.000 |
| BLUE CHIPS (−) | −54.11 | 53.49 | −1.01 | 0.312 |
| BLUE CHIPS (+) | 129.95 | 44.33 | 2.93 | 0.003 |
| FOREIGN RELATIONS (−) | −140.42 | 46.35 | −3.03 | 0.002 |
| FOREIGN RELATIONS (+) | 151.61 | 31.85 | 4.76 | 0.000 |
| AR(1) | 0.12 | 0.03 | 4.55 | 0.000 |
| Variance Equation | ||||
| C | 14478.83 | 1552.39 | 9.33 | 0.000 |
| RESID(-1)^2 | 0.20 | 0.01 | 14.14 | 0.000 |
| RESID(-2)^2 | 0.29 | 0.01 | 20.38 | 0.000 |
| RESID(-3)^2 | 0.35 | 0.02 | 20.59 | 0.000 |
| RESID(-4)^2 | 0.29 | 0.01 | 19.60 | 0.000 |
| RESID(-5)^2 | 0.18 | 0.01 | 19.83 | 0.000 |
| GARCH(-1) | −0.77 | 0.00 | −187.52 | 0.000 |
| GARCH(-2) | −0.48 | 0.00 | −313.27 | 0.000 |
| GARCH(-3) | −0.25 | 0.02 | −15.85 | 0.000 |
| GARCH(-4) | 0.32 | 0.00 | 104.84 | 0.000 |
| GARCH(-5) | 0.70 | 0.01 | 61.34 | 0.000 |
| R-squared | 0.36 | Mean-dependent var | 11.19 | |
| Adjusted R-squared | 0.36 | SD dependent var | 307.93 | |
| SE of regression | 247.10 | Akaike infocriterion | 13.29 | |
| Sum squared resid | 126,000,000 | Schwarz criterion | 13.38 | |
| Log likelihood | −13782.04 | Hannan–Quinn criter. | 13.32 | |
| Durbin–Watson stat | 2.01 | |||
Disclaimer/Publisher’s Note: The statements, opinions and data contained in all publications are solely those of the individual author(s) and contributor(s) and not of MDPI and/or the editor(s). MDPI and/or the editor(s) disclaim responsibility for any injury to people or property resulting from any ideas, methods, instructions or products referred to in the content. |
© 2023 by the authors. Licensee MDPI, Basel, Switzerland. This article is an open access article distributed under the terms and conditions of the Creative Commons Attribution (CC BY) license (https://creativecommons.org/licenses/by/4.0/).
Share and Cite
MDPI and ACS Style
Raza, S.; Baiqing, S.; Kay-Khine, P.; Ali Kemal, M. Uncovering the Effect of News Signals on Daily Stock Market Performance: An Econometric Analysis. Int. J. Financial Stud. 2023, 11, 99. https://doi.org/10.3390/ijfs11030099
AMA Style
Raza S, Baiqing S, Kay-Khine P, Ali Kemal M. Uncovering the Effect of News Signals on Daily Stock Market Performance: An Econometric Analysis. International Journal of Financial Studies. 2023; 11(3):99. https://doi.org/10.3390/ijfs11030099
Chicago/Turabian StyleRaza, Shahid, Sun Baiqing, Pwint Kay-Khine, and Muhammad Ali Kemal. 2023. "Uncovering the Effect of News Signals on Daily Stock Market Performance: An Econometric Analysis" International Journal of Financial Studies 11, no. 3: 99. https://doi.org/10.3390/ijfs11030099
Note that from the first issue of 2016, this journal uses article numbers instead of page numbers. See further details here.