Topological Network Analysis Based on Dissimilarity Measure of Multivariate Time Series Evolution in the Subprime Crisis

Department of Management, School of Economics, Management & Social Sciences, Shiraz University, Shiraz 71946-85111, Iran
*
Author to whom correspondence should be addressed.
Int. J. Financial Stud. 2018, 6(2), 47; https://doi.org/10.3390/ijfs6020047
Submission received: 18 October 2017
/
Revised: 12 April 2018
/
Accepted: 14 April 2018
/
Published: 5 May 2018
(This article belongs to the Special Issue Advances in Behavioral Finance)
Abstract
:Correlation network based on similarity is the common approach in financial network analyses where the Minimal Spanning Tree (MST) is used to filter the important information contained in the network. In this paper, by considering a distance matrix based on dissimilarities among multivariate time series of currency, a topological network was analyzed. A topological network can explain to what extent two or more multi-dimensional currency structures are different from each other. For this purpose, we examined the topological network of currency market from 2005 to 2011 in terms of the subprime crisis. After that, the multivariate time series evolution of MSTs were analyzed in terms of the structural changes for three periods (before, during, and after the crisis). Moreover, since the clusters of currencies in network analysis are due to regional factors, by considering each region, which is composed of a number of currencies, as an element on the financial system, we attempted to determine how a region interacts with the other regions in crisis periods. This motivated us to introduce a region-based network analysis of currencies. Since each region consisted of a different number of currencies compared to the others, the appropriate network analysis was in multivariate setting. Finally, the applications of the method were presented with the situation of a currencies crisis behavior. The results indicate significant changes in the topological structures of MSTs when their properties are compared to each other.
1. Introduction
The foreign exchange (FOREX) market is deemed as the main and most liquid market in the world, and affects all other markets directly or indirectly since any asset price is represented as based on a currency. The exchange rate is the most important adjustment lever in international trade and development. The fluctuations in exchange rates influence the activities of export trade, cross-border investment and financial transactions in a country and region. It is expected to reflect the whole economic status of the country, and FOREX rate is considered to be a measure of economic balance of any two countries; this has spurred various studies to investigate the properties of the FOREX market and its topological structure by the method of correlation network. This method has been devoted by econophysicists for studying economic problems using theories of physics.
The FOREX market is considered to be a complex system with a mass of interrelationships among currencies. In the FOREX market, the presence of interactions is deemed as particular significant feature for financial market dynamics. The investigation about the behavior of the relationships among currencies and regional currencies which are favorable for optimizing of the portfolio as well as risk management of assets, is considered to be an important topic in this regard. From a statistical physics perspective, correlation analysis between financial objects has developed in various approaches, such as the multi-fractal analysis theory, random matrix theory, and correlation network-based approaches (e.g., the planar maximally filtered graph, the minimum spanning tree (MST), and the correlation threshold approaches). Particularly, as Mantegna (1999) initially proposed the network analysis tool of MST in the US stock market, the correlation network was applied for quantifying the interconnections in many financial markets, such as the commodity markets, foreign exchange (FOREX, FX) market, stock market, and equity markets.
In financial markets, topological network analysis is a technical method that provides efficient tools to interpret market properties and structures (Mantegna 1999; Mantegna and Stanley 2000; Tumminello et al. 2005; Djauhari and Gan 2014). Network topology refers to the physical layout of a network. This approach has been investigated seriously by econophysicists to understand the structure of interrelated variables via network. It defines the way that different nodes are placed and are interconnected with each other. Alternately, technical topology networks describe how the data is transferred between these nodes. This is achieved by employing the well-known correlation network analysis approach. On the other hand, correlation network is usually analyzed by using MST and subdominant ultrametric (SDU) to filter the information contained in the correlation networks. The MST provides the topological properties of the financial assets, and the SDU, in the form of an indexed hierarchical tree (HT), would be able to provide the taxonomic information.
However, this method for the analysis of FOREX market has a relatively short history in econophysics. Ortega and Matesanz (2006) studied the currency network analysis of 28 major currencies in FOREX from 1990 to 2002 by using the MST method. They divided the currency network into several sectors comprising countries from the same regional currencies. The same result was obtained by Mizuno et al. (2006), who investigated the FOREX market of 26 currencies and three metals for the period of 1999–2003 by classifying the currency network according to the similarity measure based on a correlation coefficient. They found the key currencies and indicated that USD has a leading role among other currencies in FOREX markets. Subsequently, Naylor et al. (2007) studied network topology in terms of two base currencies, USD and NZD-based networks of 44 currencies from 1995 to 2001 by MST. They specified that South-east Asian countries are strongly linked as a cluster in the network structure during the period of Southeast Asian crisis. Afterwards, Kwapién et al. (2009) researched the correlation network among 46 currencies and three metals for the full years of 1998–2008 and stated that different base currencies may generate totally different structures in the FOREX market. They analyzed the topological evolution of currency networks and showed that the USD currency loses its centrality position, while the EUR has become more dominant than all pervious networks. Kwapién et al. (2009) again analyzed the structure of 63 currencies and three metals in FOREX market for the period of 1999–2008 viewed as a network of interacting currencies. Keskin et al. (2011) analyzed the topological properties of correlation networks on a set of 34 currencies. They derived a hierarchical organization and constructed MSTs and hierarchical trees (HTs) for the full years of 2007 and 2008, during which TRY (Turkish lira) and USD were used as base currencies to construct the networks. They concluded that the corresponding countries from the homogeneous geographical regions such as Asian or European currencies are nicely matched in the clusters. Sharif et al. (2012) examined the interactions of 55 world major currencies based on network topology approach of correlation analysis.
Besides, many authors have also studied on the network evolution of currency in terms of crisis periods. For example, Jang et al. (2011) examined network topology of the FOREX markets based on the MST for the 61 currencies for the 1990−2008 periods in terms of the currency crises. They showed that after the South-east Asian crisis, USD and EUR had a strong negative correlation, and Asian and Latin American currencies moved away from the USD cluster undergoing the Argentine crisis and Southeast Asian crisis, respectively. Wang et al. (2012) studied on the topological properties of similarities networks between 35 currencies in FOREX markets by employing a dynamic time warping method. They analyzed the topology evolution of FOREX markets by using MST in terms of the subprime crisis and presented the HT to investigate the clusters for sub-periods.
In the literature, there are many studies that have been carried out to analyze the complex system of FOREX market. It has become essential to understand the behavior of currency and the role played by them in these systems. However, previous researches into the foreign exchange market has shed little light on the time series properties of currency networks for currency crises. It is important to examine the time series properties of currency networks because network shapes vary as time goes on. Whether the time series have typical properties in response to currency crises is also a serious question.
In all previous models of network analysis in FOREX market, the behavior of closing price has been studied, in which each return is represented as univariate time series. However, in financial market activities, currencies and stocks are actually represented as Multivariate Time Series (MTS) of Opening price, Highest price, Lowest price and Closing price (OHLC) (Kazemilari and Djauhari 2015; Gan and Djauhari 2015). There have been no studies done on the network analysis of currencies in relation to the crisis in multivariate setting. This is a gap that we want to overcome in this research. Therefore, we considered the multi-dimensional currencies of OHLC prices to study the relationships existing between currencies in FOREX market.
Most of studies have showed that the currencies are tending to cluster together based on the regional factor (Mizuno et al. 2006; Jang et al. 2011; Kazemilari and Djauhari 2013). For that reason, we are interested to analyze the currencies network based on the regions in which the countries belong. Since, the numbers of countries for each region are different, we have to use a method in a multivariate case. The present research focuses on topological network analysis in a multivariate setting for currencies networks and regional-based networks.
Since a network is constructed in order to extract the information contained in dissimilarity structure, the notion of dissimilarity was introduced followed by the similarity measure based on a multivariate vector correlation. First, the dissimilarity measure of multivariate time series of OHLC prices was considered. After that, this method was used to construct the regional-based network among nine regions, and then we compared the evolution of the regional structure in three periods.
This paper considers a network analysis of the time series properties in relation to the history of currency crises to determine how the subprime crisis in the United States affected the interconnections between currency movements. In the process, the time series evolution was analyzed in relation to the structure changes of MSTs before, during and after the crisis period. For that purpose, we presented the topology of dissimilarity networks among 83 chief currencies using the MST technique in three periods related to the U.S. subprime crisis. Then, by deriving some useful observations, we analyzed the topology evolution of FOREX markets in terms of the changes of the MSTs.
The remainder of this paper is organized as follows. In Section 2, we briefly describe the subprime crisis as a global financial crisis. Section 3 extracts the method of constructing currencies network and regional network in terms of dissimilarity structure for multi-dimensional data. In Section 4, we present the data set. Section 5 describes the currencies and regional based MST and following that the empirical results is discussed. Finally, Section 6 present the concluding remarks.
2. Subprime Crisis
After the serious Depression of the 1930s, numerous economists have considered the financial crisis of 2007–2008, namely the Financial Crisis, as the worst financial crisis. The financial crisis led to consumer wealth decreases in trillions of US dollars and a downfall in economic activities, which caused the 2008–2012 global recession on one hand, and which stabilized the crisis of the European Sovereign debt on the other hand. Consequently, this Financial Crisis was considered of utmost importance (Shirai 2009; Wall Street Journal).
The crisis lasted although world political authorities, national financial ministers, and central bank directors all brought their efforts together to diminish fears. The currency crisis progressed up to late October 2008, while investors expanded their capital resources into the yen, the Dollar, and the Swiss Franc, which are known as the stronger resources. At that time, investors tried to find help from the International Monetary Fund (Shirai 2009).
At the beginning of 2007, the world economy suffered a global financial and economic crisis that changed the global monetary system significantly. The U.S. financial crisis, which affected Europe first, spread around the world and hit the global economy. This global financial situation spurred more attention on the topological evolution among currencies and regions in FOREX market (Jang et al. 2011).
3. Methodology
In this section, we introduce the method of similarity measure based on Escoufier’s vector correlation for currencies and regions in two subsections, respectively. The procedure of constructing network by using MST was then followed by considering a way to transform a similarity into a dissimilarity measure. Section 3.3 explains more about network analysis tools to interpret the information contained in the networks based on three centrality measures.
3.1. Similarity Measure
In the case of univariate time series, the similarity among the one dimension of the closing price of currencies is quantified by using Pearson Correlation Coefficient (PCC) (Mantegna 1999; Mantegna and Stanley 2000; Wu and Zheng 2013). However, in the case of multi-dimensional data, the notion of similarity is generalized from univariate into multivariate time series.
3.1.1. Similarity Measure in the Multivariate Setting of O, H, L and C Prices
Suppose currencies that each currency is characterized by a set of OHLC prices in a portfolio are investigated. In order to measure the similarities and dissimilarities in the synchronous time evolution of a pair of currencies, we studied the correlation between the logarithmic changes of two multi-dimensional currencies and . In this case, each currency is represented based on four dimensions ( where refers to opening price, the highest price, the lowest price, and the closing price.
Let , and be the rate of currency at time for the opening, highest, lowest, and closing prices, , and is the number of currencies. Logarithmic change refers to the successive differences of the logarithm of OHLC prices as defined by:
where , and indicate the log change of currency at time for the opening, highest, lowest, and closing prices, respectively. Let and be two currencies with four dimensions. Then, the similarity between and can be quantified by using (Escoufier 1973; Robert and Escoufier 1976):
where (.) is the trace operator, and and are the sample covariance matrices of and , respectively. Also, (the transpose of ) where is the sample covariance matrix between and . The similarity among currencies are numerically summarized in a Vector Correlation () matrix. The correlation matrix is a symmetric matrix like the classical correlation matrix, with all diagonal elements equal to 1. The off-diagonal elements of vary between 0 to +1, where 0 indicates that each OHLC price of currency is uncorrelated to each OHLC prices of , that is, . is equal to +1 when the configurations of OHLC prices of two currencies are same. See also Escoufier (2006), Kazemilari and Djauhari (2015) and Smilde et al. (2009) for more properties of .
3.1.2. Similarity Measure among Regions
Suppose that the currencies under study are classified into regions and each region contains currencies, where is the total number of currencies under investigation. Let and be two regions consisting of and currencies, respectively. The number of currencies in each region can be different. Since, each region is composed by a number of currencies, the appropriate network analysis is in multivariate setting. Hence the relevance similarity measure between and is also quantified by using Escoufier’s vector correlation coefficient (Escoufier 1973; Robert and Escoufier 1976):
where and are the sample covariance matrices of and , respectively, and is the sample covariance matrix between and . Based on , the similarity among regions make a matrix. This matrix is a numerical representation of R(R − 1)/2 pairs of regions.
3.2. Dissimilarity Measure
Various authors presented more rigorous discussions on the concepts of similarity and dissimilarity; the complementary to similarity. A higher value of a similarity coefficient indicates there is a greater association between variables, whereas a low value indicates that the two variables are quite dissimilar. For a dissimilarity coefficient, the interpretation is the other way around. A high value indicates great dissimilarity, whereas a low value indicates great resemblance.
Let us denote as the symbol for a dissimilarity coefficient. A function of is called dissimilarity if it satisfies the three axioms. It is usual to require that a function is referred to as a dissimilarity if it satisfies:
- (non-negativity)
- (symmetry) and
- = 0 (minimality)
The standard practice in currencies network analysis is through considering the correlations among currencies as their similarity and a way to transform a similarity coefficient s in to a dissimilarity coefficient . The dissimilarity coefficient can be defined as the ultrametric distance, which is closely related to the Euclidean distance of the normalized time series (Mantegna and Stanley 2000). Although there are many distance measures, i.e., the Entropy, the Ultrametric the Manhattan, and Theil index base distances (see e.g., Deza and Deza 2006), in a practical application only few of them are in use: The Manhattan and Ultrametric (UD) distances because they can be used as a base in constructing other distances, i.e., the Theil index and Entropy distances. However, since the UD origin lies in portfolio optimization methods this distance is particularly useful in the process of portfolio construction. The analysis of UD and investigations of the appropriate MST network may simplify and speed up the process of portfolio construction, particularly the choice of shares which should be included in the portfolio.
In this research, the classical analysis of FOREX market structure consists of the UD distance matrix and construction of the MST is presented. Since Mantegna (1999), it has been shown that the way can lead to changes on the market, e.g., during crashes, and point out to the clustering of companies (Onnela et al. 2003). The Ultrametric Distance defined as the Euclidean distance of the normalized time series. The present definition is a generalization of the original definition (Mantegna and Stanley 2000). The function d becomes a metric distance, if it satisfies the triangular inequality;
- symmetry ,
- if and only if and foremost, the triangle inequality, which is given by:
- .
The value of d is in the interval [0,]; , since the correlation coefficients take value in the interval [0, 1]. This transformation requires that in order to obtain . A small value of d ≈ 0 means positively strong correlation between variables and high value () means the correlation is negatively strong.
Mantegna (1999) first proposed the introduction of a distance between a synchronized pair of assets, with a distance numerically verifying properties (1)–(3). The knowledge of the distance matrix among elements is customarily used for decomposing a set of n elements into subsets of closely related elements.
When the usual triangular inequality (3) is replaced by a stronger inequality is called an ultrametric distance. The has a stronger condition. Thus, the is a Sub-Dominant Ultrametric (SDU) distance. The ultrametric distance is encountered when moving from node to node over the shortest path in MST. Among all the possible ultrametric structures related to the distance matrix , a single one emerges owing to its simplicity and remarkable properties is the sub-dominant ultrametric (SDU). The SDU is then used to construct the hierarchical tree (HT). A good explanation and a simple example of HT construction from MST is given in Mantegna (1999). SDU is obtained by determining the MST connecting the elements. This is because MST is able to reveal the strongest connections of each currency, but unable to exhibit the cluster information in the network. However, HT is contrary with MST.
Dissimilarity Measure in Multivariate Setting of O, H, L and C Prices and Regions
In this section, the sense of vector correlation and its practical usage in two different ways will be discussed: (1) It elaborates a metric in order to provide the relative distance among all currencies; (2) It supplies us with a process of economic and financial information extraction, regarding currency price time series.
In the following, there is a process in which a distance between currencies and is calculated in a synchronous fashion. If we consider:
where is the sample covariance matrices of , the Euclidean distance and the Pythagorean relation provides us with the records of , present in the same time interval as the components of an -dimensional vector . The Euclidean distance between vectors and is obtained from the Pythagorean formula:
The vector has unit length from Equation (2). Hence:
Hence, Equation (3) can be followed as:
Since coincides with . Hence:
which defines the Euclidean distance in terms of three properties on Section 3.2. Verification of properties (1) and (2) is easily applicable because implies , and implies . The triangular inequality relies on the equivalence of Equations (3) and (6). Correspondingly, the quantity fulfills three properties required by metric distance. Mantegna (1999) first demonstrated a distance numerically verifying properties between a synchronous. The usage of distance matrix between subjects is applicable with regard to disintegration of the objects into subsets.
The distance matrix corresponding to is used to determine the topological network by using MST as a technical tool. According to Mantegna (1999), the applied justification for using the MST relates to its aptitude in providing the meaningful economical information (Mantegna and Stanley 1999; Mantegna and Stanley 2000). MST reduces the information of from in to . It provides a topology network of p currencies and most meaningful connections with shortest distances in which each currency represented as a node with strongest links between currencies. Kruskal’s algorithm is the powerful and widely used algorithm in constructing the MST (Kruskal 1956; Zhang et al. 2011). In the processes of Kruskal’s algorithm, the edge with least distance will be chooses at each stage. In the final of the processes, it will construct a spanning tree which spans all nodes, and the sum of weights of all the edges in that tree is minimal. An MST of , where is a distance between -th and -th elements, was constructed in order to extract the information in dissimilarity structure.
To determine the key regions, we used MST and the concept of single linkage clustering. From the distance matrix , the two key regions are the closest pair in which the distance between and is minimum. is the distance between the regions and that defined in Equation (6). The distance matrix of size is used to determine the MST and HT of regions. From the MST, the ultrametric distance can be determined. With constructing the MST of the regions and linking the closest pair of regions, we will get a regional network.
3.3. Interpretation Tools
Once the dissimilarity measure among currencies is well defined and network has been constructed by MST, the rest is about economic interpretation. A fundamental concept and one of the most studied theories in the field of network analysis, is centrality measure. Network centrality is a concept that refers to the location or position of nodes in the networks (Freeman 1979). It is used to classify a network into important and unimportant nodes (Geisberger et al. 2008). In this paper, three specific node-level centrality measures which are instrumental to network analysis, namely, degree-centrality, betweenness-centrality, and closeness-centrality are employed.
The degree of centrality for node refers to the number of edges attached to it. It is calculated as follows: where is the number of nodes.
Betweenness-centrality shows the frequencies of nodes in the shortest paths between indirectly linked nodes. We employ Betweenness-centrality as suggested in Jang et al (2011). For node , the betweenness-centrality is computed by:
where denotes the number of shortest paths between node and node , and represents the number of shortest paths containing point as an intermediately in the geodesics between node and node (Freeman 1977).
Closeness-centrality measure is based on the idea that node is central if it can quickly reach others. It is the inverse distance of each node to the other nodes in the network:
where signifies the minimum distance between node and node . It assesses the effectiveness of one node in a graph. The nodes with higher values are closer to the others (on average).
4. Data Set
An exchange rate for currency X is determined in terms of a base currency B. Generally, per-currency can be considered as a base currency. As different currencies might have different interior dynamics associated to inflation, domestic economy, and sympathy to events in other countries of the world, performance of the exchange rates is highly related to a specific choice of the base. So, the correlation structure of the FOREX network mainly depends on the base currency (Kwapién et al. 2009).
The exchange rate of currencies determines how much a currency is worth based on the other and it is generally and mostly stated in terms of the US dollar. The Euro and US dollar are the most dominant currencies because of the strength of the investors’ confidence and their related economies (Kwapién et al. 2009). Their important effect on other currencies is obvious as indicated by key positions in the network of the FOREX market which indicate that the exchange rates include at least one of the mentioned currencies. In this research, the exchange rate of each currency was based on USD, which is a potential claim on the freely usable currencies of International Monetary Fund (IMF) members. The worth of the USD is the worth of main currencies applied in finance and international trade. As the comparative value of per currency changes, the USD value constantly varies. The value of the USD in terms of all currencies is accessible from the IMF, which is usually updated every day. The daily exchange rate of per country’s currency for USDs was applied as a fundamental data in several investigations like (Mizuno et al. 2006; Naylor et al. 2007; Górski et al. 2008; Kwapién et al. 2009; Keskin et al. 2011).
4.1. Data Set of Multi-Dimensional Currencies
As a case study in FOREX market, 83 currency exchange rates have been analyzed where currencies are represented by opening, highest, lowest, and closing prices as well over that period, not only by its closing price. When their closing price describes one dimension of currencies, the multi-dimensional currencies are used to find the hidden fact in currencies exchange market.
Data of 83 major world currencies from June 2005 to May 2011 were downloaded from http://www.investing.com/ for weekly OHCL price due to synchronization of time series. In this study the weekly exchange rate of each currency is based on US dollar.
In present research, by considering the U.S. currencies crisis in 2007–2009 (Shirai 2009; Wall Street Journal) as issues of Jang et al. (2011) and Wang et al. (2012) three periods were evaluated. In consequence, before, during and after of crisis period has been considered into the following respectively: period 1 (before crisis/June 2005–May 2007), period 2 (during the crisis/June 2007–May 2009), and period 3 (after crisis/June 2009–May 2011). In order to analyze the evolution of currencies for each sub period, evidence will be provided in Section 5.
4.2. Data Set of Regional Currencies
These upcoming results were gathered according to historical data of exchange rate that were downloaded from Oanada (http://www.oanada.com). The daily exchange rate of 83 currencies of top highest—GDP countries are analyzed. The high-frequency data provides more valuable information about the foreign exchange market (Wu and Zheng 2013). The appendix shows the 83 countries of nine regions, and their respective symbols. Table 1 demonstrates the number of currencies in each region.
5. Data Analysis
In order to simplify and summarize the information in network structure, we constructed MST from a distance matrix (D) by using Kruskal’s algorithm provided in Matlab version R2015b and Pajek software. Pajek software which is open source (See http://mrvar.fdv.uni-lj.si/pajek/) (De Nooy et al. 2011) and is the most recommended software in network analysis (Ohta 2006; Batagelj and Mrvar 2003, 2004) to visualize the topological network in the form of graphical representation.
In this part, the network properties of the currency and regions in relation to the subprime crisis and the network evolution of FOREX market are analyzed. After that, the structural changes in three sub-periods are compared and the key currencies and regions are determined.
5.1. Currency Network Analysis
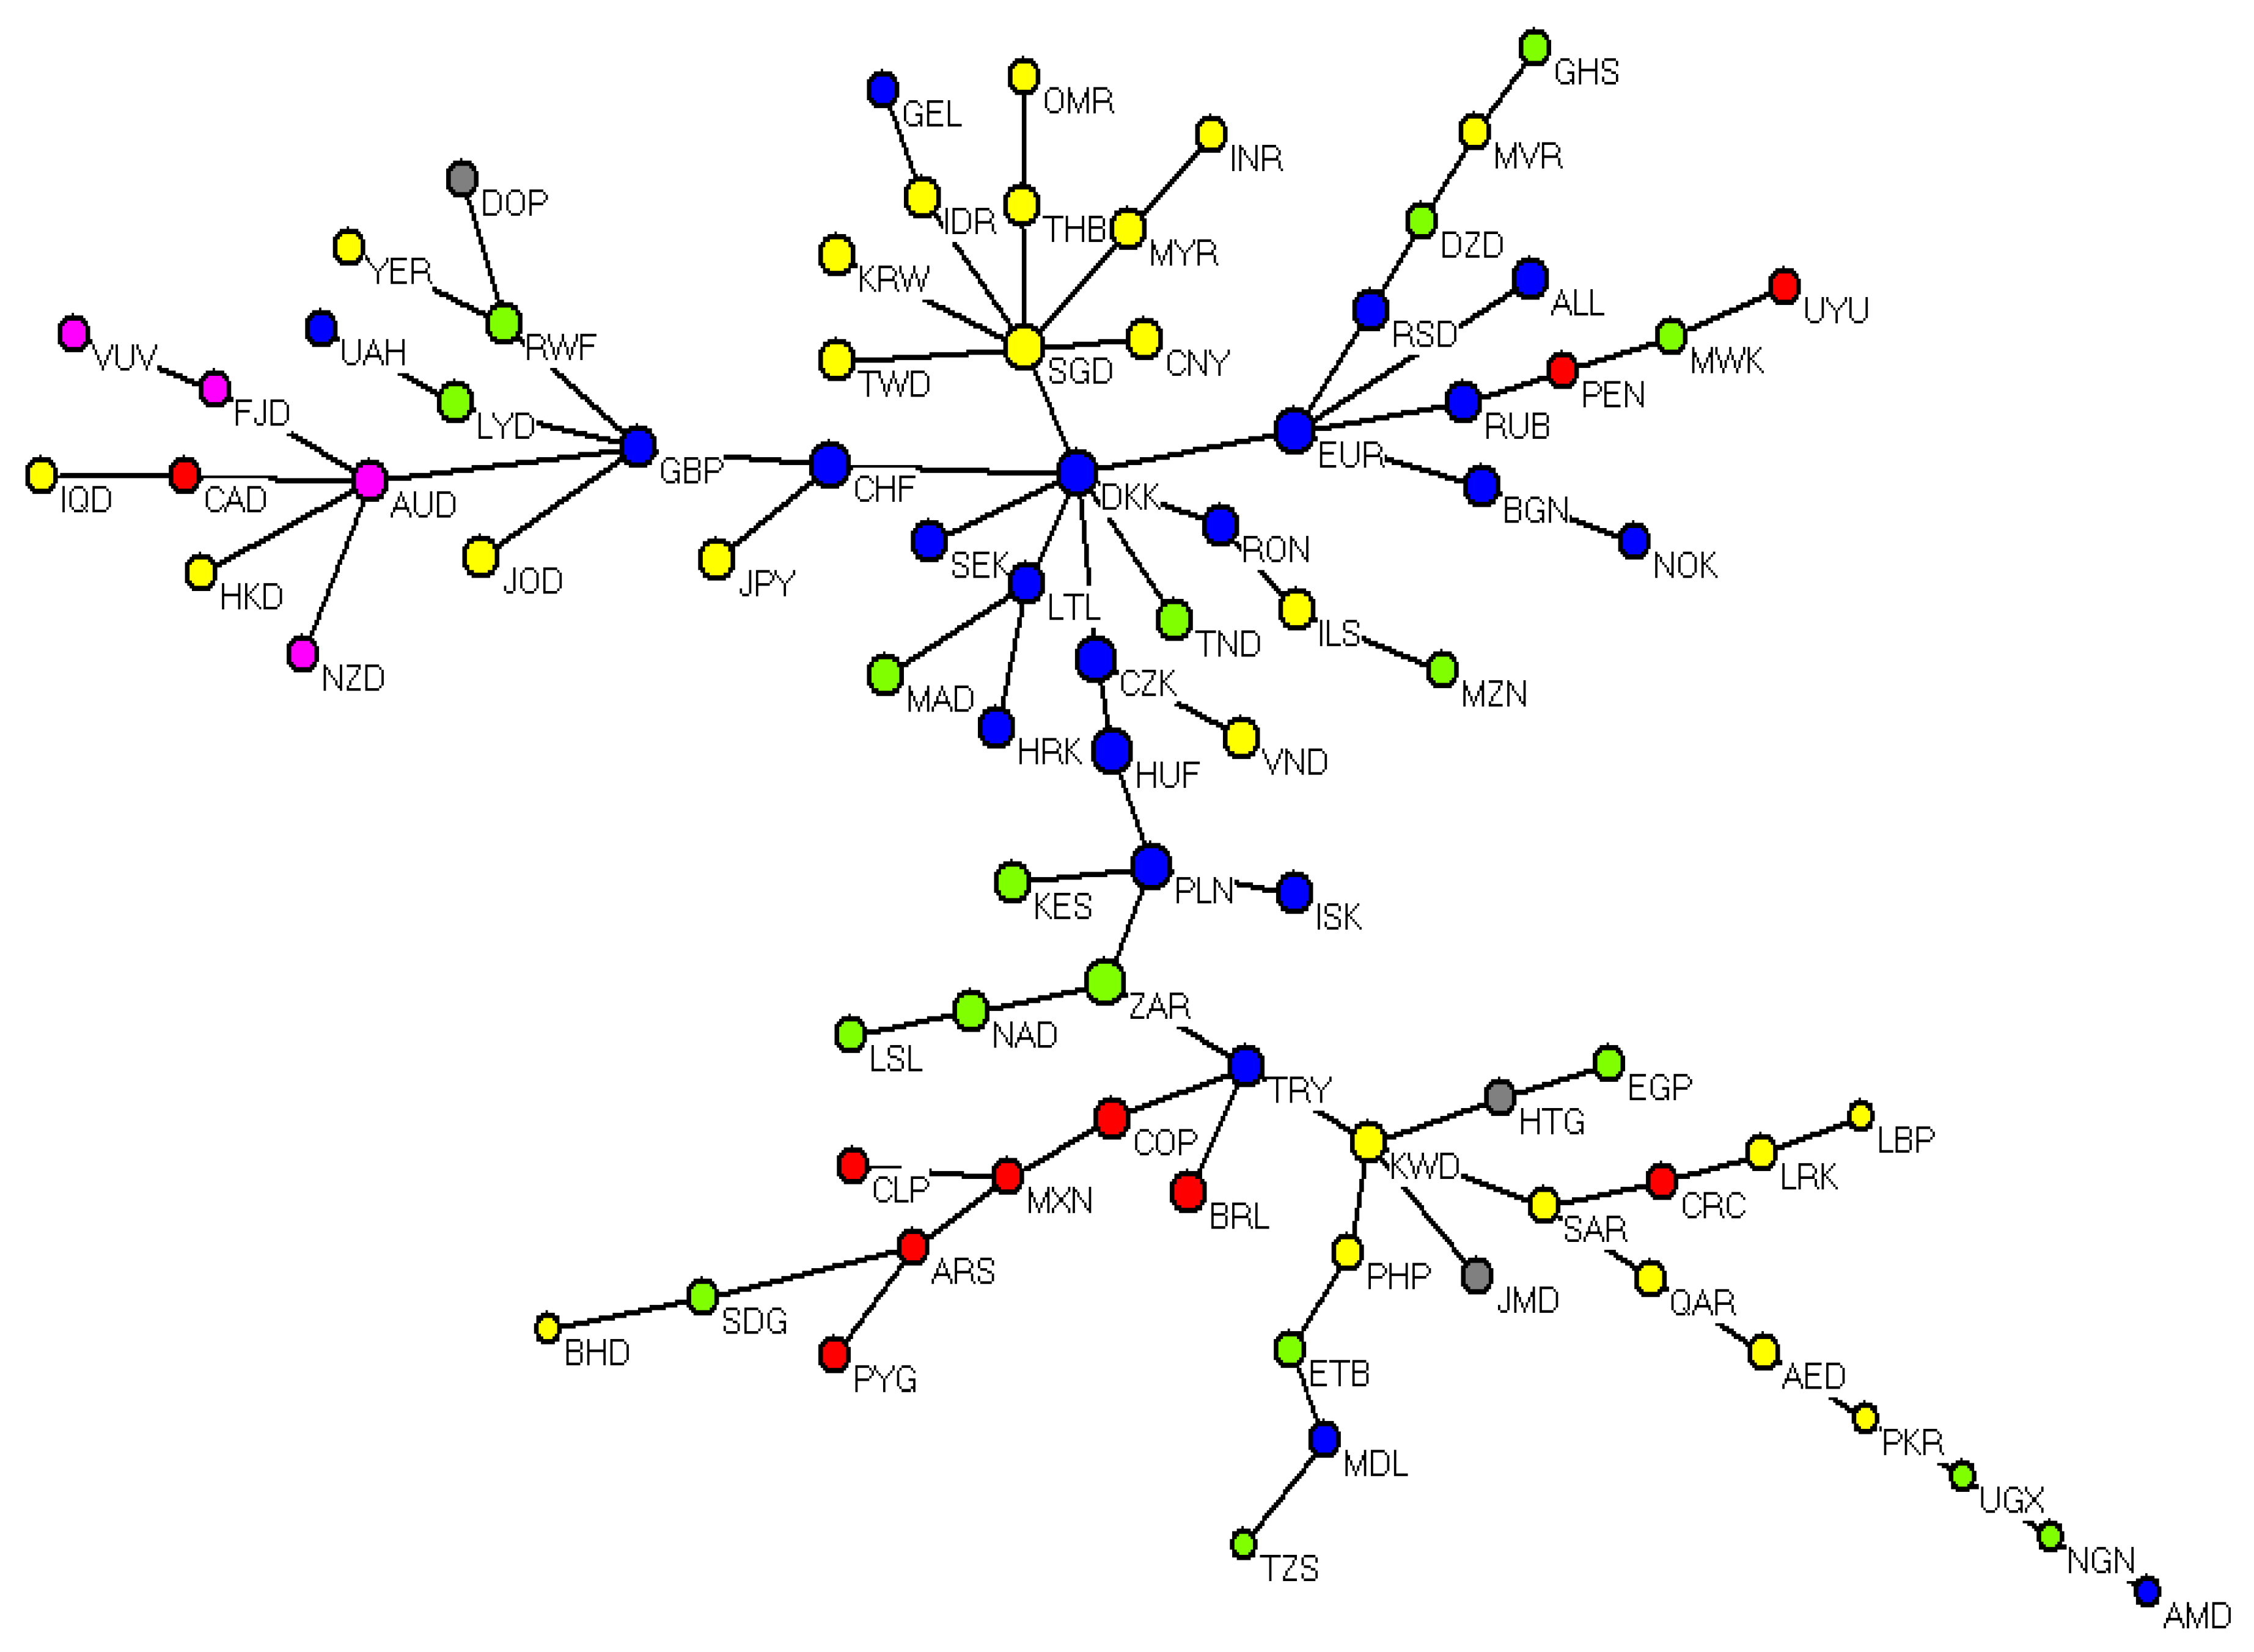
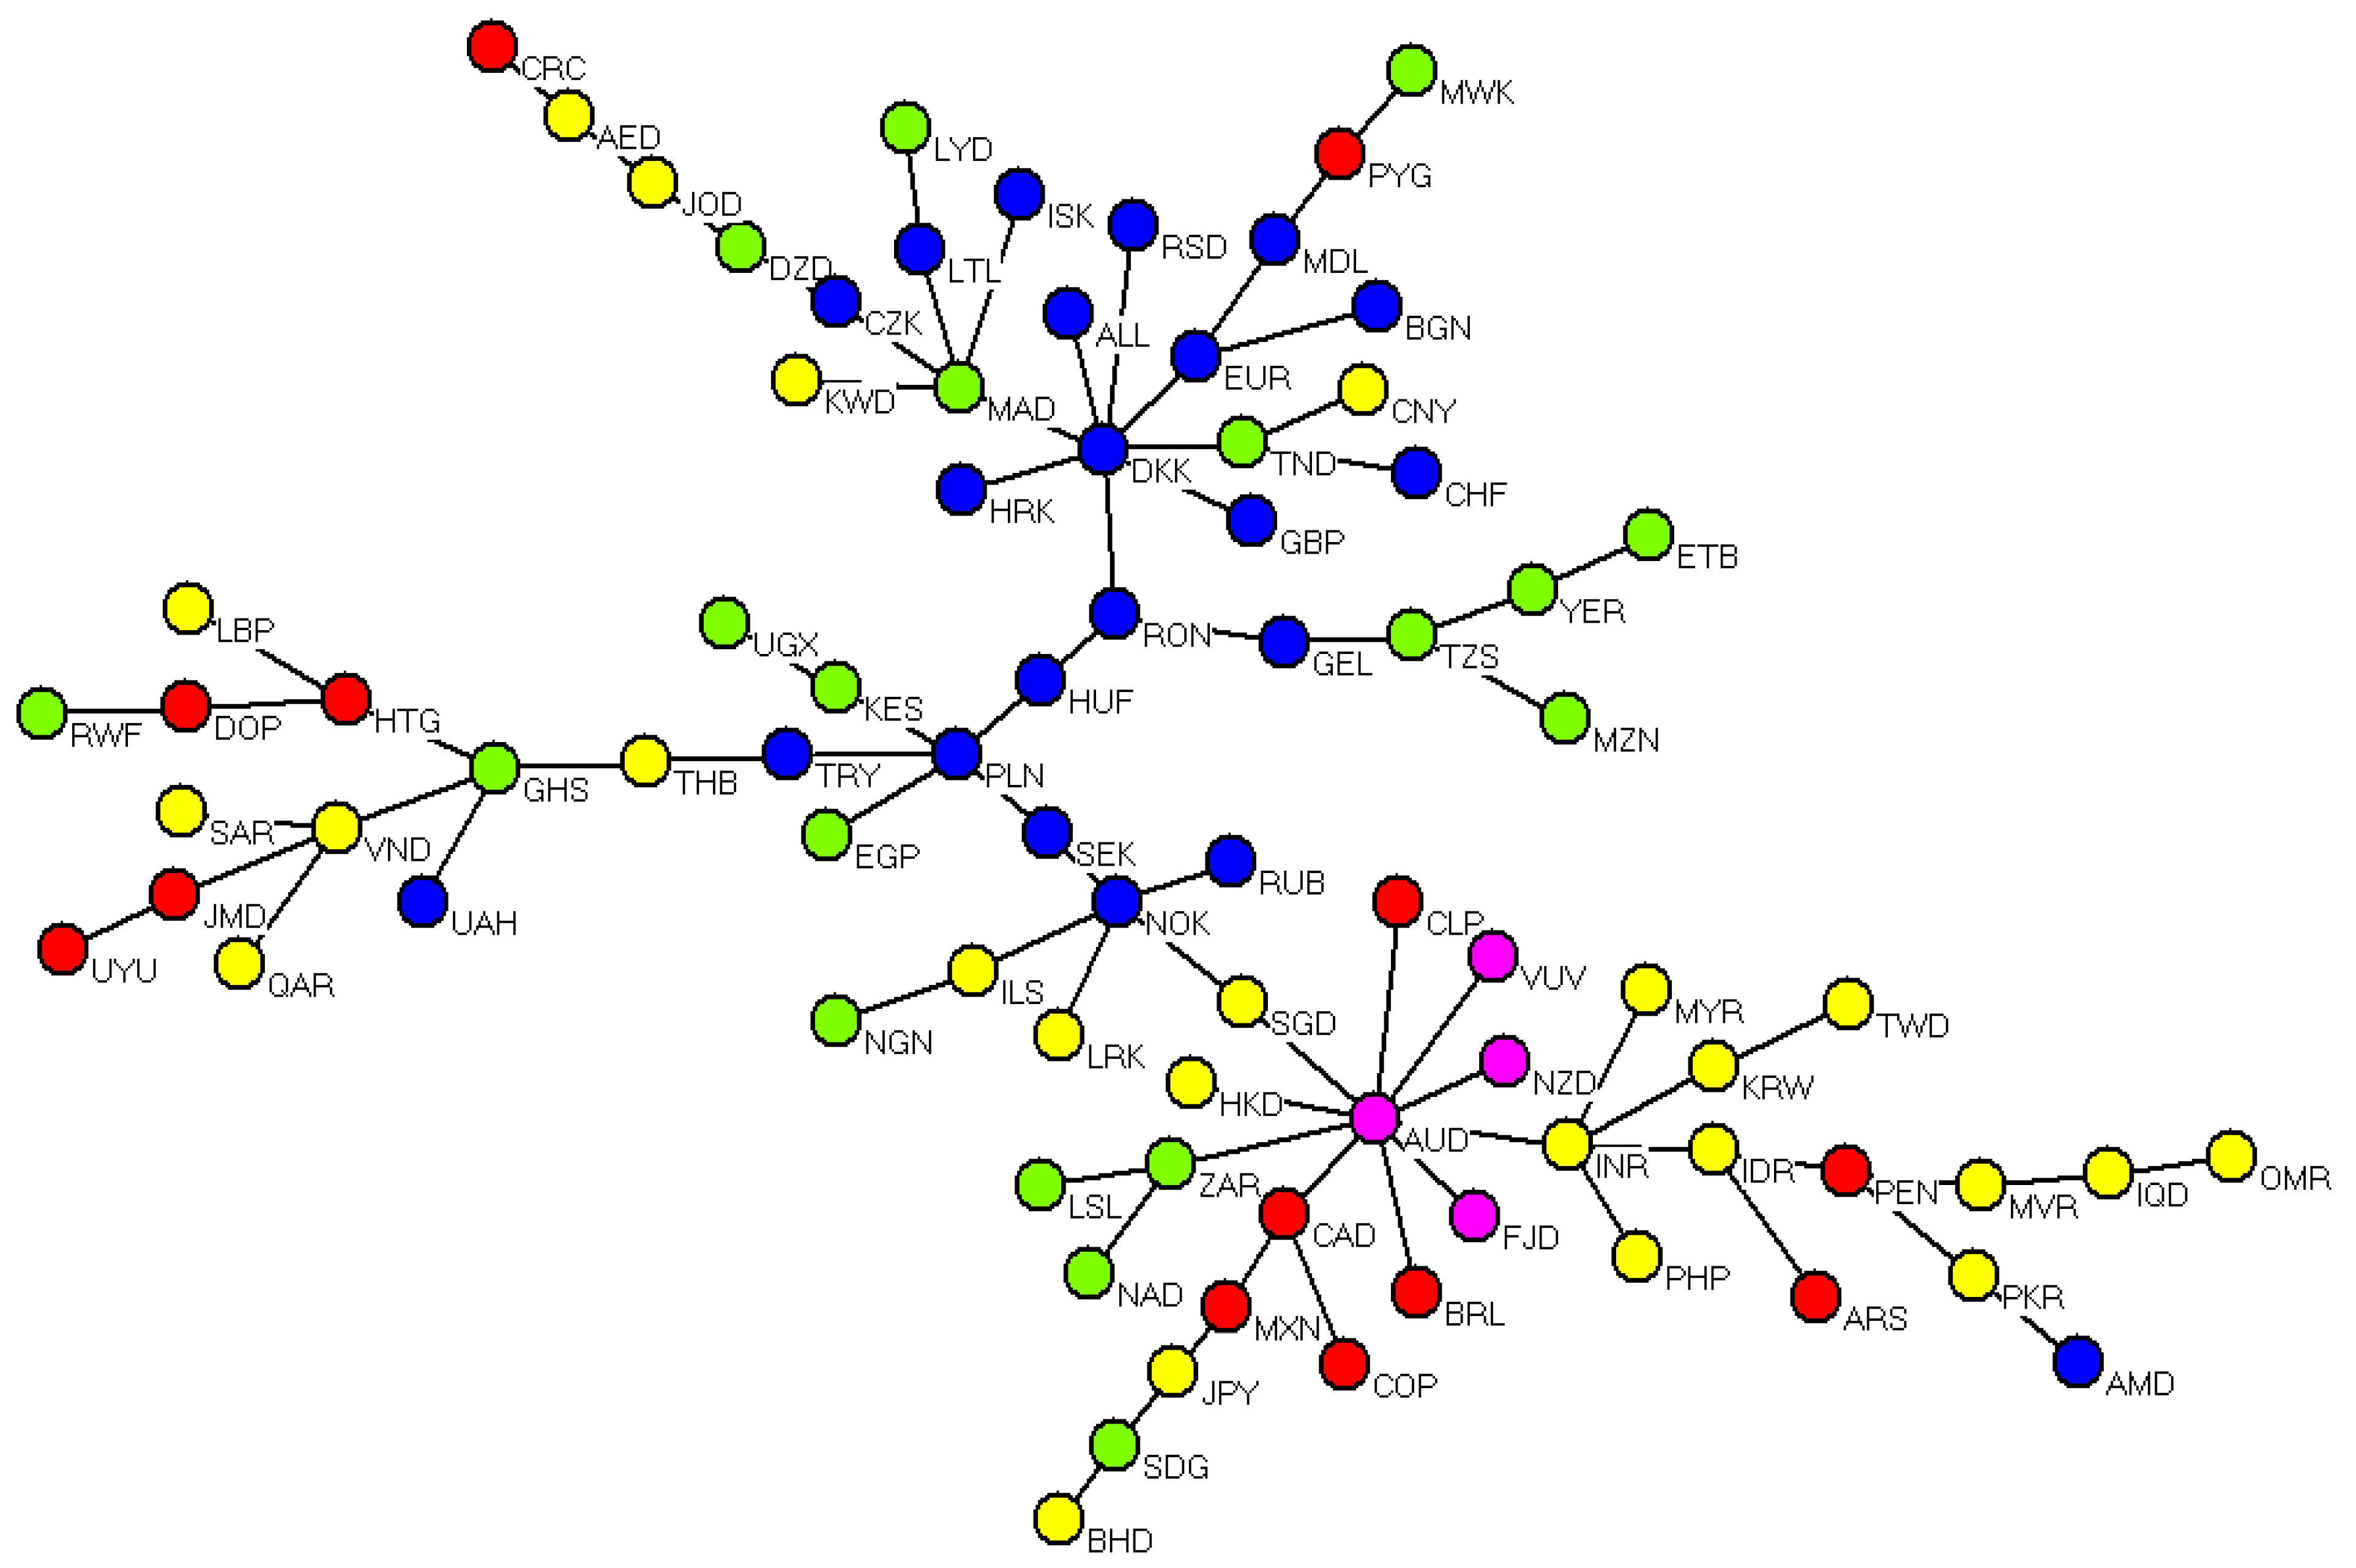
Figure 1, Figure 2 and Figure 3 show the MSTs of currencies constructed using Kruskal’s algorithm for first, second and third periods, respectively. In these figures, the topological structure of currencies is showed by MST. Each colored node represented a region (European countries, blue; Asian countries, yellow; American countries, red; Pacific Ocean, pink; African countries, green).
In order to interpret the topological properties of network, we conducted the analysis in terms of three popular measures of centrality, namely; degree centrality, betweenness centrality, and closeness centrality. These measures are useful to better understand the influence and supervision of each currency relative to the others (Abbasi and Altmann 2011; Xu et al. 2009; Espino and Hoyos 2010).
Figure 1, Figure 2 and Figure 3 show that the MSTs were mostly complemented by corresponding countries from the same regions such as European countries. EUR, which is an influential international currency, was located at the lowest position of centrality in the second and third periods (during and after crisis). In the first period (before the crisis) as shown in Figure 1, DKK (Denmark Danish krone), SGD (Singapore Dollar) and EUR (Europe Euro) were in central positions, respectively. It means that these currencies had the highest scores based on degree, betweenness and closeness centrality measures. DKK and EUR as European currencies played the central level in the network and other European countries were linked to them. However, in period II, as drawn in Figure 2, European countries losing their positions specially EUR and they linked to HUF (Hungarian Forint) and DKK (Denmark Danish krone). And AUD occupies as central positions in the second and third period and most of American countries connected to Australian dollar (AUD) during the crisis whereas all currencies of America are at the lowest level in three periods. SGD (Singapore Dollar) as a central currency in Asian countries lost the most centrality and other Asian currencies also moved away from SGD (Singapore Dollar) in the second and third periods.
DKK (Denmark Danish krone) and SGD (Singapore Dollar) also as two central currencies in period I lost the most centrality during and after crisis. CZK (Czech Koruna) is other European currency that lost centrality measure.
5.2. Regional Based Currencies Network Topology
Figure 4, Figure 5 and Figure 6 show MSTs and HTs of nine regions that composed by a different number of currencies. Each colored node represented a region. The value presented at the links in the figures are the distances between two regions.
According to the topological structure of regions showed by dissimilarity-based MST in Figure 4, Figure 5 and Figure 6, we determined the closest pairs of regions. With connecting all the pairs of regions, we obtained a regional based MST of currencies. From the MSTs, their associated indexed HT showed the hierarchical organization of the regions for three periods in Figure 4, Figure 5 and Figure 6. The MST and HT were applied to find the clusters of regions and the key region. From the MST, the HT could be constructed directly. An important property is that the HT is always unique; however the MST might not be. Therefore, the topological network of an MST must be interpreted with caution.
By using hierarchical tree, we can obtain the taxonomical and hierarchical structures of regions in networks. To define the connection of two regions, the single linkage clustering method is used to find the minimal distance. This method is useful for determining the important region which is representative in making a connection between those regions. In HTs, two lines connected when a vertical line is drawn between two horizontal lines. The height of the vertical line indicates the distance at which the two regions are merged.
From the figures, we noted that the distance between pairs of regions have high value in all periods except in period 2 that Pacific-North America (, Europe-Africa and North America-South America ( were merged with shortest distance of strong relationship, respectively. This implies that the regions in second period (during the crisis) have a high degree of correlation, except South America-Central America and the Pacific-Caribbean. This might have been caused by the impact of crisis within them. According to the comparison of currency and regional network, it is obvious to see that the currencies tended to merge to the same regions. From those figures, a cluster was clearly present, with Europe being the dominant region in first period; however, Europe moved away from the center of the cluster undergoing the crisis in the second and third periods. Generally, the position of a given region in a network has its own characteristics and the position it is located on will reflects the relationships between it and other regions.
In Figure 4, in terms of centrality, the Europe region plays an important role in first period of crisis. The continuous connection of five regions of the figure is meaningful. Geographically, Europe, Pacific, North America, South America, and Caribbean are adjacent. The MST exhibited the topological structure of regions.
In the process of changes of MST, as we expect, the centrality of Europe is decreased during the crisis period (Figure 5) and instead, the Pacific region plays an important role in period II. From the figure, we noted that the closest pair of regions were Pacific and Northern America with the smallest distance value, 0.87. This means that the configuration of currencies in Northern America is similar to Pacific. The connection of American regions to Pacific also made sense. The continuous connection of American regions (Northern America, South America and Central America) linked to Pacific in the bottom right of the figure are adjacent and in the lowest position of network centrality. The connection of all American regions to Pacific also made sense.
As a result of Section 5.1 of currency network analysis, the centrality measure of EUR decreased in the second and third periods of crisis, while the AUD moved to be in the central position. This result was also clear in the regional network, which showed that how the US crisis affected the structure of regions in the network.
In the third period, the Europe, Central America and Caribbean regions were at their lowest position. But, during the crisis, the structure of MST was more correlated than after the crisis, due to the average distances being smaller compared to period III.
From the figure, Pacific and Northern America were still a closed pair compared to others with the smallest distance value. AUD could be considered as a key currency, and SGD plays an important and preferred currency in terms of the connections of AUD (Figure 3).
6. Concluding Remarks
This research considers the multidimensional data of currencies and regions to measure the similarity and dissimilarity by using Multivariate vector correlation where each currency or region is represented as a MTS. It is valuable in its considerations of how the subprime crisis affected the interrelationships of currency changes. To the best of our knowledge, there are no studies dealing with network analysis of multi-dimensional OHLC currency prices and the regional based currencies in relation to the crisis.
Generally, this study has concentrated on a network of currencies and regions as the illustrative examples of the FOREX market to demonstrate the mechanism of dissimilarity measure in a multivariate setting. We present the topology networks among 83 major currencies using the MST technique in three periods. This study examined the network topology evolution of currencies and regions from 2005 to 2011 in terms of the subprime crisis, and then the structural changes were compared for three sub-periods (before, during and after crisis). The result of the network analysis showed several significant changes during and after the crisis, compared to before the crisis. For example, European countries lost the central position in the second and third periods, and AUD became the central currency after crisis. In topology network and hierarchical structures of regions, the connections of regions are compiles of their geographical location. With determination of the closest pairs of currencies, a region-based MST of currencies is obtained. From the MSTs, the key currencies and regions are determined for each period. This helped us to suggest ideas about the relationship between currencies and regions and their properties.
The value of distances issued from the MST and that from the HT had the same pattern and the same magnitude. They showed smaller values during the crisis. This means that during the crisis, currencies related strongly to one another; they strongly influenced one another.
The basic findings of the topological properties of the FOREX market can be summarized as follows:
- (1)
- From the three MSTs, we draw some conclusions. For instance, EUR is confirmed as the predominant world currency in first period (before crisis). However, the European countries are not stable specially EUR in the period of 2007–2009 (during crisis).
- (2)
- Based on the topology network and hierarchical structures of regions, we find that the network structure of regions during the crisis is more correlated than before and after the crisis because the crisis became prevalent in most of the countries in this period.
Our result shows that currency networks have several notable alterations in the three periods. With the growing frequency of financial crises, this work can suggest basic ideas about the relationship between currency crises and the properties of the currencies network in terms of multi-dimensional information. The method, based on the VC coefficient, can also be combined with other network analysis approaches to study the topology of multi-dimensional networks. The outcomes of this study could be developed into research for forecasting and signaling disturbances that adversely affect the stability of the physical world, and giving sufficient time to prepare resources and response actions to minimize the impact of financial crises on the stability of the physical world.
Author Contributions
M.K. is responsible for data analysis, interpretation and final approval. A.M. contributed to idea generation, the conceptualization of the paper and the theoretical framework design.
Acknowledgments
The first author is supported by the National Elites foundation, Iran. The author gratefully acknowledges that sponsorship. The authors also thank Shiraz University for the opportunity to do this research.
Conflicts of Interest
The authors declare no conflict of interest.
References
- Abbasi, Alireza, and Jorn Altmann. 2011. On the correlation between research performance and social network analysis measures applied to research collaboration networks. Paper presented at the 2011 44th Hawaii International System Sciences (HICSS), Kauai, HI, USA, January 4–7. [Google Scholar]
- Batagelj, Vladimir, and Andrej Mrvar. 2003. Density Based Approaches to Network Analysis. In Analysis of Reuters Terror News Network. Ljubljana: University of Ljubljana. [Google Scholar]
- Batagelj, Vladimir, and Andrej Mrvar. 2004. Pajek analysis and Visualization of Large Networks. New York: Springer. [Google Scholar]
- De Nooy, Wouter, Vladimir Batagelj, and Andrej Mrvar. 2011. Exploratory Social Network Analysis with Pajek. Cambridge: Cambridge University Press, vol. 27. [Google Scholar]
- Deza, Michel M., and Elena Deza. 2006. Dictionary of Distances. Amsterdam: Elsevier. [Google Scholar]
- Djauhari, Maman A., and Gan Siew Lee. 2014. Dynamics of Correlation Structure in Stock Market. Entropy 16: 455–70. [Google Scholar] [CrossRef]
- Escoufier, Yves. 1973. Le traitement des variables vectorielles. Biometrics 40: 751–60. [Google Scholar] [CrossRef]
- Escoufier, Yves. 2006. Operator related to a data matrix: A survey. In Compstat 2006—Proceedings in Computational Statistics. New York: Springer, pp. 285–97. [Google Scholar]
- Espino, Joel Monárrez, José Ramiro, and Caballero Hoyos. 2010. Stability of centrality measures in social network analyses to identify long-lasting leaders from an indigenous boarding school of northern Mexico. Studies on Contemporary Cultures 32: 155–71. [Google Scholar]
- Freeman, Linton C. 1977. A Set of Measures of Centrality Based on Betweenness. Sociometry 40: 35–41. [Google Scholar] [CrossRef]
- Freeman, Linton C. 1979. Centrality in social networks conceptual clarification. Social Networks 1: 215–39. [Google Scholar] [CrossRef]
- Gan, Siew Lee, and Maman A. Djauhari. 2015. New York Stock Exchange performance: Evidence from the forest of multidimensional minimum spanning trees. Journal of Statistical Mechanics Theory and Experiment 12: 12005. [Google Scholar] [CrossRef]
- Geisberger, Robert, Peter Sanders, and Dominik Schultes. 2008. Better Approximation of Betweenness Centrality. Paper presented the Meeting on Algorithm Engineering & Expermiments, San Francisco, CA, USA, January 19; Philadelphia: Society for Industrial and Applied Mathematics, pp. 90–100. [Google Scholar]
- Górski, Andrzej Z., Stanisław Drożdż, and Jarosław Kwapień. 2008. Scale free effects in world currency exchange network. The European Physical Journal B-Condensed Matter and Complex Systems 66: 91–96. [Google Scholar] [CrossRef]
- Jang, Wooseok, Junghoon Lee, and Woojin Chang. 2011. Currency crises and the evolution of foreign exchange market: Evidence from minimum spanning tree. Physica A: Statistical Mechanics and its Applications 390: 707–18. [Google Scholar] [CrossRef]
- Kazemilari, Mansooreh, and Maman A. Djauhari. 2013. The evolution of foreign exchange market based on European sovereign debt crisis. International Journal of Basic and Applied Sciences 2: 340–45. [Google Scholar]
- Kazemilari, Mansooreh, and Maman A. Djauhari. 2015. Correlation network analysis for multi-dimensional data in stocks market. Physica A: Statistical Mechanics and its Applications 429: 62–75. [Google Scholar] [CrossRef]
- Keskin, Mustafa, Bayram Deviren, and Yusuf Kocakaplan. 2011. Topology of the correlation networks among major currencies using hierarchical structure methods. Physica A: Statistical Mechanics and its Applications 390: 719–30. [Google Scholar] [CrossRef]
- kruskal, Joseph B. 1956. On the shortest spanning subtree of a graph and the traveling salesman problem. Proceedings of the American Mathematical Society 7: 48–50. [Google Scholar] [CrossRef]
- Kwapién, J., S. Gworek, and S. Drożdż. 2009. Structure and evolution of the foreign exchange networks. Acta Physica Polonica B 40: 175–94. [Google Scholar]
- Kwapién, Jarosław, Sylwia Gworek, Stanisław Drożdż, and Górski Andrzej Z. 2009. Analysis of a network structure of the foreign currency exchange market. Journal of Economic Interaction and Coordination 4: 55–72. [Google Scholar]
- Mantegna, Rosario N. 1999. Hierarchical structure in financial markets. The European Physical Journal B-Condensed Matter and Complex Systems 11: 193–97. [Google Scholar] [CrossRef]
- Mantegna, Rosario N., and Harry Eugene Stanley. 1999. Introduction to Econophysics: Correlations and Complexity in finance. Cambridge: Cambridge University Press. [Google Scholar]
- Mantegna, Rosario N., and Harry Eugene Stanley. 2000. An Introduction to Econophysics. Cambridge: Cambridge University Press. [Google Scholar]
- Mizuno, Takayuki, Hideki Takayasu, and Misako Takayasua. 2006. Correlation networks among currencies. Physica A: Statistical Mechanics and its Applications 364: 336–42. [Google Scholar] [CrossRef]
- Naylor, Michael J., Lawrence C. Rose, and Brendan J. Moyle. 2007. Topology of foreign exchange market using hierarchical structure methods. Physica A: Statistical Mechanics and its Applications 382: 199–208. [Google Scholar] [CrossRef]
- Ohta, Jun. 2006. Visualization of metabolic networks as networks of atoms by Pajek: An application of connectivity matrix method. Paper presented at the 17th International Conference on Genome Informatics, Pacifico Yokohama, Japan, December 18–20. [Google Scholar]
- Onnela, Jukka-Pekka, Anirban Chakraborti, Kimmo Kaski, János Kertész, and Antti Kanto. 2003. Dynamics of market correlations: Taxonomy and portfolio analysis. Physical Review E 68: 056110. [Google Scholar] [CrossRef] [PubMed]
- Ortega, Guillermo J., and David Matesanz. 2006. Cross-country hierarchical structure and currency crises. International Journal of Modern Physics C 17: 333–41. [Google Scholar] [CrossRef]
- Robert, Pierre, and Yves Escoufier. 1976. A unifying tool for linear multivariate statistical methods: The RV-coefficient. Applied Statistics 1976: 257–65. [Google Scholar] [CrossRef]
- Sharif, Shamshuritawati, Nur Syahidah Yusoff, and Maman A. Djauhari. 2012. Network topology of foreign exchange rate. Modern Applied Science 6: 35. [Google Scholar] [CrossRef]
- Shirai, Sayuri. 2009. The Impact of the US Subprime Mortgage Crisis on the World and East Asia. Munich: Munich Personal RePEc Archive. [Google Scholar]
- Smilde, Age K., Henk A.L. Kiers, Sabina Bijlsma, Carina Rubingh, and M. J. van Erk. 2009. Matrix correlations for high-dimensional data: The modified RV-coefficient. Bioinformatics 25: 401–5. [Google Scholar] [CrossRef] [PubMed]
- Tumminello, Michele, Tomaso Aste, Tiziana Di Matteo, and Rosario N. Mantegna. 2005. A tool for filtering information in complex systems. Proceedings of the National Academy of Sciences of the United States of America 102: 10421–26. [Google Scholar] [CrossRef] [PubMed]
- Wang, Gang-Jin, Chi Xie, Feng Han, and Bo Sun. 2012. Similarity measure and topology evolution of foreign exchange markets using dynamic time warping method: Evidence from minimal spanning tree. Physica A: Statistical Mechanics and its Applications 391: 4136–46. [Google Scholar] [CrossRef]
- Wu, Xin-Ye, and Zhi-Gang Zheng. 2013. Hierarchical cluster-tendency analysis of the group structure in the foreign exchange market. Frontiers of Physics 8: 451–60. [Google Scholar] [CrossRef]
- Xu, Yunhong, Jian Ma, Yong-Hong Sun, Jinxing Hao, Yongqiang Sun, and Yongqiang Zhao. 2009. Using social network analysis as a strategy for e-commerce recommendation. Paper presented at the Pacific Asia Conference on Information Systems (PACIS 2009), Hyderabad, India, July 10–12; July 10, p. 106. [Google Scholar]
- Zhang, Yiting, Gladys Hui Ting Lee, Jian Cheng Wong, Jun Liang Kok, Manamohan Prusty, and Siew Ann Cheong. 2011. Will the US economy recover in 2010? A minimal spanning tree study. Physica A: Statistical Mechanics and its Applications 390: 2020–50. [Google Scholar] [CrossRef]
Figure 1.
Minimal spanning tree (MST) in first period (before the crisis in June 2005—May 2007).

Figure 2.
MST in second period (during the crisis in June 2007–May 2009).

Figure 3.
MST in third period (after the crisis in June 2009–May 2011).

Figure 4.
Topology network of regions based MST and hierarchical tree (HT) of the regions in period I.
Figure 4.
Topology network of regions based MST and hierarchical tree (HT) of the regions in period I.

Figure 5.
Topology network of regions based MST and HT of the regions in period II.

Figure 6.
Topology network of regions based MST and HT of the regions in period III.


Table 1.
Number of currencies in regions.
| Regions | Number of Currencies |
|---|---|
| Asia Middle East Africa South America Central America North America | 15 11 18 7 1 2 |
| Europe Union | 22 |
| Pacific Caribbean | 4 3 |
| Total | 83 |
© 2018 by the authors. Licensee MDPI, Basel, Switzerland. This article is an open access article distributed under the terms and conditions of the Creative Commons Attribution (CC BY) license (http://creativecommons.org/licenses/by/4.0/).
Share and Cite
MDPI and ACS Style
Kazemilari, M.; Mohamadi, A. Topological Network Analysis Based on Dissimilarity Measure of Multivariate Time Series Evolution in the Subprime Crisis. Int. J. Financial Stud. 2018, 6, 47. https://doi.org/10.3390/ijfs6020047
AMA Style
Kazemilari M, Mohamadi A. Topological Network Analysis Based on Dissimilarity Measure of Multivariate Time Series Evolution in the Subprime Crisis. International Journal of Financial Studies. 2018; 6(2):47. https://doi.org/10.3390/ijfs6020047
Chicago/Turabian StyleKazemilari, Mansooreh, and Ali Mohamadi. 2018. "Topological Network Analysis Based on Dissimilarity Measure of Multivariate Time Series Evolution in the Subprime Crisis" International Journal of Financial Studies 6, no. 2: 47. https://doi.org/10.3390/ijfs6020047
Note that from the first issue of 2016, this journal uses article numbers instead of page numbers. See further details here.