Analysis of Bankruptcy Threat for Risk Management Purposes: A Model Approach


Faculty of Finance and Insurance, University of Economics in Katowice, ul. 1 Maja 50, 40-287 Katowice, Poland
*
Author to whom correspondence should be addressed.
Int. J. Financial Stud. 2018, 6(4), 98; https://doi.org/10.3390/ijfs6040098
Submission received: 30 October 2018
/
Revised: 13 November 2018
/
Accepted: 12 December 2018
/
Published: 17 December 2018
(This article belongs to the Special Issue Bankruptcy Prediction)
Abstract
:In previous works, the importance of risk management implementation was addressed with regard to the problem of bankruptcy threat, with the explanation of risk impact on higher bankruptcy costs or the underinvestment problem. However, the evaluation of the impact of risk outcomes is technically linked to risk frequency and risk severity as the two dimensions of the risk map. The purpose of our study is to advocate two additional dimensions that incorporate liquidity and/or debt capacity constraint in the aftermath of risk occurrence. In the conceptual dimension, we propose a model that may support the appropriate design of risk management methods, by scaling a company’s ability to self-resist the risk outcomes. The study provides the empirical illustration of the frequency of the distinguished patterns of risk self-resistance. It was found that most frequently companies face the limited ability to self-resist risk outcomes, due to high debt capacity and high liquidity constraints. We also found statistically significant interdependencies between the company’s sector and the risk self-resistance. It supports the conclusion that the level of liquidity and debt capacity constraints and thus the ability to retain risk outcomes is sector-specific. It has important implications for the effective design of risk management methods.
Keywords:
bankruptcy threat; liquidity constraint; cash holdings; debt capacity constraint; leverage; risk management; risk financing methodsJEL Classification:
D81; M21; G32; G331. Introduction
The problems related to bankruptcy threat and bankruptcy costs remain in focus in numerous corporate finance-related works since the seminal work of Miller and Modigliani (1958). Bankruptcy costs are imposed by the implementation of debt to capital structure, which may in turn increase a company’s value if the effects of financial leverage are positive. However, higher levels of debt in the capital structure may ultimately lead to bankruptcy, as the debt capacity constraint emerges. Traditional analysis of the bankruptcy threat with the application of discriminant models is focused on the anticipation of a bankruptcy threat. However, as noted by Daily (1994) and later by Aziz and Dar (2006), the models are often criticized for their reliance solely on a company’s past performance as post-measures. In addition, the models focus on the identification of variables (ratios) that allow the detection of symptoms but not the causes of the arising bankruptcy threat—this paper contributes to this debate, as it considers one of the possible reasons behind the emergence of bankruptcy threat; the impact of risk outcomes.
The problem was first addressed by Mayers and Smith (1982) and MacMinn (1987), who explained the rationale behind risk management with reference to the findings of corporate finance theory regarding the bankruptcy costs and underinvestment problem. Further empirical works confirmed that from the corporate finance point of view, the impact of risk on a company’s performance (and ability to create value) is related to the consequences observed in the volatility of cash flows. Since then, numerous studies examined the impact of the implementation of various risk treatment techniques in this context. In particular, these studies referred to the negative risk outcomes that lead to undesired cash flow volatility (which is consistent with the negative concept of risk: risk as a loss). These conclusions were used to support the rationale behind risk management. In particular, it was claimed that the implementation of risk management enhances value creation by the limitation of the possible negative impact of risk consequences on cash flow volatility. In other words, in a given company, the ultimate negative consequences of risk occurrence may be manifested by cash inflows lower than expected and/or cash outflows higher than expected. This may, in turn, affect the ability to maintain financial liquidity and financial balance and, as a consequence, significantly increase bankruptcy threat. In this context, risk management should support the selection of appropriate risk management techniques, that will allow smoothing of the cash flow volatility in the aftermath of risk occurrence (e.g., by the implementation of mechanisms that provide an injection of cash). With reference to previous studies on the importance of risk management, this study aims at providing a conceptual framework that may potentially expand the traditional view on risk assessment and the selection of appropriate risk management methods. A well-designed mix of risk management methods relies on the correctness of risk assessment within the estimation of risk frequency (probability) and risk severity (impact). These two features of identified risks are typically captured in the process of risk mapping. Moreover, with reference to the outcomes of a risk map, a company should design the optimal risk management strategy. Our study contributes to the existing literature debate on risk assessment by justifying the need to include the evaluation of a company’s ability to self-resist the risk outcomes. In our proposal, we follow a corporate finance approach, with reference to two main constraints related to bankruptcy threat: the debt capacity constraint and liquidity constraint. The prime aim of this study is to frame a conceptual model that offers a proposal for the evaluation of a company’s risk self-resistance, as determined by its debt capacity constraint and liquidity constraint. The proposition of the conceptual model is supported by empirical illustration, which aims at the observation of the frequency of each of the conceptually identified patterns of a company’s risk self-resistance. In addition, the empirical illustration examines the interdependencies between a company’s sector and the debt capacity or liquidity constraint to indicate the sector relativity.
As this study focuses on indicating the utility of bankruptcy threat analysis for a more effective selection of risk management methods, it primarily contributes to the literature on the proper design and implementation of the risk management process. However, the study also contributes to the literature on bankruptcy prediction, as it places the application of bankruptcy analysis in a new dimension—a supportive role in risk management. Although the bankruptcy threat is here considered only in two dimensions (liquidity constraint and debt capacity constraint), it may enhance further debate on the applicability of more sophisticated bankruptcy prediction tools in this new dimension (role). The study is organized as follows. In the second section, we refer to the previous research and empirical works related to the explanation of the rationale behind risk management with reference to the bankruptcy threat. In particular, we focus on the existing explanation of the positive impact of risk management on the possible reduction of bankruptcy costs and the underinvestment problem. In the third section, we explain the premises of our conceptual model of four patterns of a company’s risk self-resistance. The reasons behind the inclusion of two additional dimensions (debt capacity constraint and liquidity constraint) are discussed within. The conceptual model is also discussed in the decisive context, with reference to the design of risk management methods. The fourth section presents the research design, methodology, sample, findings, and discussion of the empirical illustration. The fifth section concludes the study.
2. Conceptual Framework: Bankruptcy Threat as a Rationale behind Risk Management
As noted by Kloman (2010) and Dionne (2013), the problem of risk management has received attention since the 1950s; however, the first works were devoted to the management of insurable risk. Since the 1970s, the discipline of risk management has also been concerned with the analysis of investment risk, financial markets, and the application of derivatives. Since the 1990s, we have observed a reorientation of risk management from the silo approach (a single risk in focus) to the holistic approach, that postulates the inclusion of risk management in all other areas of decision-making in this value creation problem. Risk management in its strategic dimension is often referred to as Enterprise Risk Management (Dickinson 2001) and has been followed by the emergence of various risk management standards (Kloman 2010; Purdy 2010; Power 2009; Hayne and Free 2014; Lalonde and Boiral 2012).
One of the most compelling questions, however, remains why companies decide to manage risk? In the academic debate, several approaches to this problem are identifiable. In the behavioral and social context, the problem is revisited through the determinants of individual and managerial (group) decision making under uncertainty regarding the impact of risk aversion (Outreville 2014; Slovic et al. 2004; Spira and Page 2003). Another stream of the literature perceives risk management in the context of a company’s innovations in strategic management (Hayne and Free 2014). However, in this study, a third context is most relevant—the adoption of the findings of contemporary theory of corporate finance. To exhibit the rationale behind the implementation of risk management, the capital structure theories are recalled with reference to the explanation of bankruptcy costs and the underinvestment problem.
Since the seminal work of Miller and Modigliani (1958) that launched the premises of static trade-off theory of leverage, the problem of bankruptcy threat and bankruptcy costs has been revisited in numerous empirical works. One of the most relevant works remains Kraus and Litzenberger (1973) who studied the impact of direct and indirect bankruptcy costs in the context of the optimal capital structure. By the implementation of debt to the capital structure, a company may get some tax benefits, but at the same time faces the direct and indirect costs of the growing bankruptcy threat. In general, the static trade-off theory of leverage assumes that the value of the levered firm remains higher than the value of the unlevered firm as long as the bankruptcy costs are lower than tax benefits. These theoretical considerations gave the impetus for the further development of various capital structure theories within the context of agency trade-off theory (Jensen and Meckling 1976), signaling theory (Ross 1977) or pecking order theory (Myers and Majluf 1984).
With reference to this stream of literature, the positive impact of the implementation of insurance or derivatives in hedging function was revisited in numerous empirical works, e.g., by Smithson and Simkins (2005); McShane et al. (2011); Bromiley et al. (2015); Mikes and Kaplan (2015). The basic premise of the early works examining the value-creation potential of risk management was that risk aversion and the related diversification of risk by the implementation of insurance or derivatives cannot be a convincing explanation for why firms manage risk. These works assumed that the separation of ownership and managerial control (which is an essential feature of contemporary corporations) offers a more effective risk reduction by portfolio diversification. Thus, the financially-oriented explanations of the rationale behind the management of risk have turned to the paradigms of financial theory to explain how insurance or derivatives may reduce corporate costs. Mayers and Smith (1982) were the first to address that risk management helps to reduce bankruptcy costs. This view was further developed by MacMinn (1987), who explained the relationship between managing risk with insurance and savings on bankruptcy costs and presented the concept of the higher value of an insured compared to an uninsured firm (with reference to the concept of Miller and Modigliani (1958)). In general, these studies examine the impact of the risk outcomes as a value-destroying factor and the relevance of risk management instruments (insurance or derivatives) in preventing the value-destruction impetus. The problem is explained in two related dimensions. First of all, the implementation of risk management may enhance the reduction of bankruptcy costs. From the capital provider’s perspective, an insured company is characterized by a lower bankruptcy threat. As a consequence, capital providers require lower returns (and a lower cost of capital, that enhances value creation). Secondly, the implementation of risk management (insurance or derivatives) safeguards the cash flows and thus allows to gather internal funds for investment purposes (growth opportunities). This explanation is derived from findings of the pecking order theory (Myers and Majluf 1984) with reference to the underinvestment problem (Myers 1977). The unprotected company faces a need to raise funds externally, which in turn may incur higher bankruptcy costs due to higher financial leverage (consistent with the static trade-off theory of leverage).
These two dimensions (the reduction of bankruptcy costs and the underinvestment problem) are derived from the analysis of the ultimate consequences of risk, observable in terms of the possible cash flows volatilities. For example, the damage of a company’s physical assets may lead to cash inflows lower than expected (as the production capacity is limited) or cash outflows higher than expected due to the need to restore damaged assets. The restoration of assets is related to investment decision-making and imposes additional capital needs. A lagged effect of risk outcomes may also be reflected by lowered cash inflows or higher cash outflows, with the emergence of indirect risk consequences. Undesired cash flow volatility (current or lagged) raises the need for an injection of funds. To some extent, these funds might be obtained internally, from the company’s cash reserves, consistent with the findings of a free-cash-flows hypothesis (Jensen 1986; Lang et al. 1991). Facing a lack of cash reserves, a company is forced to obtain additional funds externally. This simple example outlined above leads to the conclusion that any undesired and unforeseen cash flow volatility (as the outcome of risk) may ultimately impose debt capacity and/or liquidity constraints. Both constraints signal the emergence of financial distress.
The interdependencies between financial distress, debt capacity constraint, and liquidity constraint were addressed in previous empirical studies. Whited (1992) concluded that debt capacity constraints grow if it is difficult to obtain additional funding from external resources. However, it is difficult to raise external capital by a company under severe financial distress. In such circumstances, companies use their cash reserves (Lins et al. 2010; Neamtiu et al. 2014). There is also evidence that constrained firms or firms with a higher business risk tend to hold higher cash reserves (Opler et al. 1999; Harford 1999; Almeida et al. 2004; Harford et al. 2008, 2011; Steijvers and Niskansen 2013; Han and Qiu 2007; Chen et al. 2015; Haushalter et al. 2007; Acharya et al. 2007; Denis and Sibilkov 2010). In other words, companies facing the volatility of cash flows on a regular basis tend to hold high levels of liquid assets to limit the liquidity constraint, which is consistent with the premises of precautionary cash holdings first addressed by Keynes (1936). Precautionary cash is costly and thus may reduce the value creation capabilities (Whalen 1966; Dittmar et al. 2003; Faulkender and Wang 2006; D’Mello et al. 2008; Fresard 2010; Khieu and Pyles 2012; Harford et al. 2014; Chen et al. 2015).
In order to overcome the possible constraints that may emerge in the aftermath of risk occurrence, a company should implement adequate risk financing methods. Companies facing a debt capacity constraint and/or liquidity constraint should focus on the possible routes to transfer the risk. Risk transfer ensures an injection of funds that will support the smoothing of undesired cash flow volatility. The retention of risk (internal financing) is available for companies that hold precautionary cash and are not under debt capacity constraints.
3. Conceptual Model of the Assessment of Risk Self-Resistance: The Four Patterns
The identification of risk, followed by its assessment and evaluation, is a critical element of the risk management process. The assessment of risk is related to the estimation of risk frequency (how often it may happen) and risk severity (how high could the possible risk outcomes be). These two dimensions are captured in risk maps (Ratliff and Hanks 1992; Cox 2008; Pritchard et al. 2010; Thomas 2013). The process of risk mapping contributes to the selection of the most appropriate risk management methods (Walker 2013). For example, a risk of high frequency and high severity should be avoided, if possible. A risk of low frequency but high severity is most suitable for transfer (e.g., by the purchase of insurance). A risk of low severity but high frequency would be difficult to transfer (if obtainable, the transfer would be very costly), thus in these circumstances a company should implement methods of risk prevention to reduce the frequency of risk. Finally, the risk of low severity and low frequency is a risk that could be retained (self-resisted) by a company.
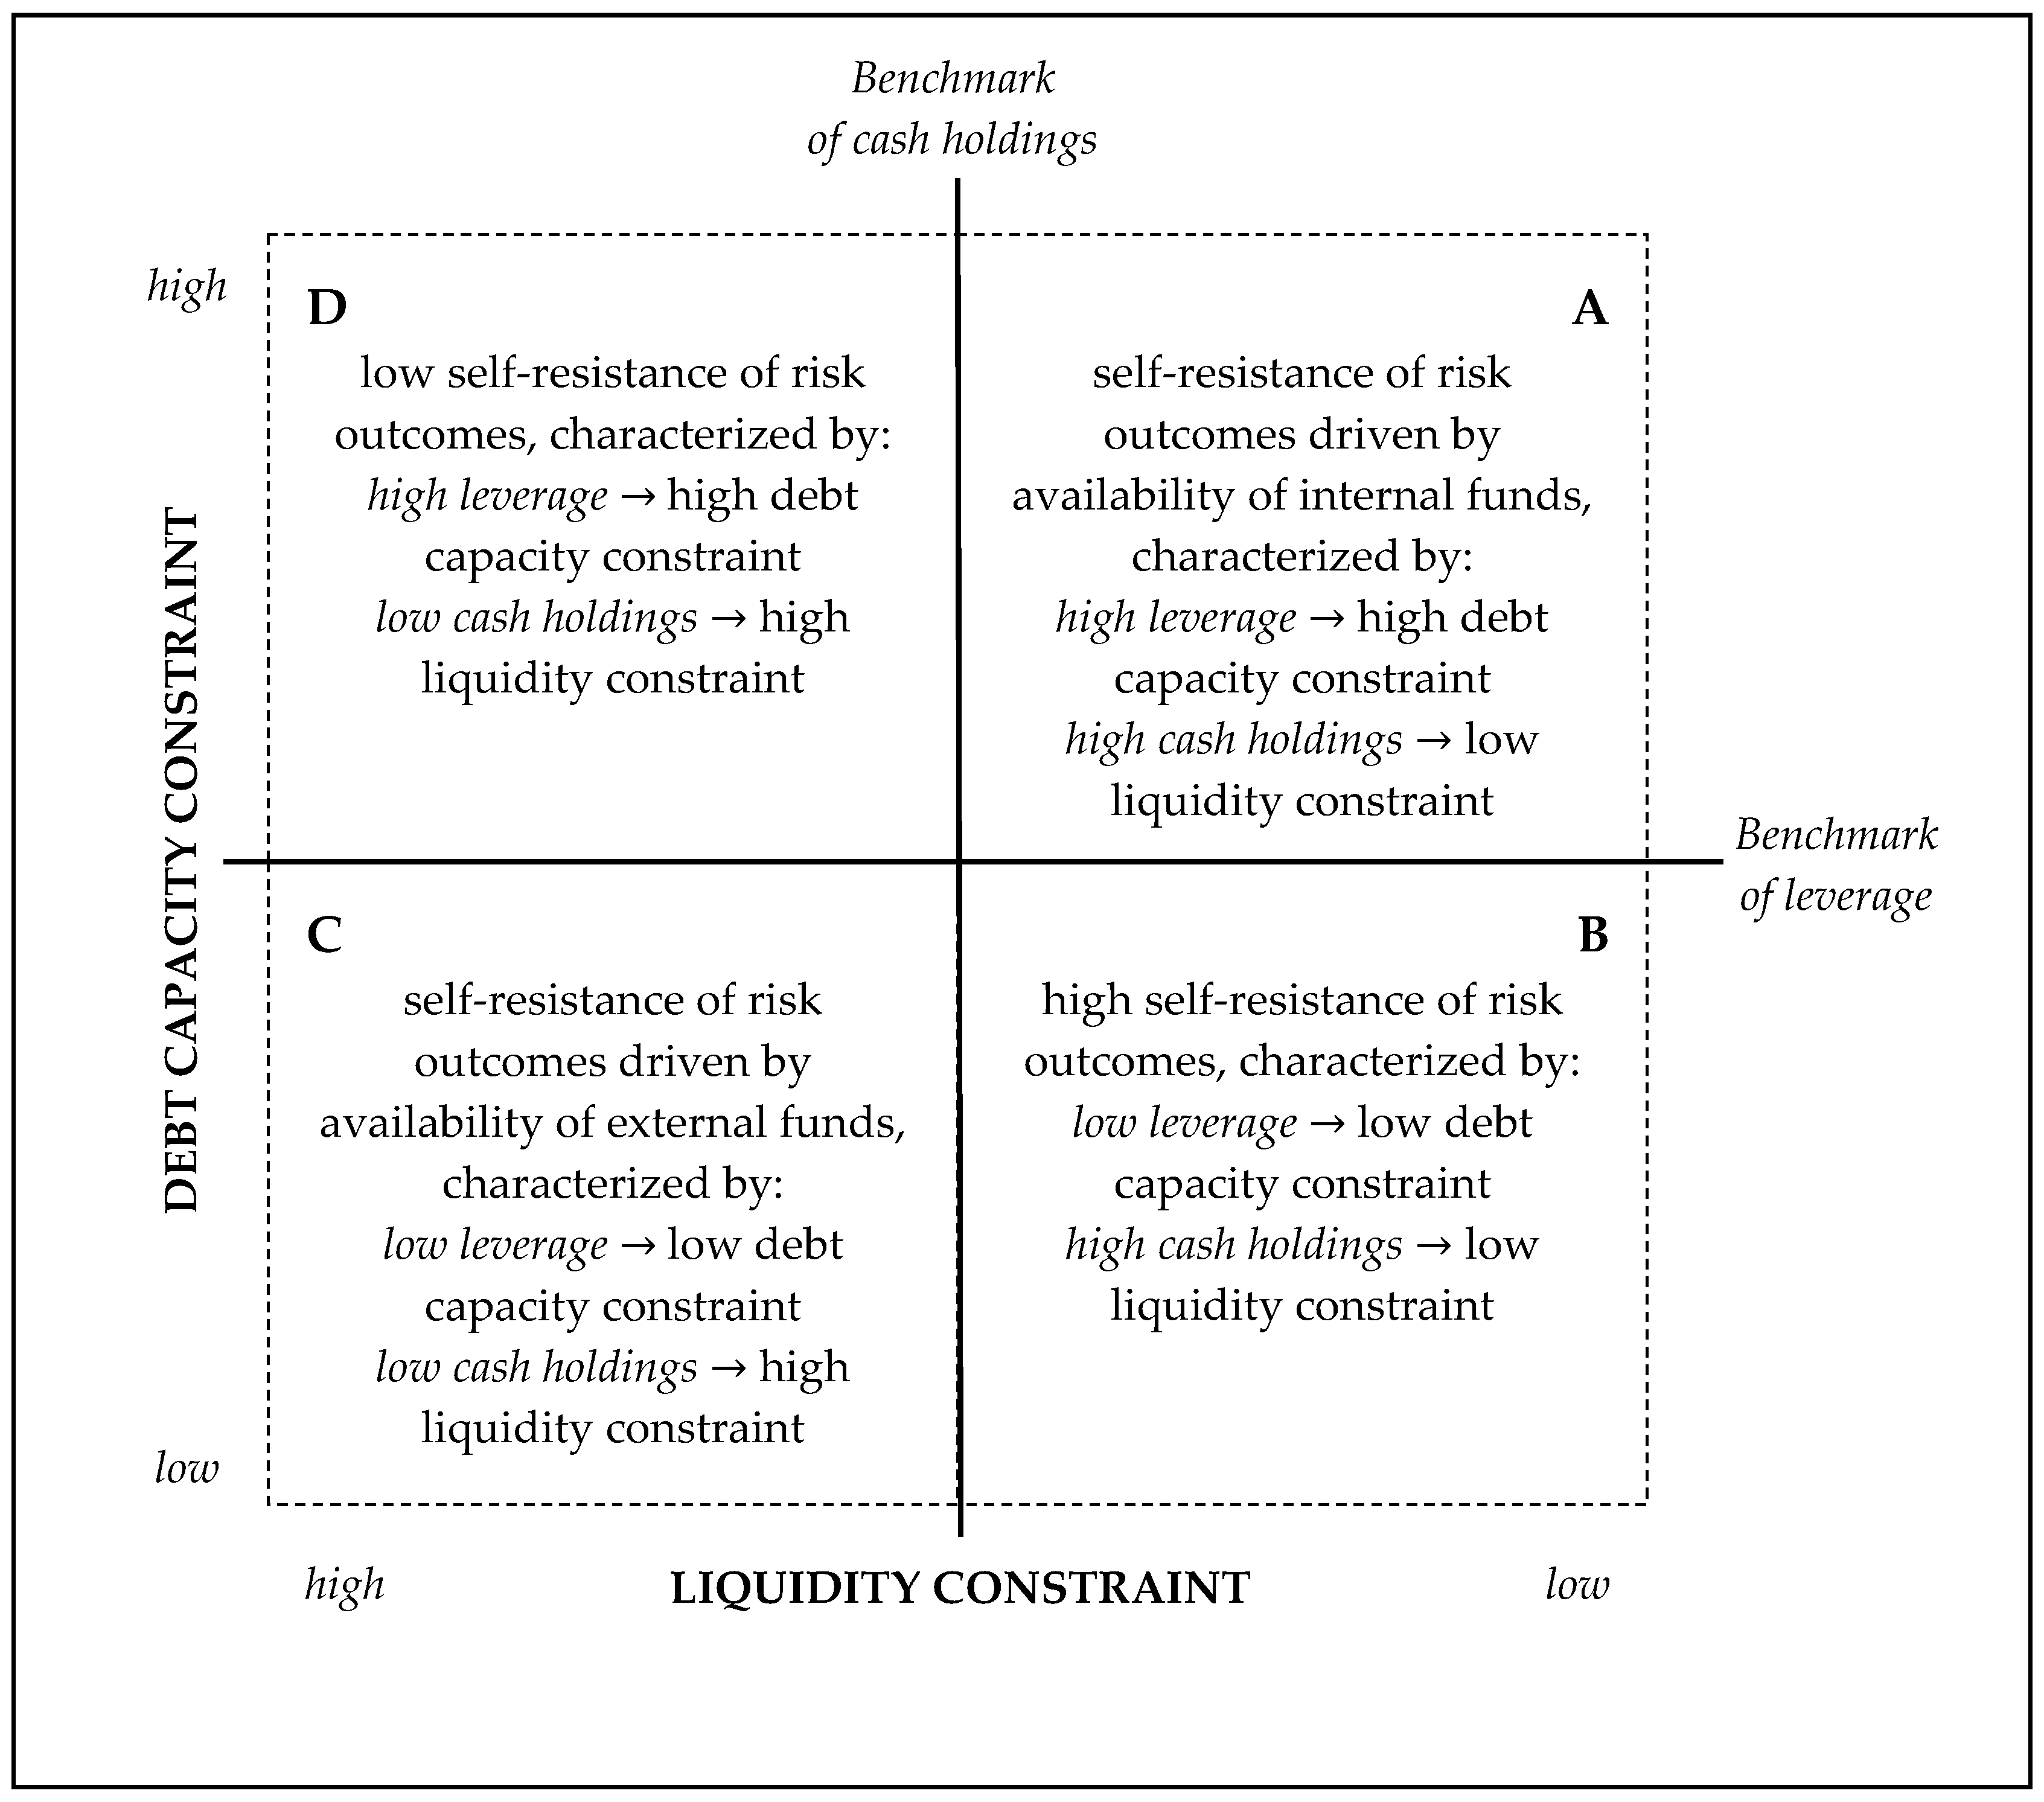
However, provided that the ultimate consequences of risk occurrence led to the undesired cash flow’s volatility, the assessment of risk should take into consideration the existing company’s abilities to mitigate cash flow volatility. In this context, we propose a conceptual model for assessing a company’s risk self-resistance. In other words, our conceptual model is designed to assist the traditional assessment of risk in the frequency-severity dimension. Under the assumption that undesired cash flow volatility will ultimately impose financial constraints and bankruptcy threat (as supported by the literature review provided in Section 2), we consider in our model two additional dimensions of assessment: a company’s debt capacity constraint and a company’s liquidity constraint. The model is framed in Figure 1.
Our model is of particular importance if risk is retained in the company. Risk retention means that a company solely covers the negative financial outcomes of risk. In other words, to alleviate the undesired cash flow volatilities in the aftermath of risk occurrence a company needs an injection of additional funds. If risk is retained, these funds may be obtained:
- internally, if there are adequate cash reserves in a company, reflected by company’s cash holdings in a buffering function; this is captured in our model by the liquidity constraint—the higher cash holdings, the lower liquidity constraint;
- externally, if a company is able to obtain additional debt1; this is captured in our model by a debt capacity constraint and is consistent with the premises of a static leverage trade-off theory (as outlined earlier, a constrained firm is prone to higher bankruptcy costs and is under a higher bankruptcy risk)—the higher the leverage, the higher the debt capacity constraint.
In our conceptual model, see Figure 1, we consider four possible combinations of liquidity constraint (low or high) and debt capacity constraint (low or high). Thus, we distinguished between the four possible patterns of a company’s risk self-resistance. A high or low liquidity constraint and debt capacity constraint are assessed with reference to the benchmark, which could be established as an average level of cash holdings or leverage (for a sector or group of similar companies).
The first pattern (square A) captures companies with risk self-resistance determined by the availability of internal funding. These companies are characterized by a high debt capacity constraint due to high leverage. These circumstances may impose difficulty in obtaining additional external funding (debt in particular) due to high bankruptcy costs and an increasing bankruptcy threat. However, these companies possess relatively high cash holdings (with reference to the benchmark). It indicates a low liquidity constraint and determines the ability to cover the negative financial outcomes of risk from previously accumulated funds.
The second pattern (square B) captures companies with high-risk self-resistance. These companies are characterized by both a low liquidity constraint (due to relatively high cash holdings) and low debt capacity constraint (due to low leverage). Facing the negative outcomes of risk, companies of high-risk self-resistance have no problems with obtaining additional external funds and/or use the existing cash reserves. These companies are the least exposed to a bankruptcy threat in the aftermath of risk occurrence.
The third pattern (square C) captures companies that resist on the availability of external funds. These companies are characterized by relatively lower cash holdings (and thus a higher liquidity constraint). However, the debt capacity constraint is relatively low as well due to low leverage. This determines the ability to obtain additional funding from external sources if needed.
The fourth pattern (square D) captures companies that are distinguished by the lowest risk self-resistance and thus are most prone to a bankruptcy threat in the aftermath of risk occurrence. These companies are under a relatively high liquidity constraint (due to low cash holdings) and high debt capacity constraint (due to high leverage).
Our conceptual model of the analysis of risk self-resistance should support the decision within the design of risk management methods implemented in a company. First of all, if we consider the traditional directions of risk assessment (as captured by risk mapping in a risk frequency and risk severity dimension), the outcomes of risk could be intentionally retained if the risk is classified as of low frequency and low severity. Our conceptual model is predominantly dedicated to these purposes. In such circumstances, the assessment of a company’s risk self-resistance helps to establish whether a company is:
- able to retain risk—if featured in square B; a company should focus on the design of the best risk retention policy and implementation of the most effective methods;
- unable to retain risk—if featured in square D; a company should pay particular attention to the proper identification and assessment of risk, followed by the design of optimal risk transfer solutions (if available) and on the possible routes to the limitation of debt capacity constraint and liquidity constraint;
- partially able to retain risk—if featured in square A or C; it requires a similar approach as in the case of the inability to retain risk.
However, a company may also retain risk unconsciously, facing the negative outcomes of risk that was not recognized in the process of risk identification or was wrongly assessed with reference to its frequency and/or severity. Accordingly, our model may also support the overall company’s risk self-resistance, with the recommendations as outlined above. Our conceptual model may also enhance a greater awareness of the possible scale of the ultimate consequences of risk, in terms of the growth of a bankruptcy threat.
4. Empirical Illustration
4.1. Research Design and Method and Sample
The empirical illustration presented in this section aims at examining the frequency of the four patterns of risk self-resistance, as distinguished in our conceptual model and framed in Figure 1, with reference to the market data obtained for a sample of companies. In particular, we aim at answering two questions:
Question 1.
Which pattern of risk self-resistance is most common?
Question 2.
Are there any significant differences in the pattern of risk self-resistance in a cross-sector dimension?
The first question addresses the frequency of each pattern of risk self-resistance. On a conceptual level, we expect that patterns featured in squares A and B are less common due to high levels of cash (as cash holdings are costly for a company). The second question addresses the possible existence of cross-sector differences in the frequency of each state of risk self-resistance. Previous works controlled the industry effect on cash holdings (e.g., Berger and Ofek 1995; Subramaniam et al. 2011) and capital structure (e.g., Michaelas et al. 1999; Hall et al. 2000).
The turn from the conceptual model, presented in Figure 1, to empirical investigation requires a definition of proxies that will clearly address the assessment of (a) debt capacity constraint, (b) liquidity constraint, and (c) the benchmarks that distinguish between high or low constraints.
Debt capacity constraint refers to the level of leverage, which is commonly measured by the debt to equity ratio (consistent with Miller and Modigliani proposition). However, similar information could be obtained by the analysis of the debt to assets ratio. Many of the previous empirical works used both ratios to capture the financial leverage effect in various contexts (Kaplan and Zingales 1997; Lamont et al. 2001; Chen et al. 2009).
The liquidity constraint is assessed as low if a company is distinguished by financial liquidity. A common measure of a company’s financial liquidity examined in previous empirical works is the relationship of current assets to current liabilities or cash and cash equivalents to current liabilities. However, in the studies that refer to the motives behind cash holdings (in this precautionary motive), other measures are being examined. For example, cash holdings to assets were examined by Subramaniam et al. (2011); Opler et al. (1999); Almeida et al. (2004); Harford et al. (2008); Weidemann (2018).
With reference to previous empirical works, our empirical illustration examines:
- debt to total assets as a proxy for the debt capacity constraint; high debt to assets denotes high leverage and high debt capacity constraint;
- cash and cash equivalents to total assets as a proxy for the liquidity constraint; high cash and cash equivalents to total assets denotes a low liquidity constraint and high cash holdings that could be used in a precautionary (buffering) function.
Finally, both proxies (debt to assets and cash and cash equivalents to assets) are scaled similarly and range between 0 (no debt, no cash holdings) to 1 (high debt, high cash holdings)2. This enables a clear classification of each observation to a given pattern and simplifies the graphical illustration of empirical results with reference to the conceptual model outlined in Figure 1.
As the benchmarks, we assumed the mean ratios for all observations in the sample. This approach is motivated by the common use of means of the given financial ratios as the benchmarks of companies’ performance (e.g., in official public statistics). In a cross-sector dimension, this is relevant for the possible practical implementation of our conceptual proposal3.
4.2. Sample
In our empirical illustration, we use a sample of observations that were obtained from the Emerging Markets Information Service (EMIS)4 database for a five-year time span (2013–2017). To avoid a country effect, we used data for a single country—Poland. However, it is worth noting that the situation in Poland is often considered as representative for the region of Central and Eastern Europe (CEE). As a pioneer in the transition from a command to a market economy, Poland is currently the largest economy among all the CEE countries and has the sixth strongest market in the European Union. The Polish economy was the only one to have avoided recession during the global downturn of 2008 and it continues to perform strongly5.
To capture the cross-sector dimension, we used information on the main activity of companies (as denoted in the EMIS database), consistent with Polish industrial classification codes (PKD6), to distinguish between production, services, and trade. The EMIS database offers data that are consistent with the balance-sheet statement and these data were used to compute the proxies of the debt capacity constraint and liquidity constraint. From all obtainable observations (2500; 500 firms in each year) we finally selected and examined 2292. We removed from the sample the observations that were inconsistent with balance-sheet requirements (no balance between assets and liabilities) and the observations that reflected highly unusual levels of proxies that could not be reasonably explained (e.g., negative cash holdings or debt higher than total assets). We did not remove outlier observations, as in this study these are treated as important variations of the observable patterns of risk self-resistance.
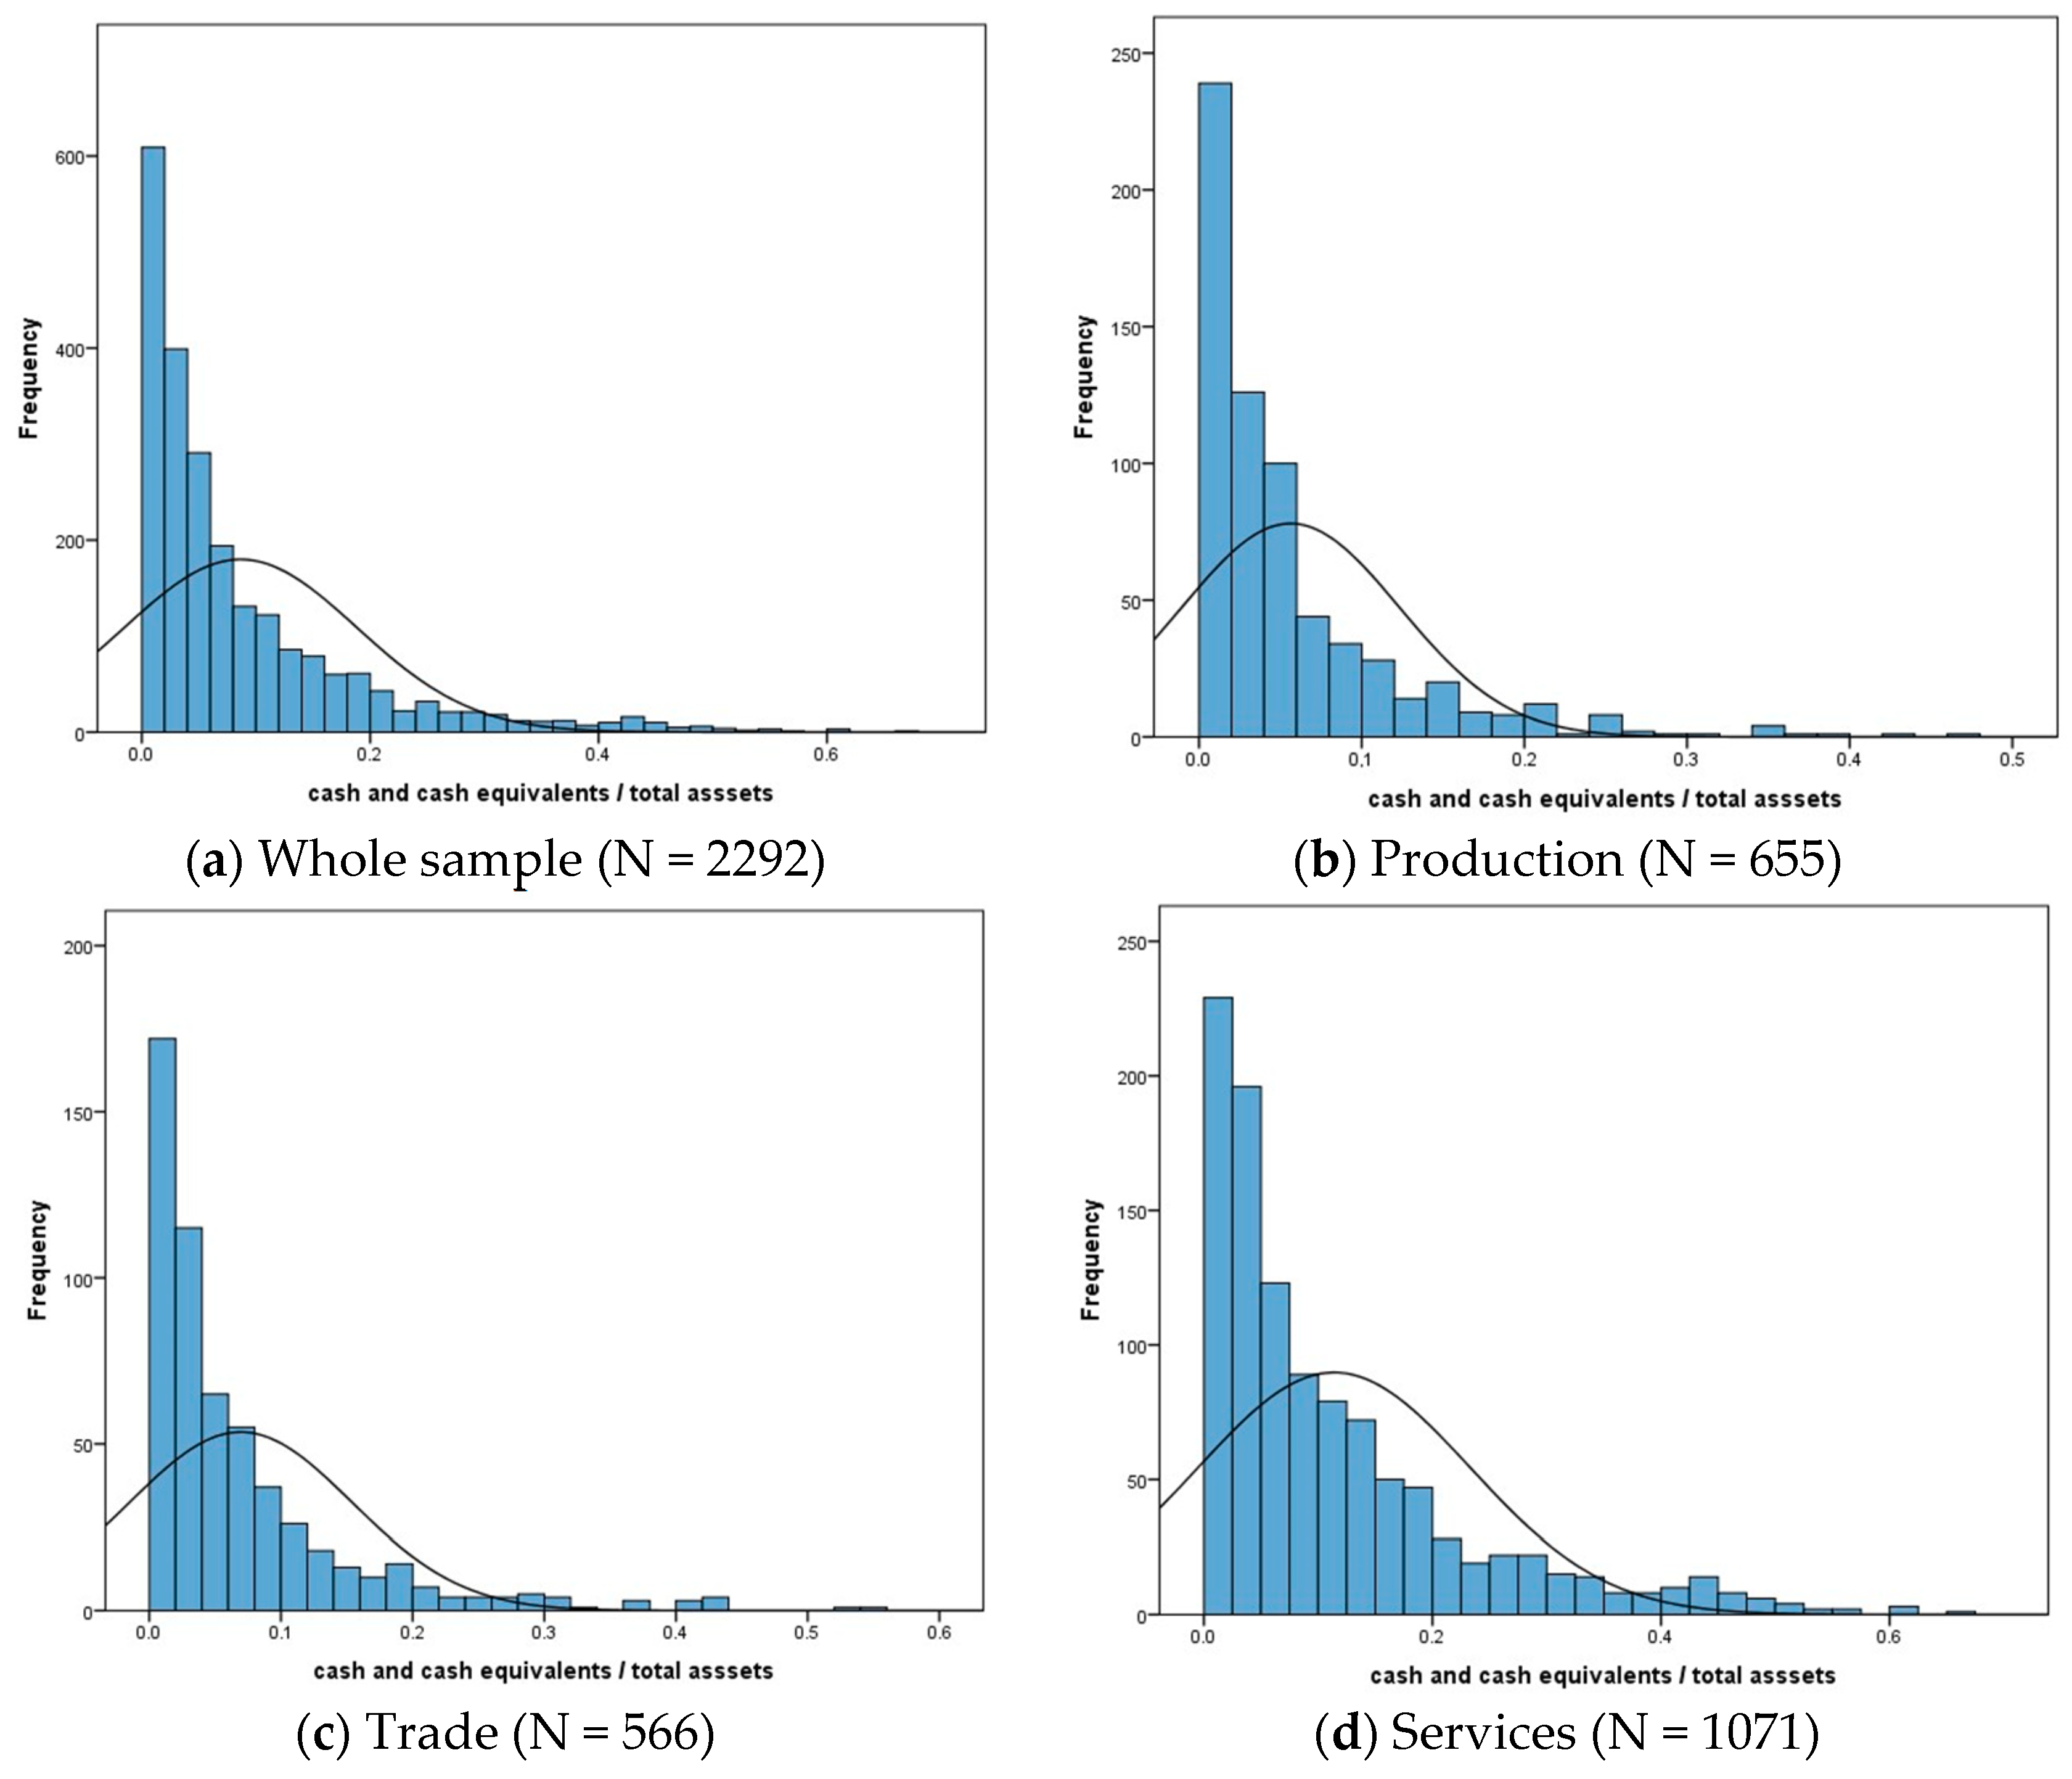
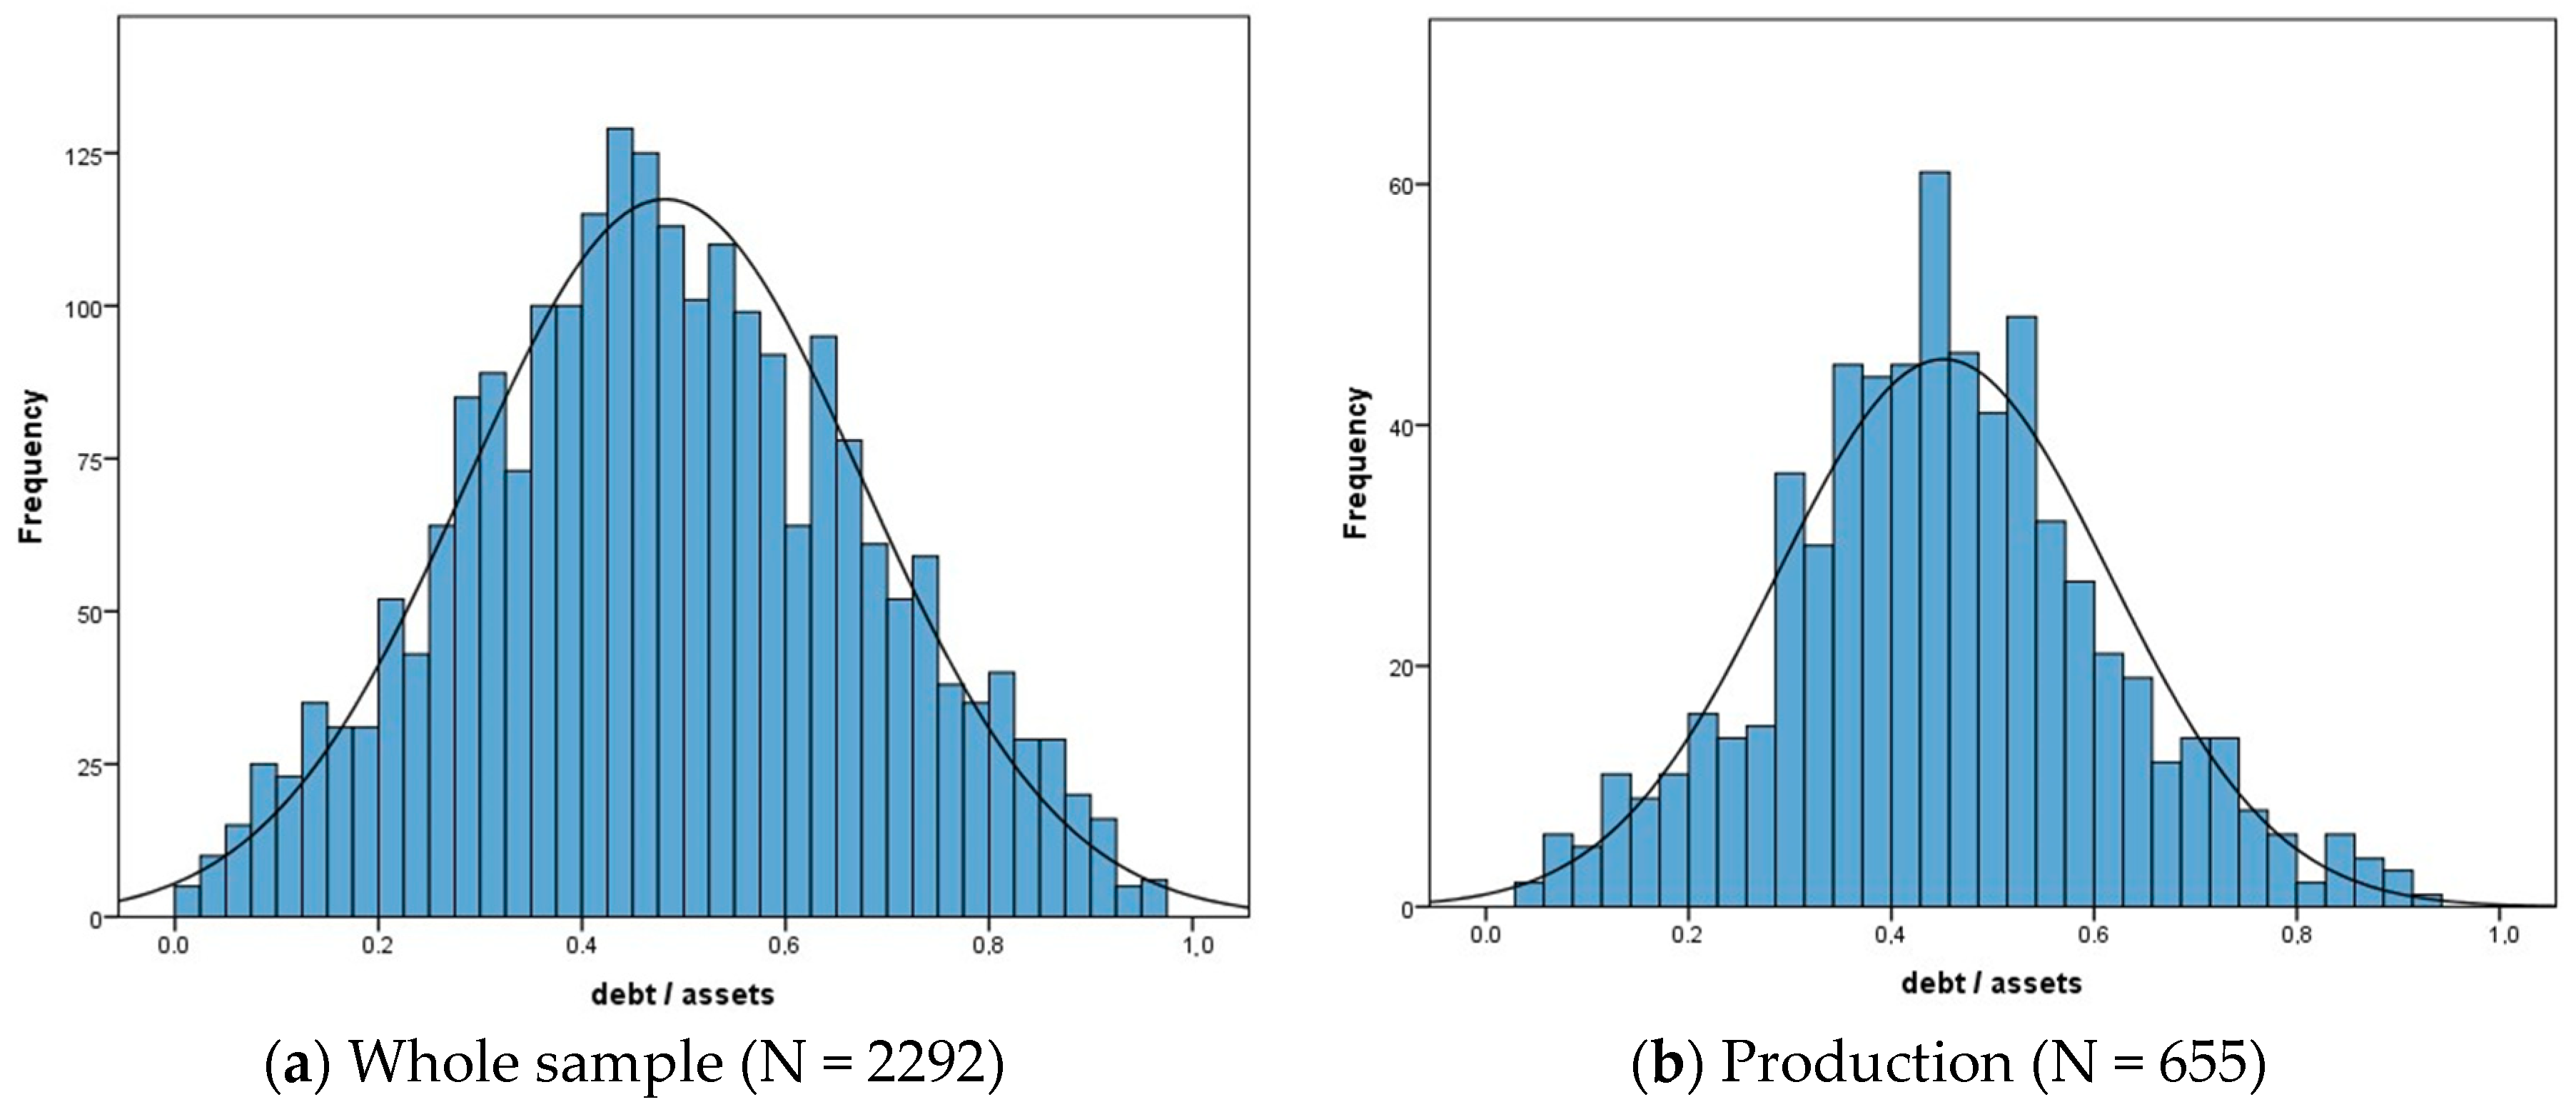
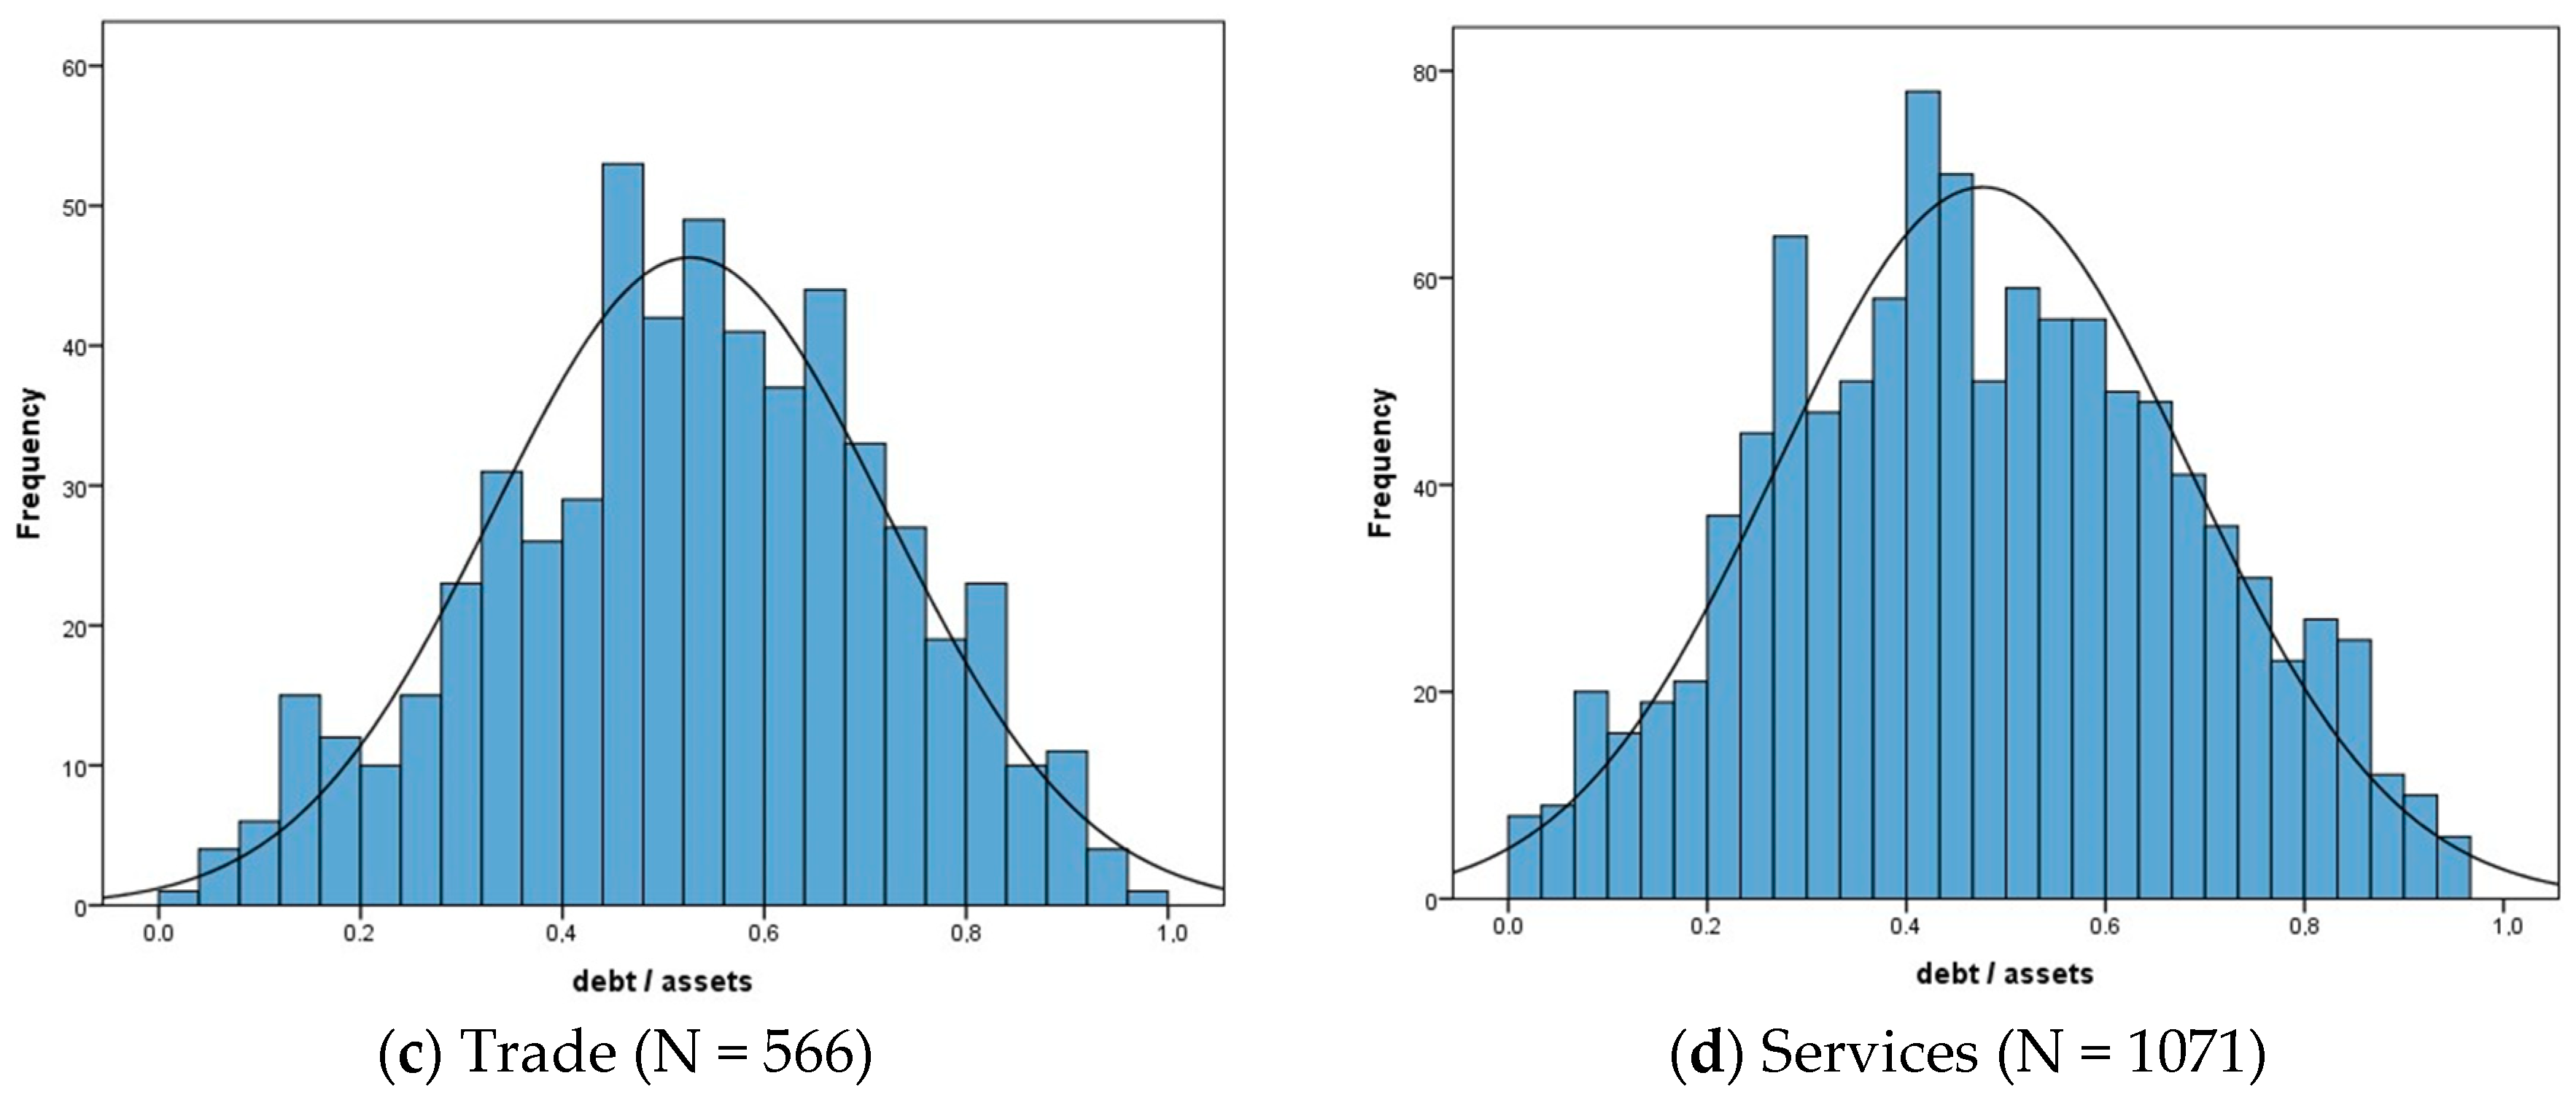
Descriptive statistics for both variables, liquidity constraint and debt capacity constraint, are presented in Table 1 and Table 2, respectively. Distribution plots for both variables are presented in Annex A and B. On average, in the analyzed sample, companies hold c.a. 8% of assets in the form of cash and cash equivalents, with the highest average cash holdings in services (c.a. 11%) and the lowest in production (c.a. 5%). However, the levels of cash and cash equivalents holdings, on average, highly deviated from the mean values (both in the entire sample and in the sectors). The distribution plots (Appendix A) of liquidity constraints are right-skewed, which means that the sample is dominated by companies with relatively high liquidity constraints. A debt to assets ratio in the observed sample is 48% on average, which indicates that nearly half of companies’ assets were financed with debt. The highest debt to assets ratio, on average, is in trade (c.a. 53%), and the lowest in production (c.a. 45%). The distribution plots (Appendix B) indicate the normal distributions.
4.3. Findings and Discussion
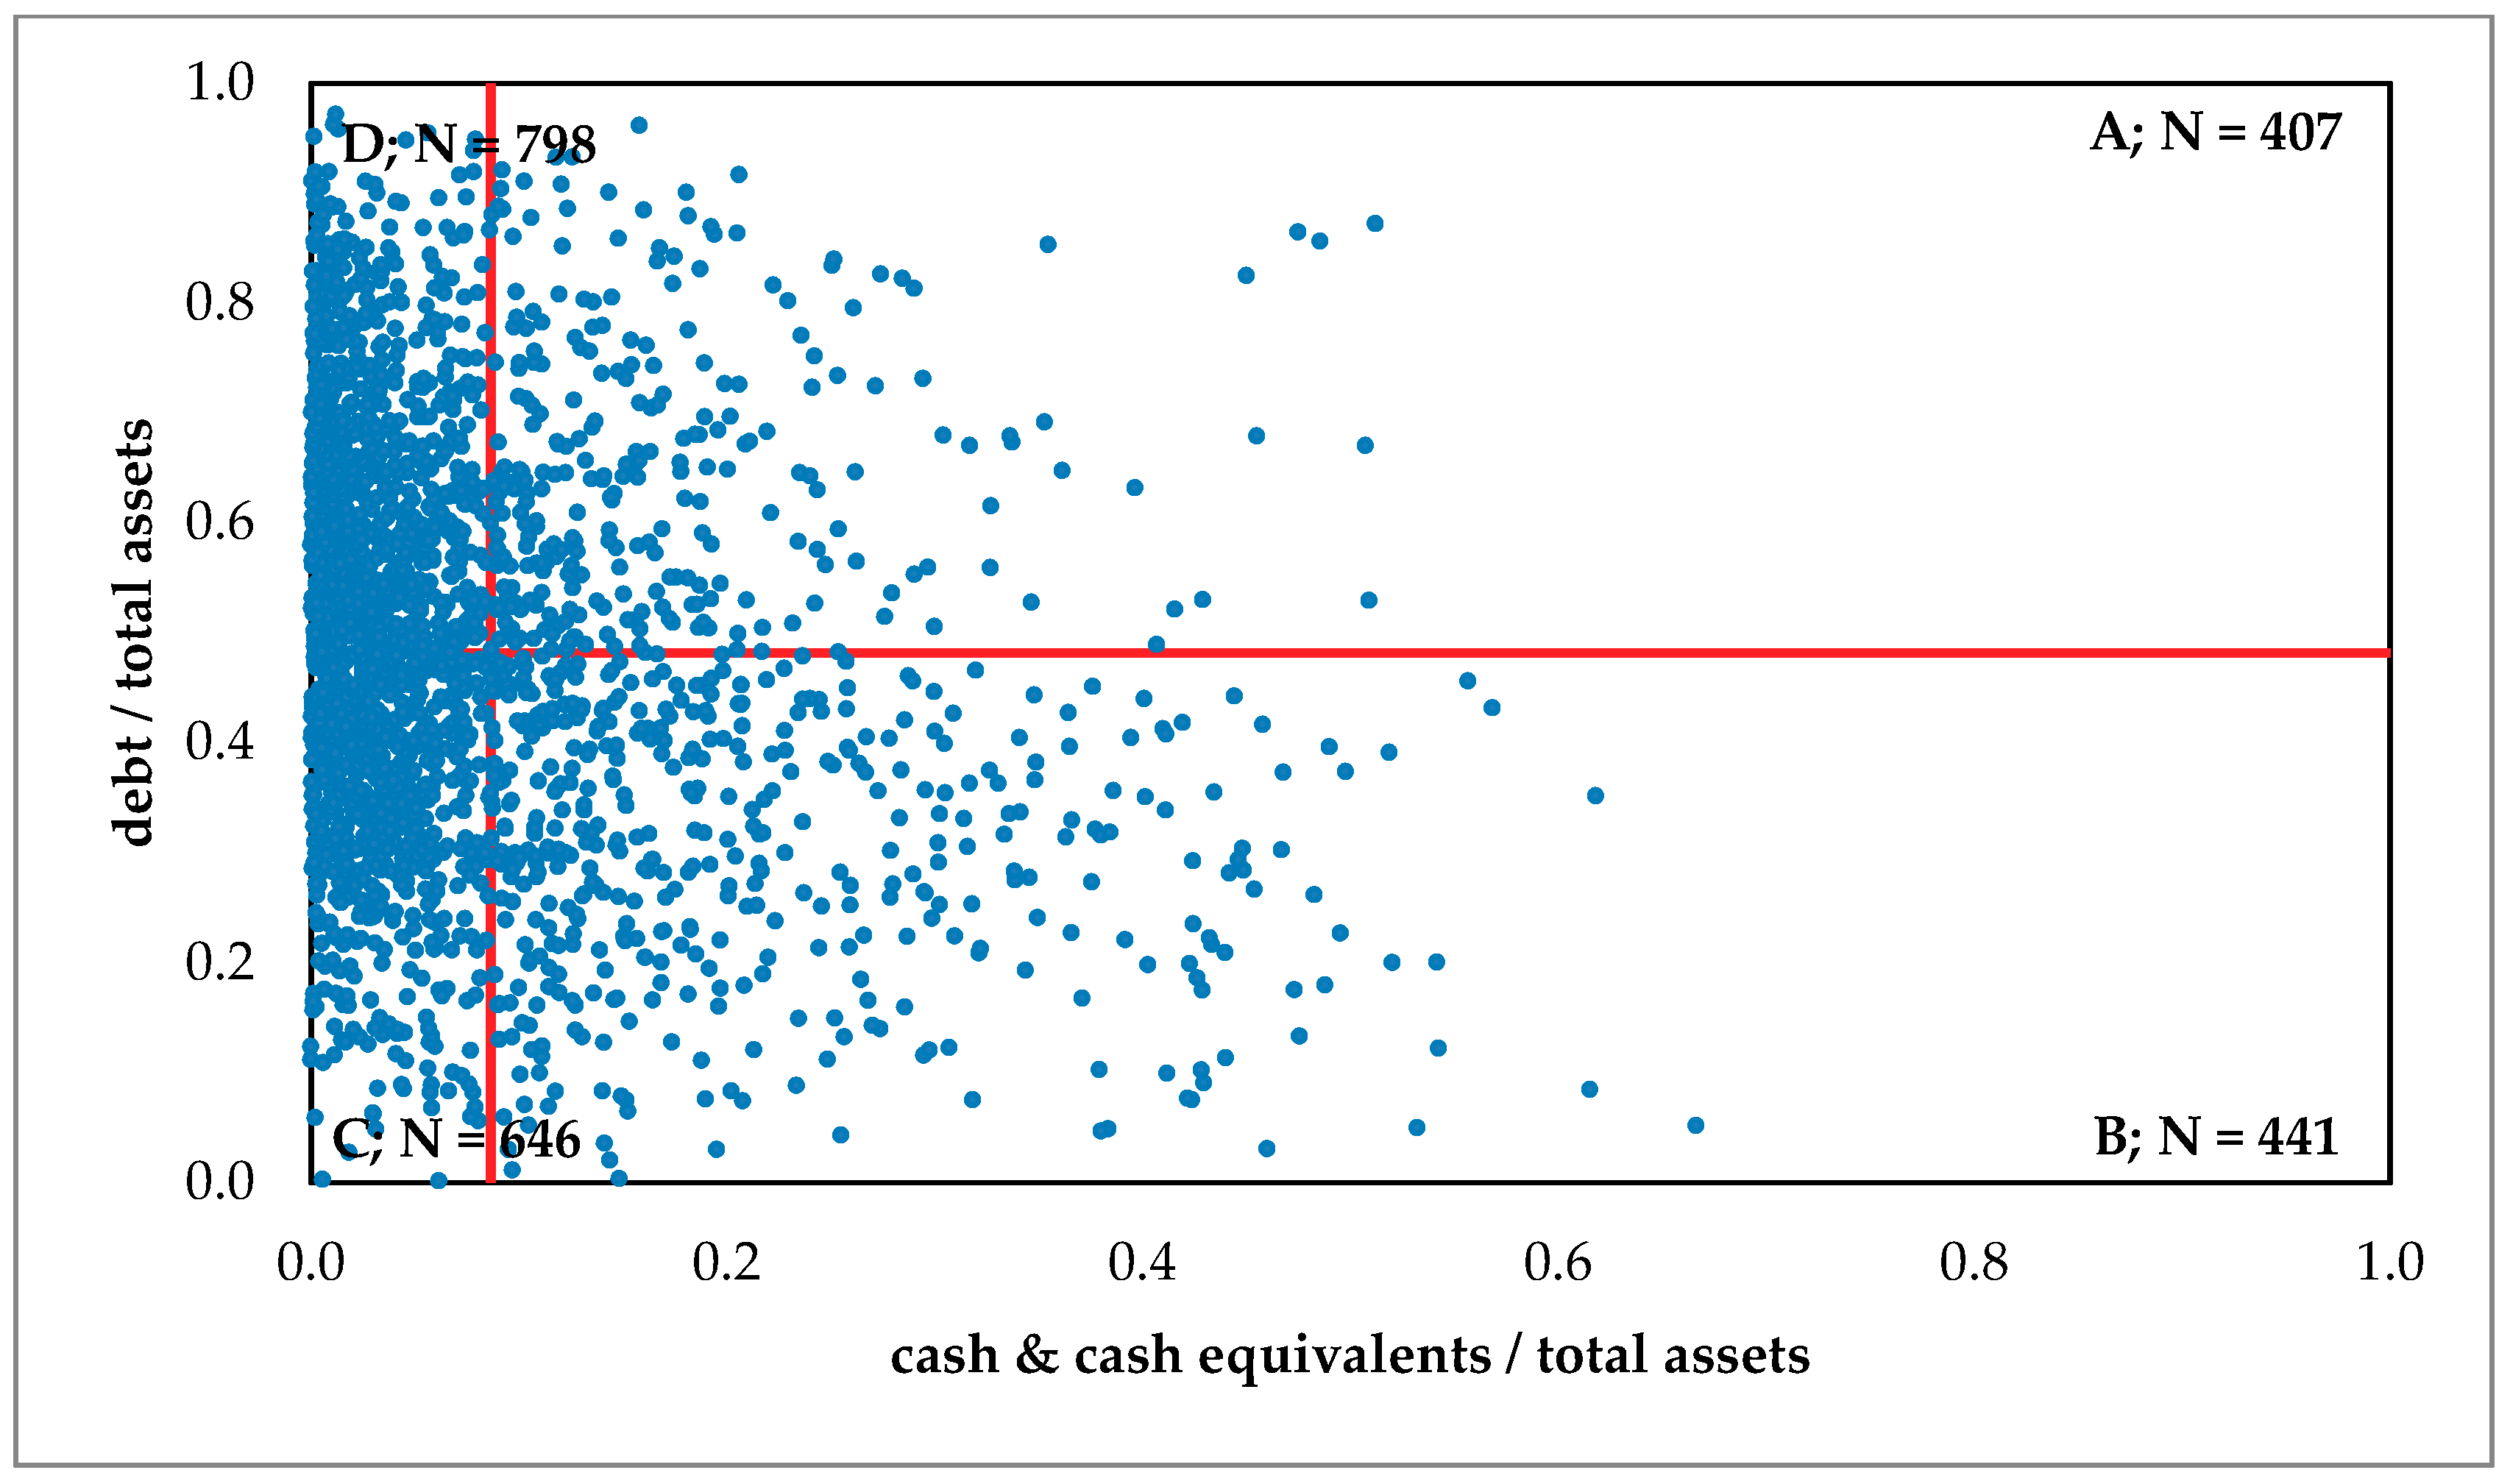
Data presented in Figure 2 shed some light on which pattern of risk self-resistance is most common. The data demonstrate that the majority of companies fall into the pattern of limited self-resistance to risk outcomes. Out of 2292 observations, 798 (c.a. 35%) are captured in pattern D, with the leverage higher than on average and the cash holdings lower than on average. Another common situation is pattern C, with self-resistance to risk driven by the accessibility of external funds (which captures companies of leverage lower than on average and cash holdings lower than on average). A relatively lower percentage of observations fall into pattern A (self-resistance to risk outcomes driven by internal financing) or pattern B (with low debt capacity and liquidity constraints). However, data presented in Figure 2 indicate that numerous outlier observations exist, in particular within the strategies of cash holdings.
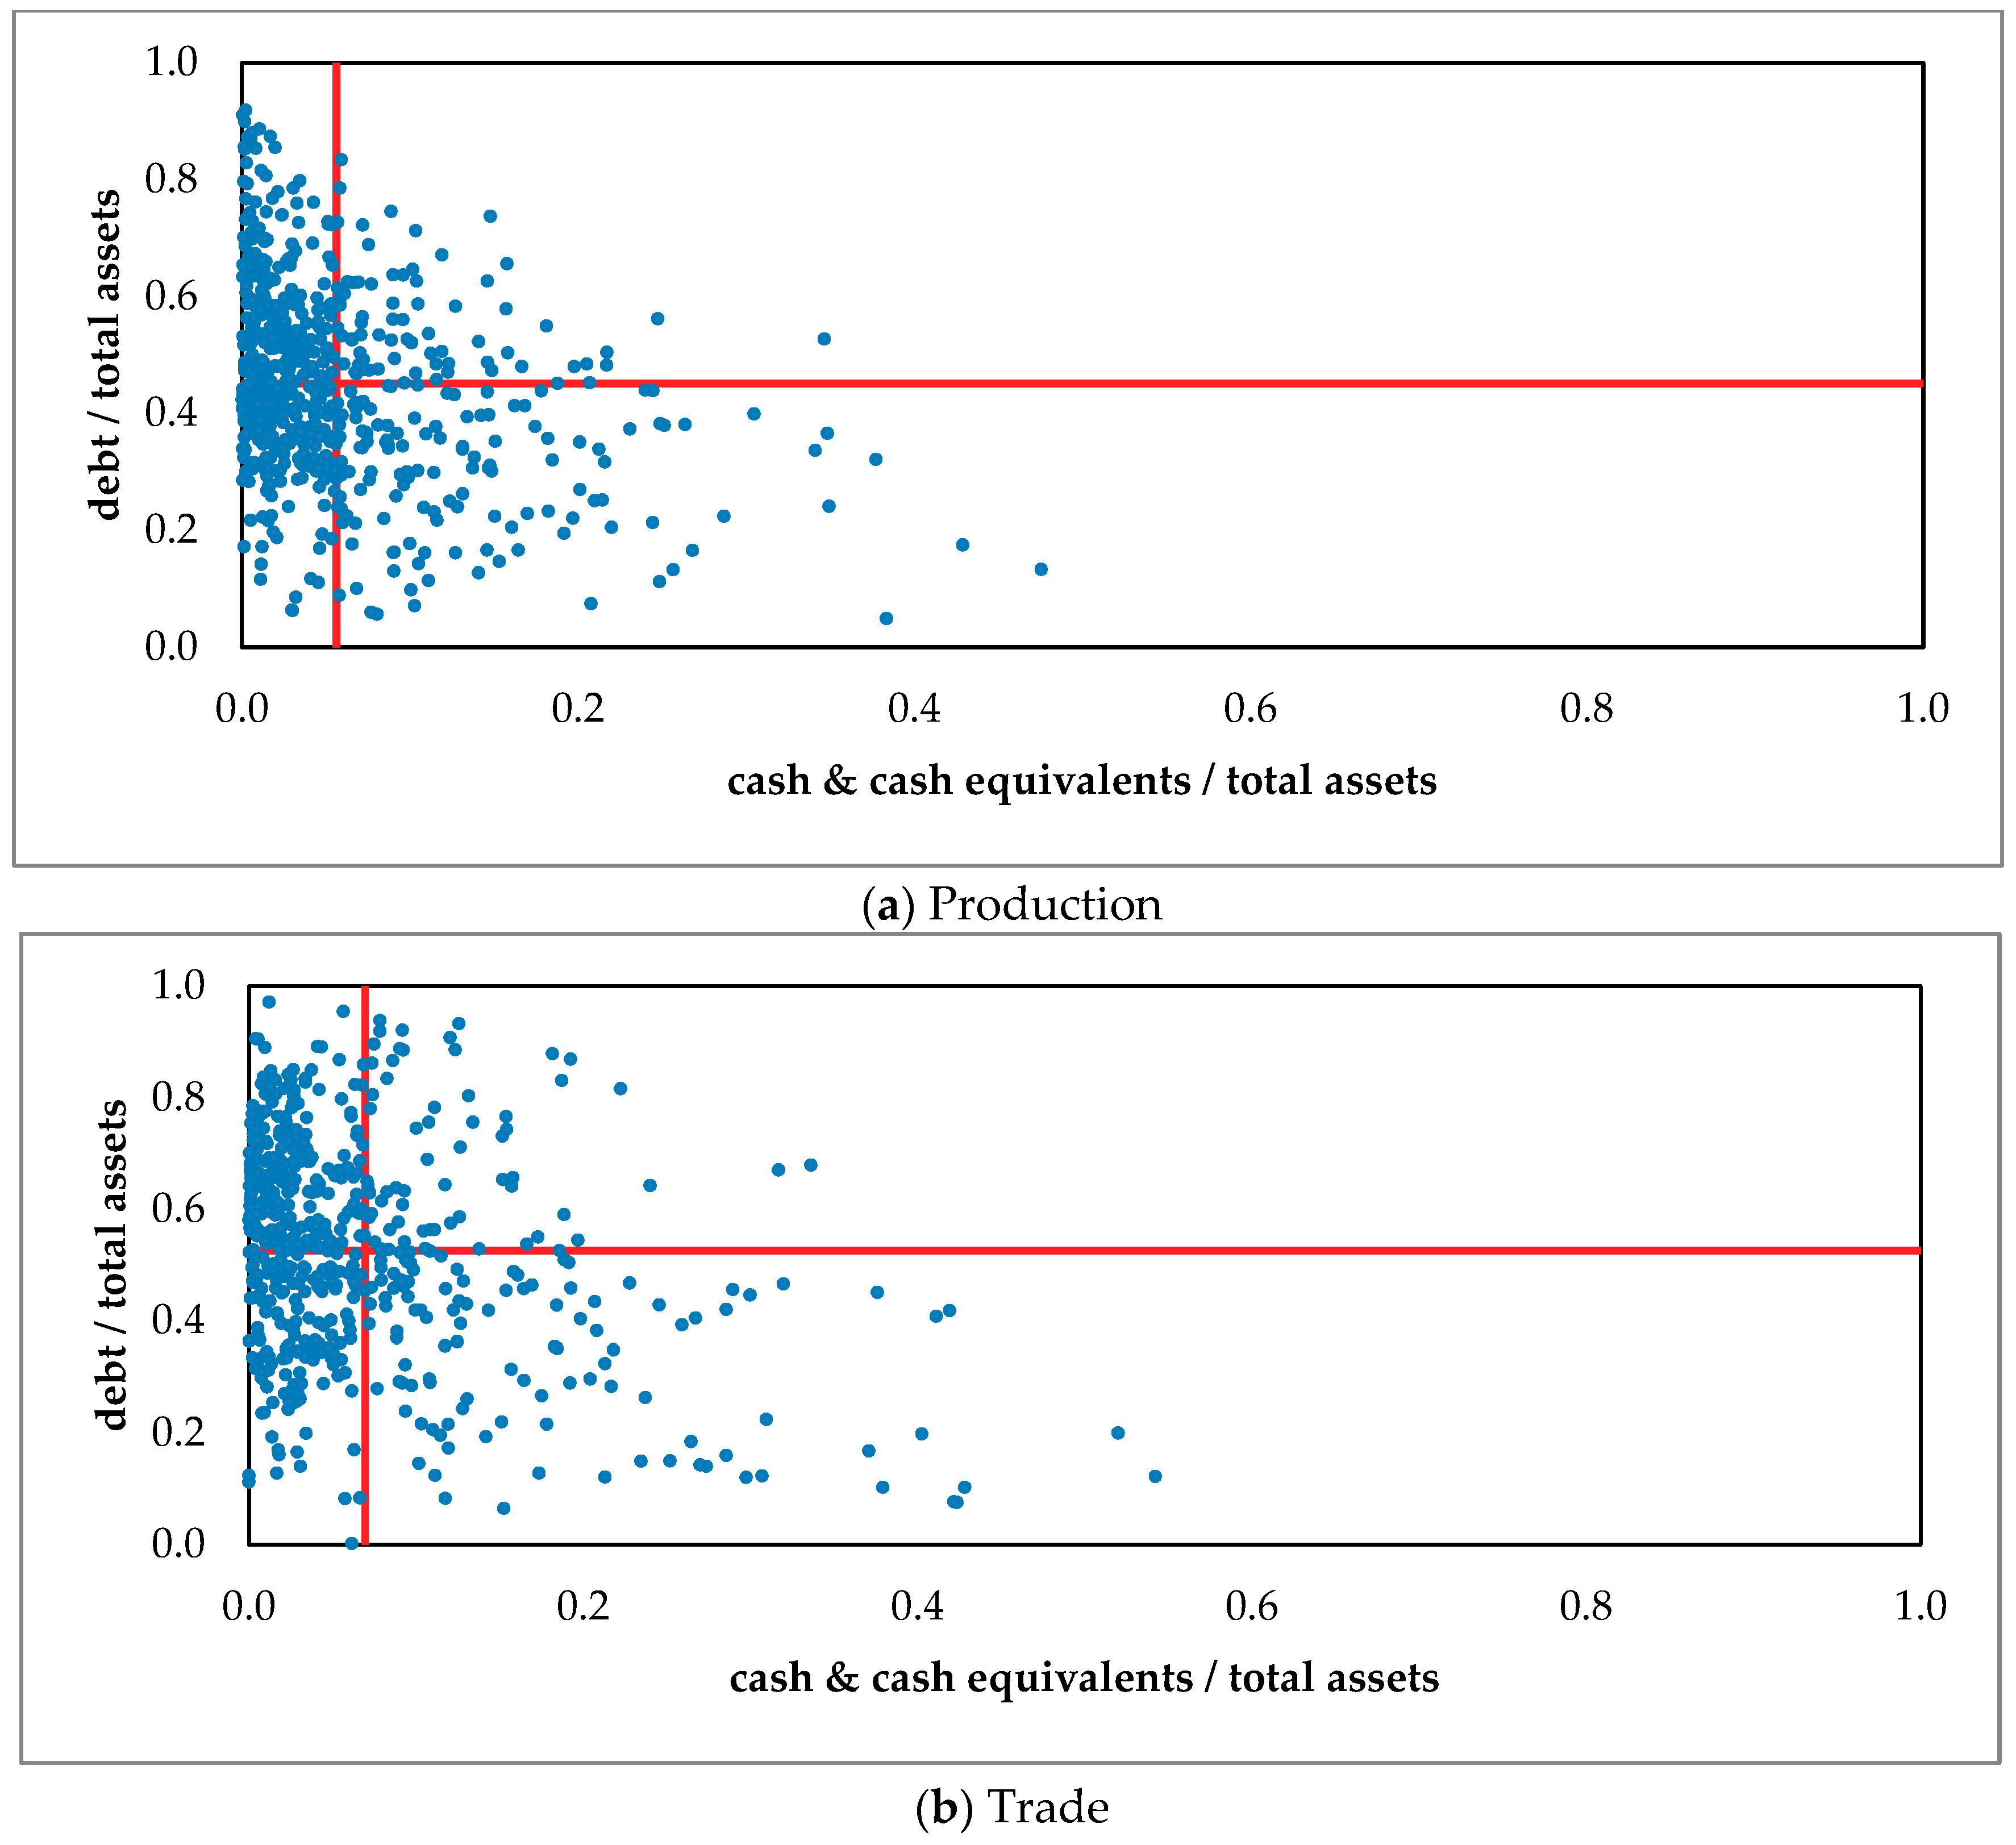
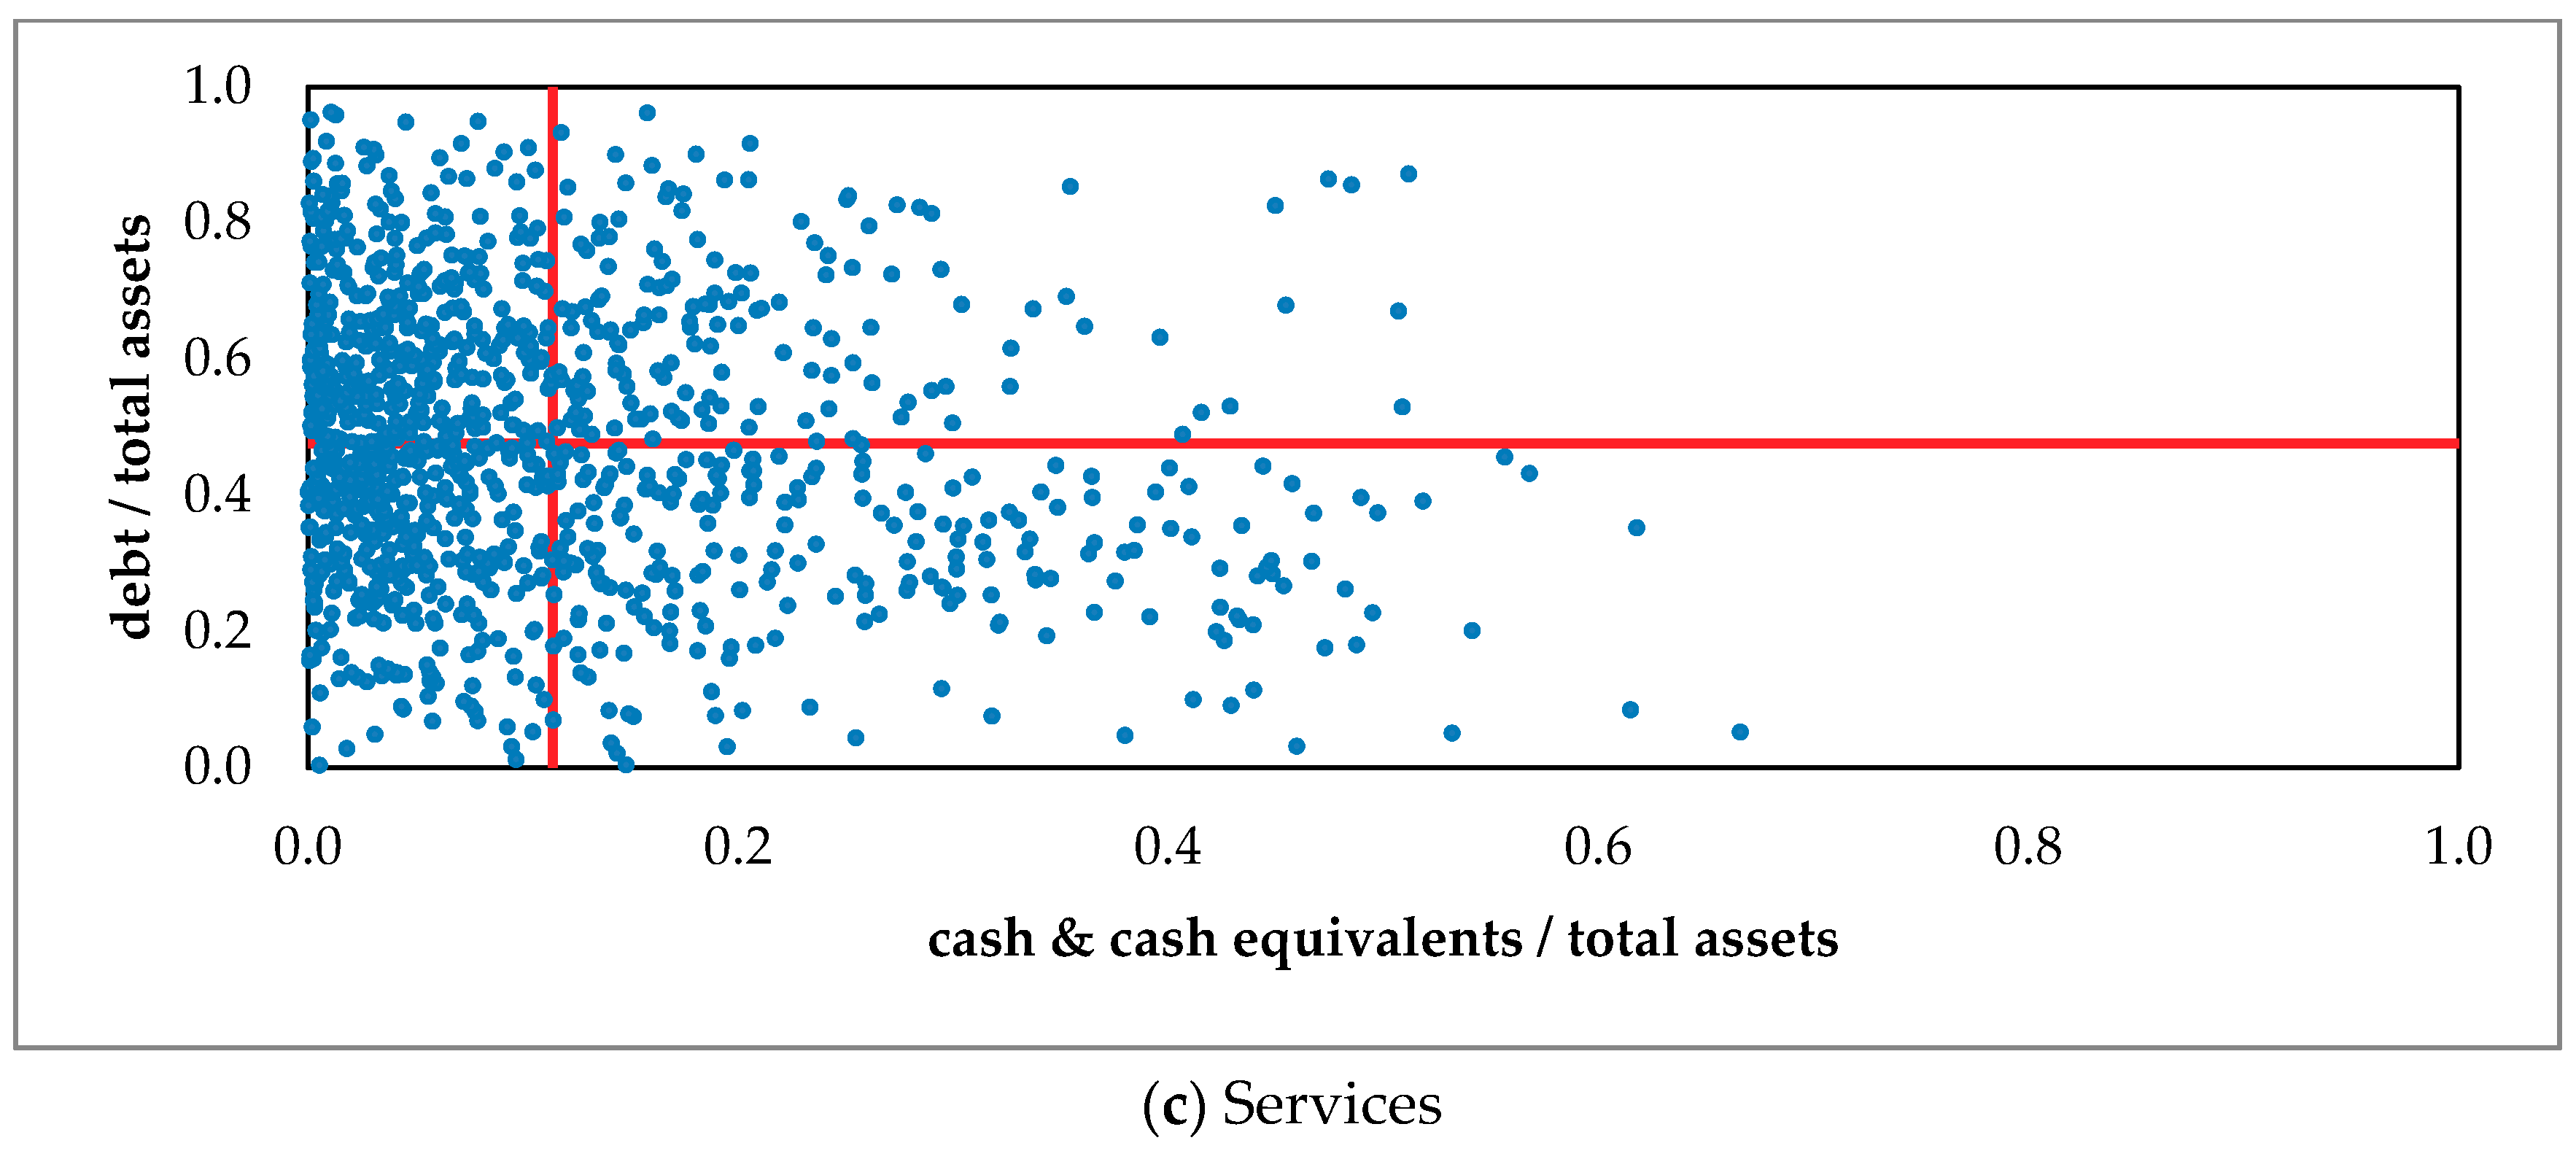
The differences between sectors are graphically presented in Figure 3, with reference to production (panel a), trade (panel b), and services (panel c). In addition, Table 3 presents the results for the analyzed sample broken by patterns of risk self-resistance and sectors (production, trade or services). Detailed data are presented in Table 3, which is a contingency table of the observed pattern and sector.
In order to answer the second research question, we evaluated the statistical significance of the interdependencies between a sector and the pattern of risk self-resistance. The statistical significance of these interdependencies was confirmed by Pearson’s chi-squared test (p < 0.001); although, it was relatively weak (statistically significant V-Cramer coefficient 0.338). In a cross-sector dimension, the results indicate that companies operating in production were captured mostly in pattern D (low self-resistance, with a high liquidity and high debt capacity constraint). However, companies operating in services were captured mostly in pattern C, with externally driven risk self-resistance related to a high liquidity constraint but low debt capacity constraint). In trade, an almost equal number of observations were captured in pattern D (low self-resistance) and pattern A (internally driven self-resistance, with a low liquidity constraint but high debt capacity constraint). Pattern B, highlighting the high level of risk self-resistance was observed most commonly in services. Detailed data are provided in Table 3.
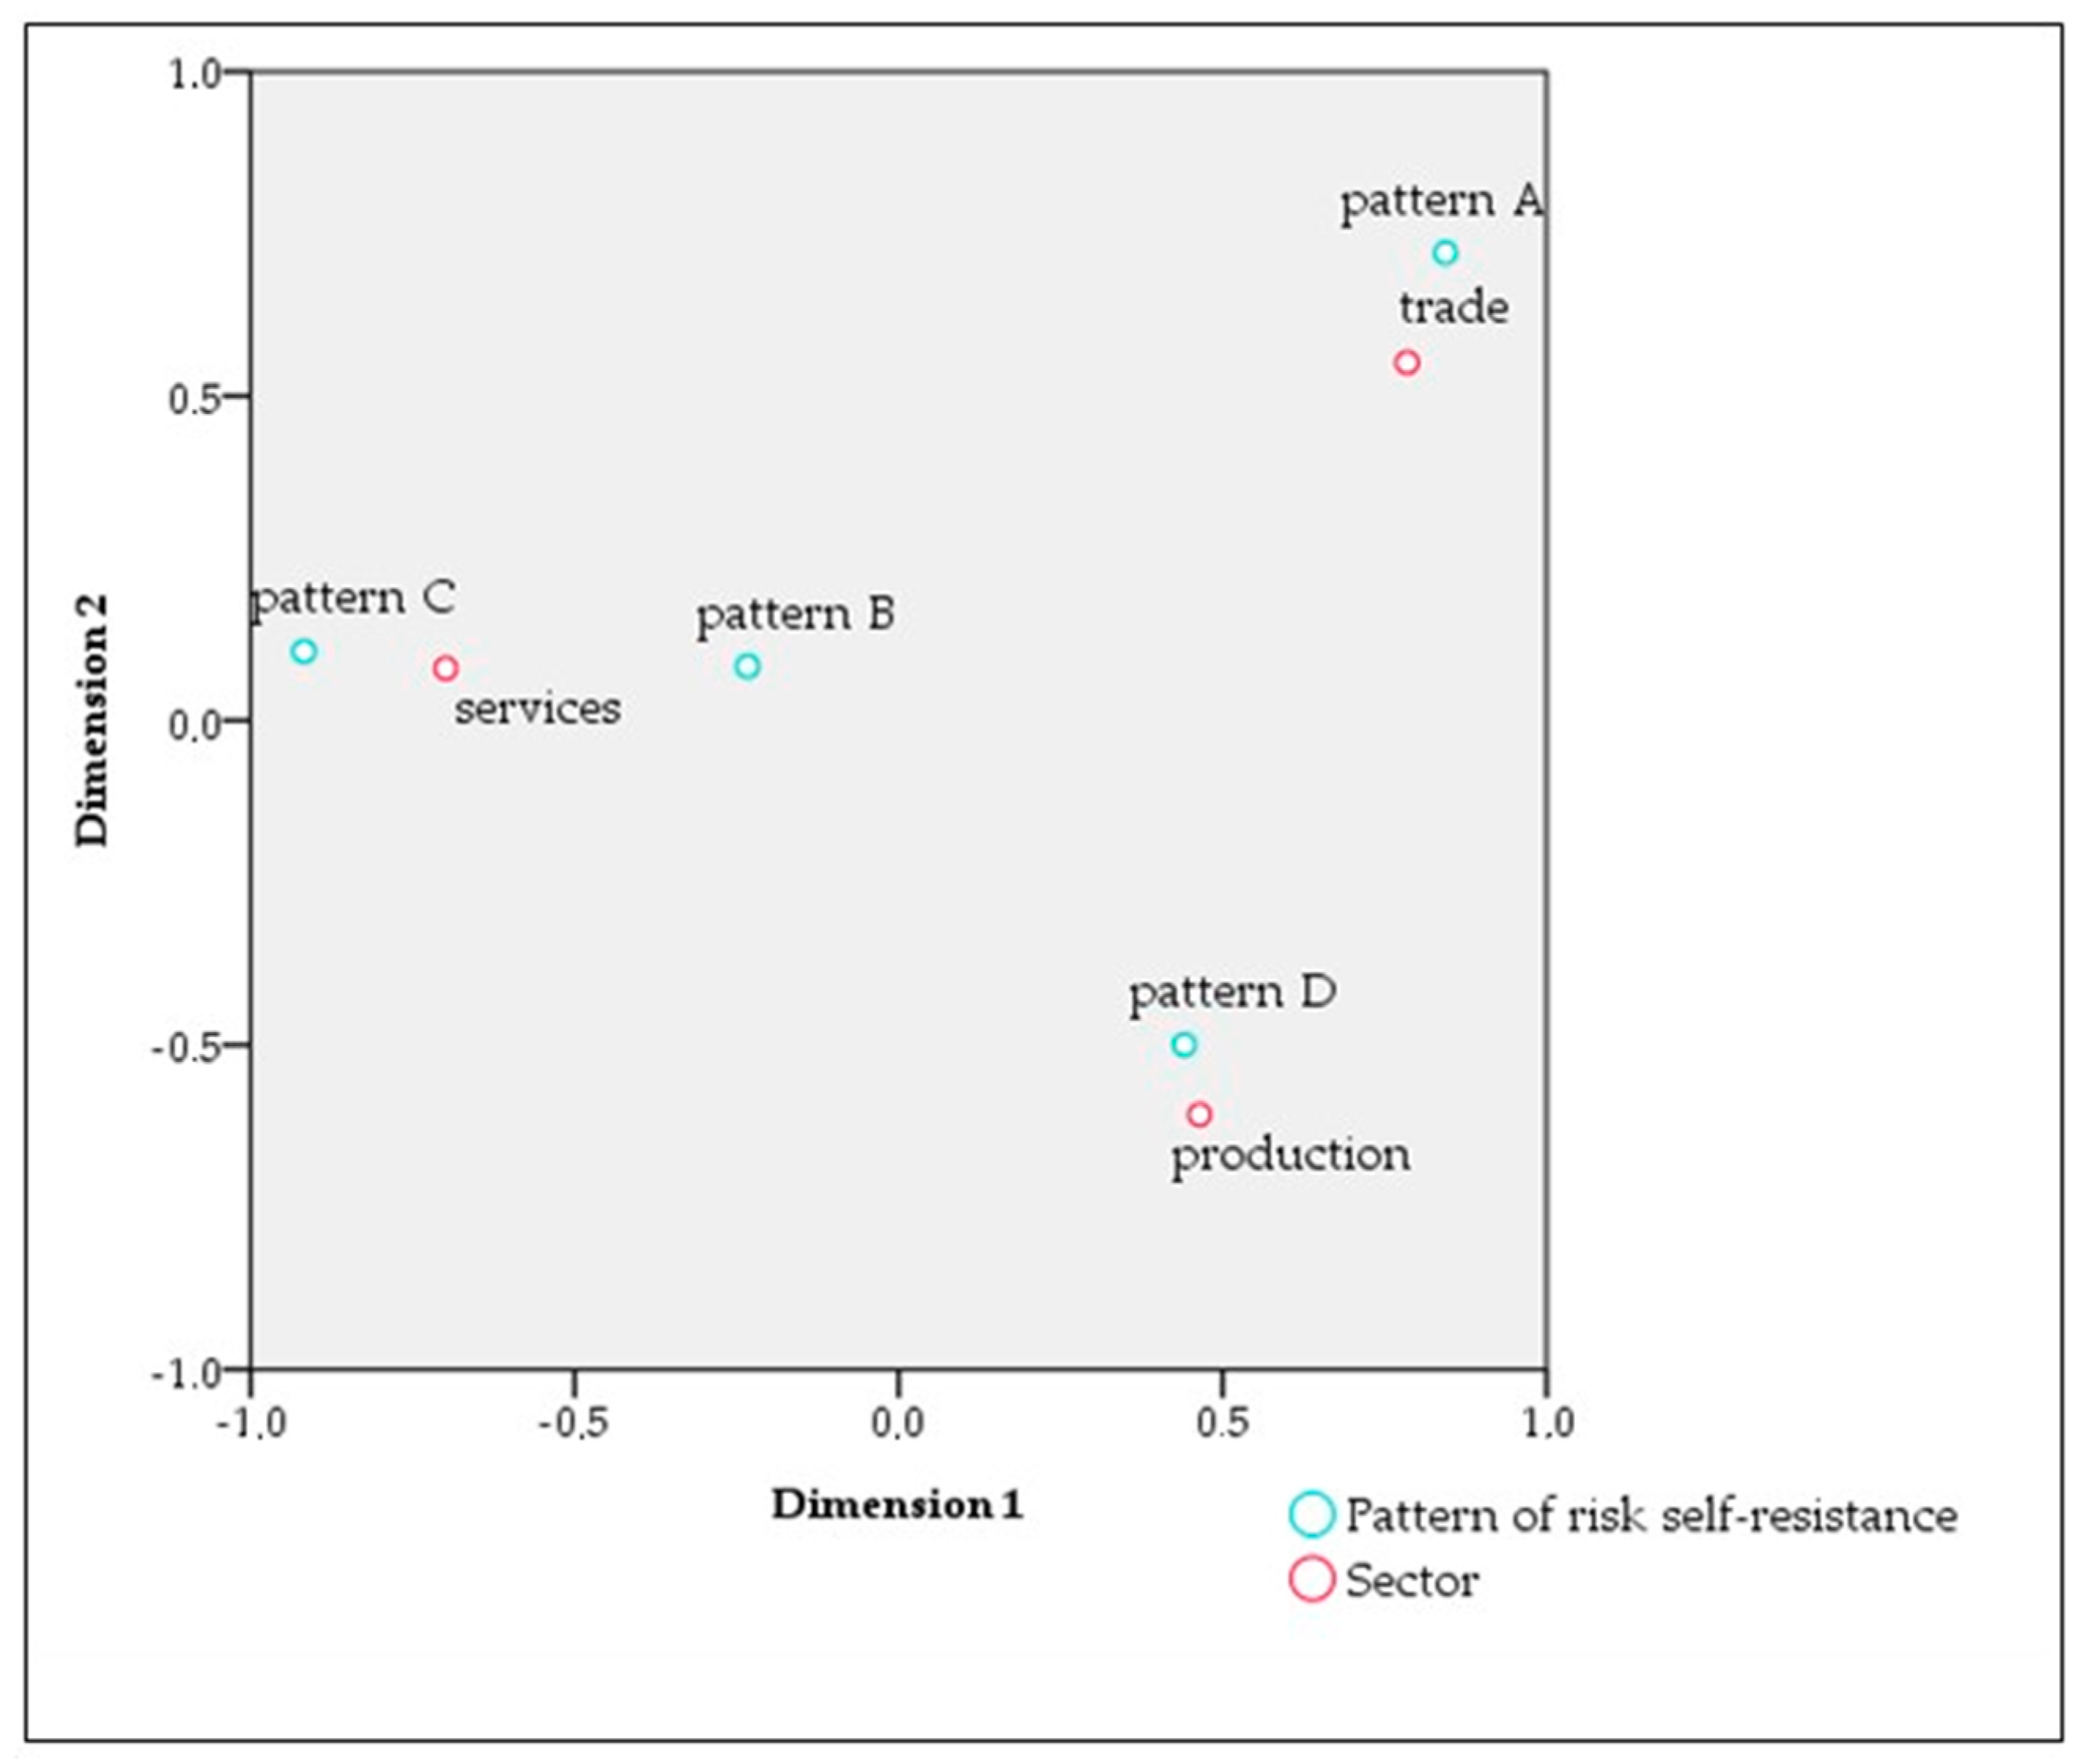
The statistical analysis of sector relevance was further supported by the correspondence analysis, which is based on the associations between the observed categories (dimensions) of variables (Hauser and Koppelman 1979). The results of correspondence analysis support perceptual mapping. This technique allows the visualization of the interdependencies between the considered categories in a two-dimensional aspect. On the perceptual map, the stronger interdependencies of categories are visualized by their closer position on the chart (and vice versa). Figure 4 is the perceptual map (as a result of correspondence analysis) for two categories, sector and pattern of risk self-resistance. There is no clear correspondence of any of the considered sectors to pattern B (with the best financial self-preparedness for risk outcomes). However, there is an observable correspondence of other patterns and sectors; production adheres to pattern D (low self-resistance), trade—to pattern A (internally-driven self-resistance), and services—to pattern C (externally driven self-resistance).
We additionally incorporated non-parametric analysis of variance (ANOVA) (Kruskal–Wallis test) for a deeper analysis of the observed interdependencies between the sector and pattern of risk self-resistance. In the analysis, we examined the impact of the sector on the constraints framed in our model of patterns of risk self-resistance: (a) the liquidity constraint, as reflected by the ratio of cash and cash equivalents to total assets and (b) the debt capacity constraint, as reflected by the ratio of debt to total assets. We additionally revised the ratio of cash and cash equivalents to debt, to capture the combined impact of both constraints. The results obtained from the Kruskal–Wallis test, presented in Table 4, indicate that there are statistically significant differences between the sectors and mean values of liquidity and debt capacity constraints. In other words, sectors differ significantly with the mean values of constraints (as indicated by post-hoc tests). The average values of liquidity constraint are statistically significantly higher in the trade sector, in comparison to production and services. We also observed statistically significant differences between the services and production sectors. A similar situation applies to the debt capacity constraint—there are statistically significant differences between mean values of debt capacity constraint in each of the considered sectors. The result of the Kruskal–Wallis test also confirmed that there are significant differences in the combined impact of both constraints between sectors. However, for the combined impact, there is no statistically significant difference between the production and services sectors.
5. Conclusions
The importance and benefits of contemporary risk management (in its holistic dimension) are explainable with reference to the bankruptcy threat through the analysis of the constraints that might be imposed by the financially measurable negative risk outcomes. In most of the studies, the negative risk outcomes in their financial dimension (impact) are associated with undesired cash flow volatility. This volatility could be at least partially prevented by the proper implementation of a risk management process, followed by an intentional selection of appropriate risk management methods. In this paper, we have focused, in particular, on the conditions that are relevant for the choice between risk financing tools: insurance and retention of risk. Traditionally, the decisive model (framed within a risk map) considers the frequency of risk occurrence (probability) and the severity of risk outcomes (impact). In this study, however, we advocate the extension of this approach, with reference to a company’s ability of risk self-resistance. Our conceptual model, framed in Figure 1, considers four patterns of risk self-resistance that are determined by a company’s debt capacity constraints and liquidity constraints.
By the incorporation of this conceptual model to the selection of risk management techniques (transfer and retention), a company may better understand the impact of its existing limitations on the ability to overcome the volatility of cash flows in the aftermath of risk occurrence. In other words, the model may practically support a risk management process, within the composition of risk management methods, at the micro-level. A single company may use the proposed framework (debt capacity and liquidity constraint) to evaluate its risk-self resistance position. It may enhance a better design of protection, within the decisions on the choice between retention or risk transfer, or the rationale behind mixing these methods in adequate proportions. Our conceptual model is supported by a simple empirical illustration which addressed two research questions. The first research question asked about the frequency of the conceptually identified patterns of risk self-resistance. With reference to the mean values of ratios that were implemented as proxies for debt capacity or liquidity constraint, the data has shown that the most common pattern is related to low risk-self resistance or externally driven risk-self resistance. It indicates that most of the observed companies have relatively low cash reserves and it is often accompanied by a high debt capacity constraint (due to high leverage). In such circumstances, the ability to retain the outcomes of risk is low.
The second research question referred to the interdependencies between a company’s sector (production, trade, or services) and the pattern of risk self-resistance. In the production sector, low self-resistance was most common, whereas in services it was externally driven. Different patterns were observed in trade—with almost equal numbers of observations falling into low and internally driven self-resistance. The observed cross-sector differences were statistically significant. Thus, it could be concluded that a priori some sectors should rely more on risk transfer than on risk retention.
An obvious limitation of our study is the sample (Polish companies). Thus, further inquiries should be made to confirm the possible impact of country effect, in addition to sector effect. The concentration of observations in two patterns of self-resistance (low and externally driven) also suggests further research should be conducted that will distinguish other relevant dimensions in the proposed conceptual model.
Author Contributions
Conceptualization, M.W.; methodology, M.W. and J.T.; validation, J.T.; formal analysis, M.W. and J.T.; investigation, J.B. and J.T.; resources, J.B.; data curation, M.W. and J.B.; writing—original draft preparation M.W.; writing—review and editing, M.W. and J.B.; visualization, M.W. and J.T.; supervision, M.W.; project administration, M.W.
Funding
This research received no external funding.
Conflicts of Interest
The authors declare no conflict of interest.
Appendix A
Figure A1.
Distribution plots for liquidity constraints (Cash and cash equivalents to assets).

Appendix B
Figure A2.
Distribution plots for debt capacity constraint (debt to assets).


References
- Acharya, Viral V., Heitor Almeida, and Murillo Campello. 2007. Is cash negative debt? A hedging perspective on corporate financial policies. Journal of Financial Intermediation 16: 515–54. [Google Scholar] [CrossRef]
- Almeida, Heitor, Murillo Campello, and Michael S. Weisbach. 2004. The cash flow sensitivity of cash. Journal of Finance 59: 1777–804. [Google Scholar] [CrossRef]
- Aziz, Adnan, and Humayon A. Dar. 2006. Predicting corporate bankruptcy: Where we stand? Corporate Governance 6: 18–33. [Google Scholar] [CrossRef]
- Berger, Philip, and Eli Ofek. 1995. Diversification’s effect on firm value. Journal of Financial Economics 37: 39–65. [Google Scholar] [CrossRef]
- Bromiley, Philip, Michael McShane, Anil Nair, and Elzotbek Rustambekov. 2015. Enterprise Risk Management: Review, Critique, and Research Directions. Long Range Planning 48: 265–76. [Google Scholar] [CrossRef]
- Chen, Yenn-Ru, Yu-Lin Huang, and Chun-Nan Chen. 2009. Financing constraints, ownership control, and cross-border M&As: Evidence from nine east Asian economies. Corporate Governance: An International Review 17: 665–80. [Google Scholar] [CrossRef]
- Chen, Yangyang, Paul Y. Dou, S. Ghon Rhee, Cameron Truong, and Madhu Veeraraghavan. 2015. National culture and corporate cash holdings around the world. Journal of Banking and Finance 50: 1–18. [Google Scholar] [CrossRef]
- Cox, Louis Anthony. 2008. What’s wrong with risk matrices. Risk Analysis 28: 497–512. [Google Scholar] [CrossRef]
- D’Mello, Ranjan, Sudha Krishnaswami, and Patrick J. Larkin. 2008. Determinants of corporate cash holdings: evidence from spin-offs. Journal of Banking and Finance 32: 1209–20. [Google Scholar] [CrossRef]
- Daily, Catherine M. 1994. Bankruptcy in Strategic Studies: Past and Promise. Journal of Management 20: 263–95. [Google Scholar] [CrossRef]
- Demonier, Gladyson, Jose Elias Feres de Almeida, and Patricia Maria Bortolon. 2015. The impact of financial constraints on accounting conservatism. Review of Business Management 17: 1246–78. [Google Scholar] [CrossRef]
- Denis, David J., and Velerij Sibilkov. 2010. Financial constraints, investment, and the value of cash holdings. Review of Financial Studies 23: 247–69. [Google Scholar] [CrossRef]
- Dickinson, Gerry. 2001. Enterprise Risk Management: Its Origins and Conceptual Foundation. The Geneva Papers on Risk and Insurance. Issues and Practice 26: 360–66. Available online: https://www.jstor.org/stable/41952578 (accessed on 6 October 2018). [CrossRef]
- Dionne, Georges. 2013. Risk Management: History, Definition, and Critique. Risk Management and Insurance Review 16: 147–66. [Google Scholar] [CrossRef]
- Dittmar, Amy, Jan Mahrt-Smith, and Henri Servaes. 2003. International corporate governance and corporate cash holdings. Journal of Financial Quantitative Analysis 38: 111–33. [Google Scholar] [CrossRef]
- Emerging Europe. n.d. Available online: https://emerging-europe.com/polish-economy-invest-gdp-growth/ (accessed on 12 November 2018).
- EMIS. n.d. Available online: https://www.emis.com/php/store/ (accessed on 12 November 2018).
- Faulkender, Michael, and Rong Wang. 2006. Corporate financial policy and the value of cash. Journal of Finance 61: 1957–90. [Google Scholar] [CrossRef]
- Fazzari, Steven M., Robert G. Hubbard, and Bruce C. Petersen. 1988. Financing constraints and corporate investment. Brooking Papers on Economic Activity 1: 141–95. Available online: https://www.brookings.edu/wp-content/uploads/1988/01/1988a_bpea_fazzari_hubbard_petersen_blinder_poterba.pdf (accessed on 30 September 2018). [CrossRef]
- Fresard, Laurent. 2010. Financial strength and product market behavior: The real effects of corporate cash holdings. The Journal of Finance 65: 1097–122. [Google Scholar] [CrossRef]
- Hall, Graham, Patrick Hutchinson, and Nicos Michaelas. 2000. Industry Effects on the Determinants of Unquoted SMEs’ Capital Structure. International Journal of the Economics of Business 7: 297–312. [Google Scholar] [CrossRef]
- Han, Seungjin, and Jiaping Qiu. 2007. Corporate precautionary cash holdings. Journal of Corporate Finance 13: 43–57. [Google Scholar] [CrossRef]
- Harford, Jarrad. 1999. Corporate cash reserves and acquisitions. The Journal of Finance 54: 1969–97. [Google Scholar] [CrossRef]
- Harford, Jarrad, Sattar A. Mansi, and William F. Maxwell. 2008. Corporate governance and firm cash holdings in the U.S. Journal of Financial Economics 87: 535–55. [Google Scholar] [CrossRef]
- Harford, Jarrad, Sandy Klasa, and William F. Maxwell. 2014. Refinancing risk and cash holdings. The Journal of Finance 69: 975–1012. [Google Scholar] [CrossRef]
- Hauser, John R., and Frank S. Koppelman. 1979. Alternative Perceptual Mapping Techniques: Relative Accuracy and Usefulness. Journal of Marketing Research 16: 495–506. Available online: https://pdfs.semanticscholar.org/3555/1906ec3878e70820fdb049d5ebebbbc72ae0.pdf (accessed on 12 November 2018). [CrossRef]
- Haushalter, David, Sandy Klasa, and William F. Maxwell. 2007. The influence of product market dynamics on risk management policies. Journal of Financial Economics 84: 797–825. [Google Scholar] [CrossRef]
- Hayne, Cristine, and Clinton Free. 2014. Hybridized professional groups and institutional work: COSO and the rise of enterprise risk management. Organizations and Society 39: 309–30. [Google Scholar] [CrossRef]
- Jensen, Michael C. 1986. Agency costs of free cash flow, corporate finance and takeovers. The American Economic Review 76: 323–29. Available online: https://www.jstor.org/stable/1818789 (accessed on 5 October 2018).
- Jensen, Michael C., and William H. Meckling. 1976. Theory of the firm: Managerial behavior, agency costs and ownership structure. Journal of Financial Economics 3: 305–60. [Google Scholar] [CrossRef]
- Kaplan, Steven, and Luigi Zingales. 1997. Do financing constraints explain why investments is correlated with cash flow? Quarterly Journal of Economics 112: 169–215. [Google Scholar] [CrossRef]
- Keynes, John M. 1936. The General Theory of Employment, Interest and Money. London: Macmillan, ISBN 978-0-230-00476-4. [Google Scholar]
- Khieu, Hinh D., and Mark K. Pyles. 2012. The influence of credit rating change on corporate cash holdings and their marginal value. Financial Review 47: 351–73. [Google Scholar] [CrossRef]
- Kloman, Felix H. 2010. A brief history of risk management. In Enterprise Risk Management. Today’s Leading Research and Best Practices for Tomorrow’s Executives. Edited by John Fraser and Betty J. Simkins. Hoboken: John Wiley & Sons, pp. 19–29. ISBN 978047049908. [Google Scholar] [CrossRef]
- Kraus, Alan, and Robert H. Litzenberger. 1973. A state-preference model of optimal financial leverage. The Journal of Finance 28: 911–22. [Google Scholar] [CrossRef]
- Lalonde, Carole, and Olivier Boiral. 2012. Managing risks through ISO 31000: A critical analysis. Risk Management 14: 272–300. [Google Scholar] [CrossRef]
- Lamont, Owen, Christopher Polk, and Jesús Saaá-Requejo. 2001. Financial constraints and stock returns. The Review of Financial Studies 14: 529–54. [Google Scholar] [CrossRef]
- Lang, Larry, Ralph Walkling, and René M. Stulz. 1991. A Test of the Free Cash Flow Hypothesis: The Case of Bidder Returns. Journal of Financial Economics 29: 315–35. [Google Scholar] [CrossRef]
- Lins, Karl V., Henri Servaes, and Peter Tufano. 2010. What drives corporate liquidity? An international survey of cash holdings and lines of credit. Journal of Financial Economics 98: 160–76. [Google Scholar] [CrossRef]
- MacMinn, Richard D. 1987. Insurance and Corporate Risk Management. The Journal of Risk and Insurance 54: 658–77. [Google Scholar] [CrossRef]
- Mayers, David, and Clifford W. Smith. 1982. On the corporate demand for insurance. The Journal of Business 55: 281–96. [Google Scholar] [CrossRef]
- McShane, Michael, Anil Nair, and Elzotbek Rustambekov. 2011. Does Enterprise Risk Management Increase Firm Value? Journal of Accounting, Auditing and Finance 26: 641–58. [Google Scholar] [CrossRef]
- Michaelas, Nicos, Francis Chittenden, and Panikkos Poutziouris. 1999. Financial policy and capital structure choice in UK SMEs: Empirical evidence from company panel data. Small Business Economics 12: 113–30. [Google Scholar] [CrossRef]
- Mikes, Anette, and Robert S. Kaplan. 2015. When One Size Doesn’t Fit All: Evolving Directions in the Research and Practice of Enterprise Risk Management. Journal of Applied Corporate Finance 27: 37–40. [Google Scholar] [CrossRef]
- Miller, Merton H., and Franco Modigliani. 1958. The Cost of Capital, Corporation Finance and the Theory of Investment. The American Economic Review 48: 261–97. Available online: https://www.jstor.org/stable/1809766 (accessed on 5 October 2018).
- Myers, Stewart C. 1977. Determinants of corporate borrowings. Journal of Financial Economics 5: 147–75. [Google Scholar] [CrossRef]
- Myers, Stewart C., and Nicholas S. Majluf. 1984. Corporate financing and investment decisions when firms have information that investors do not have. Journal of Financial Economics 13: 187–221. [Google Scholar] [CrossRef]
- Neamtiu, Monica, Nemit Shroff, Hal D. White, and Christopher D. Williams. 2014. The Impact of Ambiguity on Managerial Investment and Cash Holdings. Journal of Business Finance and Accounting 41: 1071–99. [Google Scholar] [CrossRef]
- Nehrebecka, Natalia, and Aneta Maria Dzik. 2013. Business Demography in Poland: Microeconomic and Macroeconomic Determinants of Firm Survival. Working Paper, Faculty of Economic Sciences. Warsaw, Poland: University of Warsaw. Available online: http://www.wne.uw.edu.pl/files/1813/9636/8885/WNE_WP93_2013.pdf (accessed on 12 November 2018).
- Opler, Tim, Lee Pinkowitz, René M. Stulz, and Rohan Williamson. 1999. The determinants and implications of corporate cash holdings. Journal of Financial Economics 52: 3–46. [Google Scholar] [CrossRef] [Green Version]
- Outreville, J. François. 2014. Risk Aversion, Risk Behavior, and Demand for Insurance: A Survey. Journal of Insurance Issues 37: 158–86. Available online: https://www.jstor.org/stable/43151298 (accessed on 6 October 2018). [CrossRef]
- Power, Michael. 2009. The risk management of nothing. Accounting, Organizations and Society 34: 849–55. [Google Scholar] [CrossRef]
- Pritchard, David, Patrick L. York, Scott Beattie, and Don Hannegan. 2010. Drilling Hazard Management: The Value of Risk Assessment. World Oil 231: 43–52. Available online: https://www.successful-energy.com/wp-content/uploads/2011/02/WO1010_Series_2_Final.pdf (accessed on 30 October 2018).
- Purdy, Grant. 2010. ISO 31000:2009—Setting a New Standard for Risk Management. Risk Analysis 30: 881–86. [Google Scholar] [CrossRef]
- Ratliff, Richard, and Steven Hanks. 1992. Evaluating Risk. Managerial Auditing Journal 7: 26–32. [Google Scholar] [CrossRef]
- Ross, Stephen A. 1977. The Determination of Financial Structure: The Incentive-Signaling Approach. The Bell Journal of Economics 8: 23–40. Available online: http://www.jstor.org/stable/3003485 (accessed on 6 October 2018). [CrossRef]
- Slovic, Paul, Melissa L. Finucane, Ellen Peters, and Donald G. MacGregor. 2004. Risk as Analysis and Risk as Feelings: Some Thoughts about Affect, Reason, Risk, and Rationality. Risk Analysis 24: 311–22. [Google Scholar] [CrossRef]
- Smithson, Charles, and Betty J. Simkins. 2005. Does risk management add value? A survey of the evidence. Journal of Applied Corporate Finance 17: 8–17. [Google Scholar] [CrossRef]
- Spira, Laura F., and Michael Page. 2003. Risk management: The reinvention of internal control and the changing role of internal audit. Accounting, Auditing & Accountability Journal 16: 640–61. [Google Scholar] [CrossRef]
- Statistics Poland. 2018. Structural Changes of Groups of the National Economy Entities in the REGON Register 2017. Available online: http://stat.gov.pl/obszary-tematyczne/podmioty-gospodarcze-wyniki-finansowe/zmiany-strukturalne-grup-podmiotow/zmiany-strukturalne-grup-podmiotow-gospodarki-narodowej-w-rejestrze-regon-2017-rok,1,21.html (accessed on 12 November 2018).
- Steijvers, Tensie, and Mervi Niskansen. 2013. The determinants of cash holdings in private family firms. Accounting and Finance 53: 537–60. [Google Scholar] [CrossRef]
- Subramaniam, Venkat, Tony Tang, Heng Yue, and Xin Zhou. 2011. Firm structure and corporate cash holdings. Journal of Corporate Finance 17: 759–71. [Google Scholar] [CrossRef]
- Thomas, Philip. 2013. The Risk of Using Risk Matrices. Master’s thesis, University of Stavanger, Stavanger, Norway. Available online: https://brage.bibsys.no/xmlui/handle/11250/183575 (accessed on 25 October 2018).
- Walker, Russel. 2013. Winning with Risk Management. London: World Scientific Publishing Co., ISBN 978-981438882. [Google Scholar]
- Weidemann, Felix. 2018. A state-of-the-art review of corporate cash holding research. Journal of Business Economics 88: 765–97. [Google Scholar] [CrossRef]
- Whalen, Edward L. 1966. A rationalization of precautionary demand for cash. The Quarterly Journal of Economics 80: 314–24. [Google Scholar] [CrossRef]
- Whited, Toni M. 1992. Debt, liquidity constraints, and corporate investment: Evidence from panel data. Journal of Finance 47: 1425–60. [Google Scholar] [CrossRef]
- World Bank. n.d. Available online: https://www.worldbank.org/en/country/poland/overview#4 (accessed on 12 November 2018).
| 1 | A company may also obtain external funding by the issue of shares (increasing equity). However, in our conceptual model, we focus purely on the availability of debt. The reason behind this limitation is that the decision on the issue of new shares imposes strategic concerns due to the potential change in the ownership structure. Moreover, the injection of additional funds from the owners is considered as the ultimate solution (used in terms of high leverage, leading to unattainability of debt). |
| 2 | Although rare, the debt to assets ratio can be greater than 1. However, in this study we excluded such cases (which is discussed in the sample selection). |
| 3 | In some empirical works the median is used. However, these works aim at dividing the sample into two parts that distinguish with e.g., high or low cash holdings. See Demonier et al. (2015) with the analysis of the empirical works following the approach proposed by Fazzari et al. (1988) and Kaplan and Zingales (1997). |
| 4 | The EMIS database presents industry information, company profiles, reports, and financial data, as well as macroeconomic statistics and forecasts for emerging markets in Asian, Latin American, and Central and Eastern European countries. Detailed information on the database is available online (EMIS n.d.). |
| 5 | According to World Bank, Polish real GDP (Gross Domestic Product) growth is expected to reach 4.7% in 2018, driven by domestic consumption and accelerating investments. Unemployment at a rate of slightly above 4%, is the second-lowest rate in the 28-member European Union (World Bank n.d.; Emerging Europe n.d.) Business demography data indicate the growing number of bankruptcies (900 companies in 2017). However, the number of bankruptcies is relatively low in comparison to the total number of entities conducting economic activity in Poland (Statistics Poland 2018; Nehrebecka and Dzik 2013). |
| 6 | The PKD (Polska Klasyfikacja Działalności—Polish Industrial Classification) system is consistent with NACE rev. 2 (Statistical Classification of Economic Activities in the European Community) and uses digit coding with a very detailed explanation of the areas of a company’s operating activity. The companies were grouped with reference to their PKD codes and classified to one of the largely understood sectors (in this case production, trade, or services). |
Figure 1.
Conceptual model of four patterns of self-resistance to risk outcomes.

Figure 2.
Dispersion of debt capacity constraint (debt to total assets) and liquidity constraint (cash and cash equivalents to total assets) in the examined sample (N = 2292). Red lines reflect the mean values.
Figure 2.
Dispersion of debt capacity constraint (debt to total assets) and liquidity constraint (cash and cash equivalents to total assets) in the examined sample (N = 2292). Red lines reflect the mean values.

Figure 3.
Dispersion of debt capacity constraint (debt to total assets) and liquidity constraint (cash and cash equivalents to total assets) in the examined sample, broken by sectors: production (N = 665), services (N = 1071) and trade (N = 566). Red lines reflect the mean values.
Figure 3.
Dispersion of debt capacity constraint (debt to total assets) and liquidity constraint (cash and cash equivalents to total assets) in the examined sample, broken by sectors: production (N = 665), services (N = 1071) and trade (N = 566). Red lines reflect the mean values.


Figure 4.
Perceptual map (correspondence analysis).


Table 1.
Sample characteristics: Liquidity constraint (cash and cash equivalents to total assets).
| Sample | Number of Observations | Mean | Median | Standard Deviation | Min | Max |
|---|---|---|---|---|---|---|
| In total | 2292 | 0.086456 | 0.049078 | 0.1016451 | 0.0000 | 0.6662 |
| Production | 655 | 0.056238 | 0.032540 | 0.0669879 | 0.0003 | 0.4754 |
| Trade | 566 | 0.069497 | 0.038121 | 0.0842931 | 0.0000 | 0.5423 |
| Services | 1071 | 0.113899 | 0.072961 | 0.1190039 | 0.0003 | 0.6662 |
Table 2.
Sample characteristics: debt capacity constraint (debt to total assets).
| Sample | Number of Observations | Mean | Median | Standard Deviation | Min | Max |
|---|---|---|---|---|---|---|
| In total | 2292 | 0.481663 | 0.473657 | 0.1946336 | 0.0016 | 0.9714 |
| Production | 655 | 0.451315 | 0.444729 | 0.1642170 | 0.0488 | 0.9189 |
| Trade | 566 | 0.526222 | 0.530941 | 0.1950651 | 0.0016 | 0.9714 |
| Services | 1071 | 0.476675 | 0.465261 | 0.2071151 | 0.0029 | 0.9625 |
Table 3.
Pattern of risk-self resistance by sectors of observed companies.
| Sector | Pattern of Risk Self-Resistance | |||||
|---|---|---|---|---|---|---|
| Pattern A (Internally Driven) | Pattern B (High) | Pattern C (Externally Driven) | Pattern D (Low) | In Total | ||
| Production | N | 111 | 106 | 94 | 344 | 655 |
| % sector | 16.9% | 16.2% | 14.4% | 52.5% | 100.0% | |
| % pattern | 27.3% | 24.0% | 14.6% | 43.1% | 28.6% | |
| Trade | N | 207 | 94 | 54 | 211 | 566 |
| % sector | 36.6% | 16.6% | 9.5% | 37.3% | 100.0% | |
| % pattern | 50.9% | 21.3% | 8.4% | 26.4% | 24.7% | |
| Services | N | 89 | 241 | 498 | 243 | 1071 |
| % sector | 8.3% | 22.5% | 46.5% | 22.7% | 100.0% | |
| % pattern | 21.9% | 54.6% | 77.1% | 30.5% | 46.7% | |
| In total | N | 407 | 441 | 646 | 798 | 2292 |
| % sector | 17.8% | 19.2% | 28.2% | 34.8% | 100.0% | |
| % pattern | 100.0% | 100.0% | 100.0% | 100.0% | 100.0% | |
Table 4.
Results of Kruskal–Wallis test for sectors and type of constraints.
| Constraints | Kruskal-Wallis Test | Post-Hoc Tests for Sectors | ||
|---|---|---|---|---|
| P-T | P-S | T-S | ||
| liquidity constraint | 154.5 *** | −381.93 *** | −95.12 * | 286.8 *** |
| debt capacity constraint | 51.16 *** | −87.49 * | −267.06 *** | −179.57 *** |
| combined impact of constraints | 131.37 *** | −323.22 *** | −12.5 | 310.73 *** |
Statistical significance at: *** α = 0.001; * α = 0.05; Sectors denoted as: P for production, S for services, T for trade.
© 2018 by the authors. Licensee MDPI, Basel, Switzerland. This article is an open access article distributed under the terms and conditions of the Creative Commons Attribution (CC BY) license (http://creativecommons.org/licenses/by/4.0/).
Share and Cite
MDPI and ACS Style
Wieczorek-Kosmala, M.; Błach, J.; Trzęsiok, J. Analysis of Bankruptcy Threat for Risk Management Purposes: A Model Approach. Int. J. Financial Stud. 2018, 6, 98. https://doi.org/10.3390/ijfs6040098
AMA Style
Wieczorek-Kosmala M, Błach J, Trzęsiok J. Analysis of Bankruptcy Threat for Risk Management Purposes: A Model Approach. International Journal of Financial Studies. 2018; 6(4):98. https://doi.org/10.3390/ijfs6040098
Chicago/Turabian StyleWieczorek-Kosmala, Monika, Joanna Błach, and Joanna Trzęsiok. 2018. "Analysis of Bankruptcy Threat for Risk Management Purposes: A Model Approach" International Journal of Financial Studies 6, no. 4: 98. https://doi.org/10.3390/ijfs6040098
Note that from the first issue of 2016, this journal uses article numbers instead of page numbers. See further details here.