
A Transmission of Beta Herding during Subprime Crisis in Taiwan’s Market: DCC-MIDAS Approach


1
School of Finance and Accounting, Fuzhou University of International Studies and Trade, Fuzhou 350202, China
2
Independent Researcher, Kaohsiung City 83102, Taiwan
3
School of Securities and Futures, Southwestern University of Finance and Economics, Chengdu 611130, China
4
Department of Nursing, Fooyin University, Kaohsiung City 83102, Taiwan
*
Author to whom correspondence should be addressed.
Int. J. Financial Stud. 2021, 9(4), 70; https://doi.org/10.3390/ijfs9040070
Submission received: 21 October 2021
/
Revised: 3 December 2021
/
Accepted: 6 December 2021
/
Published: 11 December 2021
(This article belongs to the Special Issue Explaining Volatility Patterns and Speculation Incentives in Sophisticated Investments by Behavioural Finance)
Abstract
:The aim of this study is to investigate the herding of beta transmission between return and volatility. We have used the dynamic conditional correlation model with the mixed-data sampling (DCC-MIDAS) model for the analysis. The evidence demonstrates that herding is a key transmitter in Taiwan’s stock market. The significant estimation of DCC-MIDAS explains that the herding phenomenon is highly dynamic and time-varying in herding behavior. By means of time-varying beta of herding based on our rolling forecasting method and robustness check of the Markov-switching regression approach using four types of portfolios, the evidence indicates that there are conditional correlations between betas and herding. In addition, it also reveals that herding forms in Taiwan’s markets during the subprime crisis period.
1. Introduction
Herding is a decision-making behavior in the financial market. Herding behavior is also an important issue for investors’ sentiment, investment strategies and stock market stability (see Bouri et al. 2021; Demirer et al. 2019; Fei and Liu 2021; Guo et al. 2020, for example). In finance, herding is the phenomenon of volatility clustering and time-varying characteristics in financial data. In other words, the presence of herding is likely to display in the form of the synchronicity of volatility movements, especially when market volatility is caused by market pressure, such as the financial crisis and the recent COVID-19 pandemic (Akhtaruzzaman et al. 2021a, 2021b).
Previous studies have pointed out that herding has mixed evidence in the literature on the impact of stock market volatility. Lee (2017) concludes that the US subprime crisis period is an exception, because during the period no significant evidence of herding is found. However, Shyu and Sun (2010) find no significant changes of institutional herding under market stress in the Taiwan stock market. Hsieh (2013) finds evidence of herding by both institutional and individual investors in the Taiwan stock market using high-frequency intraday data. Fei and Liu (2021) explore the impact of investor herding behavior on stock market volatility, and find evidence that the information contained in the herding measure helps improve volatility forecasts and economic value to investors.
In this article, we propose the concept of beta herding to re-examine the role of herding in the transmission mechanism of the financial market during the subprime mortgage crisis. This concept measures the fluctuation trend of market returns time series and the time-varying correlation between herding and volatility. In a recent paper, Hwang et al. (2021) proposed the concept of beta herding, which measures cross-sectional variations in betas caused by a behavior bias in finance—investor overconfidence. This concept has not been verified on many issues, such as the impact of the subprime crisis. In addition, it also contributes to the debate in the literature on herding, and brings a new perspective to the relationship between herding and volatility depending on the transmission of beta herding.
Most studies investigate the existence of herding effects or focus on the impacts of analysts and firms’ characteristics, while few papers empirically examine herding risks and volatility characteristics, such fat tails existing in asymmetric information during the financial crisis. It is difficult to predict investors’ sentiment and herding, but relatively easy to observe market volatility which results from herding. Herding behavior can be either rational or irrational (Devenow and Welch 1996; Bikhchandani and Sharma 2001). The market sentiment accumulates over time whether investors’ behavior is rational or irrational. Accordingly, we cannot detect herding behavior using the same frequency data for different market conditions, particularly during the period of financial crisis. In this study, herding behavior is considered a factor in beta forecasting among stock markets.
In this paper, we adopt the dynamic conditional correlation model with the mixed-data sampling (DCC-MIDAS) model (Colacito et al. 2011) for four portfolios, and attempt to forecast during the subprime financial crisis. We focus on the DCC-MIDAS GARCH model, since it can allow observations of beta herding to be more fit and reflect more important information, including time-serious information, which implies volatilities and provides more real information on herding behavior. Besides, the rolling forecast procedure is applied to the prediction of time-varying beta of herding, and the robustness check of the Markov-switching regression approach is applied to the comparison of the forecasting ability of the DCC-MIDAS model. Thus, this paper provides a novel estimation of the forecasting ability during the precrisis and volatile crisis periods.
Previous literature on herding in the stock markets considers developed economies. However, the Taiwan market has a unique trading system. For example, there is a 10% price limit, and foreign institutional investors hold a high percentage of the stock market—about 50–70%. This study contributes to the literature by investigating new insights for beta-herding transmission between returns and volatility into the current issues of herding behavior. This paper contributes to the literature in two main ways. First, we forecast the time-varying beta of herding of the four styles of portfolios during the crisis. Second, as advocated by previous studies, we provide an extended comparison between the forecasting ability of the GARCH model and the rolling forecast procedure. Additionally, we provide a comparison of the forecasting results of herding between the full and subprime crisis periods. In this manner, it can be seen which model provides the best forecast during long-run and volatile periods. This is the unique contribution of the paper to the literature—taking the use of the DCC-MIDAS approach and the rolling method of forecasting into consideration. In addition, through time-varying beta of herding based on the rolling forecasting method and robustness check of the Markov-switching regression approach, we find evidence of the forecasting ability of the model, indicating that there are conditional correlations between betas and herding.
2. Literature Review
2.1. Detecting Herding Behavior: A Short Review
Herding tends to imitate the actions of others rather than follow their own beliefs and private information, even when they disagree with the predictions (Christie and Huang 1995). The concept is that if investors follow the majority of markets, then dispersion in returns would disappear entirely.
Research on herding behavior for financial markets is important. The occurrence of herding behavior will lead investors to over (under) valuation; moreover, it will affect the quality of risk management and estimation of performance. Several researchers (Scharfstein and Stein 1990; Bikhchandani et al. 1992; Devenow and Welch 1996) have developed a lot of theoretical models for herding behavior. Empirical studies have mainly focused on the existence of herding behavior among fund managers and financial analysts (Lakonishok et al. 1992; Wermers 1999; Welch 1992).
Herding is often used to describe the correlation resulting from interactions between investors. For instance, Chiang et al. (2007) find that the contagion effect takes place in the early stage of the Asian financial crisis, and that herding behavior dominates the later stage of the crisis, as the bad news becomes widespread and investors realize the full impact of the crisis. Since the co-movement in emerging stock markets occurs during high-volatility periods, international investors are following decisions of others due to contagion (Boyer et al. 2006). Some papers focus on examining herding behavior for the correlation dispersion in stock returns in response to the changes in market conditions. Chang et al. (2000) find significant evidence of herding in South Korea and Taiwan, and partial evidence of herding in Japan. Zhou and Lai (2009) observe that the herding activity in the market of Hong Kong tends to be more prevalent with small stocks, and that investors are more likely to herd when selling rather than buying stocks. Tan et al. (2008) report that herding occurs under both rising and falling market conditions and is especially present in A-share investors.
Some papers discuss the herding on cross-country variations in market-level stock volatility. Forbes and Rigobon (2002) find that as for interdependent financial markets, there are significant increases in co-movements during high-volatility periods. BenSaïda et al. (2018) find the role of the shock transmission path of the shifting dependence dynamics between the G7 stock markets. Boubaker and Jouini (2014) find evidence of market’s sensitivity to the fluctuations between emerging and developed equity markets. Chiang et al. (2007) find significant evidence of co-movements among various stock markets during the Asian crisis. Klein (2013) examines time-varying herding in stock market using a Markov switching seemingly unrelated regression model to analyze different dynamics during times of high and low volatility, and model the correlation between the markets. Kumar et al. (2021) extend the literature by focusing on the commodity markets of major economies in the Asia–Pacific region (China, India, Indonesia, Japan, Malaysia, Singapore, Taiwan, and Thailand), and find that herding is more pronounced during high volatility periods.
Hwang and Salmon (2004) propose a measure of herding that allows time variation in herding behavior. Their method is based on the assumption of time-varying monthly betas. Results for the United States and South Korea show a tendency of herding to mitigate, or even become adverse, during periods of turmoil, for example, the Asian and Russian financial crises as well as the tech bubble of the early 2000s (Bohl et al. 2013). Hwang and Salmon (2004) put forward a testable model that incorporates the effect of investor sentiment.
2.2. A Look at Testing Methods
Although a large body of literature exists on volatility forecasting models, no single model emerges as superior. Hansen and Lunde (2005) fail to conclude that the GARCH (1,1) beats all the other competing models when they compare 330 different volatility GARCH and non-GARCH models to predict the intraday volatility for the DM-USD exchange rate. Zhang and Choudhry (2013) forecast daily hedge ratios in the agricultural futures market, finding the BEKK-GARCH model to have superior forecasting ability using the storable product data and the asymmetric GARCH model for nonstorable product data. Kang et al. (2009) and Wei et al. (2010) investigate and demonstrate the superior forecasting ability of the GARCH-family models in volatility prediction for crude oil markets if compared to non-GARCH models. Few papers in the extant literature compare the forecasting ability of the Kalman filter method against the GARCH models. According to the results proposed by Brooks et al. (1998),, the Kalman filter is superior to the GARCH using in-sample and out-of-sample return forecasts based on beta estimates. A similar conclusion is also put forward by Faff et al. (2000) and Choudhry and Wu (2008) when comparing the Kalman filter and GARCH models for beta forecasting. However, these papers have not estimated and/or forecasted the beta during the volatile crisis period or robustness of the method comparison.
Prior studies have proposed many volatility forecasting models and generalized autoregressive conditional heteroskedasticity (GARCH)-type models for beta forecasting, but we notice that beta herding may not be easily predicted using a single dimension of the GARCH models; in other words, we put forward an appropriate framework that considers the GARCH multidimensional models for different portfolios and levels of herding. To the best of our knowledge, this paper proposes that the dynamic conditional correlation (DCC) is an efficient estimation method for multiple assets. Although the DCC model can be easily estimated for multiple assets with time variants, it is still difficult to deal with different frequency data at the same time.
The DCC-MIDAS model proposed by Colacito et al. (2011) is a combination of the two-component volatility decomposition model. According to the DCC-MIDAS model, Colacito et al. (2011) conclude that in the use of the mixed-frequency data, the models provide a view of dynamic correlation and volatility spillover relations from both long-term and short-term perspectives. Wang and Li (2021) find that there are asymmetric volatility spillover effects between the crude oil market and three major Chinese financial markets using the DCC-MIDAS model with asymmetry effects. Asgharian et al. (2013) show that including low-frequency macroeconomic information in the GARCH-MIDAS model improves the prediction ability of the model, particularly for the long-term variance component. Allard et al. (2020) analyses the determinants of U.S. stock–bond correlations estimated at different frequencies including a daily, a monthly, and a yearly component of correlations through the DCC-MIDAS model. They concluded that different correlation components and determinants should be considered for different investment horizons. Further, the DCC-MIDAS provides more tests on asset correlations, e.g., Conrad et al. (2014) and Virk and Javed (2017), and stock–bond correlations, e.g., Asgharian et al. (2015, 2016); and Fang et al. (2018).
3. Data and Methodology
3.1. Herding Models
There are two well-established herding measures of the cross-sectional standard deviation (CSSD) (e.g., Christie and Huang 1995) and cross-sectional absolute deviation (CSAD) (e.g., Chang et al. 2000) which are widely used in most empirical papers. Christie and Huang (1995) introduced the CSSD of stock returns with respect to market return, which is defined as:
where is the return of stock i at time t, and is the cross-sectional average return of the N stocks in the market portfolio at time t. Christie and Huang (1995) contend that rational asset-pricing models and herding provide conflicting implications for the CSSD.
Although the CSSD is a quite intuitive measure of cross-sectional return dispersion, it is considerably affected by the existence of outliers. Therefore, Chang et al. (2000) consider the CSAD of stock returns around the market portfolio return as a more appropriate measure, which is developed as follows:
where is the return of stock i at time t, and is the cross-sectional average return of the N stocks in the market portfolio at time t.
3.2. Time-Varying Beta of Herding Measures
The DCC-GARCH model was proposed by Engle and Sheppard (2001) and Engle (2002) to estimate large time-varying covariance matrices. This model combines dynamic correlation and the GARCH model, and hence it is capable of dealing with heteroskedasticity and large dynamic covariance matrices.
There are two steps in the estimation procedure. In the first step, a series of univariate GARCH models are estimated for each residual series. In the second step, the standardized residuals from the first step are used to estimate parameters of dynamic correlation that are independent of the number of correlated series. This multistage estimation has computational advantages over multivariate GARCH models in terms of the number of parameters (Engle 2002).
Assume that the returns of N assets are conditionally normally distributed, and the DCC-GARCH model is a generalized framework of the constant conditional correlation GARCH (CCC-GARCH) model, which is given as follows:
where is the N × N diagonal matrix of standard deviation from the univariate GARCH models, and is the dynamic correlation matrix; is a positive semidefinite matrix; is the unconditional variance matrix of ; are the standardized residuals from the GARCH models; and in terms of , , this model is mean-reverting on the condition that .
With respect to forecasting covariance using the DCC-GARCH model, one standard approach is to generate the r-step ahead forecast of with the supposition that . Alternatively, we can directly predict with the approximation that and (Engle and Sheppard 2001). The DCC-GARCH model provides accurate approximation of time-varying correlations in practice, even for large covariance matrices. Furthermore, the original correlations remain unchanged when new variables are added to the system (Engle 2002).
In this paper, we employ a two-step approach for forecasting. Firstly, we estimate the parameters and conditional variance of two univariate GARCH models for log-returns of the four portfolios, and then we construct the standardized residuals. Secondly, we estimate the correlation parameters between log returns of the portfolio and market based on the outcomes derived from the first step. In rolling forecasting, the whole process is repeated for each rolling sample to predict the one-day-ahead beta.
Colacito et al. (2011) propose a new model (i.e., DCC-MIDAS) by combining the Engle et al. (2008) DCC model with a component specification of correlation. Colacito et al. (2011) find that the DCC-MIDAS model can improve a portfolio’s performance and gain more benefits compared with constant unconditional correlations, and the DCC model in the G7 countries’ stock markets. Furthermore, the one-step-ahead estimator of the DCC-MIDAS model may bring some potential benefits for investors.
As stated in Colacito et al. (2011), the DCC-MIDAS model is generally described as:
where residuals are assumed to be normally distributed and the elements in are expressed as follows:
is the largest lag length determined by AIC; and are standardized residuals; represents weight in the weighting scheme which can be a simple cross-product of standardized residuals; is the number of days in the low-frequency factor (such as months and quarters) and is the rate of decay in the weighting scheme. The forecasting procedure is similar to the DCC-GARCH model. In the first step, we estimate each return volatility series using the GARCH model; in the second step, the correlation in the DCC-MIDAS model is reformed with Equation (6). The DCC-MIDAS model incorporates a time-varying conditional correlation with a short- and long-term component specification. The DCC framework describes the short-term effect on correlation, and the long-term component MIDAS (Equations (5) and (6)) captures the long-term impact on correlation. It can deal with mixed frequency sampling and capture correlations between low- and high-frequency data.
3.3. Rolling Forecast Procedures
Forecasting can be performed based on a recursive window or rolling window. In this paper we apply the rolling window method. A rolling window is one where the sample size used to estimate the model is fixed; and the start and end dates move forward by one day for daily rolling. In other words, as the start and end dates move one day ahead with a fixed sample size, the oldest data are dropped and the latest ones are added. For one-step-ahead forecasts, the observations from the first observation to n are applied to the forecasting of and , indicating that the second observations to the n + 1 observation are used. In this manner, the fixed rolling window is updated by one observation from the beginning to the end each time, to forecast one step ahead. This forecasting method estimates and keeps parameters updated for each rolling window. This method avoids the stability (parameter drift) problem of estimated parameters that are updated for each fixed rolling window estimate. The rolling scheme has consistent power compared to the recursive forecasting method (Cheung et al. 2005). In the modern financial markets, business conditions change rapidly. The rolling forecast keeps updating the estimated parameters to respond to rapid market changes, and thus investors can adjust investment position and budget in time (Lalli 2011). The effectiveness of rolling forecasting makes it a more attractive approach than recursive forecasting.
3.4. Data and Forecasting Time-Varying Beta of Herding Series
We apply the data from four extremely stressed portfolios and trading frequencies during the subprime crisis period. This will enable a comparison of results from highly financially stressed markets and lightly stressed markets. All data are obtained from the Taiwan Economic Journal (TEJ) database. This study provides information on these portfolios and the corresponding correlation and graphs for each type of market portfolio.
In fact, it is difficult to measure and quantify the phenomena of herding behavior. Chang et al. (2000) use the 1976–1995 data to test herding for international markets. To test the behavior of investors, large amounts of trading data are required for the measure. Our study is based on the TEJ database of all daily returns on the list of the Taiwan Stock Exchange, including the period between January 2000 and December 2014. This paper examines for the financial crisis including the Subprime Crisis (2007/08–2008/10). Our sample consists of 3746 observations of four investment styles based on the book-to-market ratio (B/M) and market valuation (MV). We classify each portfolio by ranking its B/M ratio and MV to create “large”, “small”, “growth” and “value”, indicating that four types of portfolios are used to examine the difference in herding behavior. Our sample, by definition, ranks the top 50% of capitalization in the market to create “large” portfolios, and the last 50% to create “small” portfolios, while ranking the top 30% of B/M ratio to create “growth” portfolios and the last 30% to create “value” portfolios.
4. Empirical Analysis
The idea of the DCC-MIDAS model for herding is extended to dynamic correlations. Following Colacito et al. (2011), this study uses the DCC-MIDAS model based on time-varying beta and herding for the sentiment of the market to achieve a dynamic measure of the herding. Table 1 shows the summary statistics and results of unit root tests. We observe that all series in Table 1 are excessively leptokurtic and skewed, and that all data are stationary in the first difference.
In addition, Table 2 gives the descriptions of the Pearson correlation between the CSAD and market return of four types of portfolios, and shows high correlation coefficients among the four portfolios in addition to the negative correlation between the CSAD and market return.
In this empirical study, for each type of market portfolio, all the series are fitted by the DCC-MIDAS model using the Colacito et al. (2011) approach. We analyze the CSAD and the daily return of five stock return indices, namely Taiwan’s stock market return (), large types of stock return indices (), small types of stock return indices (), growth types of stock return indices () and value types of stock return indices (), including the period between January 2001 and December 2014. Table 3 reports the estimated parameters of the DCC-MIDAS and the standard error of all parameters for each index during the full and subprime crisis periods. The maximum likelihood estimation in the DCC-MIDAS algorithm is assessed using the Akaike information criterion (AIC) test. First of all, all the coefficients of the DCC-MIDAS are significant during the full periods and the subprime crisis period. A and B are the parameters of the variance of short-term correlation, and Omega is the estimated weight parameter. Panel 1 of Table 3 shows the results from the Taiwanese stock market for two periods of testing. We find that B is positive and significant for full periods and the subprime crisis periods. Besides, the B coefficient of crisis testing periods is larger than the full testing periods. This implies that the higher the herding impacts or uncertainty is, the larger is the stock market volatility. The same results also can be found in the small portfolio and the value portfolio. The estimator coefficients (see A, B and Omega) are all significant at level 1%, indicating that the herding has a significant impact on the dynamic correlation between CSAD and market returns in different portfolios. In summary of our results, the significance of DCC-MIDAS estimates explains that the existence of herding is highly dynamic and time-varying in herding behavior. The results of this study lead us to understand that it is necessary to consider the role of herding of market fundamentals.
Figure 1 shows the covariance of the DCC-MIDAS between the portfolio and CDAD during the full period, while Figure 2 indicates the subprime period.
Forecasting time-varying beta of herding is important for several reasons. Since the beta (systematic risks) is the only risk that investors should be concerned about, prediction of the beta value makes it easier to make investment decisions. The beta value can also be used by market participants to measure the performance of fund managers. For corporate financial managers, forecasts of the conditional beta are beneficial in capital structure decisions and investment appraisal.
Our dataset consists of different frequency return data including daily, weekly and monthly return, four types of portfolios including large, small, growth and value portfolios, and then the cross-sectional absolute deviation (CSAD) is calculated for herding indicator proposed by Christie and Huang (1995).
Basic statistics for the beta forecasting of herding during the full and subprime crisis periods are presented in Table 4. There are 1141 rolling forecasting observations. Figure 3 shows the time-varying beta of herding for a rolling forecast of 5 (green lines) and 10 days (red lines) of estimation compared with the actual Taiwan market index (blue lines). The figure plots the estimated return volatility (i.e., square root of the variance) and correlation for herding (i.e., CSAD) and stock returns, from the DCC-MIDAS model. We simulate two frequencies of five and ten days of data sets from the DCC-MIDAS model in order to investigate the form of the accumulation of information of market sentiment aroused by herding. Our evidence for 5 and 10 days of rolling forecasts suggests that more information accumulated in the market leads to stronger uncertainty, that more easily causes fluctuation, particularly in periods of global financial crisis.
We further study the role of herding for the beta-herding series by the robustness of the Markov regime-switching approach proposed by Hamilton (1989). The Markov-switching approach can help measure the correlations of volatility between portfolios in each state (regime), volatility states and lengths of duration. However, the forecasting bias may be due to the limit of the DCC-MIDAS model (i.e., that its unconditional variance is constant). The Markov model captures the variance changes depending on the state of the return volatility. The robust test helps to detect volatility behavior in terms of dynamic correlations of herding. Choi and Hammoudeh (2010) examine the time-varying volatility through low- and high-volatility regimes for the commodities—stock markets.
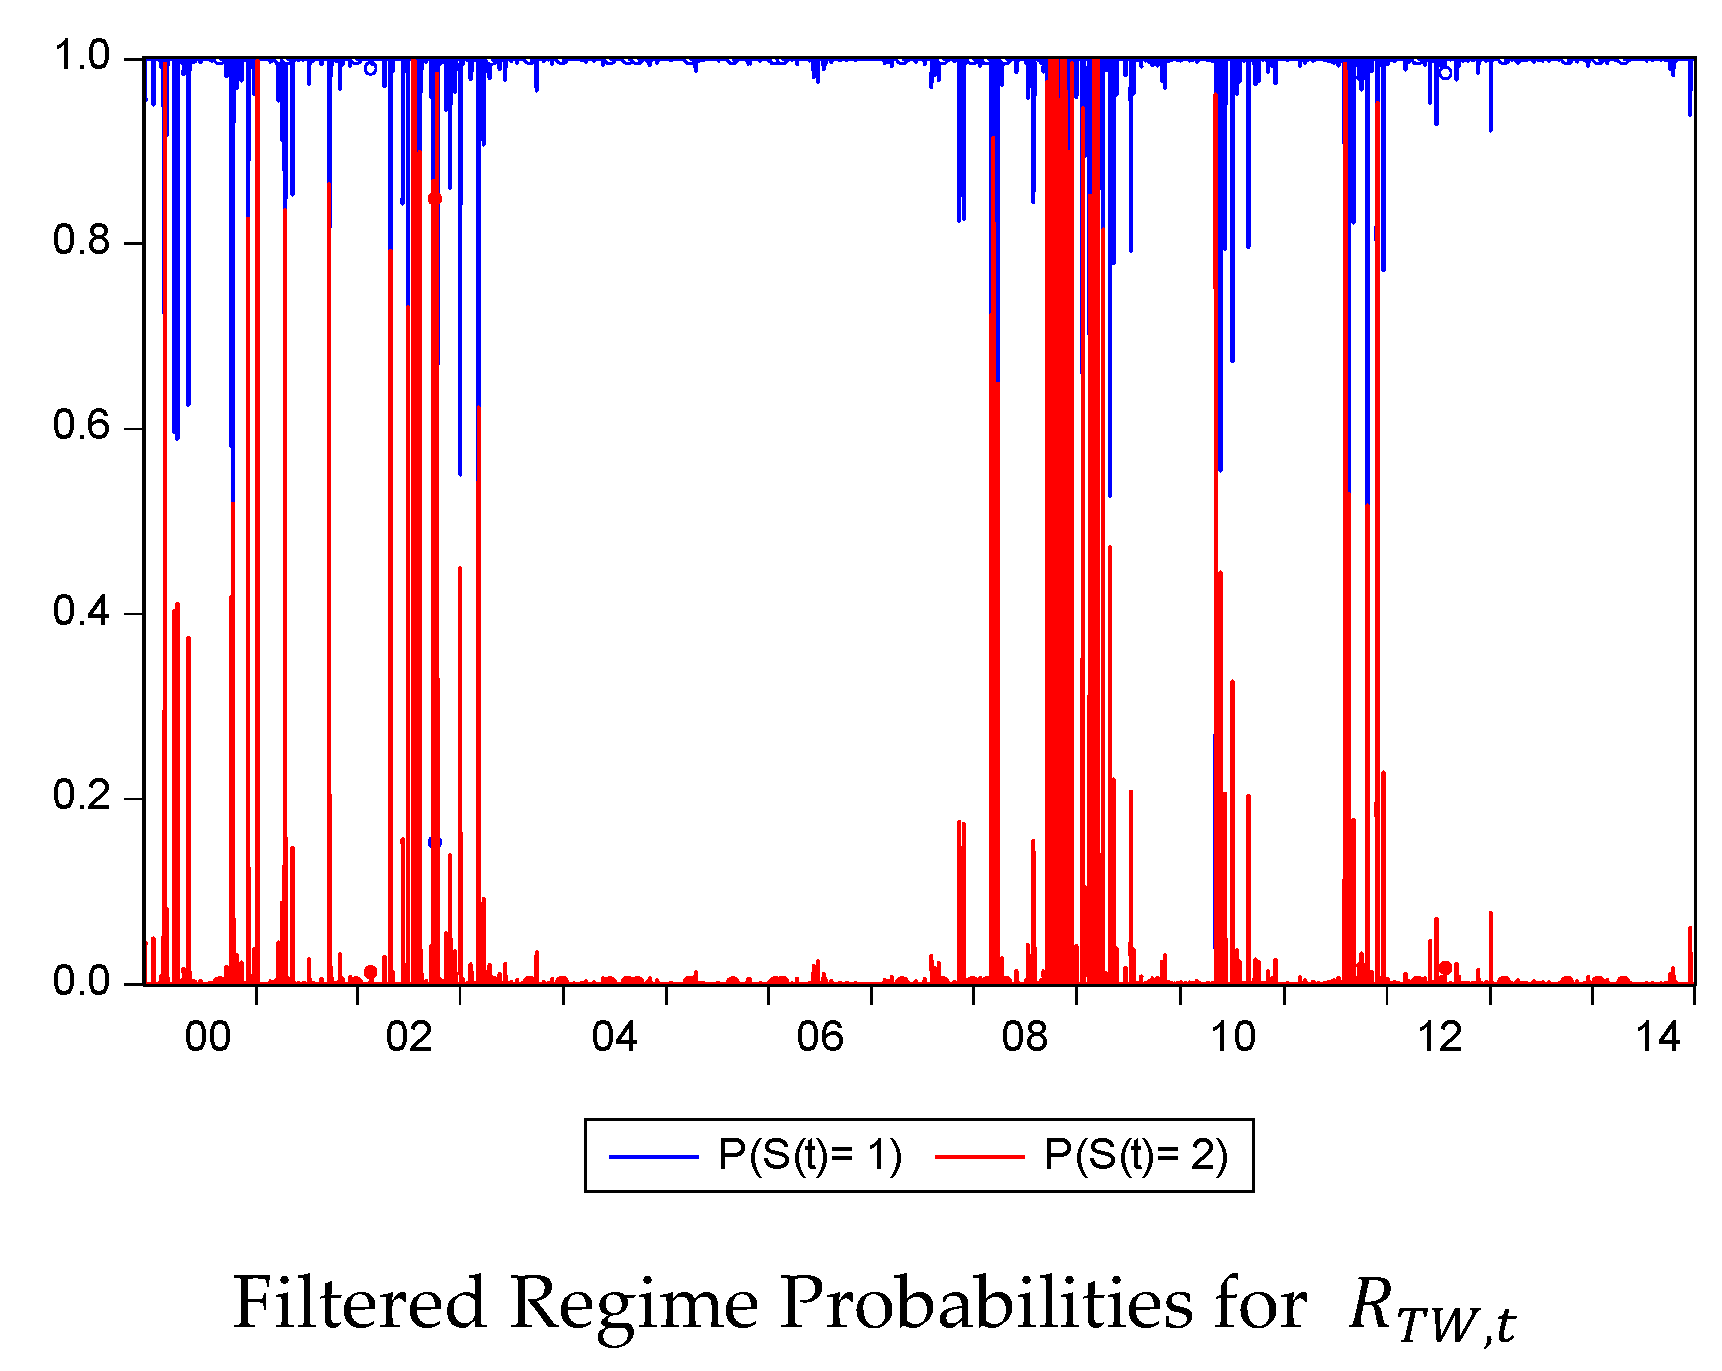
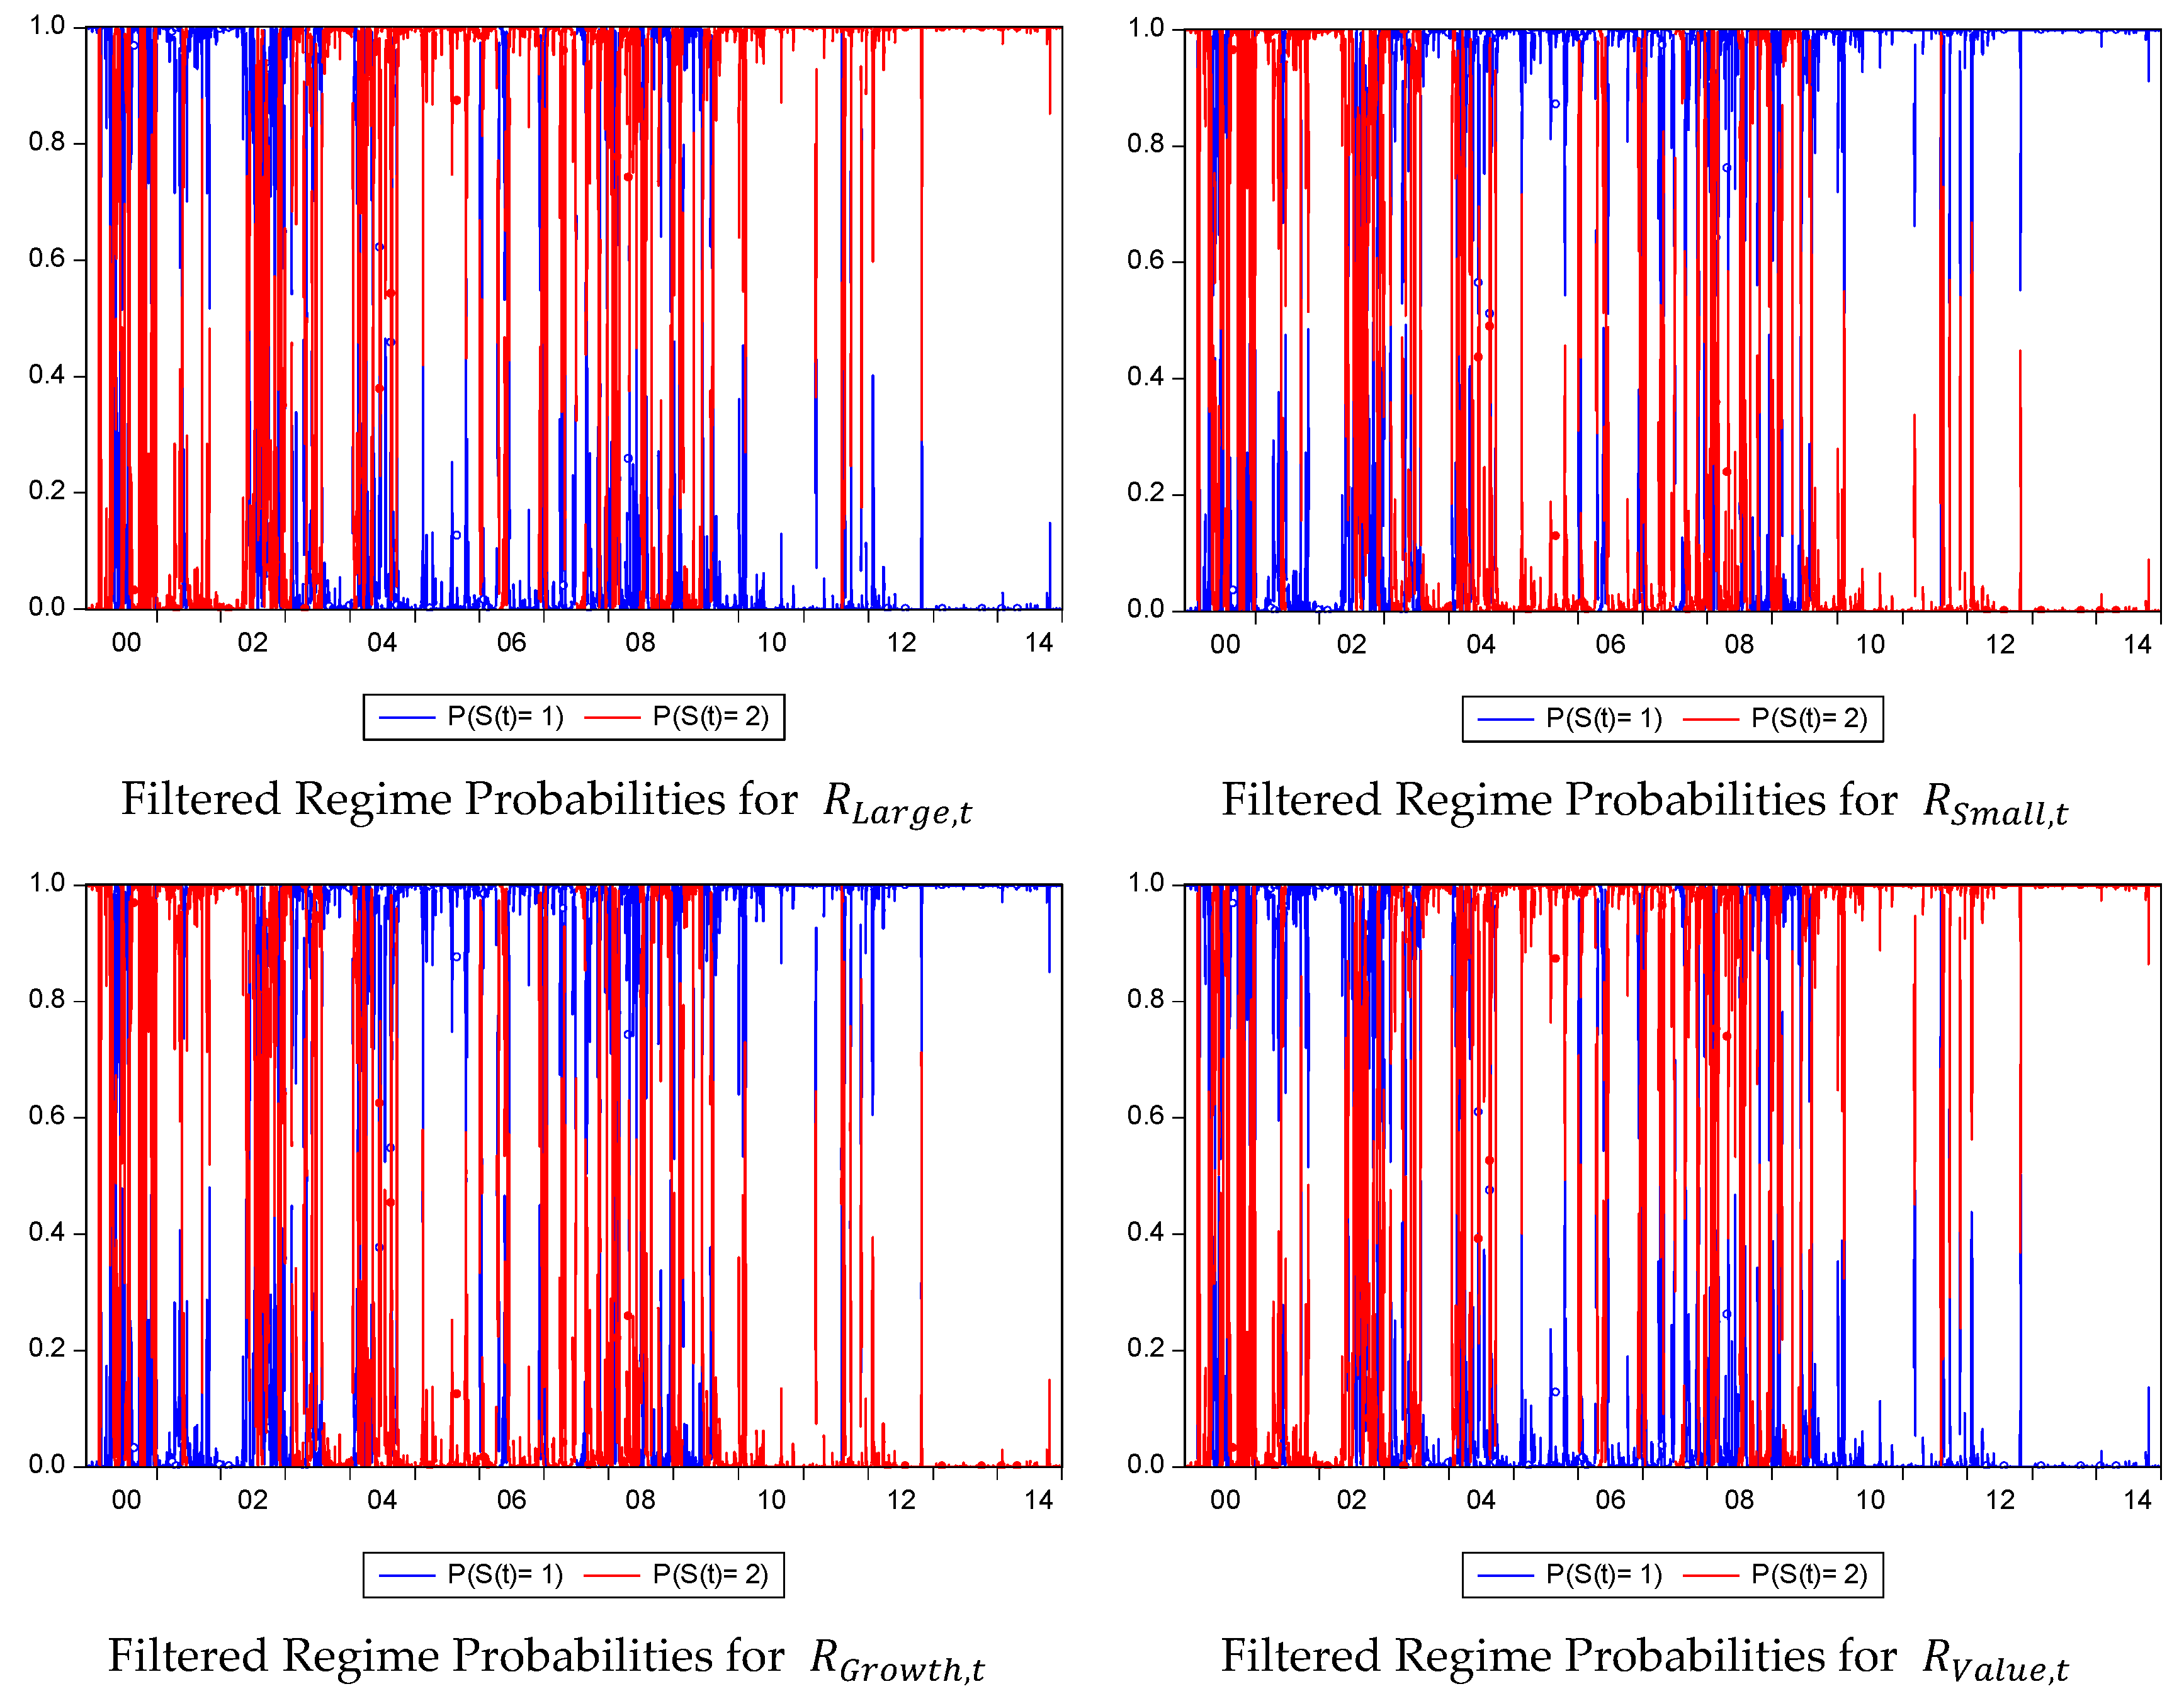
Table 5 presents the robust test for the transmission mechanism of herding’s impact on stock returns during the financial crisis, which is divided into regime one and regime two. Regime one is the volatility transfer probability of herding affected by a specific type of structural change. Regime two is the transfer probability that the volatility of the return is affected by the herding effect. It can be regarded as the turning point between herding and the predicted return volatility, and it is used as the foundation of investment decisions. The results report a significant correlation of regime one with small and value types of portfolios, indicating the persistence of high volatility on the herding regime. The results also reveal similar results for the DCC-MIDAS methods. In addition, the results display no obvious changes in transfer probability due to the herding effect among market return (TW), Large, and Growth portfolios. In this section, we conclude that herding is significant in volatile markets during periods of financial crisis, which are conditional in the CSAD model, with time-varying transition probabilities. Based on the rolling forecasting method and robustness check of the Markov-switching regression approach using four types of portfolios, we find evidence of the forecasting ability of the model, indicating that there are conditional correlations between betas and herding. The DCC-MIDAS predominantly contributes to describing the beta herding and improving the forecasting ability during the subprime crisis period. Thus, the models conducted in this study depend on the portfolios and periods under study. Figure 4 shows the robustness results of the Markov-switching approach.
5. Conclusions and Limitations
This paper empirically attempts to forecast time-varying beta of herding by means of the GARCH model, and examines the daily herding beta of four types of portfolios during the full and subprime periods. The GARCH model employed in this study is the DCC-MIDAS approach. We investigate the model because of its high and robust forecasting ability and its allowance of a multiple-frequency dataset. The rolling forecast procedure is applied to the forecasting of the time-varying beta of herding, while the Markov-switching approach for robustness is used for the provision of the forecasting ability of the model. The rolling forecasting method has consistent power compared to the recursive forecasting method.
This paper contributes to the literature by providing new insights for beta-herding transmission between returns and volatility regarding the current issue of herding behavior. The evidence demonstrates that herding is the key transmitter in Taiwan’s stock markets. The significance of the DCC-MIDAS estimates explains the existence of herding as highly dynamic and time-varying. Our results are similar to those of Hsieh (2013), who reported that investors’ herds are more pronounced under a market with higher pressure, and among small stocks following the different feedback strategies in the Taiwan stock market, suggesting that herding behavior plays an important role. It should be noted that, under the constraints of imperfect markets and regulations, beta herding plays a key role in the transmission of the market, particularly when the market is volatile or in extreme movement. By means of time-varying betas of herding based on our rolling forecast method and robustness check of the Markov-switching regression approach for four types of portfolios, we find evidence of the superior forecasting ability of the models, indicating that there are conditional correlations between betas and herding. The evidence also reveals herding formation in Taiwan’s stock markets during the subprime crisis period.
Our research results are important for policymakers and regulators, especially in emerging markets where there are institutional and environmental differences (Chang et al. 2000; Chang 2010). For example, the beta-herding measure for systematic risk factors can be adjusted in terms of portfolio allocations. Policy reforms are conducive to limiting the losses caused by incomplete risk diversification due to the herding desire of investors. Therefore, institutional investors or individual investors should design their investment portfolios or formulate hedging strategies accordingly. Furthermore, considering the measure of herding, it helps improve volatility forecasting and offers economic gains to mean–variance utility investors (Fei and Liu 2021). Future research can be extended to more aspects, for example crisis events such as the COVID-19 crisis. Regarding the model, we suggest that features such as volatility clustering, leverage effects, and jump dynamics relationships can be tested in the model. In addition, one of the limits in the case is that its dynamics are not explained by various macroeconomic and fundamental factors, business cycles, or the instrumental variables that Cederburg and O’Doherty (2016) use as a proxy for time-varying betas.
Author Contributions
Y.-C.C. contributed to the conceptualization, evaluation modelling, and writing of this paper. Y.Z. and H.-C.W. conducted the investigation and formal analysis. Y.-C.C. and S.-M.K. conceived the simulation, evaluation reports and contributed to writing—review and editing. All authors have read and agreed to the published version of the manuscript.
Funding
This research was funded by the Fuzhou University of International Studies and Trade of China (Grant number: FWKQJ201905).
Institutional Review Board Statement
Not applicable.
Informed Consent Statement
Not applicable.
Data Availability Statement
Not applicable.
Acknowledgments
We would like to thank the three anonymous referees and academic editor for many helpful comments. Any remaining errors are solely ours.
Conflicts of Interest
The authors declare no conflict of interest.
References
- Akhtaruzzaman, Md, Sabri Boubaker, and Ahmet Sensoy. 2021a. Financial contagion during COVID-19 crisis. Finance Research Letters 38: 101604. [Google Scholar] [CrossRef] [PubMed]
- Akhtaruzzaman, Md, Sabri Boubaker, Brian M. Lucey, and Ahmet Sensoy. 2021b. Is gold a hedge or a safe-haven asset in the COVID-19 crisis? Economic Modelling 102: 105588. [Google Scholar] [CrossRef]
- Allard, Anne-Florence, Leonardo Iania, and Kristien Smedts. 2020. Stock-bond return correlations: Moving away from “one-frequency-fits-all” by extending the DCC-MIDAS approach. International Review of Financial Analysis 71: 101557. [Google Scholar] [CrossRef]
- Asgharian, Hossein, Ai Jun Hou, and Farrukh Javed. 2013. The Importance of the Macroeconomic Variables in Forecasting Stock Return Variance: A GARCH-MIDAS Approach. Journal of Forecasting 32: 600–12. [Google Scholar] [CrossRef] [Green Version]
- Asgharian, Hossein, Charlotte Christiansen, and Ai Jun Hou. 2015. Effects of macroeconomic uncertainty on the stock and bond markets. Finance Research Letters 13: 10–16. [Google Scholar] [CrossRef] [Green Version]
- Asgharian, Hossein, Charlotte Christiansen, and Ai Jun Hou. 2016. Macro-finance determinants of the long-run stock–bond correlation: The DCC-MIDAS specification. Journal of Financial Econometrics 14: 617–42. [Google Scholar] [CrossRef]
- BenSaïda, Ahmed, Sabri Boubaker, and Duc Khuong Nguyen. 2018. The shifting dependence dynamics between the G7 stock markets. Quantitative Finance 18: 801–12. [Google Scholar] [CrossRef]
- Bikhchandani, Sushil, and Sunil Sharma. 2001. Herd Behavior in Financial Markets. IMF Staff Papers 47: 279–310. Available online: https://www.imf.org/External/Pubs/FT/staffp/2001/01/pdf/Bikhchan.pdf (accessed on 5 December 2021).
- Bikhchandani, Sushil, David Hirshleifer, and Ivo Welch. 1992. A Theory of Fads, Fashion, Custom, and Cultural Change as Informational Cascades. Journal of Political Economy 100: 992–1026. Available online: https://www.jstor.org/stable/2138632 (accessed on 5 December 2021). [CrossRef]
- Bohl, Martin T., Arne C. Klein, and Pierre L. Siklos. 2013. A Markov Switching Approach to Herding. CIGI Papers 21. Available online: https://www.cigionline.org/static/documents/no21_2.pdf (accessed on 5 December 2021).
- Boubaker, Sabri, and Jamel Jouini. 2014. Linkages between emerging and developed equity markets: Empirical evidence in the PMG framework. The North American Journal of Economics and Finance 29: 322–35. [Google Scholar] [CrossRef]
- Bouri, Elie, Riza Demirer, Rangan Gupta, and Jacobus Nel. 2021. COVID-19 pandemic and investor herding in international stock markets. Risks 9: 168. [Google Scholar] [CrossRef]
- Boyer, Brian H., Tomomi Kumagai, and Kathy Yuan. 2006. How do crises spread? Evidence from accessible and inaccessible stock indices. Journal of Finance 61: 957–1003. [Google Scholar] [CrossRef]
- Brooks, Robert D., Robert W. Faff, and Michael D. McKenzie. 1998. Time-Varying Beta Risk of Australian Industry Portfolios: A Comparison of Modelling Techniques. Australian Journal of Management 23: 1–22. [Google Scholar] [CrossRef]
- Cederburg, Scott, and Michael S. O’Doherty. 2016. Does it pay to bet against beta? On the conditional performance of the beta anomaly. The Journal of Finance 71: 737–74. [Google Scholar] [CrossRef]
- Chang, Charles. 2010. Herding and the role of foreign institutions in emerging equity markets. Pacific-Basin Finance Journal 18: 175–85. [Google Scholar] [CrossRef]
- Chang, Eric C., Joseph W. Cheng, and Ajay Khorana. 2000. An examination of herd behavior in equity markets: An international Perspective. Journal of Banking and Finance 24: 1615–79. [Google Scholar] [CrossRef]
- Cheung, Yin-Wong, Menzie D. Chinn, and Antonio Garcia Pascual. 2005. Empirical exchange rate models of the nineties: Are any fit to survive? Journal of International Money and Finance 24: 1150–75. [Google Scholar] [CrossRef] [Green Version]
- Chiang, Thomas C., Bang Nam Jeon, and Huimin Li. 2007. Dynamic correlation analysis of financial contagion: Evidence from Asian markets. Journal of International Money and Finance 26: 1206–28. [Google Scholar] [CrossRef]
- Choi, Kyongwook, and Shawkat Hammoudeh. 2010. Volatility behavior of oil, industrial commodity and stock markets in a regime-switching environment. Energy Policy 38: 4388–99. [Google Scholar] [CrossRef]
- Choudhry, Taufiq, and Hao Wu. 2008. Forecasting Ability of GARCH vs Kalman Filter Method: Evidence from Daily UK Time-Varying Beta. Journal of Forecasting 27: 670–89. [Google Scholar] [CrossRef]
- Christie, William G., and Roger D. Huang. 1995. Following the Pied Piper: Do Individual Returns Herd Around the Market? Financial Analysts Journal 51: 31–37. [Google Scholar] [CrossRef]
- Colacito, Riccardo, Robert F. Engle, and Eric Ghysels. 2011. A component model for dynamic correlations. Journal of Econometrics 164: 45–59. [Google Scholar] [CrossRef] [Green Version]
- Conrad, Christian, Karin Loch, and Daniel Rittler. 2014. On the macroeconomic determinants of long-term volatilities and correlations in US stock and crude oil markets. Journal of Empirical Finance 29: 26–40. [Google Scholar] [CrossRef]
- Demirer, Rıza, Karyl B. Leggio, and Donald Lien. 2019. Herding and flash events: Evidence from the 2010 Flash Crash. Finance Research Letters 31. [Google Scholar] [CrossRef]
- Devenow, Andrea, and Ivo Welch. 1996. Rational Herding in Financial Economics. European Economic Review 40: 603–15. [Google Scholar] [CrossRef]
- Engle, Robert. 2002. Dynamic Conditional Correlation: A Simple Class of Multivariate GARCH models. Journal of Business and Economics Statistics 20: 339–50. Available online: https://www.jstor.org/stable/1392121 (accessed on 5 December 2021). [CrossRef]
- Engle, Robert F., and Kevin Sheppard. 2001. Theoretical and Empirical Properties of Dynamic Conditional Correlation Multivariate GARCH. Discussion Papers. San Diego: Department of Economics, University of California. [Google Scholar] [CrossRef]
- Engle, Robert F., Eric Ghysels, and Bumjean Sohn. 2008. On the economic sources of stock Market volatility. AFA 2008 New Orleans Meetings Paper. [Google Scholar] [CrossRef] [Green Version]
- Faff, Robert W., David Hillier, and Joseph Hillier. 2000. Time Varying Beta Risk: An Analysis of Alternative Modelling Techniques. Journal of Business Finance and Accounting 27: 523–54. [Google Scholar] [CrossRef]
- Fang, Libing, Baizhu Chen, Honghai Yu, and Cheng Xiong. 2018. The effect of economic policy uncertainty on the long-run correlation between crude oil and the US stock markets. Finance Research Letters 24: 56–63. [Google Scholar] [CrossRef]
- Fei, Tianlun, and Xiaoquan Liu. 2021. Herding and market volatility. International Review of Financial Analysis 78: 101880. [Google Scholar] [CrossRef]
- Forbes, Kristin J., and Roberto Rigobon. 2002. No contagion, only interdependence: Measuring stock market co-movements. Journal of Finance 57: 2223–61. [Google Scholar] [CrossRef]
- Guo, Jiaqi, Phil Holmes, and Ali Altanlar. 2020. Is herding spurious or intentional? Evidence from analyst recommendation revisions and sentiment. International Review of Financial Analysis 71: 101539. [Google Scholar] [CrossRef]
- Hamilton, James D. 1989. A new approach to the economic analysis of nonstationary time series and the business cycle. Econometrica: Journal of the Econometric Society 57: 357–84. [Google Scholar] [CrossRef]
- Hansen, Peter R., and Asger Lunde. 2005. A forecast comparison of volatility models: Does anything beat a GARCH (1, 1)? Journal of Applied Econometrics 20: 873–89. Available online: https://www.jstor.org/stable/25146403 (accessed on 5 December 2021). [CrossRef] [Green Version]
- Hsieh, Shu-Fan. 2013. Individual and institutional herding and the impact on stock returns: Evidence from Taiwan stock market. International Review of Financial Analysis 29: 175–88. [Google Scholar] [CrossRef]
- Hwang, Soosung, Alexandre Rubesam, and Mark Salmon. 2021. Beta herding through overconfidence: A behavioral explanation of the low-beta anomaly. Journal of International Money and Finance 111: 102318. [Google Scholar] [CrossRef]
- Hwang, Soosung, and Mark Salmon. 2004. Market Stress and Herding. Journal of Empirical Finance 11: 585–616. [Google Scholar] [CrossRef] [Green Version]
- Kang, Sang Hoon, Sang-Mok Kang, and Seong-Min Yoon. 2009. Forecasting volatility of crude oil markets. Energy Economics 31: 119–25. [Google Scholar] [CrossRef]
- Klein, Arne C. 2013. Time-variations in herding behavior: Evidence from a Markov switching SUR model. Journal of International Financial Markets, Institutions and Money 26: 291–304. [Google Scholar] [CrossRef]
- Kumar, Ashish, K. N. Badhani, Elie Bouri, and Tareq Saeed. 2021. Herding behavior in the commodity markets of the Asia-Pacific region. Finance Research Letters 41: 101813. [Google Scholar] [CrossRef]
- Lakonishok, Josef, Andrei Shleifer, and Robert W. Vishny. 1992. The Impact of Institutional Trading on Stock Prices. Journal of Financial Economics 32: 23–43. [Google Scholar] [CrossRef] [Green Version]
- Lalli, William R. 2011. Handbook of Budgeting, 6th ed. New Rochelle, NY: Wiley Corporate F&A. [Google Scholar]
- Lee, Kyuseok. 2017. Herd behavior of the overall market: Evidence based on the cross-sectional comovement of returns. The North American Journal of Economics and Finance 42: 266–84. [Google Scholar] [CrossRef]
- Scharfstein, David S., and Jeremy C. Stein. 1990. Herd Behavior and Investment. The American Economic Review 80: 465–79. Available online: https://www.jstor.org/stable/2006678 (accessed on 5 December 2021).
- Shyu, Jonchi, and Hsin-Ming Sun. 2010. Do institutional investors herd in emerging markets? Evidence from the Taiwan stock market. Asian Journal of Finance and Accounting 2: 1. [Google Scholar] [CrossRef]
- Tan, Lin, Thomas C. Chiang, Joseph R. Mason, and Edward Nelling. 2008. Herding behavior in Chinese stock markets: An examination of A and B shares. Pacific-Basin Finance Journal 16: 61–77. [Google Scholar] [CrossRef]
- Virk, Nader, and Farrukh Javed. 2017. European equity market integration and joint relationship of conditional volatility and correlations. Journal of International Money and Finance 71: 53–77. [Google Scholar] [CrossRef] [Green Version]
- Wang, Hu, and Shouwei Li. 2021. Asymmetric Volatility Spillovers Between Crude Oil and China’s Financial Markets. Energy 233: 121168. [Google Scholar] [CrossRef]
- Wei, Yu, Yudong Wang, and Dengshi Huang. 2010. Forecasting crude oil market volatility: Further evidence using GARCH-class models. Energy Economics 32: 1477–84. [Google Scholar] [CrossRef]
- Welch, Ivo. 1992. Sequential Sales, Learning and Cascades. Journal of Finance 47: 695–732. [Google Scholar] [CrossRef]
- Wermers, Russ. 1999. Mutual fund herding and the impact on stock prices. Journal of Finance 54: 581–622. [Google Scholar] [CrossRef]
- Zhang, Yuanyuan, and Taufiq Choudhry. 2013. Forecasting the daily dynamic hedge ratios by GARCH models: Evidence from the agricultural futures markets. The European Journal of Finance 21: 376–99. [Google Scholar] [CrossRef]
- Zhou, Rhea Tingyu, and Rose Neng Lai. 2009. Herding and information based trading. Journal of Empirical Finance 16: 388–93. [Google Scholar] [CrossRef]
Figure 1.
The covariance of the DCC-MIDAS model between the portfolios and CDAD during the full periods (2000–2014).
Figure 1.
The covariance of the DCC-MIDAS model between the portfolios and CDAD during the full periods (2000–2014).

Figure 2.
The covariance of the DCC-MIDAS model between the portfolios and CDAD during the subprime periods (2007–2008).
Figure 2.
The covariance of the DCC-MIDAS model between the portfolios and CDAD during the subprime periods (2007–2008).

Figure 3.
The time-varying beta herding for a rolling forecast of 5 (green lines) and 10 days (red lines) of estimation compared to the actual Taiwan market index (blue lines).
Figure 3.
The time-varying beta herding for a rolling forecast of 5 (green lines) and 10 days (red lines) of estimation compared to the actual Taiwan market index (blue lines).
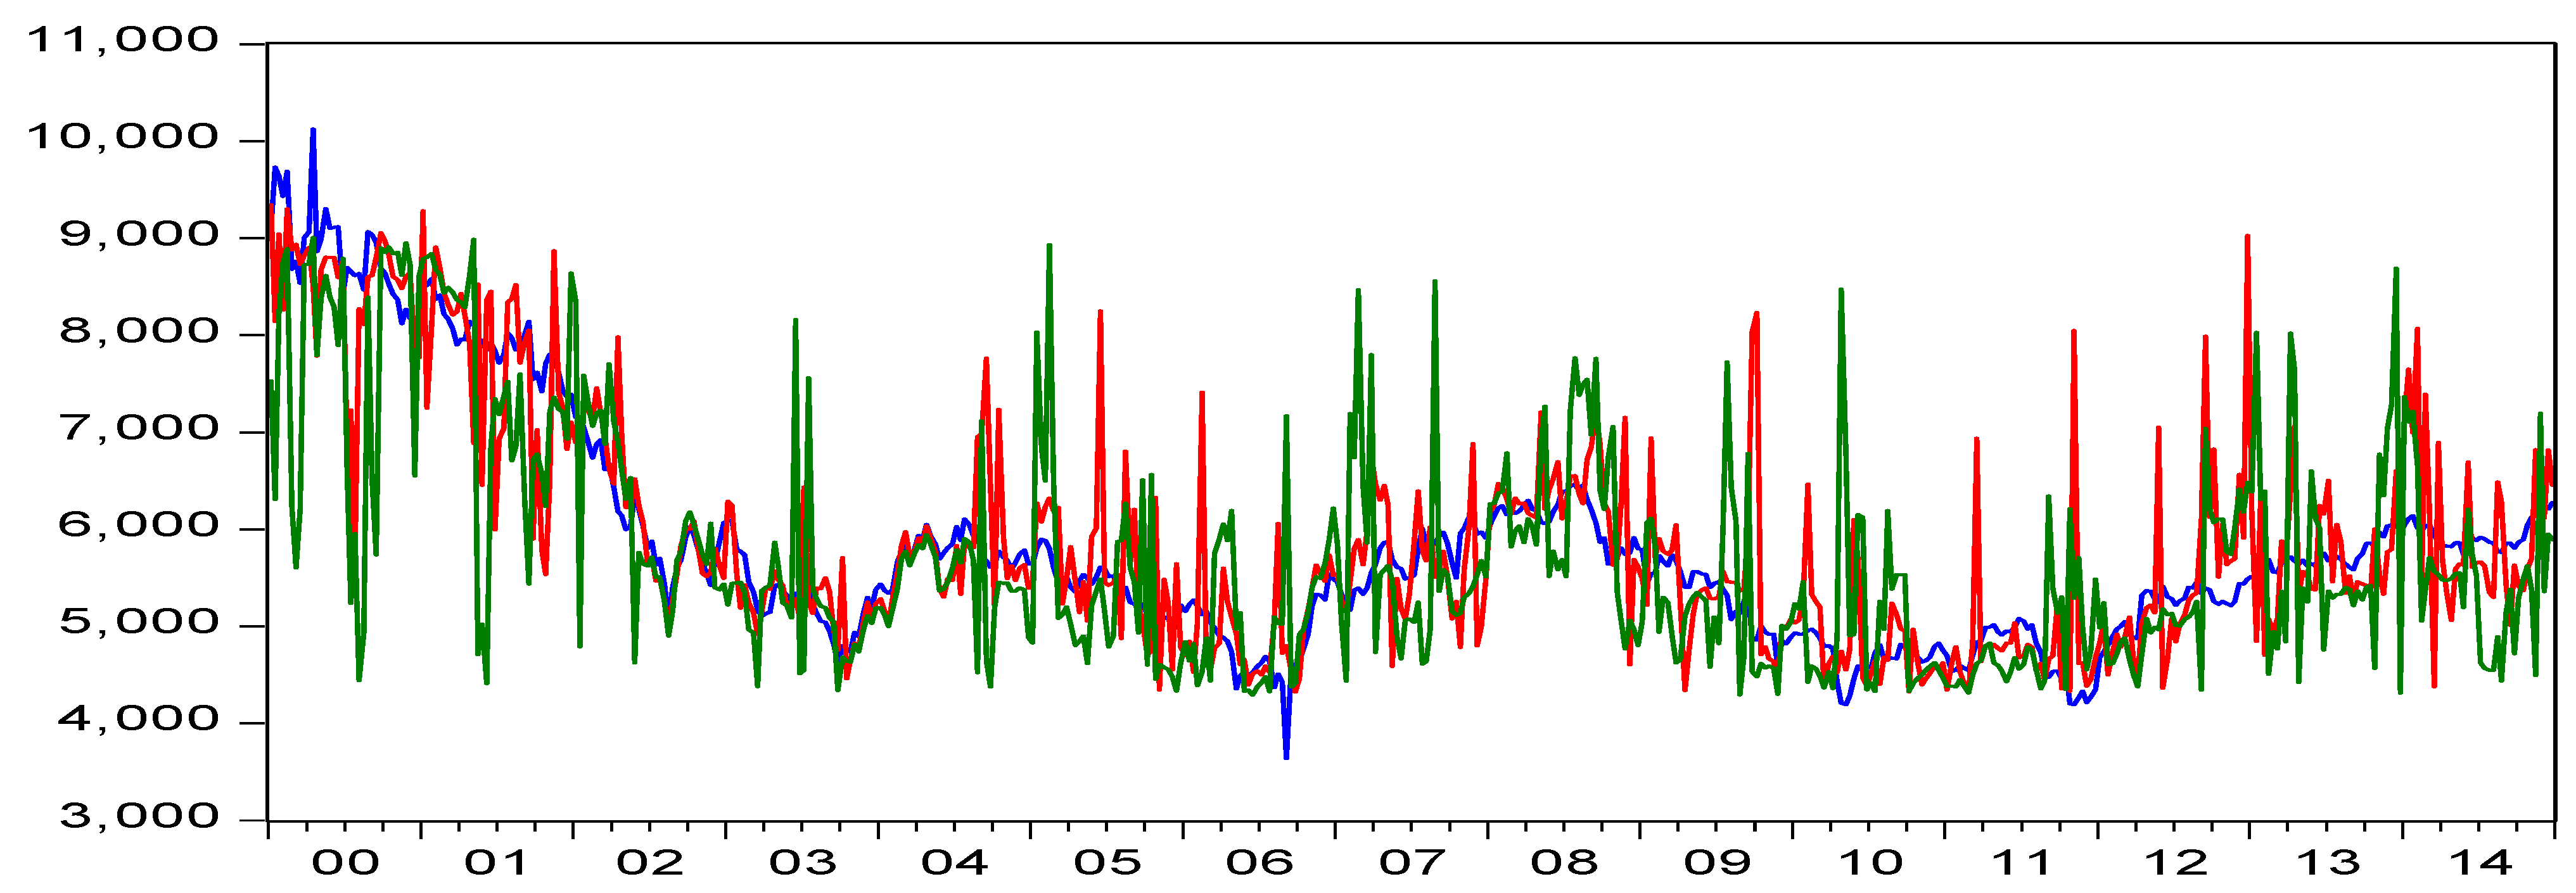
Figure 4.
Shows the robustness results of the Markov-switching approach. P( indicates regime one; P( indicates regime two.
Figure 4.
Shows the robustness results of the Markov-switching approach. P( indicates regime one; P( indicates regime two.

Table 1.
A summary of statistics and results of unit root tests.
| Mean | 0.019 | 0.071 | 0.080 | 0.138 | 0.160 | 0.066 |
| Mid | 0.018 | 0.254 | 0.197 | 0.557 | 0.418 | 0.132 |
| Max | 0.047 | 0.116 | 0.066 | 0.062 | 0.065 | 0.067 |
| Min | 0.004 | −0.090 | −0.067 | −0.065 | −0.066 | −0.067 |
| Std. Dev. | 0.005 | 0.013 | 0.015 | 0.013 | 0.016 | 0.015 |
| Kurtosis | 1.010 | 0.071 | −0.076 | −0.549 | −0.253 | 0.007 |
| Skewness | 4.376 | 10.811 | 5.469 | 5.590 | 5.041 | 5.453 |
| Jarque–Bera | −27.43 *** | −21.38 *** | −21.46 *** | −31.29 *** | −31.40 *** | −21.74 *** |
| Obs. | 3746 | 3746 | 3746 | 3746 | 3746 | 3746 |
Notes: Asymptotic critical values for the ADF test are −3.43, −2.86 and −2.57 at the 1%, 5% and 10% significance levels, respectively. *** p < 1%.
Table 2.
The Pearson correlation coefficients.
| 1.000 | ||||||
| −0.008 | 1.000 | |||||
| −0.011 | 0.998 | 1.000 | ||||
| −0.043 | 0.800 | 0.801 | 1.000 | |||
| −0.009 | 0.839 | 0.833 | 0.900 | 1.000 | ||
| −0.009 | 0.977 | 0.980 | 0.740 | 0.738 | 1.000 |
Notes: Our sample, by definition, ranks the top 50% of capitalization in the market to create “large” portfolios and the last 50% to create “small” portfolios, while ranking the top 30% of B/M ratio to create “growth” portfolios and the last 30% to create “value” portfolios.
Table 3.
Results of the maximum likelihood estimation of the DCC-MIDAS model between the CSAD and market returns during the full and subprime crisis periods.
Table 3.
Results of the maximum likelihood estimation of the DCC-MIDAS model between the CSAD and market returns during the full and subprime crisis periods.
| Full Periods | Subprime Crisis Periods | |||
|---|---|---|---|---|
| Variable | Cov. (Raw Return & CSAD) of DCC-MIDAS | Cov. (Raw Return & CSAD) of DCC-MIDAS | ||
| Panel 1: Taiwan market returns | ||||
| A | 0.2907 *** | (0.0233) | 0.0263 *** | (0.0771) |
| B | 0.6717 *** | (0.0206) | 0.9611 *** | (0.0099) |
| Omega | −0.0207 *** | (0.0148) | 0.7845 *** | (0.0327) |
| AIC | −14.1036 | −13.1423 | ||
| Panel 2: Large portfolio | ||||
| A | 0.0859 *** | (0.0054) | 0.2353 *** | (0.0685) |
| B | 0.9040 *** | (0.0064) | 07277 *** | (0.0505) |
| Omega | −0.3186 *** | (0.0287) | −0.0503 *** | (0.0647) |
| AIC | −13.4209 | −13.525 | ||
| Panel 3: Small portfolio | ||||
| A | 0.2853 *** | (0.0166) | 0.1387 *** | (0.0293) |
| B | 0.6822 *** | (0.0198) | 0.7637 *** | (0.0582) |
| Omega | −0.0336 *** | (0.0198) | −0.1679 *** | (0.0558) |
| AIC | −13.6953 | −13.1546 | ||
| Panel 4: Growth portfolio | ||||
| A | 0.0604 *** | (0.0111) | 0.2357 *** | (0.0687) |
| B | 0.9358 *** | (0.0101) | 0.7273 *** | (0.0505) |
| Omega | −0.0133 *** | (0.0498) | −0.0397 *** | (0.0668) |
| AIC | −13.1631 | −13.4491 | ||
| Panel 5: Value portfolio | ||||
| A | 0.2907 *** | (0.0233) | 0.2361 *** | (0.0671) |
| B | 0.6722 *** | (0.204) | 0.7277 *** | (0.0502) |
| Omega | −0.0460 *** | (0.0141) | −0.1230 *** | (0.0602) |
| AIC | −13.8399 | −13.3731 | ||
Note: this table shows the estimator coefficients which we estimate as DCC-MIDAS model for each type of market portfolio by using the data from full periods (2000–2014) and the subprime crisis periods (2007–2008). A and B are the parameters of the variance of short-term correlation and Omega is the estimated weight parameter. (.) denotes standard errors. *** p < 1%.
Table 4.
Basic statistics of time-varying beta of herding for a rolling forecast of 5 and 10 days during the full and subprime crisis periods.
Table 4.
Basic statistics of time-varying beta of herding for a rolling forecast of 5 and 10 days during the full and subprime crisis periods.
| Mean | Variance | Skewness | Kurtosis | JB | |
|---|---|---|---|---|---|
| Full periods | |||||
| Raw_tw | −0.0693 | 0.0278 | 0.0566 | 16.6787 | 421.0217 *** |
| 5 days | −0.0976 | 0.1266 | −0.3291 | 7.3884 | 443.1247 *** |
| 10 days | −0.0407 | 0.1552 | 0.0178 | 7.3887 | 443.1654 *** |
| Subprime crisis | |||||
| Raw_tw | −0.4440 | 0.0256 | 0.1707 | 4.2872 | 12.1188 ** |
| 5 days | −0.2097 | 0.1475 | −0.1530 | 6.4298 | 81.0289 *** |
| 10 days | −0.0428 | 0.1475 | 0.8753 | 6.2380 | 92.58827 *** |
| Up days | |||||
| Raw_tw | 0.0119 | 0.0144 | 4.8033 | 50.8732 | 1133.457 *** |
| 5 days | 0.0357 | 0.1019 | 1.7465 | 7.9026 | 1573.286 *** |
| 10 days | 0.0418 | 0.1221 | 2.0291 | 8.0699 | 1831.033 *** |
| Down days | |||||
| Raw_tw | −0.0130 | 0.0158 | −3.7524 | 28.4727 | 3061.683 *** |
| 5 days | −0.0092 | 0.1349 | −0.1578 | 8.1069 | 1136.689 *** |
| 10 days | −0.0134 | 0.1445 | −0.1700 | 7.6447 | 941.6837 *** |
Note: this table shows the simulated results for two frequencies of 5 and 10 days of datasets from the DCC-MIDAS model. Up (Down) days indicate a positive (negative) return in the stock market on day t. ** p < 5%, *** p < 1%.
Table 5.
The robustness results of the Markov regime-switching approach for beta-herding series.
| Probability Parameters | Transition Probability (Regime 1) | Transition Probability (Regime 2) | ||||
|---|---|---|---|---|---|---|
| 0.0369 | −1.0086 *** | 1.2016 *** | −4.4443 *** | 0.5092 | 0.4907 | |
| 0.0982 | −0.1151 *** | 0.1426 *** | −5.3608 *** | 0.5245 | 0.4754 | |
| −3.2619 *** | −0.0291 *** | −0.0052 | −5.6868 *** | 0.9853 | 0.0146 | |
| −4.3956 *** | 1.7039 *** | −0.8776 *** | −4.3956 *** | 0.4117 | 0.5882 | |
| 3.2365 *** | 0.0006 | −0.0097 * | −5.6863 *** | 0.9621 | 0.0378 |
Notes: the estimated model is in the following: where In the robustness equation, is the state (regime) variable. The state variable assumes a value of 1 or 2 and follows the transition probabilities is the probability of , and indicate the parameter of the transition probability of regime 1, regime 2 and error term, respectively. *** p < 1, * p < 10%.
Publisher’s Note: MDPI stays neutral with regard to jurisdictional claims in published maps and institutional affiliations. |
© 2021 by the authors. Licensee MDPI, Basel, Switzerland. This article is an open access article distributed under the terms and conditions of the Creative Commons Attribution (CC BY) license (https://creativecommons.org/licenses/by/4.0/).
Share and Cite
MDPI and ACS Style
Chen, Y.-C.; Wu, H.-C.; Zhang, Y.; Kuo, S.-M. A Transmission of Beta Herding during Subprime Crisis in Taiwan’s Market: DCC-MIDAS Approach. Int. J. Financial Stud. 2021, 9, 70. https://doi.org/10.3390/ijfs9040070
AMA Style
Chen Y-C, Wu H-C, Zhang Y, Kuo S-M. A Transmission of Beta Herding during Subprime Crisis in Taiwan’s Market: DCC-MIDAS Approach. International Journal of Financial Studies. 2021; 9(4):70. https://doi.org/10.3390/ijfs9040070
Chicago/Turabian StyleChen, Yi-Chang, Hung-Che Wu, Yuanyuan Zhang, and Shih-Ming Kuo. 2021. "A Transmission of Beta Herding during Subprime Crisis in Taiwan’s Market: DCC-MIDAS Approach" International Journal of Financial Studies 9, no. 4: 70. https://doi.org/10.3390/ijfs9040070
Note that from the first issue of 2016, this journal uses article numbers instead of page numbers. See further details here.