
Exchange Rate Regimes in India: Central Bank Interventions and Purchasing Power Parity in the Context of ASEAN Currencies


1
Cranfield School of Management, Cranfield University, Cranfield MK43 0AL, UK
2
Black Sea Trade and Development Bank, Financial Analysis & Risk Division & Benbow, 54624 Thessaloniki, Greece
*
Author to whom correspondence should be addressed.
Economies 2024, 12(4), 96; https://doi.org/10.3390/economies12040096
Submission received: 28 February 2024
/
Revised: 9 April 2024
/
Accepted: 16 April 2024
/
Published: 19 April 2024
(This article belongs to the Collection International Financial Markets and Monetary Policy)
Abstract
:In this study spanning four decades, we explored the relationship between the Reserve Bank of India’s (RBI) interventions and the validity of Purchasing Power Parity (PPP) across two distinct exchange rate regimes: the fixed exchange rate regime (1975–1993) and the managed floating regime (1994–2015). Applying an error correction model (VECM), our analysis reveals that under the fixed exchange rate regime, the environment is conducive to PPP due to frequent interventions by the RBI. However, in the managed floating regime, selective interventions weaken the applicability of PPP. These findings align with prior research but also hint at the limitations of linear models in capturing the intricate dynamics of PPP when central banks are involved. Nonlinear models may hold the key to unraveling the relationship more effectively.
Keywords:
purchasing power parity; India; central bank interventions; foreign exchange rate; ASEAN; VECMJEL Classification:
E31; F31; F15; C321. Introduction
Purchasing Power Parity (PPP) stands as a cornerstone in international economics, with roots dating back to the early 20th century. Over the past century, this theory has garnered substantial attention and remains a pivotal topic in exchange rate discourse. At its core, PPP posits that, absent transportation costs and trade barriers, identical goods should carry the same price across countries when converted to a common currency. Economists employ this framework to analyze price disparities between nations and monitor enduring shifts in currency exchange rates. While there is consensus within the financial community about PPP’s limitations in predicting short-term exchange rate fluctuations, the crux of the debate lies in its long-term validity. Despite short-lived deviations caused by external shocks and speculative bubbles, the persistence of these deviations over extended periods raises intriguing questions. Researchers, including Rogoff (1996), dubbed this phenomenon the “PPP puzzle”. Empirical studies have grappled with whether exchange rates ultimately revert to their long-term equilibrium, yielding a mix of results.
As a rapidly growing economy, India has witnessed active intervention by its central bank, the RBI, in the currency market. This intervention intensified following the liberalization reforms of the 1990s. The transition from a fixed exchange rate regime to a managed floating rate regime significantly impacted the behavior of the Indian Rupee (INR). Consequently, India serves as an intriguing case study for examining deviations from PPP arising from government or central bank actions. Historically, India adhered to a de facto pegged exchange rate system. However, the economic reforms and liberalization policies of the 1990s gradually shifted the country toward a managed floating regime. While market forces largely determine the INR’s exchange rate, the RBI occasionally intervenes to maintain stability and mitigate excessive volatility. Notably, India’s approach differs from that of other Asian nations, which often intervene due to a “fear of appreciation” in their currencies.
India’s relationship with the Association of Southeast Asian Nations (ASEAN) has historically been deep-rooted and influenced by cultural, geographical, and political linkages that span centuries. Over the past three decades, this bond has evolved into a dynamic economic and strategic partnership. India’s “Look East” policy, initiated in the early 1990s, intensified efforts to strengthen ties with the ASEAN bloc. These nations collectively serve as crucial trading partners for India, driving economic growth and enhancing regional stability and cooperation. As the global economic landscape shifts, the India-ASEAN connection underscores the need to comprehend intricate financial instruments, including exchange rate mechanisms.
The existing literature on PPP in India (Kohli 2002; Al-Gasaymeh et al. 2019; Islam 2013) revealed nuanced variations in its validity across different partner countries, shedding light on the intricate interplay of trade dynamics, political relationships, and economic policies. However, amidst these discussions, a notable gap persists in the examination of the influence of central bank policies on PPP, particularly within the context of comparative analyses encompassing diverse exchange rate regimes. This gap gains significance when considering the pivotal role of emerging economies, such as India and ASEAN countries, in the global economic landscape. Despite their rapid economic growth and substantial influence on global economics, these economies remain inadequately represented in current PPP studies. Therefore, there exists a pressing need to delve into the dynamics between central bank interventions, PPP, and exchange rate regimes within these regions to enrich academic discourse and provide a more comprehensive understanding of PPP dynamics in emerging markets.
This paper aims to address a specific gap by examining how central bank interventions impact the validity of PPP between the Indian Rupee and selected ASEAN currencies. While existing studies predominantly focus on PPP using major global currencies (Kyei-Mensah 2023), less attention has been given to the relationships between emerging economies like India and the ASEAN countries. Additionally, limited research evaluates the long-term and short-term validity of PPP in light of central bank interventions, particularly those by the RBI. The empirical analysis spans four decades (1975–2015), allowing a comprehensive exploration of India’s two distinct exchange rate regimes: the fixed regime (1975–1993) and the managed floating regime (1994–2015).
This study delves into the validity of PPP across diverse exchange rate systems, enriching scholarly discourse in a new geographical perspective. By investigating this in a new context, the research contributes significantly to academic dialogue. Moreover, it holds implications for policymakers in emerging economies like India and ASEAN countries. These insights are crucial for crafting strategies that sustain currency stability and foster economic growth.
The paper primarily targets policymakers dealing with monetary policy and exchange rate management. It explores the intricate landscape of PPP validity within two exchange rate regimes. The findings serve as a robust platform, offering valuable guidance to policymakers in these economies. The paper is structured as follows: Section 2 provides a brief literature review followed by a discussion on the exchange rate regimes in relation to the PPP and the RBI’s role in exchange rate management, leading to the development of the testable hypotheses. Section 3 presents the data and the methodology, while Section 4 reports and discusses the findings. Section 5 provides the concluding remarks.
2. Literature Review
The PPP theory, which asserts that a unit of currency should possess equal purchasing power across different countries, stands as a foundational concept in international economics. Its origins trace back to Swedish economist Cassel’s writings during the 1920s, but its significance surged after World War II within the framework of the Bretton Woods agreement.
Initially, a group of empirically informed economists treated PPP as a short-term proposition. However, others believed it could anchor long run Real Exchange Rates (Rogoff 1996). This discrepancy led to a consensus that PPP primarily operates as a long-term phenomenon.
While PPP remains valuable in international economics, it faces limitations. Real-world factors such as transportation costs, trade barriers, and non-traded goods disrupt its universal applicability (as noted by Taylor and Taylor 2004). Furthermore, deviations from PPP can endure over extended periods. Engel and Rogers (1996) demonstrated this phenomenon by analyzing price disparities among similar goods across cities in the United States and Canada. Their evidence supported the theory that transaction costs play a role in disrupting price parity. Additionally, they observed the “border effect,” where price differentials tend to increase with greater geographical distance between cities in different countries.
In addition to real-world barriers, researchers also highlighted the pivotal role of market segmentation and pricing to market practices in constraining the validity of PPP beyond real-world barriers. Krugman (1987) highlights that companies often adjust their prices based on local market conditions. This practice prevents prices from aligning uniformly across different countries. Consequently, PPP deviations emerge due to these localized pricing dynamics. Balassa (1964) and Samuelson (1964) delve into varying productivity growth across sectors. They emphasize the distinction between “tradable” and “non-tradable” goods. When a country’s tradeable sector experiences rapid productivity growth, wages rise swiftly. These higher wages extend to the non-tradable sector, causing inflationary pressures. As a result, even if similar traded goods are exchanged internationally, the non-tradable sector’s elevated prices contribute to overall deviations in PPP—the so-called Balassa–Samuelson effect. While relative PPP provides a theoretical framework for understanding the link between inflation and exchange rates, its practical predictive power faces limitations. Market frictions introduce complexities, hindering accurate real-world forecasts (as noted by Lothian and Taylor 2008).
Obstfeld and Rogoff (2001) highlight additional limitations arising from non-tradable goods. These can lead to substantial price differentials across economies. Furthermore, the choice of the consumption basket influences the Real Exchange Rate (RER) under PPP, potentially causing deviations.
The Balassa–Samuelson effect challenges relative PPP by asserting that countries with greater productivity growth may witness an appreciation of their RER. This dynamic underscores the intricate interplay between economic factors and exchange rates.
In summary, while PPP remains a valuable concept, its application encounters multifaceted realities in the global marketplace. While proponents of the theory argue that PPP provides a solid basis for determining exchange rates, a plethora of empirical research demonstrates persistent deviations from PPP (Ong 2003), given the issue of productivity bias and market imperfections.
2.1. Exchange Rate Regimes and PPP
The complex interplay between different exchange rate regimes and PPP theory forms a significant field of study in international economics. Over time, a plethora of studies illuminated diverse perspectives on the relationship between these two fundamental components. Exchange rate regimes define the rules governing a country’s currency performance relative to other currencies. These regimes can broadly be categorized as follows:
In a fixed exchange rate regime, the government or central bank establishes and maintains an official exchange rate for its currency relative to a foreign reference currency. To uphold this pegged exchange rate, they actively intervene in the foreign exchange market by buying or selling domestic currency. Lothian and McCarthy (2002) observed that Real Exchange Rates (RERs) within currency unions—specifically a type of fixed exchange rate regime—exhibit less variability compared to other systems. This phenomenon can be attributed to the absence of monetary shocks within the union, leading to reduced RER variability. Additionally, historical economic ties among union members contribute to lower shock impact, further stabilizing RERs. Sarno and Valente (2006) also explored the validity of PPP theory across different exchange rate regimes. Analyzing data spanning over a century from G5 countries, they confirmed the long run validity of PPP across the studied exchange rates. Under fixed exchange rate regimes, it is primarily relative prices that adjust to restore equilibrium when deviations from PPP occur. Lin and Lin (2013) investigated Taiwan’s exchange rate behavior under both fixed and managed floating systems. Their research revealed that PPP was more robustly established in the fixed system, while its validity was less pronounced in the managed floating system over the long term.
Unlike a fixed exchange rate regime, where the government or central bank maintains an official exchange rate, the floating exchange rate regime allows currency values to fluctuate based on market supply and demand forces, free from direct intervention. In the short run, exchange rates within a floating system often deviate significantly from the predictions of PPP. However, over the long term, these deviations tend to average out, leading actual exchange rates to converge toward PPP-implied rates. Sarno and Valente (2006) discovered that during periods of flexible exchange rates, the exchange rates themselves play a crucial role in adjusting to restore equilibrium. This observation underscores the relevance of PPP even in a flexible exchange rate system, where disruptions are swiftly resolved. Furthermore, Huang and Yang (2015) explored how changes in exchange rate management impact PPP. When exchange rates float freely based on market forces, they adjust more efficiently to maintain PPP. Another exchange rate regime worth noting is the managed floating regime, where a country’s central bank intervenes only during substantial exchange rate shocks. Lin and Lee (2016) studied Taiwan’s exchange rate behavior under both fixed and managed floating systems. They found that PPP holds more robustly under a fixed system but is only partially established in a managed floating system. Additionally, the Taiwan dollar (NTD) responds faster to larger shocks in both regimes. Asymmetries in exchange rate reactions to positive and negative shocks were attributed to direct interventions in the RER.
Despite a substantial body of research supporting the validity of PPP across various exchange rate regimes, the actual behavior of exchange rates remains complex, yielding mixed results. As emphasized by Lothian (2016), PPP transcends the mere application of the Law of One Price (LOP); it integrates into a broader monetary equilibrium model, demanding thoughtful consideration within that framework.
2.2. Central Bank Interventions, Nonlinearities, and PPP
Central banks periodically intervene in foreign exchange markets, either directly or indirectly, to maintain economic equilibrium within their countries. The theory of PPP suggests that exchange rates should adjust to reflect changes in price levels among countries. However, central bank interventions often disrupt the natural market forces of supply and demand.
For instance, in a fixed exchange rate system, central banks are more likely to intervene to uphold the fixed rate. This intervention can hinder the establishment of long-term PPP. Conversely, in a floating exchange rate system, market forces play a larger role, potentially allowing PPP to hold over time. These dynamics significantly impact exchange rate behavior, prompting questions about PPP’s validity in the involved countries and raising the possibility of various nonlinearities in exchange rate PPP.
Taylor and Taylor (2004) emphasized that conventional analysis and prior PPP research assumed linear exchange rate adjustments. This implies a constant convergence speed toward PPP, regardless of the extent of current deviations from the PPP exchange rate. However, Heckscher (1916) proposed that adjustments might be nonlinear due to transaction costs in international arbitrage. Researchers have since formalized this concept, recognizing a “band of inaction”. Within this band, moving goods between countries becomes prohibitively costly, allowing prices to remain different without arbitrage opportunities being exploited.
Apart from transaction costs, central bank interventions can also trigger nonlinear adjustments in exchange rates. In their empirical analysis, Dutta and Leon (2002) explored the relationship between PPP and central bank interventions across 27 countries, including G7 nations and emerging economies. Their findings revealed evidence of a “fear of floating” among these countries. This term denotes a reluctance to allow currency values to fluctuate freely in the foreign exchange market due to apprehensions about depreciation. These interventions introduce asymmetries in the speed of convergence toward PPP.
Interestingly, Dutta and Leon (2002) also observed that central bank actions had minimal impact on PPP in certain countries, suggesting that these central banks lacked significant influence over exchange rates.
In another study, Unkovski (2004) examined central bank interventions and the PPP relationship in the South African Rand during the Rand crash between 1998 and 2003. The Rand experienced significant weakening during this period, prompting central bank interventions to stabilize the currency. Surprisingly, PPP did not hold during this tumultuous phase. However, once the central bank adopted a non-interventional stance in 2001, the RER began recovering and gradually moved toward the long run PPP trend.
Apart from transaction costs, central bank interventions can also induce nonlinear adjustments in exchange rates. Dutta and Leon (2002) investigated the relationship between PPP and Central bank interventions in 27 countries, including G7 and some emerging economies. They found evidence of a “fear of floating” among these. A “fear of floating” refers to a country’s reluctance to let the currency value fluctuate freely in the foreign exchange market out of fear that the currency may depreciate. These interventions can cause some asymmetries in the speed of convergence to PPP. However, they also found that in some countries, the actions of central banks did not affect PPP much, suggesting that the central banks in these economies did not have a strong influence over exchange rates. In another instance, Unkovski (2004) studied the central bank intervention and PPP relationship in South African Rand during the Rand crash between 1998 and 2003. The Rand weakened significantly during this period, and the central bank intervened to stabilize the currency. They found that PPP did not hold during this period. Once the central bank adopted a non-interventional stance in 2001, the author noticed that the RER started recovering and began moving towards the long run PPP trend.
Later, Levy-Yeyati and Sturzenegger (2007) and Pontines and Rajan (2011) observed that central banks often intervene in foreign exchange markets when their home currency appreciates. Emerging Asian economies, in particular, demonstrated a “fear of appreciation”. In this scenario, countries react to prevent their currency from increasing in value. This concern is especially relevant for export-oriented economies, where a stronger currency can make exported goods more expensive and less competitive, impacting overall exports.
Lin and Lee (2016) studied the New Taiwanese Dollar during both fixed and floating rate regimes. Under the fixed system, long run PPP held true, especially when the central bank frequently intervened to maintain stability. However, during the floating rate regime, central bank interventions occurred only when deviations from equilibrium were significant. Consequently, the evidence of PPP was not as robust.
These insights highlight the delicate balance central banks strike between currency stability and economic competitiveness.
2.3. The Empirical Literature for Testing PPP
Influenced by Nelson and Plosser (1982) and Dickey and Fuller (1979), the unit root tests emerged in the 1980s as a notable econometric method for investigating PPP’s long run validity. Τhe unit root tests were based on the notion that many macroeconomic variables, including exchange rates and prices, are potentially non-stationary. Frankel (1986) used this approach and found support for PPP in the long run, proposing that relative PPP could hold over extended periods rather than smaller durations. Various studies, e.g., Taylor (1988), refuted the hypothesis of a unit root in the RER for several OECD countries over the long run. This inconsistency led to questions about the statistical power of these tests. Some researchers, like Frankel (1986), emphasized that a failure to reject the null hypothesis does not inherently prove it. The statistical power of these tests was often hampered by limited sample periods, leading to suggestions that the tests might be insufficient to detect any mean reversions (Lothian and Taylor 1997; Sarno and Taylor 2002).
Zayed and Zahan (2017) utilize cointegration testing to explore the relationship between the Korea–US exchange rate and prices, as well as the economic dynamics in Bangladesh. Their findings indicate the presence of a long run relationship between exchange rates and inflation. Regarding the estimation of PPP, it is crucial to note that any measurement errors in one country can have widespread effects, impacting not only poverty estimates within that country but also influencing PPP estimates across other nations. This interconnectedness underscores the significance of PPP, as highlighted by Moatsos (2020), emphasizing that errors in one country can propagate throughout the entire PPP estimation process, affecting multiple economies.
To tackle this issue, some researchers turned to panel data analysis, which involves utilizing a broader range of data or an increased number of exchange rates. Enders (2015) proposed that panel unit root tests considering cross-sectional dependence among countries may possess greater power in identifying mean-reverting properties of RERs, which is crucial for PPP. However, this approach encountered challenges, including inconsistencies in long-term data across various exchange rate regimes, potential structural shifts in the economy affecting the equilibrium RER, and errors arising from assuming the stationarity of all series in the panel (Lin and Lee 2016).
Furthermore, Kyei-Mensah (2023) investigated whether PPP holds in major advanced and developing economies over the long run. Employing a novel approach combining smooth time-varying cointegration (TVC) and time-varying detrended fluctuation analysis (DFA) methodologies failed to establish PPP’s long run validity. However, both the VAR model and TVC tuned out to provide strong evidence supporting PPP’s role in determining equilibrium exchange rates across the 15 countries studied. Additionally, DFA results and Hurst exponents for RER are examined, contributing further insights into PPP dynamics.
Further studies, such as Sarno and Valente (2006), argue that RER demonstrates nonlinear mean reversion dynamics, exhibiting structural changes in different periods. Several researchers (Taylor et al. 2001; Nikolaou 2008) discovered that the speed of convergence or mean reversion is not constant but varies on the degree of RER deviation from its equilibrium level. Nikolaou (2008) found some evidence that the speed of mean reversion may be faster when the deviation of RER from its equilibrium is larger, especially in cases of extreme shocks. These tests require more powerful nonlinear models that can account for such asymmetrical adjustments. A significant body of the literature has evolved around developing nonlinear process models for RERs. Studies by authors such as Kapetanios et al. (2003) emphasized the utility of the Exponential Smooth Transition Autoregressive (ESTAR) unit root testing procedure in capturing mean-reverting tendencies in the presence of nonlinearities. Kruse (2011) improves upon Kapetanios et al. (2003) research by introducing a more robust test with the ESTAR function. This enhanced approach provides strong evidence supporting the PPP hypothesis specifically for EU countries.
Additionally, some researchers proposed alternative nonlinear models to understand exchange rate dynamics better. For example, Markov-switching unit root tests and quantile unit root tests have been utilized by Kanas (2006) and Bahmani-Oskooee and Ranjbar (2016), among others. They come to similar conclusions: RERs exhibit nonlinear, stationary processes over the steady-state equilibrium.
Furthermore, Oh et al. (2018), by enhancing threshold cointegration tests to bolster their testing power and by employing the methodology pioneered by Lee and Lee (2015), found that this modified test significantly boosts testing efficacy. Enders and Chumrusphonlert (2004) utilized a threshold cointegration approach to analyze the long run PPP in Pacific nations. They established symmetric and asymmetric adjustments, which tend to result in two-sided tests of long run PPP, typically rejecting the hypothesis. Zayed et al. (2018), employing Johansen’s long run cointegration test, establish a persistent long run relationship among variables, indicating a lack of support for PPP in Bangladesh over extended periods. Finally, Yıldırım (2017) argues that nonlinear unit root tests provide stronger evidence in favor of PPP, contrary to the non-rejection of unit roots indicated by standard Dickey–Fuller tests. However, rejecting the PPP assumption does not render the unit root method invalid; rather, it potentially highlights issues of under-specification inherent in standard unit root tests.
In the majority of these studies, another factor considered is the “half-life” of mean reversion, which represents the time taken for an exchange rate to revert halfway back to its equilibrium level after experiencing a shock. It helps quantify the speed of adjustment in the exchange rates. However, the existence of half-life mean reversion is dependent upon the currency’s exchange rates reverting to equilibrium. In cases where exchange rates exhibit a unit root, the effects of shocks to the exchange rates can be permanent, implying that the exchange rate may not revert to its mean, and the concept of a half-life does not apply. Rogoff (1996) investigated the long run PPP mean reversion using the panel unit root tests and noted that the half-life adjustments were typically between three and five years. At the same time, researchers such as Murray and Papell (2005) found half-life reversions to be longer than five years.
2.4. The Role of the Reserve Bank of India in Exchange Rate Management
Since India’s economic liberalization in the 1990s, the RBI has played a pivotal role in shaping the country’s exchange rate policy (Tripathy et al. 2013). In 1993, India officially transitioned from a fixed peg system to the US dollar to a “market-determined exchange rate” system. However, the active involvement of the RBI in the foreign exchange market has resulted in a de facto managed floating exchange rate system rather than a fully market-based one (Patnaik and Sengupta 2021). The RBI’s primary objective for intervention is to “contain volatility” (Patnaik 2005). This involves asymmetric interventions, such as purchasing US dollars and selling Rupees, to prevent excessive currency appreciation (Gupta and Sengupta 2013). While the RBI’s managed float policy aims for stability, it can introduce nonlinearities in exchange rate adjustments, potentially impacting the validity of PPP. For instance, Gupta and Sengupta (2013) provide evidence that the RBI intervenes asymmetrically to prevent currency appreciation. It is noted that the IMF (2004) classified India’s de facto ERR as “managed floating with no pre-determined path for the exchange rate”. The empirical literature classified India’s exchange rate regime (ERR) as de facto pegged to the USD in the post-liberalization period (Patnaik 2005; Patnaik and Shah 2009; Zeileis et al. 2010). Using data on market-determined parallel exchange rates, Reinhart and Rogoff (2004) classify India’s de facto ERR in the post-liberalization period as a “peg to US dollar” from August 1991 to June 1995 and a crawling peg to the US dollar from July 1995 to December 2001. Calvo and Reinhart (2002) find that currency flexibility in India has not changed in the 1979–1999 period despite the move to a “market-determined” ERR in 1993.
Various studies sought to validate the PPP hypothesis in India, yielding mixed results. Tiwari et al. (2019) examined PPP, focusing on the exchange rates of the Indian Rupee vis-à-vis the USD, Pound Sterling, Yen, and Euro. Their findings suggest a cointegrating relationship between the variables of the Indian Rupee and the Japanese Yen, providing support for PPP between these nations. Conversely, Tiwari and Shahbaz (2014) analyzed PPP for India in relation to Hong Kong, Saudi Arabia, Singapore, the UK, and the US. Their findings rejected the PPP hypothesis for India’s relations with these major trading partners, indicating high barriers to trade in intermediate goods. Research conducted by Al-Gasaymeh et al. (2019) corroborated the validity of PPP between India and Pakistan, indicating that despite geopolitical tensions, their economies are interconnected. A study by Kohli (2002) explored mean reversion in India’s RERs post-1993 when the exchange rate regime changed. The findings indicated mean reversion for CPI and the WPI/CPI-deflated RER series.
While PPP validity in India varies depending on the partner country, these findings underscore the complexities of trade, political relationships, and economic policies impacting PPP effectiveness. The influence of central bank policies on PPP remains inadequately addressed in the existing literature, especially in the context of comparative analyses between diverse exchange rates. This gap is further highlighted considering emerging economies that play a pivotal role in the global economic landscape. Thus, this paper aims to contribute to academic discourse by revealing the dynamics between central bank interventions, PPP, and exchange rate regimes in India and ASEAN countries. Moreover, these economies, among the fastest growing, wield substantial influence on global economics yet remain under-represented in current PPP studies.
The hypotheses to be tested are as follows:
H1.
Short-term deviations from PPP are not corrected under the fixed/managed floating exchange rate regimes in India.
H2.
PPP holds in the long run under the fixed/managed floating exchange rate regime in India.
In the managed floating regime, the central bank allows market forces to largely dictate the exchange rate but intervenes to mitigate excessive volatility. These hypotheses consider whether these interventions or market forces align or deviate from the principles of PPP in both the short term and the long term.
3. Data and Methodology
We explore the relationship between the RBI interventions and the validity of PPP across two distinct exchange rate regimes using exchange rates and CPI series for India and five ASEAN countries: Indonesia, Myanmar, Thailand, the Philippines, and Malaysia. The data source was the IMF’s International Financial Statistics (IFS) database. Exchange rates between India and ASEAN countries are calculated as USD cross rates, using the INR as the base. As such, the empirical research focuses on INR paired IDR (Indonesian Rupiah), MMK (Myanmar Kyat), MYR (Malaysian Ringgit), PHP (Philippine Peso), and THB (Thai Baht). The CPI data was extracted from the IFS, with 2010 as the base year.
The research spans 40 years, from 1975 to 2015, using monthly data aligning with the study’s long period, which aims to provide sufficient granularity, avoiding potential drawbacks from low-frequency data. We note that in this paper, we use the exchange rate regime as disclosed by RBI without trying to uncover it from historical data using statistical techniques. Given the active foreign exchange intervention by the RBI, it is challenging to decipher India’s ERR by looking at the level of the exchange rate volatility. The actual exchange rate is partly an outcome of the underlying macro-financial conditions or shocks the economy faces and partly of the intervention or currency policy of the RBI (Patnaik and Sengupta 2021). In recent years, the IMF (2023) openly disputed the ERR in India; as such we have opted for 2015 as a cutoff point.
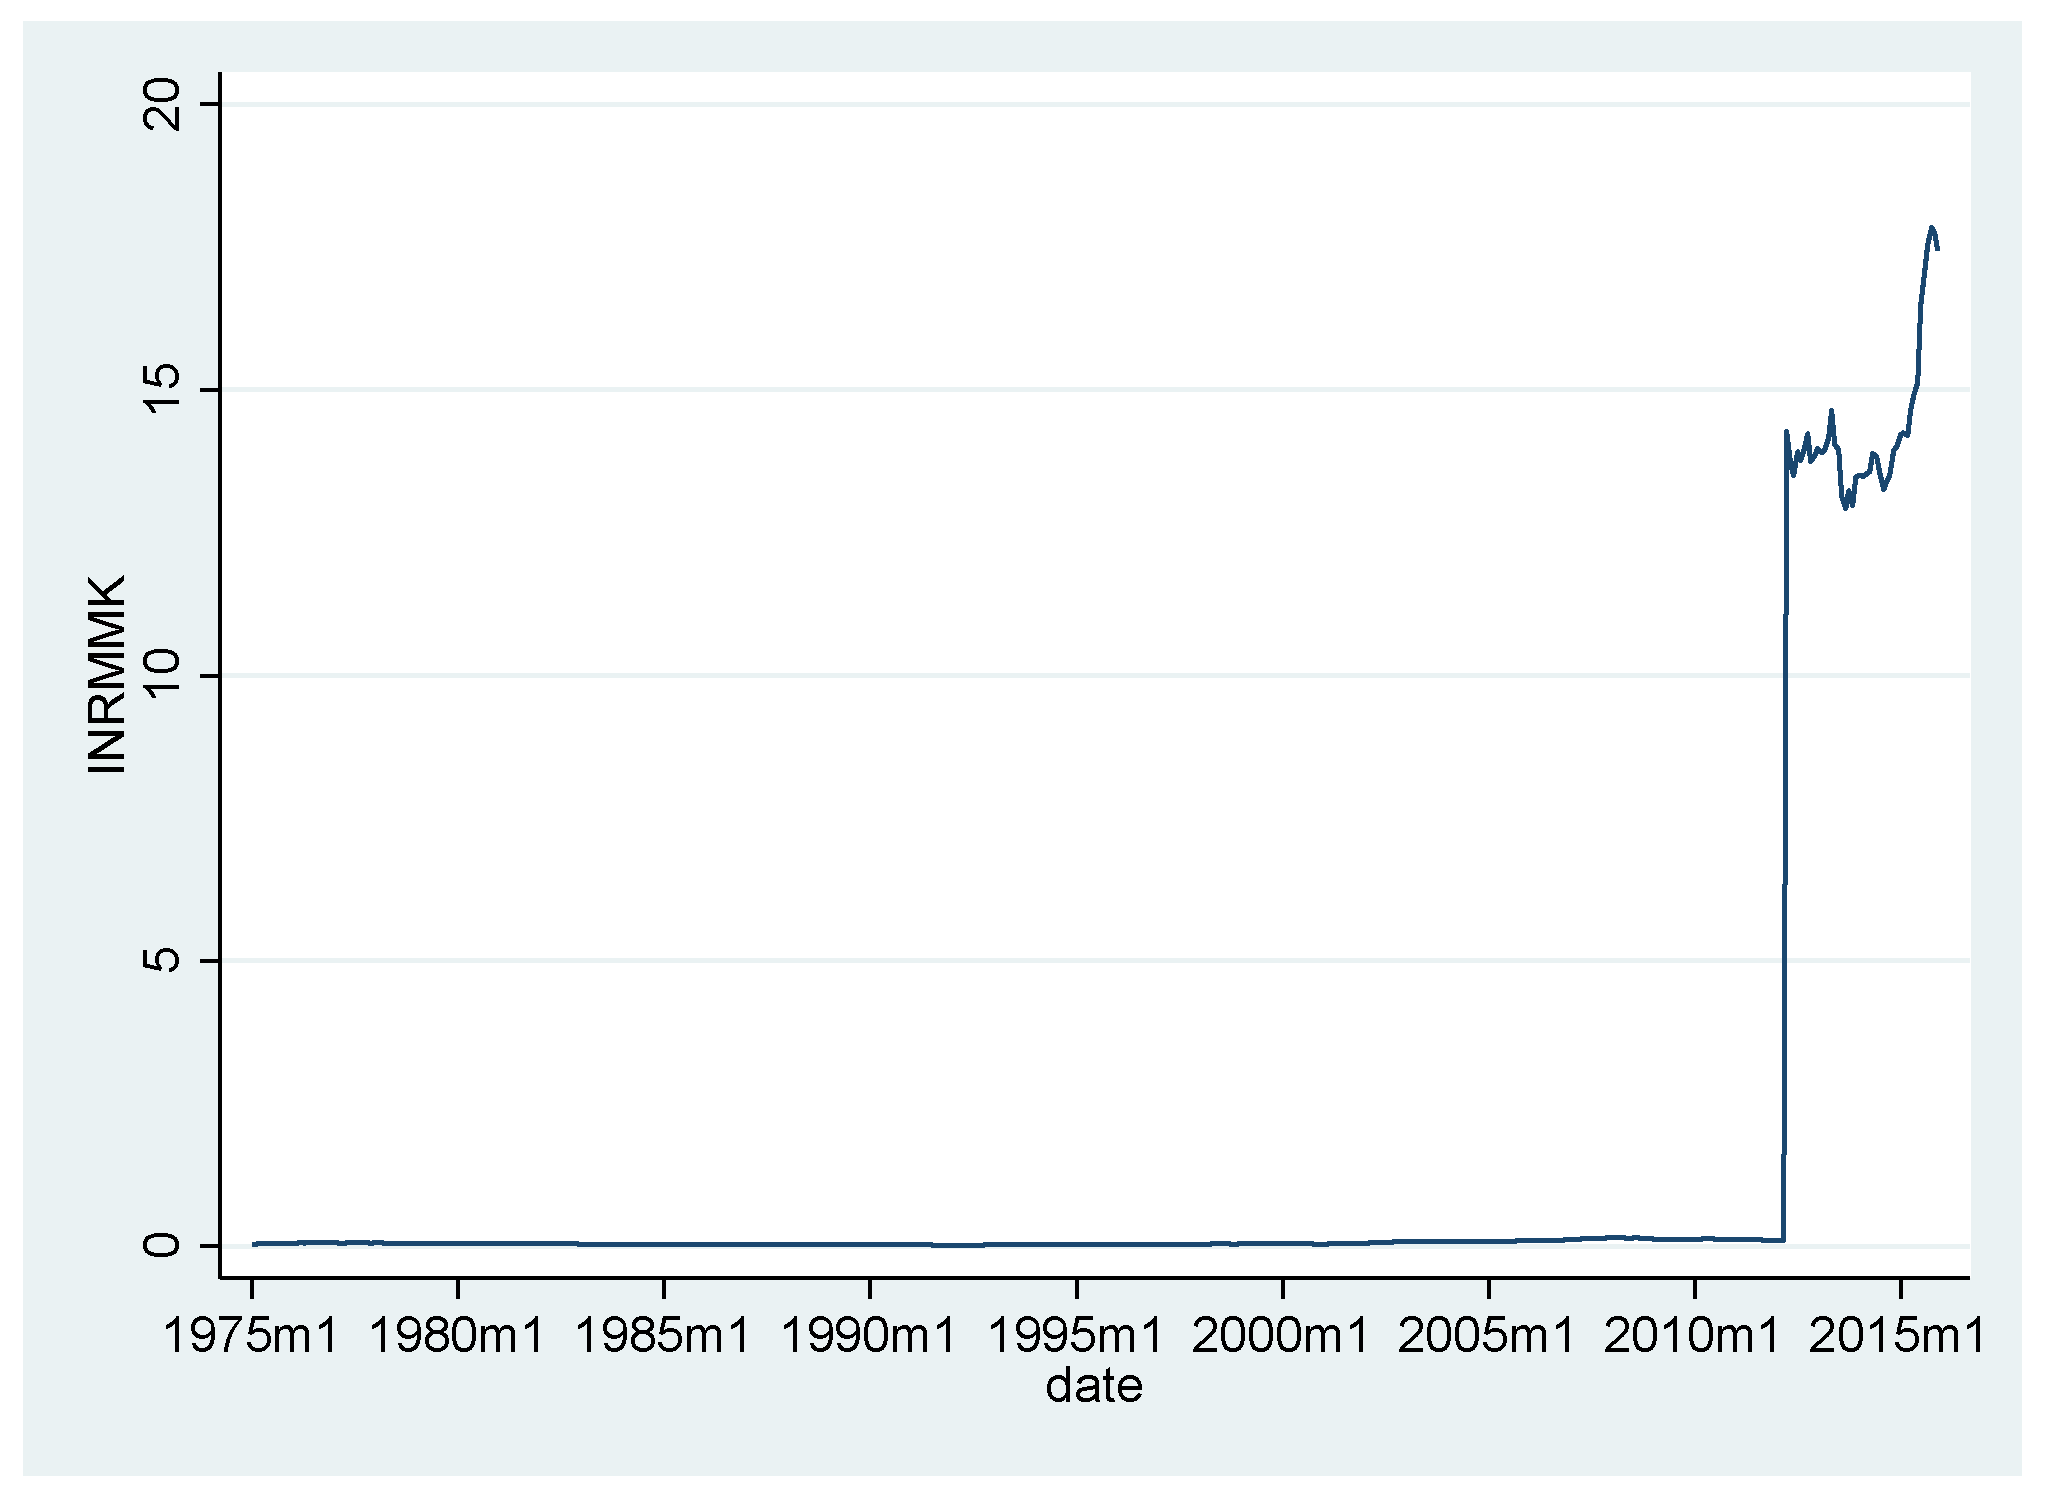
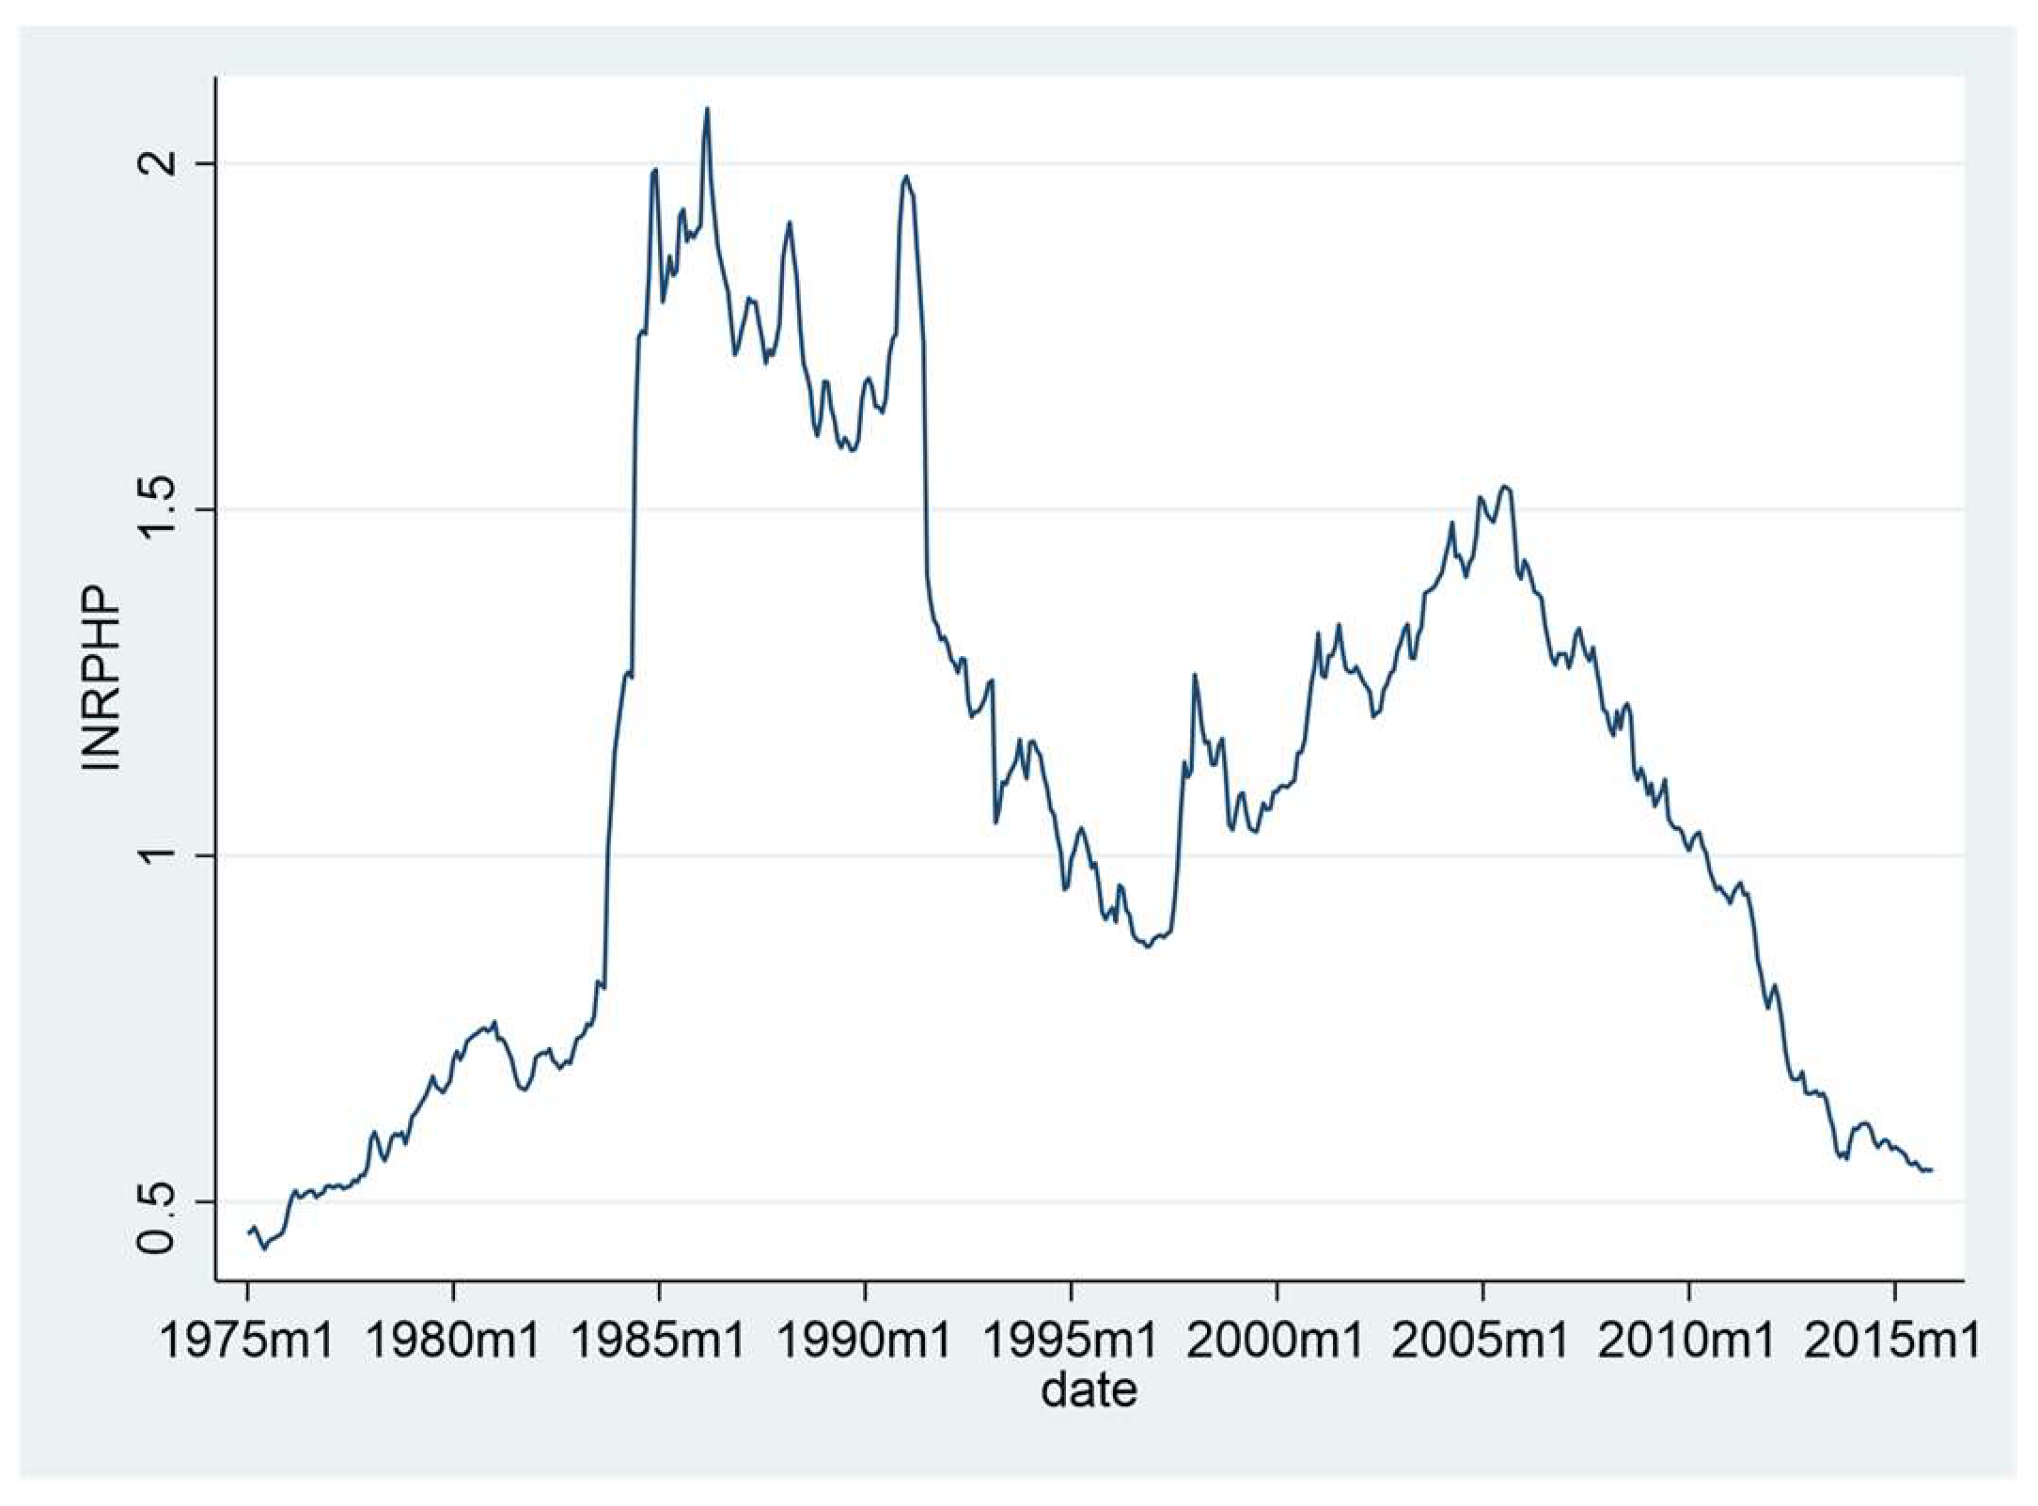
Figure A1, Figure A2, Figure A3, Figure A4 and Figure A5 in Appendix A depict the RERs of the five key currency pairs involving the INR with ASEAN currencies from 1975 to 2015. The general trend of RER of the INR/IDR shown in Figure A1 is upward. Still, extreme volatility was notable during 1998–2000, attributed to the Indonesian economic crisis. In Figure A2, the INR/MMK RER is smoother, mostly flat, with minor fluctuations from 1975 to 2011. However, from 2012 onwards, a substantial upward shift was associated with the significant economic reforms in Myanmar during this period. Also, the high upward shifts can be attributed to Myanmar’s monetary policy shift from a fixed to a floating exchange rate regime. The gradual downward trends in INR/MYR and INR/THB, in Figure A3 and Figure A5, respectively, suggest a long-term weakening of the INR relative to MYR and THB. The INR/PHP shown in Figure A4 presents a volatile trajectory, marked by sharp shifts in 1983–1984 and 1992. The earlier rise can be linked to global economic factors and specific policy interventions, while the decline in 1992 aligns with India’s economic liberalization. The subsequent periods of fluctuations reflect a complex interplay between economic fundamentals and policy actions. The graphical trends in Figure A1, Figure A2, Figure A3, Figure A4 and Figure A5 in Appendix A form a basis for examining the RERs, offering context for the descriptive statistics summarised in Table 1.
The INR/IDR pair displays a mean value of 108.56 with a standard deviation of 77.97, indicating significant fluctuation. Conversely, INR/MMK, INR/MYR, INR/PHP, and INR/THB present mean values of 1.36, 0.42, 1.10, and 3.09, respectively. Notably, the median differs considerably from the mean in all cases except IND/PHP, highlighting potential asymmetries in the data distribution. For instance, the median of INR/MMK is 0.04, sharply contrasting with a mean value of 1.36. The extreme values in the minimum and maximum stats illustrate broad fluctuations, such as INR/IDR’s range of 255.68. Standard deviation and variance further quantify the data’s volatility, with INR/IDR showing a pronounced standard deviation of 77.97. The positive skewness in all currency pairs suggests that the distribution of deviations of RER leans towards the right, with varying degrees of asymmetry. The kurtosis provides insights into the tail heaviness of the distribution, with negative values such as −1.39 in INR/IDR indicating a flatter appearance. In contrast, INR/MMK has significant skewness, indicating a fat tail on the right side of the distribution and a more peaked distribution. The INR/MYR currency pair shows a relatively flat distribution with a slight positive skew, while INR/PHP exhibits a flatter distribution with minor asymmetry. Lastly, the INR/THB currency pair portrays a spread-out distribution with a modest right skew. The varying levels of volatility, skewness, and kurtosis across the currency pairs hint at a more complex relationship which can challenge the PPP theory in the era of fixed and floating regimes.
In time series analysis, stationarity implies that mean and variance remain constant over time. This concept aligns with PPP, which posits that the RER should also be stationary. To ascertain whether the series is stationary, unit root tests are employed.
In the context of PPP, Johansen’s (1988) cointegration method becomes an important tool for assessing long-term equilibrium between nominal exchange rates and relative price levels (Enders 2015; Chocholatá 2007, 2009; Islam and Ahmed 1999). Upon detecting cointegrating relationships via the Johansen method, we proceed using the Vector Error Correction Model (VECM). The VECM is particularly suited for this task, as it captures both short-term adjustments and underlying long-term equilibrium relationships. The VECM describes the interactions between the nominal exchange rate, CPI of India, and CPI of the considered ASEAN nation. It provides insights into system adjustments following short-term shocks, all while conforming to long-term cointegrating relationships. The optimal lag length in VECM is chosen based on information criteria.
4. Empirical Results
Before proceeding with the unit root tests for the RER, we determined the optimal number of lags to incorporate into the model. Both criteria, the Akaike Information Criterion (AIC) and Schwarz Bayesian Information Criterion (SBIC), consistently suggest lag orders of one or two lags during the fixed regime, showing relatively straightforward lag selection for most currency pairs. However, the managed floating regime and the full period (1975–2015) reveal more complexity, given a disparity between the AIC and SBIC values for pairs like INR/MYR. The SBIC is the preferred criterion due to its lower values associated with better model fit. The unit root test results for INR/ASEAN currency pairs across various regimes are presented in Table 2.
In both the fixed and floating regimes, as well as the full period, the test statistics imply the presence of a unit root in all currency pairs when considering the level series. The presence of a unit root suggests that shocks have lasting effects, questioning the return to long-term equilibrium in RERs. However, upon first differencing, all series become stationary, i.e., integrated of order one, I(1). Similar results were obtained using the Phillips–Perron (PP) unit root test.
Building on the findings from the unit root testing, we evaluate the cointegrating relationships among the three variables of interest, INR/ASEAN, nominal exchange rate, CPI of India, and CPI of the respective ASEAN country using Johansen’s test. To ensure the robustness of the test, it is imperative to determine the optimal lag length for the model. Both AIC and SBIC were employed to select the optimal lag length for each currency pair under different regimes. SBIC consistently recommends using two lags across all currency pairs and regimes, while AIC provides varying lag lengths. Given the trade-offs between AIC and SBIC, we proceed with the SBIC recommendation of two lags for all currency pairs across both regimes and the full period. This choice enhances model parsimony and provides uniformity in inter-regime comparisons. Table 3 reports Johansen’s Cointegration test results for INR-ASEAN currency pairs and the respective CPIs across exchange rate regimes.
In the fixed regime period of 1975–1993, all currency pairs demonstrate trace statistics that exceed the 5% critical value for the hypothesis of no cointegration, thereby rejecting it. In the fixed regime period and for the rank 1 hypothesis, all currency pairs yield trace statistics that exceed the 5% critical value, suggesting that there exists one long-term equilibrium relationship between the exchange rates and respective CPIs. The hypothesis of two cointegrations is not met, as all trace statistics are significantly lower than the critical values. In contrast, in the managed floating regime of 1993–2015, the trace statistics for all currencies except INR/IDR are below the 5% critical value, implying that we cannot reject the null hypothesis of no cointegration for these currency pairs. For INR/IDR, however, the trace statistic for no cointegration at rank 1 exceeds the critical value, suggesting that only one cointegrating equation exists. Over the full period of 1975–2015, the cointegration tests reveal that INR/IDR and INR/PHP appear to exhibit two cointegrations (rank 2), indicated by the significant trace statistics. On the other hand, the remaining pairs (INR/MMK, INR/MYR, and INR/THB) display one significant cointegration relationship (rank 1). This suggests that while the former pairs share two long run equilibrium relationships incorporating both exchange rates and CPIs, the latter pairs are tied by one such relationship.
These results suggest that PPP is more likely to hold during the fixed exchange rate regime. The managed floating regime, however, introduces uncertainty, potentially due to irregular RBI interventions affecting the long-term relationships among the variables, challenging the validity of PPP in this period.
Table 4 reports the results of the VECM. Under the fixed exchange rate regime from 1975 to 1993, INR/MYR demonstrates the most robust characteristics supporting the PPP theory. In this pair, the error correction term (ECT) is −0.110 and highly significant, implying that about 11% of the disequilibrium is corrected in each period. This is relatively high and suggests a faster speed of adjustment back to the long-term equilibrium after any shocks. Furthermore, both foreign and home CPIs showed a significant long-term relationship with the exchange rate, reinforcing the theoretical underpinning of PPP. For the rest of the currency pairs—INR/IDR, INR/MMK, INR/PHP, and INR/THB—the ECTs are insignificant. This could imply that PPP may not hold across all currency pairs during this regime. The long-term relationships in these pairs also appear to be disproportionately driven by foreign CPI, as indicated by their respective coefficients and p-values. The home CPI, in contrast, generally fails to exhibit statistical significance.
For the managed floating regime between 1993 and 2015, the absence of cointegration for most of the currency pairs raises questions about the stability of these long-term relationships. This could infer that interventions from the RBI may have had a disruptive effect on the long-term equilibrium, possibly rendering PPP invalid during this period. An exception to this pattern is observed in the INR/IDR pair, where the ECT is significant and negative (−0.046), suggesting a slower convergence speed of about 4.6%. This slower rate of correction lends some support to the hypothesis that RBI’s interventions in the managed floating regime have a disruptive influence on long-term equilibrium.
Over the full period from 1975 to 2015, multiple cointegrations were discovered for INR/IDR and INR/PHP, which could suggest that the relationships are not just complex but also nonlinear. Also, pairs like INR/IDR and INR/MMK show significant ECTs, implying that although there may be short-term deviations from equilibrium, these are corrected in the long run. In passing, it should be noted that the adjusted R2 is found to be rather low across all models, but this is expected, and it is in line with similar studies in the area.
Notably, there is no evidence of a short-term relationship between any of the pairs in any regimes except for INR/MYR in a fixed exchange regime, which suggests that in the short-run, PPP does not hold, as put forth by Taylor et al. (2001). Interestingly, the INR/MYR pair during the full period of study shows a significant ECT, while both long-term and short-term relationships appear statistically insignificant. This deviation indicates that the adjustment mechanism towards the long-term equilibrium exists but is not because of the variables examined in this research. These could be attributed to market forces or variables not in the scope of this paper, which warrants further research.
It can also be noticed that the ECT coefficients for most of the currency pairs across all regimes seem to be negative rather than positive. The negative ECT values may indicate that both positive and negative shocks would result in a depreciation of the currency to restore equilibrium. Although not measured empirically, a theoretical inference can be made, which suggests a form of asymmetry wherein the direction of the adjustment following shocks is mostly towards the depreciation of the currency pair. Diagnostic tests to check autocorrelation and stability were also conducted. The results are presented in Table A1 and Table A2 in Appendix A. For the fixed exchange rate regime, we find evidence of autocorrelation in the residuals of INR/IDR and INR/MMK currency pairs whilst the rest of the currency pairs are free from autocorrelation. For the managed floating exchange rate regime, the results indicate no evidence of autocorrelation. When the entire period is considered, evidence of autocorrelation is observed again for INR/IDR and INR/MMK, while the rest of the currency pairs are free from autocorrelation. Turning to the stability tests reported in Table A2 in Appendix A, we find that across all sample periods (fixed exchange rate regime period, managed floating exchange rate regime period, as well as the entire sample period), the eigenvalues for all currency pairs do not exceed 1, thus indicating stability for their VECM estimates.
As summarised in Table 5, the results of Johansen’s test show a long-term equilibrium relationship, signaling that PPP may hold across all the currency pairs during the fixed exchange rate regime in India. These suggest that under fixed exchange rate systems, central bank interventions may work to maintain long-term equilibrium relationships rather than distort them. However, in the managed floating regime, this coherence was only evident in one currency pair, questioning the effectiveness of RBI interventions during this period in sustaining PPP.
5. Discussion
The results from the VECM further deepen the findings. In line with the literature consensus (Su et al. 2014), the VECM suggests that PPP may not hold in the short run as no significant short-term relationship is established across any of the regimes. As for the long-term prospects of PPP, only the INR/MYR currency pair displayed a significant ECT during the fixed exchange rate regime, indicating that deviations from the equilibrium were corrected over time only for this currency pair. The same was true in the managed floating regime for a single pair. Also, in the fixed exchange rate regime, the long-term relationships were mostly driven by foreign CPI. This finding implies that while RBI interventions may be designed to influence the exchange rate, external inflationary conditions are disproportionately steering long-term relationships in the fixed regime, whereas there are no long-term (or short-term) relationships in the managed floating exchange rate regime for any currency pairs except one long-term relationship significant in the INR/IDR pair. The results of the VECM do not provide a very definitive conclusion (Al-Gasaymeh and Kasem 2015; Ma et al. 2017; Bahmani-Oskooee et al. 2015), but they still show signs of a slightly better PPP relationship identified in the fixed regime when compared to the managed floating regime. This supports PPP validity during the fixed regime and not during the managed floating regime, which may indicate that irregular central bank interventions in the managed floating regime may cause deviations from the exchange rate. This argument aligns with the findings of Lin and Lee (2016). The significant negative ECTs across all regimes in the VECM also indicate that the equilibrium is corrected by the depreciation of the currencies. When considered within the context of RBI interventions, this becomes more meaningful. If RBI were merely following the principle of PPP, interventions would ideally not favor any specific direction of currency adjustments. However, RBI’s actions seem to bias the currency towards depreciation when it deviates from equilibrium, reflecting a possible “fear of appreciation” to exert export competitiveness, as outlined by Levy-Yeyati and Sturzenegger (2007) and Pontines and Rajan (2011). But Gupta and Sengupta (2013) also pointed out that India’s strategy is multifaceted. Rather than focusing solely on competitiveness, India navigates monetary policy, exchange rate adaptability, and capital flow oversight to mitigate financial instability and excess volatility.
Given the results of the diagnostic tests of VECM, our findings should be interpreted cautiously. An additional layer of complexity arises from the issue of simultaneity, where the interdependent nature of exchange rates, inflation rates, central bank interventions, and other factors can influence each other simultaneously, forming a loop, making it harder to understand the effect of one variable on another (Krugman 1978). As mentioned by Taylor et al. (2001), linear models like the one implemented in this study may not properly grasp the whole picture of the PPP puzzle, implying that PPP is a nonlinear concept and is influenced by multiple other variables not captured in this paper which may have an impact on the exchange rate equilibrium.
On the whole, the study reveals that during the fixed exchange rate regime from 1975 to 1993, the INR/MYR pair exhibited strong support for PPP, with a significant error correction term (ECT) indicating swift adjustments towards long-term equilibrium following shocks. However, for other currency pairs in this regime, PPP may not hold uniformly, with long-term relationships primarily influenced by foreign Consumer Price Indexes (CPIs).
During the managed floating regime from 1993 to 2015, most currency pairs show an absence of cointegration, suggesting instability in long-term relationships, possibly due to irregular interventions by the RBI. An exception is observed in the INR/IDR pair, where a slower convergence rate implies some support for PPP despite interventions.
Throughout the entire period, some pairs exhibit multiple cointegrations, indicating complex relationships, while others show significant ECTs, suggesting short-term deviations from equilibrium are corrected in the long run. Notably, there is no evidence of short-term PPP except for INR/MYR in the fixed exchange regime, indicating deviations from PPP theory.
Overall, the study highlights the nuanced dynamics of PPP across different exchange rate regimes and suggests further research is needed to understand the influence of market forces and variables beyond the scope of this study.
6. Conclusions
In this paper, we examined the interplay between RBI’s interventions and PPP in two distinct exchange rate regimes, the fixed exchange rate (1975–1993) and the managed floating exchange rate (1994–2015). Employing Johansen’s Cointegration tests and VECM, our findings reinforce the view that central bank interventions significantly impact exchange rate adjustments (Lin and Lee 2016).
In the fixed regime, RBI’s frequent and immediate interventions appear to foster an environment where long-term PPP may hold. However, in the managed floating regime, the selective nature of interventions seems to weaken the case of PPP. Policymakers may consider that PPP holds more robustly under a fixed regime, suggesting a greater intervention ability to maintain long-term equilibrium. Conversely, the failure to sustain PPP in a managed floating regime raises questions about the impact of irregular or selective interventions on exchange rate stability.
The paper also uncovers the role of foreign CPI in driving long-term relationships, which could be a pivotal consideration for monetary authorities when coordinating intervention strategies. The research provides empirical evidence that can support central banks’ understanding of the consequences of intervention strategies on exchange rate stability and broader economic objectives. However, the disparities in the cointegration between the two regimes and the absence of significant ECT in the VECM may also be because of the limitations of linear models, which may be weak and low in power in predicting PPP. In line with previous research, our findings hint at the limitations of linear models in capturing the dynamics of PPP when central banks are involved.
The findings of this study could provide valuable insights for policymakers at the RBI and other central banks regarding the effectiveness of interventions in influencing exchange rates under different regimes. Knowledge of how RBI interventions affect exchange rates within different exchange rate regimes can help market participants, including investors and businesses, better anticipate and respond to currency market dynamics. Furthermore, insights gained from this study could inform RBI’s approach to managing exchange rate fluctuations in the future, i.e., adjusting its intervention strategies accordingly to better achieve its objectives, such as price stability or export competitiveness. Businesses that engage in international trade and investment may also benefit from this study in that they may develop more effective risk management strategies to mitigate the impact of exchange rate fluctuations on their operations, revenue, and profitability. Finally, this study could serve as a basis for evaluating the effectiveness of past RBI interventions in maintaining exchange rate stability and promoting PPP. By comparing outcomes across different exchange rate regimes, policymakers can assess the relative success of intervention policies and identify areas for improvement in future policy formulation and implementation.
Given that this paper’s objective is to explore the relationship between the RBI interventions and the validity of PPP across two distinct exchange rate regimes, not isolating the interventions of the RBI from other causes of changes in the floating exchange rate regime might be thought of as a potential limitation of the study. Future research could explore nonlinear adjustment processes in the exchange rates caused by central bank interventions. More sophisticated nonlinear models can potentially capture the PPP dynamics and account for the effect of irregular central bank interventions as well as rectify potential residual issues encountered in the estimation process. Additionally, extending the comparative analysis to include other countries or regions with similar or different exchange rate regimes or exploring the microeconomic mechanisms underlying the relationship between RBI interventions and PPP can be used to provide a more holistic approach. For example, future research may investigate how different types of interventions (e.g., sterilized vs. non-sterilized interventions) affect exchange rate dynamics and PPP adjustments at the level of individual market participants, such as exporters, importers, and financial institutions.
Author Contributions
Conceptualization, A.S.; methodology, A.S., S.V. and C.A.; validation, S.V. and C.A. formal analysis, A.S., S.V. and C.A.; investigation, A.S., S.V. and C.A.; writing—original draft preparation, A.S.; writing—review and editing, C.A. and S.V.; supervision, C.A. All authors have read and agreed to the published version of the manuscript.
Funding
This research received no external funding.
Informed Consent Statement
Not applicable.
Data Availability Statement
All data used in this study are publicly available data and can be retrieved from the sources identified in the paper. No new data were created.
Conflicts of Interest
The authors declare no conflict of interest.
Appendix A
Figure A1.
RER of INR/IDR for period of 1975–2015.

Figure A2.
RER of INR/MMK for period of 1975–2015.

Figure A3.
RER of INR/MYR for period of 1975–2015.

Figure A4.
RER of INR/PHP for period of 1975–2015.

Figure A5.
RER of INR/THB for period of 1975–2015.


Table A1.
Lagrange multiplier test for serial correlation.
| Exchange Rate Regime/Currency Pairs | Lag 1 | Chi2 | Lag 2 | Chi2 |
|---|---|---|---|---|
| Fixed exchange rate regime (1975–1993) | ||||
| INR/IDR | 0.027 * | 18.803 | 0.012 * | 21.125 |
| INR/MMK | 0.013 * | 20.841 | 0.154 | 13.186 |
| INR/MYR | 0.702 | 6.378 | 0.843 | 4.903 |
| INR/PHP | 0.122 | 14.021 | 0.146 | 13.374 |
| INR/THB | 0.166 | 12.921 | 0.052 | 19.337 |
| Managed floating exchange rate regime (1994–2015) | ||||
| INR/IDR | 0.261 | 11.223 | 0.327 | 10.298 |
| INR/MMK | - | - | - | - |
| INR/MYR | - | - | - | - |
| INR/PHP | - | - | - | - |
| INR/THB | - | - | - | - |
| Whole period (1975–2015) | ||||
| INR/IDR | 0.036 * | 17.907 | 0.041 * | 17.549 |
| INR/MMK | 0.000 * | 29.842 | 0.007 * | 22.540 |
| INR/MYR | 0.579 | 7.562 | 0.744 | 5.960 |
| INR/PHP | 0.311 | 10.513 | 0.411 | 9.285 |
| INR/THB | 0.012 | 21.187 | 0.054 | 16.679 |
Notes: (a) asterisks (*) denote p-values of less than 0.05, suggesting that the null hypothesis of no autocorrelation is rejected at the 5% level of significance. (b) A dash (-) indicates data are not applicable for the given period.
Table A2.
Lagrange eigenvalue stability condition for VECM.
| Currency Pairs | Eigenvalues 1–6 | Max Modulus | No. of Unit Moduli | |||||
|---|---|---|---|---|---|---|---|---|
| 1 | 2 | 3 | 4 | 5 | 6 | |||
| Fixed regime (1975–1993) | ||||||||
| INRIDR | 1.00 | 1.00 | 1.00 | 0.45 | 0.23 | 0.17 | 1.00 | 2 |
| INRMMK | 1.00 | 1.00 | 1.00 | 0.50 | 0.21 | 0.02 | 1.00 | 2 |
| INRMYR | 1.00 | 1.00 | 0.90 | 0.53 | 0.19 | 0.09 | 1.00 | 2 |
| INRPHP | 1.00 | 1.00 | 1.00 | 0.48 | 0.43 | 0.20 | 1.00 | 2 |
| INRTHB | 1.00 | 1.00 | 0.91 | 0.46 | 0.25 | 0.12 | 1.00 | 2 |
| Managed floating regime (1994–2015) | ||||||||
| INRIDR | 1.00 | 1.00 | 0.92 | 0.40 | 0.25 | 0.25 | 1.00 | 2 |
| INRMMK | - | - | - | - | - | - | - | - |
| INRMYR | - | - | - | - | - | - | - | - |
| INRPHP | - | - | - | - | - | - | - | - |
| INRTHB | - | - | - | - | - | - | - | - |
| Whole period (1975–2015) | ||||||||
| INRIDR | 1.00 | 1.00 | 0.95 | 0.34 | 0.26 | 0.26 | 1.00 | 2 |
| INRMMK | 1.00 | 1.00 | 1.00 | 0.42 | 0.33 | 0.04 | 1.00 | 2 |
| INRMYR | 1.00 | 1.00 | 0.98 | 0.36 | 0.30 | 0.10 | 1.00 | 2 |
| INRPHP | 1.00 | 1.00 | 1.00 | 0.34 | 0.24 | 0.24 | 1.00 | 1 |
| IDRTHB | 1.00 | 1.00 | 1.00 | 0.35 | 0.35 | 0.16 | 1.00 | 2 |
Note: Dash (-) indicates data are not applicable for the given period.
References
- Al-Gasaymeh, Anwar, Ahmed Gouher, Tariq Mehmood, and Haitman Alzoubi. 2019. Cointegration Tests and the Long-Run Purchasing Power Parity: A Case Study of India and Pakistan Currencies. Theoretical Economics Letters 9: 570–83. [Google Scholar] [CrossRef]
- Al-Gasaymeh, Anwar, and John Kasem. 2015. Strong and weak form of purchasing power parity: The case of Jordan and its major trading partners. Journal of International Business and Economics 3: 93–108. [Google Scholar] [CrossRef]
- Bahmani-Oskooee, Mohsen, and Omid Ranjbar. 2016. Quantile Unit Root Test and PPP: Evidence from 23 OECD Countries. Applied Economics 48: 2899–911. [Google Scholar] [CrossRef]
- Bahmani-Oskooee, Mohsen, Tsangyao Chang, and Kuei-Chiu Lee. 2015. Purchasing power parity in emerging markets: A panel stationarity tests with both sharp and smooth breaks. Journal of Economic Systems 40: 453–60. [Google Scholar] [CrossRef]
- Balassa, Bela. 1964. The purchasing-power parity doctrine: A reappraisal. The Journal of Political Economy 72: 584–96. [Google Scholar] [CrossRef]
- Calvo, Guillermo, and Carmen Reinhart. 2002. Fear of Floating. Quarterly Journal of Economics 117: 379–408. [Google Scholar] [CrossRef]
- Chocholatá, Michaela. 2007. Validity of the Purchasing Power Parity in the V4 Countries. International Journal of Pure and Applied Mathematics 35: 17–29. [Google Scholar]
- Chocholatá, Michaela. 2009. Purchasing Power Parity and Cointegration: Evidence from Latvia and Slovakia. Journal of Economics 57: 344–58. [Google Scholar]
- Dickey, David, and Wayne Fuller. 1979. Distribution of the Estimators for Autoregressive Time Series with a Unit Root. Journal of the American Statistical Association 74: 427–31. [Google Scholar]
- Dutta, Jayasri, and Hyginus Leon. 2002. Dread of Depreciation: Measuring Real Exchange Rate Interventions. IMF Working Papers 2002/063. Washington: International Monetary Fund. [Google Scholar]
- Enders, Walter. 2015. Applied Econometric Time Series, 4th ed. Hoboken: Wiley. [Google Scholar]
- Enders, Walter, and Kamol Chumrusphonlert. 2004. Threshold cointegration and purchasing power parity in the Pacific nations. Applied Economics 36: 889–96. [Google Scholar] [CrossRef]
- Engel, Charle, and John Rogers. 1996. How Wide Is the Border? American Economic Review 86: 1112–25. [Google Scholar]
- Frankel, Jeffrey. 1986. International Capital Mobility and Crowding-Out in the U.S. Economy: Imperfect Integration of Financial Markets or of Goods Markets? St. Louis: Federal Reserve Bank of St. Louis, pp. 33–74. [Google Scholar]
- Gupta, Abhijit, and Rajeswari Sengupta. 2013. Management of Capital Flows in India, South Asia Working Paper Series. Manila: Asian Development Bank, no. 17. [Google Scholar]
- Heckscher, Eli. 1916. Växelkurens grundval vid pappersmynfot. Economisk Tidskrift 18: 309–12. [Google Scholar] [CrossRef]
- Huang, Chao-Hsi, and Chih-Yuan Yang. 2015. European exchange rate regimes and purchasing power parity: An empirical study on eleven eurozone countries. International Review of Economics & Finance 35: 100–9. [Google Scholar]
- IMF. 2004. Annual Report on Exchange Arrangements and Exchange Restrictions. Washington: International Monetary Fund. [Google Scholar]
- IMF. 2023. 2023 Article IV Consultation, India. IMF Country Report 23/426. Washington: International Monetary Fund. [Google Scholar]
- Islam, Anisul, and Syed Ahmed. 1999. The Purchasing Power Parity Relationship: Causality and Cointegration Tests Using Korea–U.S. Exchange Rate and Prices. Journal of Economic Development 24: 95–111. [Google Scholar]
- Islam, Sirajul. 2013. Testing the Existence of Purchasing Power Parity in Bilateral Trade between Bangladesh and India. The Bangladesh Development Studies 36: 121–32. [Google Scholar]
- Johansen, Søren. 1988. Statistical Analysis of Cointegrating Vectors. Journal of Economic Dynamics and Control 12: 231–54. [Google Scholar] [CrossRef]
- Kanas, Angelos. 2006. Purchasing Power Parity and Markov Regime Switching. Journal of Money, Credit, and Banking 38: 1669–87. [Google Scholar] [CrossRef]
- Kapetanios, George, Yongcheol Shin, and Andy Snell. 2003. Testing for a unit root in the nonlinear STAR framework. Journal of Econometrics 112: 359–79. [Google Scholar] [CrossRef]
- Kohli, Renu. 2002. Real Exchange Rate Stationarity in Managed Floats: Evidence from India. Economic and Political Weekly 37: 475–82. [Google Scholar]
- Krugman, Paul. 1978. Purchasing Power Parity and Exchange Rates: Another Look at the Evidence. Journal of International Economics 8: 397–407. [Google Scholar] [CrossRef]
- Krugman, Paul. 1987. Pricing to market when the exchange rate changes. In Real-Financial Linkages among Open Economies. Cambridge, MA: MIT Press, pp. 49–70. [Google Scholar]
- Kruse, Robinson. 2011. A New Unit Root Test Against ESTAR Based on a Class of Modified Statistics. Statistical Papers 52: 71–85. [Google Scholar] [CrossRef]
- Kyei-Mensah, Justice. 2023. The long-run validity of PPP in some major advanced and emerging countries using alternative models. Cogent Economics & Finance 11: 2220248. [Google Scholar] [CrossRef]
- Lee, Hyejin, and Junsoo Lee. 2015. More powerful Engle-Granger cointegration tests. Journal of Statistical Computation and Simulation 85: 3154–71. [Google Scholar] [CrossRef]
- Levy-Yeyati, Eduardo, and Federico Sturzenegger. 2007. Fear of Appreciation. Working Paper 4387. Washington: World Bank Policy Research. [Google Scholar]
- Lin, Luke, and Chun Lee. 2016. Central Bank Intervention, Exchange Rate Regime and the Purchasing Power Parity. World Economy 39: 1256–74. [Google Scholar] [CrossRef]
- Lin, Luke, and Wenyuan Lin. 2013. Exchange Rate Reversion Under Regimes Other Than Free Floats. International Journal of Finance and Economics 18: 293–306. [Google Scholar] [CrossRef]
- Lothian, James. 2016. Purchasing Power Parity and the Behavior of Prices and Nominal Exchange Rates across Exchange-Rate Regimes. Journal of International Money and Finance 69: 5–21. [Google Scholar] [CrossRef]
- Lothian, James, and Cornelia McCarthy. 2002. Real Exchange Rate Behaviour under Fixed and Floating Exchange Rate Regimes. Manchester School 70: 229–45. [Google Scholar] [CrossRef]
- Lothian, James, and Mark Taylor. 1997. Real Exchange Rate Behavior: The Problem of Power and Sample Size. Journal of International Money and Finance 16: 945–54. [Google Scholar] [CrossRef]
- Lothian, James, and Mark Taylor. 2008. Real Exchange Rates Over the Past Two Centuries: How Important is the Harrod-Balassa-Samuelson Effect? Economic Journal 118: 1742–63. [Google Scholar] [CrossRef]
- Ma, Wei, Haiqi Li, and Sung Park. 2017. Empirical conditional quantile test for purchasing power parity: Evidence from East Asian countries. International Review of Economics & Finance 49: 211–22. [Google Scholar] [CrossRef]
- Moatsos, Michail. 2020. Why PPP Exchange Rates Should Be Avoided in Global Poverty Estimates, ZBW—Leibniz Information Centre for Economics, Kiel, Hamburg. Available online: https://hdl.handle.net/10419/218972 (accessed on 25 November 2023).
- Murray, Christian, and David Papell. 2005. The Purchasing Power Parity Puzzle Is Worse Than You Think. Empirical Economics 30: 783–90. [Google Scholar] [CrossRef]
- Nelson, Charles, and Charles Plosser. 1982. Trends and Random Walks in Macroeconomic Time Series: Some Evidence and Implications. Journal of Monetary Economics 10: 139–62. [Google Scholar] [CrossRef]
- Nikolaou, Kleopatra. 2008. The Behavior of the Real Exchange Rate: Evidence from Regression Quantiles. Journal of Banking and Finance 32: 664–79. [Google Scholar] [CrossRef]
- Obstfeld, Maurice, and Kenneth Rogoff. 2001. The Six Major Puzzles in International Macroeconomics: Is There a Common Cause? NBER Macroeconomics Annual 15: 339–412. [Google Scholar] [CrossRef]
- Oh, Dong-Yop, Hyejin Lee, and Ming Meng. 2018. More powerful threshold cointegration tests. Empirical Economics 54: 887–911. [Google Scholar] [CrossRef]
- Ong, Li Lian. 2003. The Big Mac Index. Applications of Purchasing Power Parity. New York: Palgrave Macmillan. [Google Scholar]
- Patnaik, Ila. 2005. India’s Experience with a Pegged Exchange Rate. In India Policy Forum 2004. Washington: Brookings Institution Press, vol. 1, pp. 189–226. [Google Scholar]
- Patnaik, Ila, and Ajay Shah. 2009. The Difficulties of the Chinese and Indian Exchange Rate Regimes. European Journal of Comparative Economics 6: 157–73. [Google Scholar]
- Patnaik, Ila, and Rajeswari Sengupta. 2021. Analysing India’s Exchange Rate Regime. Working Papers 21/353. New Delhi: National Institute of Public Finance and Policy. [Google Scholar]
- Pontines, Victor, and Ramkishen Rajan. 2011. Foreign Exchange Market Intervention and Reserve Accumulation in Emerging Asia: Is There Evidence of Fear of Appreciation? Economics Letters 111: 252–55. [Google Scholar] [CrossRef]
- Reinhart, Carmen, and Kenneth Rogoff. 2004. The Modern History of Exchange Rate Arrangements: A Reinterpretation. The Quarterly Journal of Economics 117: 1–48. [Google Scholar] [CrossRef]
- Rogoff, Kenneth. 1996. The Purchasing Power Parity Puzzle. Journal of Economic Literature 34: 647–68. [Google Scholar]
- Samuelson, Paul. 1964. Theoretical notes on trade problems. The Review of Economics and Statistics 46: 145–54. [Google Scholar] [CrossRef]
- Sarno, Lucio, and Giorgio Valente. 2006. Deviations from Purchasing Power Parity Under Different Exchange Rate Regime: Do They Revert and, if so, how? Journal of Banking and Finance 30: 3147–69. [Google Scholar] [CrossRef]
- Sarno, Lucio, and Mark Taylor. 2002. Purchasing Power Parity and the Real Exchange Rate. IMF Staff Papers 49: 65–105. [Google Scholar] [CrossRef]
- Su, Jen-Je, Adrian Cheung, and Eduardo Roca. 2014. Does purchasing power parity hold? New evidence from wild-boot- strapped nonlinear unit root tests in the presence of heteroskedasticity. Economic Modelling 36: 161–71. [Google Scholar] [CrossRef]
- Taylor, Alan, and Mark Taylor. 2004. The Purchasing Power Parity Debate. Journal of Economic Perspectives 18: 135–58. [Google Scholar] [CrossRef]
- Taylor, Mark. 1988. An Empirical Examination of Long-Run Purchasing Power Parity Using Cointegration Techniques. Applied Economics 20: 1369–81. [Google Scholar] [CrossRef]
- Taylor, Mark, David Peel, and Lucio Sarno. 2001. Nonlinear Mean Reversion in Real Exchange Rates: Towards a Solution to Purchasing Power Parity Puzzles. International Economic Review 42: 1015–42. [Google Scholar] [CrossRef]
- Tiwari, Aviral, and Muhammad Shahbaz. 2014. Revisiting Purchasing Power Parity for India Using Threshold Cointegration and Nonlinear Unit Root Test. Economic Change and Restructuring 47: 117–33. [Google Scholar] [CrossRef]
- Tiwari, Aviral, Aruna Mothkuri, and Aruna Dash. 2019. Testing the Purchasing Power Parity Hypothesis in India: A Nonlinear Cointegration Approach. The Empirical Economics Letters 17: 1321–30. [Google Scholar]
- Tripathy, Rakesh, Gurumoorthy Mahalingam, and Harun Khan. 2013. Intervention in Foreign Exchange Markets: The Approach of the Reserve Bank of India. BIS Papers No. 73. Basel: Bank for International Settlements. [Google Scholar]
- Unkovski, Goran. 2004. Purchasing Power Parity and Reserve Bank Intervention in the Foreign Exchange Market. Master’s thesis, University of Cape Town, Cape Town, South Africa. [Google Scholar]
- Yıldırım, Dilem. 2017. Empirical investigation of purchasing power parity for Turkey: Evidence from recent non- linear unit root tests. Central Bank Review 17: 39–45. [Google Scholar] [CrossRef]
- Zayed, Nurul, and Noor Zahan. 2017. An Analysis of Purchasing Power Parity Using the Ricardian Model Regarding Real Exchange Rate, Inflation and Import of Bangladesh. Australian Academy of Accounting and Finance Review 3: 111–18. [Google Scholar]
- Zayed, Nurul, Fatema Chowdhury, and Rajibul Hasan. 2018. Testing the Balassa-Samuelson model to examine purchasing power parity of Bangladesh with reference to 1972–2016. Academy of Accounting & Financial Studies Journal 22: 1–10. [Google Scholar]
- Zeileis, Achim, Ajay Shah, and Ila Patnaik. 2010. Testing, Monitoring, and Dating Structural Changes in Exchange Rate Regimes. Computational Statistics & Data Analysis 54: 1696–706. [Google Scholar]
Table 1.
Descriptive statistics of the deviations of Real Exchange Rates from 1975 to 2015.
| Description | INR/IDR | INR/MMK | INR/MYR | INR/PHP | INR/THB |
|---|---|---|---|---|---|
| Observations | 492 | 492 | 492 | 492 | 492 |
| Mean | 108.56 | 1.36 | 0.42 | 1.10 | 3.09 |
| Median | 63.35 | 0.04 | 0.15 | 1.10 | 1.41 |
| Minimum | 16.52 | 0.02 | 0.04 | 0.43 | 0.39 |
| Maximum | 272.20 | 17.84 | 1.35 | 2.08 | 8.88 |
| Range | 255.68 | 17.82 | 1.31 | 1.65 | 8.48 |
| Std. deviation | 77.97 | 4.13 | 0.43 | 0.42 | 2.70 |
| Variance | 6079.03 | 17.09 | 0.19 | 0.17 | 7.29 |
| Skewness | 0.45 | 2.89 | 0.97 | 0.33 | 0.78 |
| Kurtosis | −1.39 | 6.54 | −0.64 | −0.82 | −0.98 |
Table 2.
ADF test for stationarity of INR/ASEAN currency pairs across different regimes.
| Currency Pair | ADF Test Statistic (Z(t)) | MacKinnon p-Value |
|---|---|---|
| Fixed regime (1975–1993) | ||
| INR/IDR | −1.702 | 0.430 |
| INR/IDR—first difference | −9.452 | 0.000 *** |
| INR/MMK | −0.356 | 0.917 |
| INR/MMK—first difference | −12.983 | 0.000 *** |
| INR/MYR | 0.894 | 0.993 |
| INR/MYR—first difference | −8.649 | 0.000 *** |
| INR/PHP | −1.334 | 0.614 |
| INR/PHP—first difference | −8.277 | 0.000 *** |
| INR/THB | 1.369 | 0.997 |
| INR/THB—first difference | −9.335 | 0.000 *** |
| Managed floating regime (1993–2015) | ||
| INR/IDR | −1.916 | 0.325 |
| INR/IDR—first difference | −10.925 | 0.000 *** |
| INR/MMK | 0.209 | 0.973 |
| INR/MMK—first difference | −17.028 | 0.000 *** |
| INR/MYR | −1.189 | 0.678 |
| INR/MYR—first difference | −10.091 | 0.000 *** |
| INR/PHP | 0.1 | 0.966 |
| INR/PHP—first difference | −10.829 | 0.000 *** |
| INR/THB | −0.851 | 0.804 |
| INR/THB—first difference | −10.147 | 0.000 *** |
| Full period (1975–2015) | ||
| INR/IDR | −1.29 | 0.634 |
| INR/IDR—first difference | −14.714 | 0.000 *** |
| INR/MMK | 0.587 | 0.987 |
| INR/MMK—first difference | −22.877 | 0.000 *** |
| INR/MYR | −1.993 | 0.290 |
| INR/MYR—first difference | −12.511 | 0.000 *** |
| INR/PHP | −1.465 | 0.551 |
| INR/PHP—first difference | −13.578 | 0.000 *** |
| INR/THB | −0.83 | 0.810 |
| INR/THB—first difference | −14.041 | 0.000 *** |
Note: *** denotes rejection of the null hypothesis at the 1% significance level.
Table 3.
Johansen’s Cointegration test results for INR-ASEAN currency pairs and respective CPIs across exchange rate regimes.
Table 3.
Johansen’s Cointegration test results for INR-ASEAN currency pairs and respective CPIs across exchange rate regimes.
| Variables | No Cointegration (Rank 0) | One Cointegration (Rank 1) | Two Cointegrations (Rank 2) |
|---|---|---|---|
| Trace Statistics | |||
| Fixed regime (1975–1993) | |||
| INR/IDR—India CPI, Indonesia CPI | 38.227 | 13.941 * | 0.531 |
| INR/MMK—India CPI, Myanmar CPI | 54.770 | 9.954 * | 0.183 |
| INR/MYR—India CPI, Malaysia CPI | 36.055 | 11.964 * | 0.465 |
| INR/PHP—India CPI, Philippines CPI | 40.440 | 14.100 * | 0.069 |
| INR/THB—India CPI, Thailand CPI | 35.804 | 13.515 * | 0.084 |
| Managed floating regime (1993–2015) | |||
| INR/IDR—India CPI, Indonesia CPI | 39.430 | 12.593 * | 1.443 |
| INR/MMK—India CPI, Myanmar CPI | 27.459 * | 10.831 | 0.076 |
| INR/MYR—India CPI, Malaysia CPI | 22.645 * | 8.349 | 3.304 |
| INR/PHP—India CPI, Philippines CPI | 25.964 * | 5.746 | 2.147 |
| INR/THB—India CPI, Thailand CPI | 29.602 * | 9.323 | 0.250 |
| Full period (1975–2015) | |||
| INR/IDR—India CPI, Indonesia CPI | 88.146 | 26.920 | 3.075 * |
| INR/MMK—India CPI, Myanmar CPI | 52.828 | 4.043 * | 0.339 |
| INR/MYR—India CPI, Malaysia CPI | 46.815 | 3.938 * | 0.043 |
| INR/PHP—India CPI, Philippines CPI | 59.960 | 15.743 | 1.466 * |
| INR/THB—India CPI, Thailand CPI | 45.352 | 4.185 * | 1.527 |
Note: Asterisks (*) show the rank at which the trace statistic is significant.
Table 4.
Vector Error Correction Model results for INR/ASEAN currency pairs in different exchange rate regimes.
Table 4.
Vector Error Correction Model results for INR/ASEAN currency pairs in different exchange rate regimes.
| Currency Pair | Short-Term Relationship with Home CPI | Short-Term Relationship with Foreign CPI | Long-Term Relationship with Home CPI | Long-Term Relationship with Foreign CPI | Error Correction Term | Number of Cointegrations | Adj R-Squared | Observations |
|---|---|---|---|---|---|---|---|---|
| Fixed regime (1975–1993) | ||||||||
| INR/IDR | −1.068 (0.500) | −4.354 (0.173) | 20.604 (0.165) | −64.698 (0.016) *** | 0.002 (0.498) | One | 0.116 | 225 |
| INR/MMK | −0.007 (0.125) | 0.013 (0.634) | 0.018 (0.594) | −0.871 (0.009) *** | 0.001 (0.269) | One | 0.068 | 225 |
| INR/MYR | −0.002 (0.193) | 0.002 (0.067) * | 0.008 (0.000) *** | 0.001 (0.045) ** | −0.110 (0.000) *** | One | 0.112 | 225 |
| INR/PHP | 0.001 (0.951) | −0.011 (0.440) | 0.089 (0.777) | 0.076 (0.699) | −0.003 (0.130) | One | 0.067 | 225 |
| INR/THB | −0.028 (0.128) | −0.001 (0.951) | 0.126 (0.000) *** | −0.046 (0.000) *** | −0.029 (0.150) | One | 0.049 | 225 |
| Managed floating regime (1993–2015) | ||||||||
| INR/IDR | −0.703 (0.526) | −0.643 (0.613) | 2.584 (0.001) *** | −3.062 (0.000) *** | −0.046 (0.033) ** | One | 0.063 | 264 |
| INR/MMK | - | - | - | - | - | None | 0.017 | 264 |
| INR/MYR | - | - | - | - | - | None | 0.035 | 264 |
| INR/PHP | - | - | - | - | - | None | 0.060 | 264 |
| INR/THB | - | - | - | - | - | None | 0.114 | 264 |
| Full period (1975–2015) | ||||||||
| INR/IDR | −0.746 (0.394) | −0.843 (0.374) | 1 | −4.362 (0.000) *** 0.879 (0.001) *** | −0.026 (0.037) ** −0.041 (0.074) * | Two | 0.046 0.035 | 489 489 |
| INR/MMK | 0.022 (0.741) | −0.061 (0.256) | −0.207 (0.251) | −0.291 (0.087) * | −0.006 (0.010) ** | One | 0.023 | 489 |
| INR/MYR | −0.000 (0.144) | 0.000 (0.868) | 0.050 (0.150) | 0.047 (0.406) | 0.000 (0.017) * | One | 0.039 | 489 |
| INR/PHP | −0.003 (0.242) | −0.006 (0.239) | 1 | −0.146 (0.000) *** −6.015 (0.000) *** | −0.004 (0.262) 0.000 (0.255) | Two | 0.054 0.038 | 489 489 |
| INR/THB | −0.003 (0.250) | −0.000 (0.919) | 0.062 (0.245) | 0.105 (0.157) | 0.001 (0.187) | One | 0.057 | 489 |
Notes: (1) p-values in parentheses. (2) *** for p < 0.01, ** for p < 0.05, and * for p < 0.1. (3) A dash (-) indicates data are not applicable for the given period.
Table 5.
Summary of key findings.
| Currency Pairs | Unit Root Tests | Johansen’s Test | Short-Term Relationship | Long-Term Relationship | ECT | Long-Term PPP |
|---|---|---|---|---|---|---|
| Fixed regime (1975–1993) | ||||||
| INR/IDR | Non-stationary | One | No relation | Indonesia CPI | Insignificant | Weak |
| INR/MMK | Non-stationary | One | No relation | Myanmar CPI | Insignificant | Weak |
| INR/MYR | Non-stationary | One | Malaysia CPI | Both India and Malaysia CPI | Significant | Strong |
| INR/PHP | Non-stationary | One | No relation | No relation | Insignificant | No |
| INR/THB | Non-stationary | One | No relation | Both India and Thailand CPI | Insignificant | Weak |
| Floating regime (1993–2015) | ||||||
| INR/IDR | Non-stationary | One | No relation | Both India and Indonesia CPI | Significant | Strong |
| INR/MMK | Non-stationary | None | N/a | N/a | N/a | No |
| INR/MYR | Non-stationary | None | N/a | N/a | N/a | No |
| INR/PHP | Non-stationary | None | N/a | N/a | N/a | No |
| INR/THB | Non-stationary | None | N/a | N/a | N/a | No |
| Full period (1975–2015) | ||||||
| INR/IDR | Non-stationary | Two | No relation | Indonesia CPI | Significant | Strong |
| INR/MMK | Non-stationary | One | No relation | Myanmar CPI | Significant | Strong |
| INR/MYR | Non-stationary | One | No relation | No relation | Significant | No |
| INR/PHP | Non-stationary | Two | No relation | Philippines CPI | Insignificant | Weak |
| INR/THB | Non-stationary | One | No relation | No relation | Insignificant | No |
Disclaimer/Publisher’s Note: The statements, opinions and data contained in all publications are solely those of the individual author(s) and contributor(s) and not of MDPI and/or the editor(s). MDPI and/or the editor(s) disclaim responsibility for any injury to people or property resulting from any ideas, methods, instructions or products referred to in the content. |
© 2024 by the authors. Licensee MDPI, Basel, Switzerland. This article is an open access article distributed under the terms and conditions of the Creative Commons Attribution (CC BY) license (https://creativecommons.org/licenses/by/4.0/).
Share and Cite
MDPI and ACS Style
Siddharth, A.; Alexiou, C.; Vogiazas, S. Exchange Rate Regimes in India: Central Bank Interventions and Purchasing Power Parity in the Context of ASEAN Currencies. Economies 2024, 12, 96. https://doi.org/10.3390/economies12040096
AMA Style
Siddharth A, Alexiou C, Vogiazas S. Exchange Rate Regimes in India: Central Bank Interventions and Purchasing Power Parity in the Context of ASEAN Currencies. Economies. 2024; 12(4):96. https://doi.org/10.3390/economies12040096
Chicago/Turabian StyleSiddharth, Angad, Constantinos Alexiou, and Sofoklis Vogiazas. 2024. "Exchange Rate Regimes in India: Central Bank Interventions and Purchasing Power Parity in the Context of ASEAN Currencies" Economies 12, no. 4: 96. https://doi.org/10.3390/economies12040096
Note that from the first issue of 2016, this journal uses article numbers instead of page numbers. See further details here.