
The Effect of Access to Information and Communication Technology on Household Labor Income: Evidence from One Laptop Per Child in Uruguay

1
Universidad Torcuato Di Tella, Av. Figueroa Alcorta 7350 (C1428BCW), Buenos Aires 1428 Argentina
2
Department of Economics, Middebury College and IZA, Middlebury, VT 05753, USA
*
Author to whom correspondence should be addressed.
Economies 2017, 5(3), 35; https://doi.org/10.3390/economies5030035
Submission received: 21 June 2017
/
Revised: 31 August 2017
/
Accepted: 4 September 2017
/
Published: 19 September 2017
Abstract
:This paper examines the effect of the One Laptop Per Child program in Uruguay (Plan Ceibal) on household labor income. Since 2007, the Uruguayan government has delivered one laptop to every child and teacher in public primary schools. This program has considerably increased access to information technology within households, as evidenced by parents’ utilization of said technology. Households in the department of Florida received laptops in 2007, while those in the department of Canelones received them in 2009. Therefore, using data from Household Surveys from the National Institute of Statistics in Uruguay, a difference-in-difference model is estimated to capture the effect of the plan of giving laptops on labor income. The results indicate that there is a statistically significant positive effect of the plan on household labor income for households below median income, specifically, those at the 10th and 20th quantiles. Such findings suggest that the program has greater potential when targeted to low-income households, where parents possess lower computer skills.
Keywords:
technology; laptop; Uruguay; labor income; difference-in-difference; median income; quantile regression; propensity-score matchingJEL Classification:
H41; H52; J31; O331. Introduction
This paper analyzes the effect of the recent increase in access to Information and Communication Technology (ICT) on household labor income in Uruguay. Since 2007, under the name of Plan Ceibal, the Uruguayan government has delivered XO laptops1, and eventually Internet connection, to every child and teacher in public primary schools. The program’s objective is to close the prevailing digital divide that can potentially exacerbate existing income inequality (Schiller 1981).
Although children are themselves receiving the laptops, other household members make active use of the technology: 57% of the parents use laptops to acquire computer skills, 45% to gather information, and 31% to navigate the Internet (Plan Ceibal 2012). Thus, as the literature suggests, a positive impact on household labor income can be expected. The aim of this paper is to explore the impact of the recent expansion of access to ICT over household labor income in Uruguay.
This study is relevant today for several reasons. First, it contributes to the limited literature on the impact of access to ICT at home only. Most of the work in the field focuses on returns from computer skills and Internet use at the workplace. Second, it is the first one to explore the effect of the OLPC (One Laptop Per Child) program on household labor income in Uruguay.2 Third, it is one of the few “natural experiments” in the field, since increases in ICT access do not happen frequently at such a large scale. Fourth, it examines over-time changes, as opposed to many other studies that only use cross-sectional data.
A double difference model is implemented to capture the outcome of the program on household labor income. The control group consists of households in the department3 of Canelones, where the plan started in 2009. The treatment group includes households in Florida, where households first received laptops in 2007. Using an earnings function and controlling for gender, ethnicity, civil status, rural location, and access to other ICT devices, the results suggest no significant effect on the overall sample, but significant effects on households below median income, specifically, at the 10th and 20th quantiles. Therefore, these results call for the implementation of policies that target low-income families.
The literature on the impact of ICT access at home is limited, since most studies explore the effects at the workplace. Some of them use cross-sectional data, while others look at changes over time by using panel data. The following section develops the economic literature of the impact of ICT access on income.
2. Background
One of the main issues associated with cross-sectional works is selectivity bias. Krueger (1993), considered to be the cross-sectional pioneer of the field, uses the U.S. Current Population Survey (CPS) from 1984 to 1989, finding that using a computer at home was associated with 9% higher earnings. Nevertheless, DiNardo and Pischke (1997) also find a wage differential associated with the use of pencils, telephones, and calculators, and argue that Krueger’s results suffer from selectivity bias. The authors state that even though a higher wage can result from using technology at work, it is also conceivable that higher-wage workers are the ones who use computers on their jobs (reverse causality). Different scenarios illustrate this phenomenon (DiMaggio and Bonikowski 2008). First, employers may select more qualified workers to adopt new technologies (Entorf and Kramarz 1997). Second, firms with better performance are more able to adopt new technologies and pay higher wages relative to firms that perform more poorly in the market (Domes et al. 1997). Thus, it is easier for firms with more skilled workers to adopt new technologies (Acemoglu 2002).
Other cross-sectional studies for the United States find a positive impact of Internet use on earnings. Goss and Phillips (2002) and Freeman (2002) also use the CPS and conclude that the wage premium resulting from Internet use is approximately 13.5% and 14%, respectively. Navarro (2010) uses cross-sectional data from Brazil, Chile, Costa Rica, Honduras, Mexico, and Paraguay, finding that returns to Internet use range from 18 to 30% for both salaried and self-employed workers. Additionally, Internet use for productive purposes yields positive returns for self-employed workers in Brazil and Chile (Benavente et al. 2011). This suggests that Internet access on its own may not guarantee a wage differential.
In order to overcome selectivity bias, researchers have used panel data. Concerning the effect of ICT access at the workplace, Oosterbeek and Ponce (2009) conclude that unobserved worker characteristics, and not computer use, among Ecuadorian workers explain the wage premium associated with increases in productivity. Entorf and Kramarz (1997) and Haisken-DeNew and Schmidt (1999) reach similar conclusions using data sets from France and Germany, respectively. Other studies support the same results (Borghans and ter Weel 2005; Sakellariou and Patrinos 2003).
On the flip side, Dostie et al. (2009) use the Canadian Workplace and Employee Survey (1999–2001) and conclude that there is a positive impact of computer use after controlling for selectivity bias and unobservable characteristics. The authors implement a mixed effects model (individual fixed effects and matched employer-employee data) and find a 4% return from computer use at the workplace. Using the National Longitudinal Survey of Youth for the years 2000, 2002, 2004, and 2006, Danyal et al. (2011) implement a fixed-effects model and find that individuals possessing computer skills (defined as having a personal computer at home) earn a 4.8% wage premium. Arabsheibani et al. (2004) use data from the British Social Attitudes Survey for 1985 and 1990 and implement the Heckit technique to correct for selectivity bias. Their results show that two-thirds of the wage differential between computer users and non-users is explained by computer use.
Pabilonia and Zoghi (2005) argue that using fixed-effects models to control for unobserved worker characteristics does not control for time-variant unobserved skills. Hence, the authors use matched workplace-employee panel data from Canada and instrument computer possession in order to correct for selectivity bias. They find no statistically significant effect of computer use on wages, but a significant one of computer experience on earnings. That is, a worker with average computer experience earns 13.5% more than a non-computer user. The authors conclude that computer experience as a proxy for computer skills, and not computer use independent of skills, generates a wage differential. Other studies follow the same direction (Borland et al. 2004; Dickerson and Green 2004).
Evidence of a positive return to Internet use is also found in the literature. DiMaggio and Bonikowsky (2008) observed that Internet users in the United States experienced a higher wage increase relative to non-users between 2000 and 2001 (CPS). The returns were significant for Internet use in both places (work and home), as well as only at home. In the same vein, using the same database for 1997, Lee and Kim (2004) found a positive return to information-seeking activities on the Internet.
Hence, the diverse literature on the effect of ICT on earnings indicates that two big challenges arise when estimating such effect: endogeneity of the treatment variable (selectivity bias) and controlling for unobserved (both time variant and invariant) individual characteristics.
3. Methodology and Empirical Framework
One of Gary Becker’s major contributions was to incorporate the idea of human capital intp an economic analysis. His main argument was that factors other than physical capital could also contribute in searching for answers about economic growth and income inequality. In 1962, Becker wrote “the many ways to invest (in human capital)” such as “schooling, on-the-job training, medical care, vitamin consumption, and acquiring information about the economic system (…) improve physical and mental abilities of people and thereby raise real income prospects”.4 In this theoretical context, the aim of this paper is to explore whether greater access to technology and information at home, as a result of Plan Ceibal, has created incentives to investing in human capital.
The expansion of computer technology and the Internet in the last few decades has increased the importance of technology in economics activities. As a result, greater access to information and communication technology at home becomes a significant tool for families to invest in human capital. Evidence shows around half of the parents in Uruguay whose children received XO laptops use the devices for information-seeking activities and computer-skill acquisition (Plan Ceibal 2012). Thus, following Becker’s theoretical framework, an important theoretical implication would be an increase in household labor income as a result of these human-capital investments.
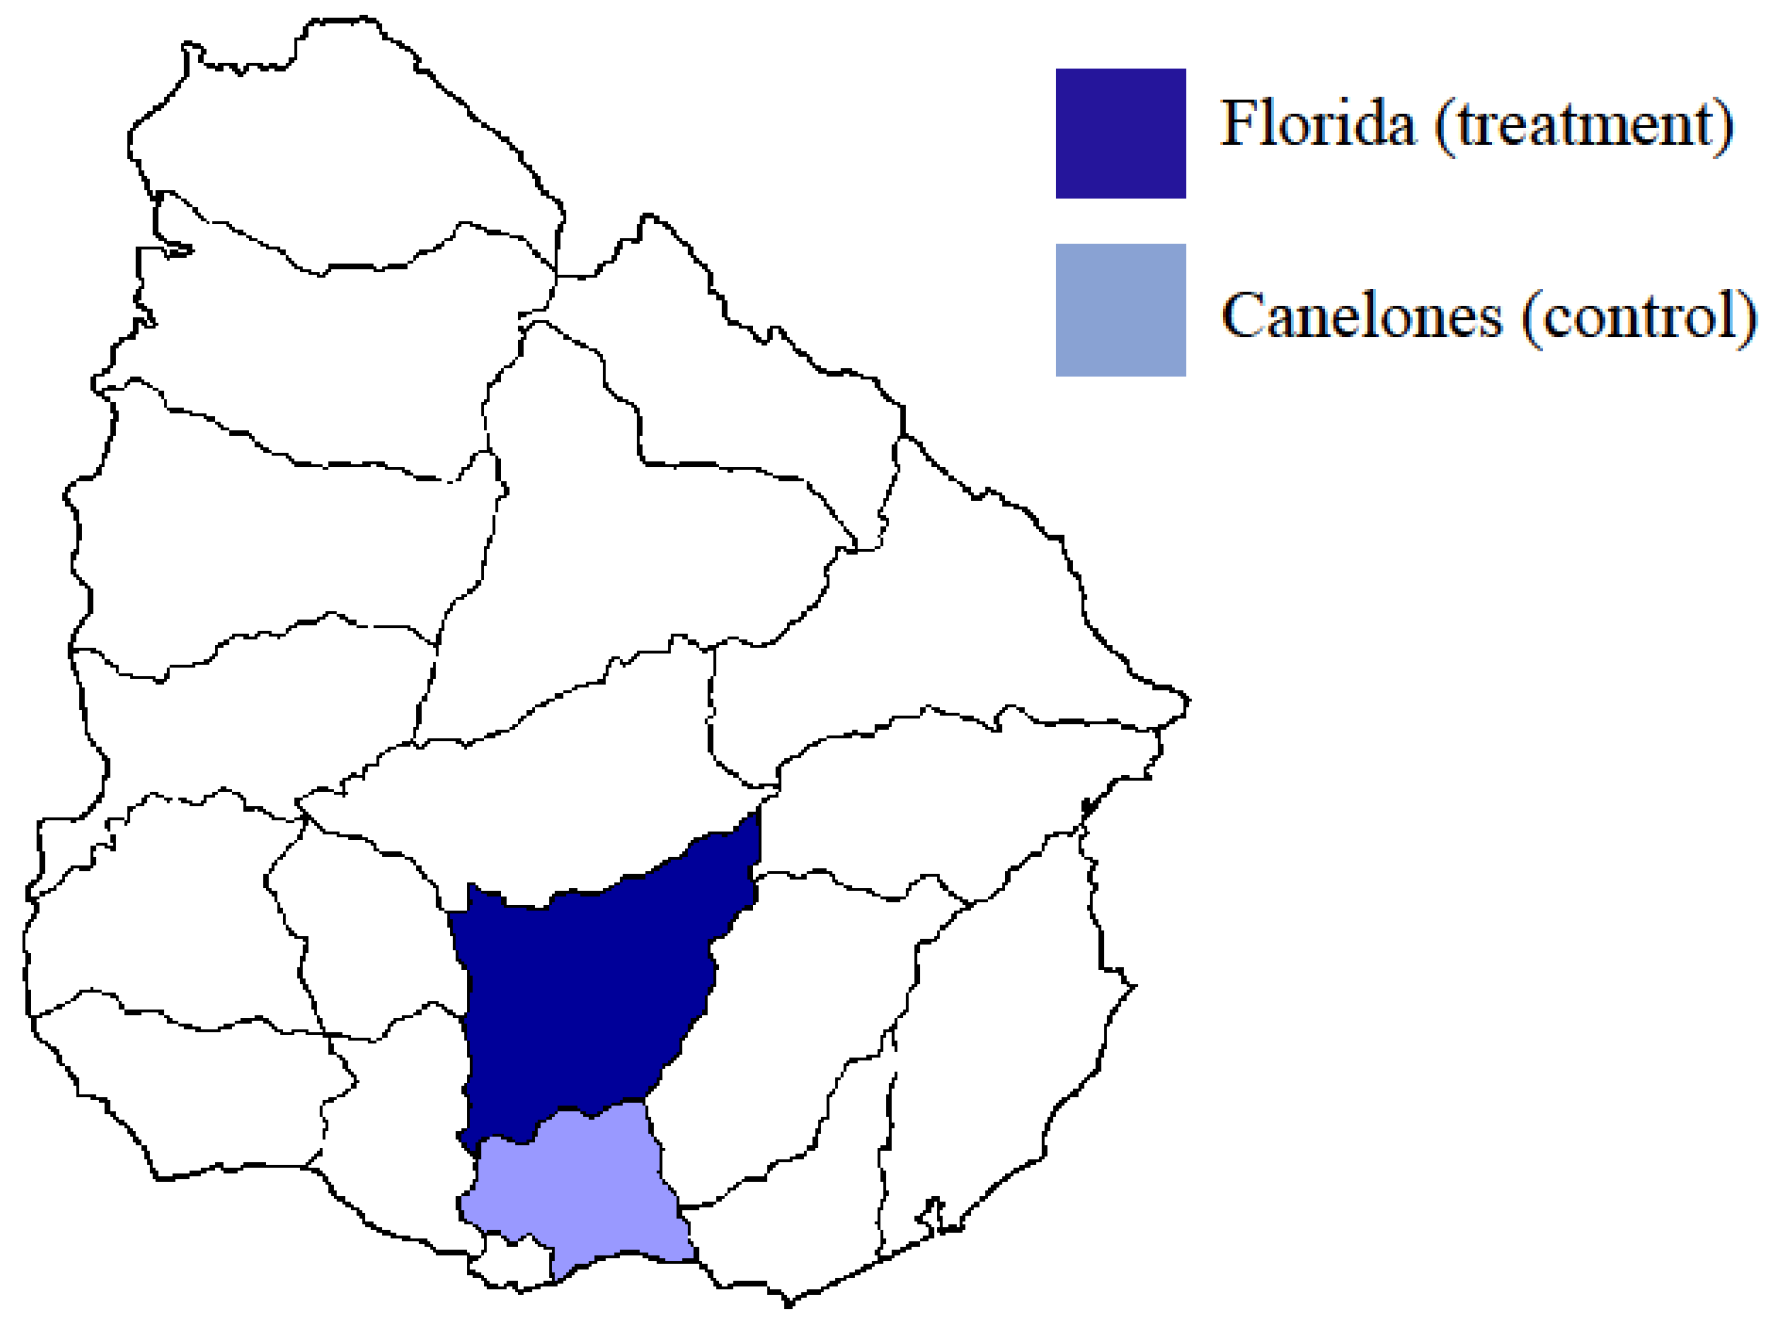
The laptop delivery process suggests the existence of a natural experiment. The program started in the department of Florida in 2007 and reached the department of Canelones in 2009 (Figure 1). A similar trend in urban income per capita for these departments gives strong support to the implementation of a double difference model (Figure 2). Therefore, we design a double difference model where Florida is the treatment group and Canelones is the control group in the years 2006 and 2009.
Data come from the Continuous Household Surveys of Uruguay’s National Institute of Statistics. Two issues are worth noting regarding the design of the double difference model: The survey is not strictly based on a panel data set, and further, the variable that denotes the possession of an XO laptop (laptop) exists only from 2009 onwards. Therefore, we proceed as follows: Households in Florida (treatment group) and Canelones (control group) are selected from the 2009 data set by using such variables. This results in 275 and 677 households selected from each department. Those in Canelones received the laptops in 2009, so we can assume no effect exists. Then, in order to select households that can be comparable to those in the 2009 data set, we use propensity-score matching. Households in the 2009 data set were matched to a selection of households in the 2006 data set based on the treatment variable (laptop) and four covariates: average education, average age, rural, and the number of household members.5 As a result, 204 and 481 households were matched from 2006. This creates an overall sample of 1637 observations, and a below-median-income sample of 817 observations. The summary statistics and the regression results for these two samples are presented in Table 1 and Table 2, respectively.
The basic specification consists of a Mincerian type earnings model. Jacob Mincer, another pioneer of the concept of human capital, was the first to model a relationship between labor income and both education and experience.6 He made a distinction between age and labor market experience, and showed the concave shape of the income-experience relationship. Following Mincer’s framework, the basic specification includes age and potential labor-market experience (including a square term) separately:
The binary variable indicates that a household is located in Florida (i.e., ‘treatment’ group) and that it was observed in 2009 (i.e., ‘after’ the program has been implemented). The coefficient of the interaction term between these two variables is the double difference estimator, which in this model captures the effect of ICT access on household labor income. Education and experience refer to the household average schooling and potential experience. The vector contains head of the household dummies (white, male, and married), while the vector includes dummies that indicate the possession of other ICT devices, such as non-XO computers, cellphones, cable TV, and radio. Controlling for access to other ICT devices does not attempt to establish any causal relationship, but to isolate the effect of other channels whereby information can enter the household. Other control variables are the number of XO laptops in a household and a binary variable indicating that a household is located in a rural area.
Table 1 contains the summary statistics7 of the 1,637 households (i.e., overall sample), as well as of the households below the median (sample size = 817). Treated households account for 29% of the observations, while those surveyed in 2009 comprise 58% of the sample. On average, fully employed members have attended school for approximately 9 years and have an average potential experience of almost 24 years. Approximately 77% of the heads of household are male, 98% are white, and 58% are married. The numbers also show that 28% of the households own a non-XO computer, 44% have cable TV service, 93% possess a radio, and 83% have at least one cellphone. In addition, 13% of the households are located in rural areas and the number of XO laptops is 0.22 per household on average.
The regression results show that there is no statistically significant effect on labor income when using the overall sample. Nevertheless, when using a segmented sample that selects households below the median income, there is a 27% effect on income that is significant at the 1% level (Table 2). This result suggests the effect may vary across the distribution of household income, so we proceed to run quantile regressions (Table 3).8 The double-difference estimator indicates that the program had a statistically significant positive effect on labor income of 49% and 33% at the 10th (q10) and 20th (q20) quantiles, respectively. The coefficient becomes statistically insignificant in all other quantile regressions.9 In terms of control variables, the statistically significant ones are the same at both quantiles: education, potential experience, male head of household, rural household, and the possession of cable TV and radio.
Therefore, even though the results show that there is no statistically significant effect on household income in the overall-sample regressions, there is a positive and statistically significant effect on households below the median income and at the 10th and 20th quantiles.
4. Conclusions and Policy Implications
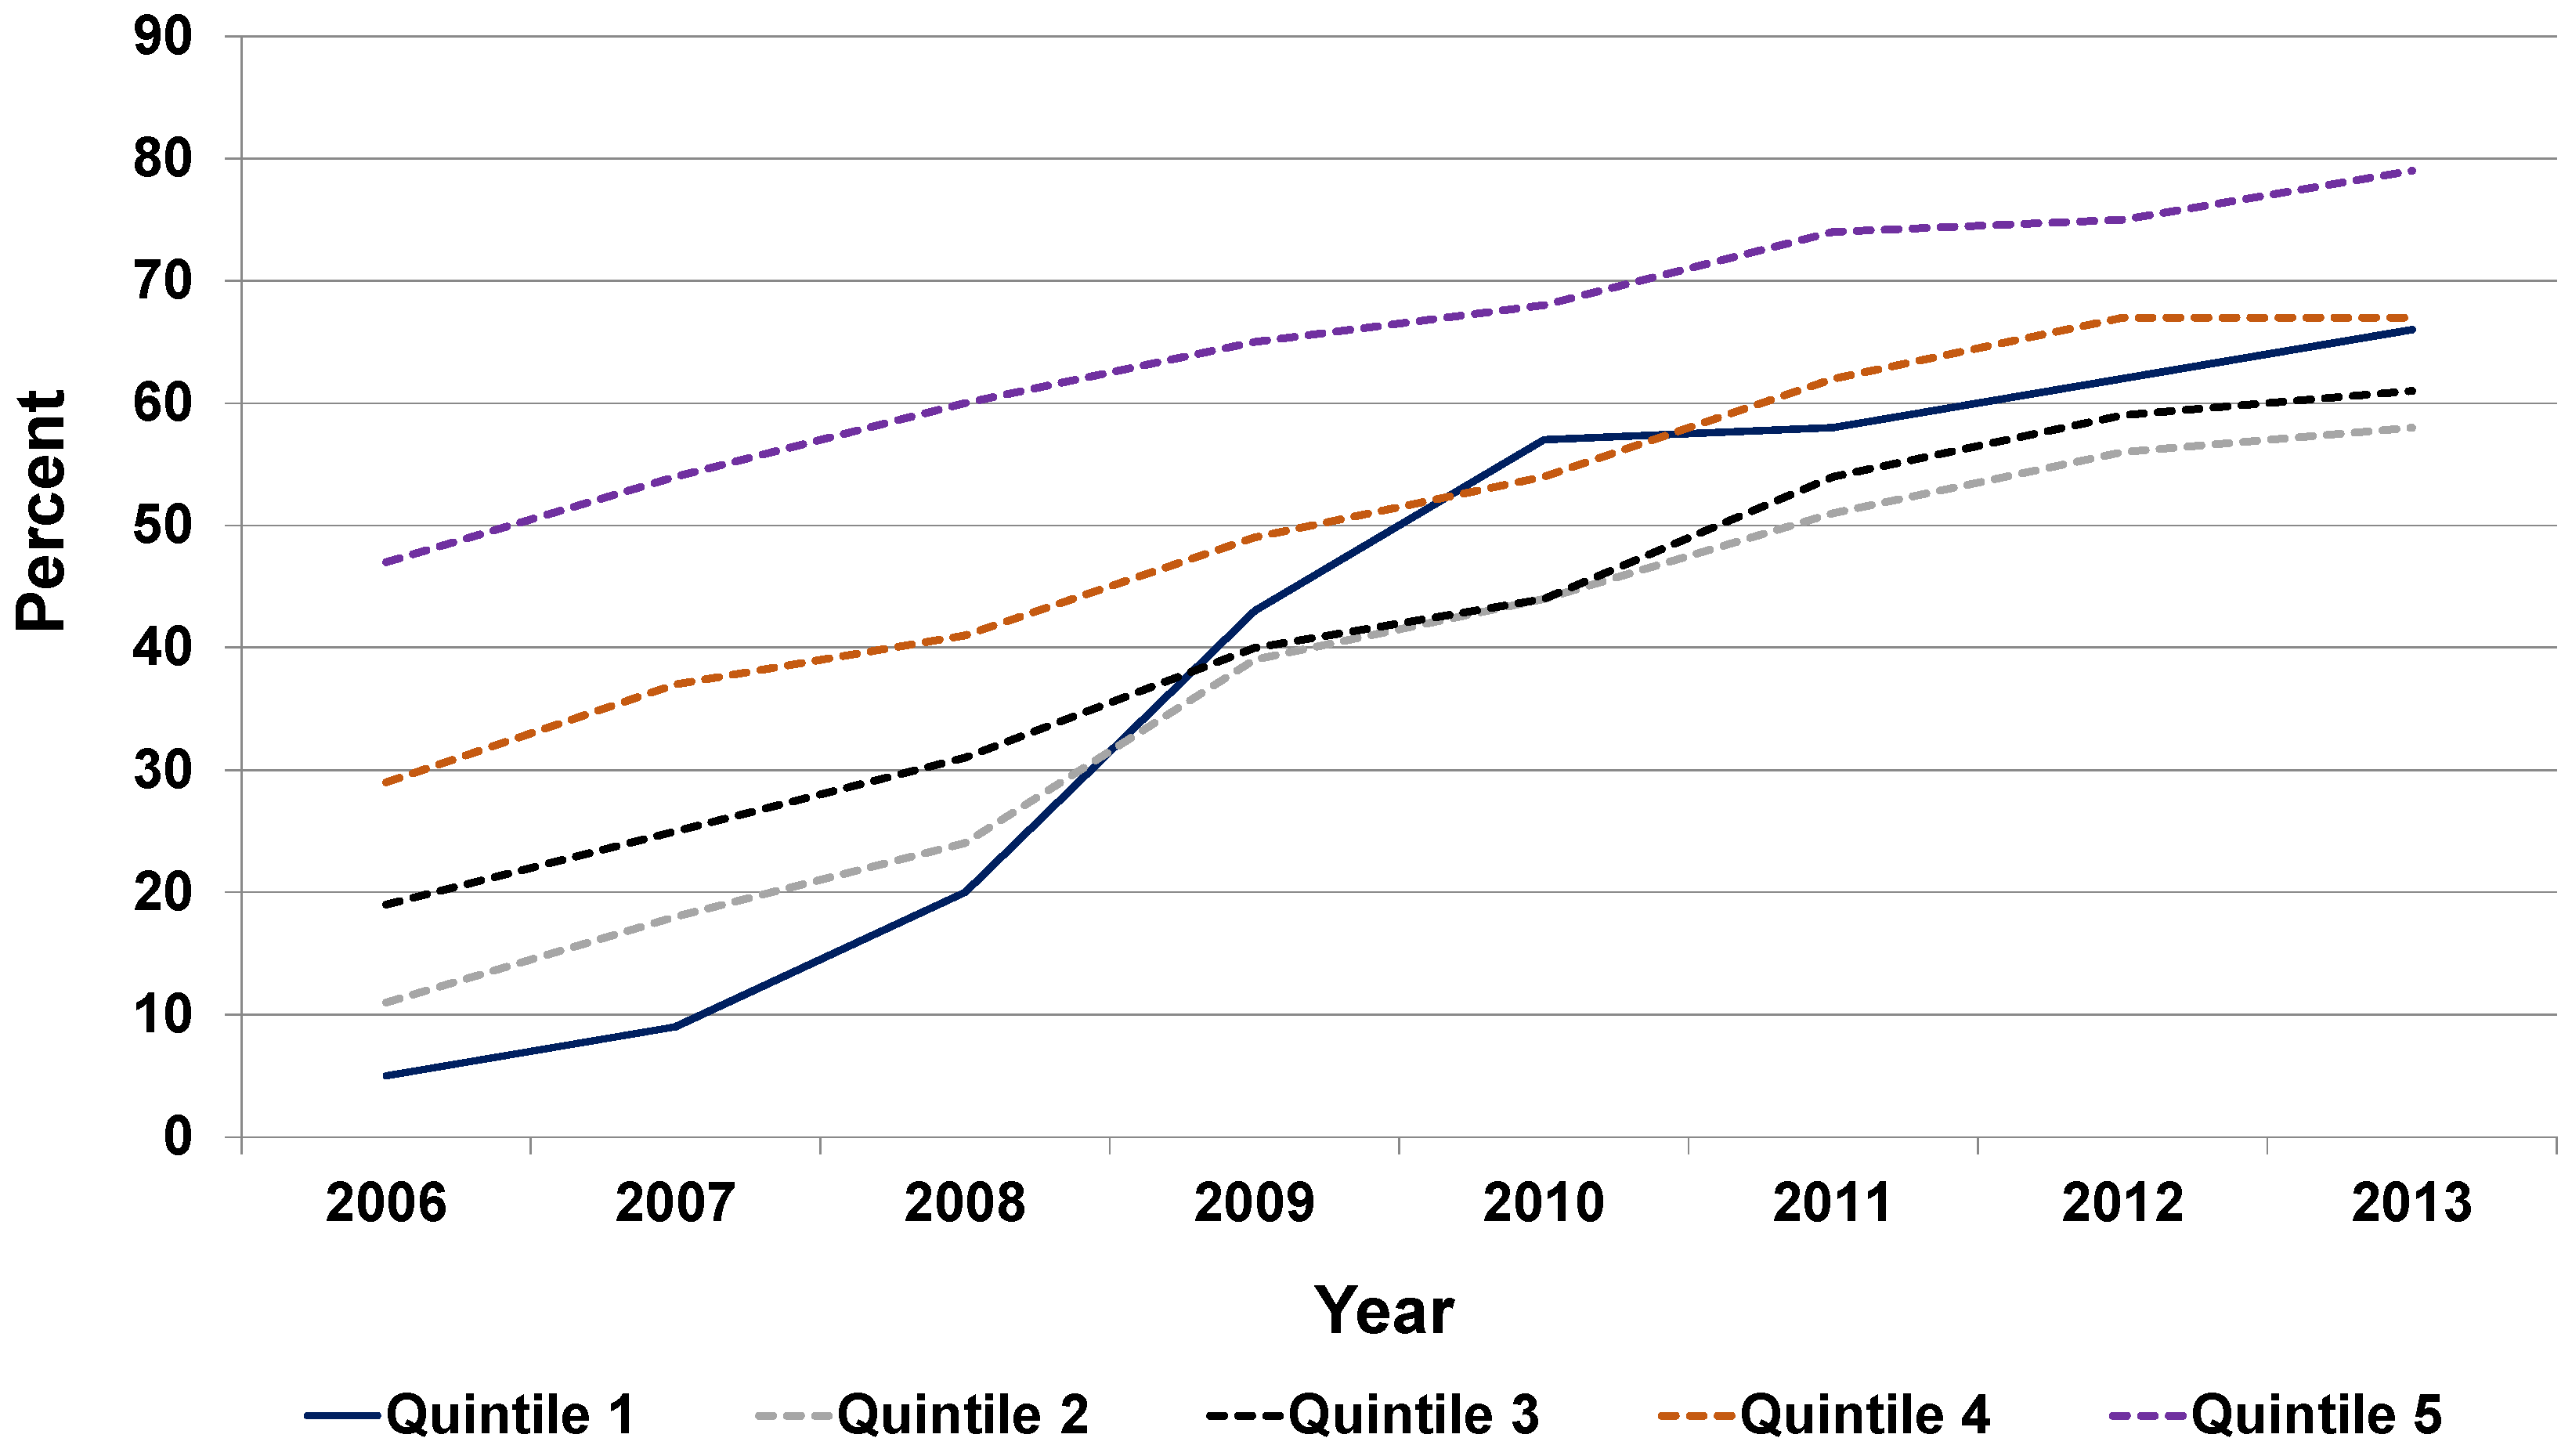
The regression results indicate that the program had a positive effect on those households below median income and those at the 10th and 20th quantiles. However, the double difference model captures no statistically significant effect at the upper quantiles. Pre-existing differences in ICT access help explain such results. According to Ceibal Center, 47% of households in the highest quintile owned a computer in 2006, while in the lowest quintile, only 5% had access to a computer at home (see Figure 3). By 2013, as a result of the program, these numbers had drastically increased to 79% and 66%, correspondingly. Thus, higher-income households were more likely to already have access to ICT before the plan started, while only a small percentage of lower-income households enjoyed such access. This supports the idea that the program did not constitute a substantial change for households that already had computers at home prior to the treatment. Households where the program considerably increased access to the technology experienced an increase in income.
These results, together with data on parents’ use of laptops, suggest the potential impact of Ceibal in reducing inequality has not been maximized yet. In 2011, only 21% of mothers from the lowest socioeconomic level10 used a computer at home, while 86% from the highest level reported to use one (for fathers, these figures are 9% and 71%, respectively). Additionally, 16% of those at the highest level did not know how to use the laptops, against 44% at the lowest level (Plan Ceibal 2012). If low-income household members seem to benefit more, yet half of the parents from these households do not have the skills to use the laptops, then designing policies that target these households would be highly beneficial in terms of diminishing income inequality.
The growing importance of technology in economic activities since the 1990s increases the necessity to provide access to information and communication technology. This is especially true for low-income households, as they usually do not have the resources or the information to make such investments. Our research intends to explore this topic.
Governments in South America seem to be aware of the benefits of providing greater access to information and communication technology—recently, other countries such as Peru and Argentina, have followed Uruguay in the provision of laptops to all students in public schools. This creates opportunities for further research about the effects on household income or other socioeconomic variables.
Acknowledgments
We would like to thank three anonymous referees of this journal for their candid comments and suggestions to improve our paper, and the Editorial Office of Economies for their utmost professionalism in dealing with our submission. We are grateful to Middlebury College Information Technology Services team members: Brian Foley, Jeff Lahaie, and Mark Pyfrom for their timely assistance in extracting the archived data used in our empirics. We would like to thank James Bang for his constructive comments and Tanya Byker for her help with Stata, and Terry Simpkins and Sanjay Wunnava for their excellent editorial recommendations. The usual caveats apply. Finally, we would like to acknowledge that an earlier version of this paper was presented at the Western Economic Association International Conference in Honolulu, Hawaii (July 2015), and was circulated as an IZA (Institute of Labor Economics) discussion paper # 8415 (August 2014).
Author contributions
Both authors contributed equally on this article.
Conflicts of Interest
The authors declare no conflict of interest.
Appendix A. Variables Definitions and Data Sources
Real total labor income = total labor income received by fully employed members the month prior to the interview. So, the CPI from November 2009 is used as the base month for December 2009 earnings in order to convert from nominal to real labor income. Fully employed individuals are selected because their job condition is relatively more stable and thus so are their wages.
Treatment = binary variable indicating that a household is located in Florida.
After = binary variable indicating that a household was observed in 2009.
Treatment × After = interaction term between Treatment and After. The coefficient of this term is the double difference estimator.
Average education = average years of schooling among household members who are fully employed.
Average experience = Average age − 6 − Average education. This specification suggests that individuals enter the labor market right after they finish education, assuming they started school at the age of 6. For this purpose, the variable on schooling excludes attendance in preschool education. Including potential labor experience allows controlling for the effect of both age and experience on earnings.
Male head of household = a binary variable indicating that the head of household is male.
White head of household = a binary variable indicating that the head of household is white.
Married head of household = a binary variable indicating that the head of household is married.
Home computer = a binary variable indicating that a household possesses a non-XO computer. Unfortunately, it is impossible to differentiate between the possession of a XO-computer and a non-XO computer in the 2009 survey. Thus, Internet connection in 2009 is used as a proxy for having a non-XO device.
Cable TV = a binary variable indicating that a household has access to cable TV.
Radio = a binary variable indicating that a household has access to radio.
Cellphone = a binary variable indicating that there is at least one cellphone in the household.
Data sources
2009 Continuous Household Survey. National Institute of Statistics (Uruguay).
2006 Continuous Household Survey. National Institute of Statistics (Uruguay).
Link to website: http://www.ine.gub.uy/.
Appendix B

Table A1.
Other Quantile Regressions.
| Dependent Variable: Log of Total Real Labor Income | q40 | q60 | q80 | ||||||
|---|---|---|---|---|---|---|---|---|---|
| Independent Variables | Coeff. | SE | Coeff. | SE | Coeff. | SE | |||
| F (Treatment) | −0.08 | 0.08 | 0.04 | 0.08 | 0.03 | 0.08 | |||
| A (After) | 0.29 | *** | 0.06 | 0.23 | *** | 0.05 | 0.07 | 0.07 | |
| F × A | 0.09 | 0.09 | −0.01 | 0.09 | −0.06 | 0.10 | |||
| Average education | 0.09 | *** | 0.01 | 0.10 | *** | 0.01 | 0.10 | *** | 0.01 |
| Average experience | 0.07 | *** | 0.01 | 0.05 | *** | 0.01 | 0.06 | *** | 0.01 |
| Average experience squared | 0.00 | *** | 0.00 | 0.00 | *** | 0.00 | 0.00 | *** | 0.00 |
| Male head of household | 0.22 | *** | 0.06 | 0.15 | *** | 0.05 | 0.09 | * | 0.05 |
| White head of household | −0.03 | 0.14 | 0.13 | 0.15 | 0.06 | 0.19 | |||
| Married head of household | 0.13 | ** | 0.05 | 0.14 | *** | 0.04 | 0.09 | * | 0.05 |
| Rural | 0.01 | 0.06 | −0.02 | 0.05 | −0.10 | 0.06 | |||
| Non-XO computer | 0.20 | *** | 0.04 | 0.15 | *** | 0.05 | 0.10 | * | 0.05 |
| Cellphone | −0.19 | *** | 0.07 | −0.14 | ** | 0.06 | −0.08 | 0.08 | |
| Cable TV | 0.18 | *** | 0.05 | 0.12 | *** | 0.04 | 0.13 | *** | 0.05 |
| Radio | 0.16 | 0.10 | 0.11 | 0.08 | 0.15 | 0.10 | |||
| _Constant | 7.34 | *** | 0.22 | 7.65 | *** | 0.20 | 8.12 | *** | 0.23 |
| No. of Obs. | 1637 | 1637 | 1637 | ||||||
| Pseudo R-square | 0.1462 | 0.1513 | 0.1551 | ||||||
* p < 0.10, ** p < 0.05, *** p < 0.010. Note: robust standard errors (SE).
References
- Acemoglu, Daron. 2002. Technical Change, Inequality, and the Labor Market. Journal of Economic Literature 40: 1–72. [Google Scholar] [CrossRef]
- Arabsheibani, G. Reza, Javed M. Emami, and Alan Marin. 2004. The impact of computer use on earnings in the UK. Scottish Journal of Political Economy 51: 82–94. [Google Scholar] [CrossRef]
- Becker, Gary S. 1962. Investment in human capital: A theoretical analysis. The journal of Political Economy 70: 9–49. [Google Scholar] [CrossRef]
- Benavente, Jose Miguel, David Bravo, and Rodrigo Montero. 2011. Wages and Workplace Computer Use in Chile. The Developing Economies 49: 382–403. [Google Scholar] [CrossRef]
- Borghans, Lex, and Bas ter Weel. 2005. How Computerization Has Changed the Labour Market: A Review of the Evidence and a New Perspective. In The Economics of the Digital Society. Cheltenham: Edward Elgar, pp. 219–47. [Google Scholar]
- Borland, Jeff, Joseph Hirschberg, and Jenny Lye. 2004. Computer Knowledge and Earnings: Evidence from Australia. Applied Economics 36: 1979–93. [Google Scholar] [CrossRef]
- Danyal, Shah, Pankaj Maskara, and Annaheeta Naqvi. 2011. Impact of computer skills on wages in USA. Applied Economics Letters 18: 1077–81. [Google Scholar] [CrossRef]
- De Melo, Gioia, Alina Machado, and Alfonso Miranda. 2017. The Impact on Learning of a One Laptop per Child Program. Evidence from Uruguay. Trimestre Economico 84: 383–409. [Google Scholar] [CrossRef]
- Dickerson, Andy, and Francis Green. 2004. The Growth and Valuation of Computing and Other Generic Skills. Oxford Economic Papers 56: 371–406. [Google Scholar] [CrossRef]
- DiMaggio, Paul, and Bart Bonikowski. 2008. Make money surfing the web? The impact of Internet use on the earnings of US workers. American Sociological Review 73: 227–50. [Google Scholar] [CrossRef]
- DiNardo, John E., and Jörn-Steffen Pischke. 1997. The returns to computer use revisited: Have pencils changed the wage structure too? The Quarterly Journal of Economics 112: 291–303. [Google Scholar] [CrossRef]
- Domes, Mark, Timothy Dunne, and Kenneth Troske. 1997. Workers, Wages and Technology. Quarterly Journal of Economics 112: 253–90. [Google Scholar] [CrossRef]
- Dostie, Benoit, Rajshri Jayaranam, and Mathieu Trépanier. 2009. What (if any) are the returns to computer use? Applied Economics 42: 3903–12. [Google Scholar] [CrossRef]
- Entorf, Horst, and Francis Kramarz. 1997. Does unmeasured ability explain the higher wages of new technology workers? European Economic Review 41: 1489–509. [Google Scholar] [CrossRef]
- Freeman, Richard. 2002. The Labour Market in the New Information Economy. Oxford Review of Economic Policy 18: 288–305. [Google Scholar]
- Goss, Earnest P., and Joseph M. Phillips. 2002. How information technology effects wages: Evidence using Internet usage as a proxy for IT skills. Journal of Labor Research 23: 463–74. [Google Scholar] [CrossRef]
- Haisken-DeNew, John, and Christoph Schmidt. 1999. Money for nothing and your chips for free? The anatomy of the PC wage differential. Discussion Paper # 86. Bonn: IZA (Institute of Labor Economics). [Google Scholar]
- Krueger, Alan B. 1993. How computers have changed the wage structure: evidence from microdata, 1984–1989. The Quarterly Journal of Economics 108: 33–60. [Google Scholar] [CrossRef]
- Lee, Sang-Hyop, and Jonghyuk Kim. 2004. Has the Internet Changed the Wage Structure Too? Labour Economics 11: 119–27. [Google Scholar] [CrossRef]
- Mincer, Jacob. 1958. Investment in human capital and personal income distribution. Journal of Political Economy 66: 281–302. [Google Scholar] [CrossRef]
- Navarro, Lucas. 2010. The Impact of Internet Use on Individual Earnings in Latin America. Development Research Working Paper Series 11/2010. La Paz: Institute for Advanced Development Studies. [Google Scholar]
- Oosterbeek, Hessel, and Juan Ponce. 2009. The impact of computer use on wages in a developing country: Evidence from Ecuador. Labour Economics 18: 434–40. [Google Scholar] [CrossRef]
- Pabilonia, Sabrina Wulff, and Cindy Zoghi. 2005. Returning to the returns to computer use. The American Economic Review 95: 314–17. [Google Scholar] [CrossRef]
- Plan Ceibal. 2009. Primer Informe Nacional de Monitoreo y Evaluación del Plan Ceibal. Montevideo: Monitoring and Evaluation Department of Plan Ceibal. [Google Scholar]
- Plan Ceibal. 2012. Annual Evaluation in Primary School, 2009–2011. Montevideo: Monitoring and Evaluation Department of Plan Ceibal. [Google Scholar]
- Sakellariou, Chris N., and Harry Anthony Patrinos. 2003. Technology, Computers, and Wages: Evidence from a Developing Economy. Washington: The World Bank. [Google Scholar]
- Schiller, Herbert I. 1981. Who Knows: Information in the Age of the Fortune 500. New York: ABLEX Publishing Corporation. [Google Scholar]
| 1 | Inexpensive laptop created by the MIT Media Lab. |
| 2 | De Melo et al. (2017) look at the effects of Plan Ceibal on school performance in Uruguay. |
| 3 | “Department” refers to the administrative divisions of Uruguay. There are 19 departments in the country; Florida and Canelones are two of them. |
| 4 | |
| 5 | We use the teffects psmatch Stata command. |
| 6 | |
| 7 | See Appendix A for variables definitions. |
| 8 | We want to thank one of the anonymous referees for recommending the use of a quantile regression model. |
| 9 | See Appendix B for q40, q60, and q80 results. |
| 10 | The socioeconomic level index is constructed by the Institute of Statistics from the Department of Economics and Administration at Universidad de la Republica in Uruguay. The index considers the following variables: the mother’s educational attainment, household overcrowding conditions and possession of appliances and technologies (Plan Ceibal 2009). |
Figure 1.
Map of Uruguay.

Figure 2.
Monthly average per capita income in urban households in current pesos. Source: Continuous Household Survey–National Institute of Statistics.
Figure 2.
Monthly average per capita income in urban households in current pesos. Source: Continuous Household Survey–National Institute of Statistics.
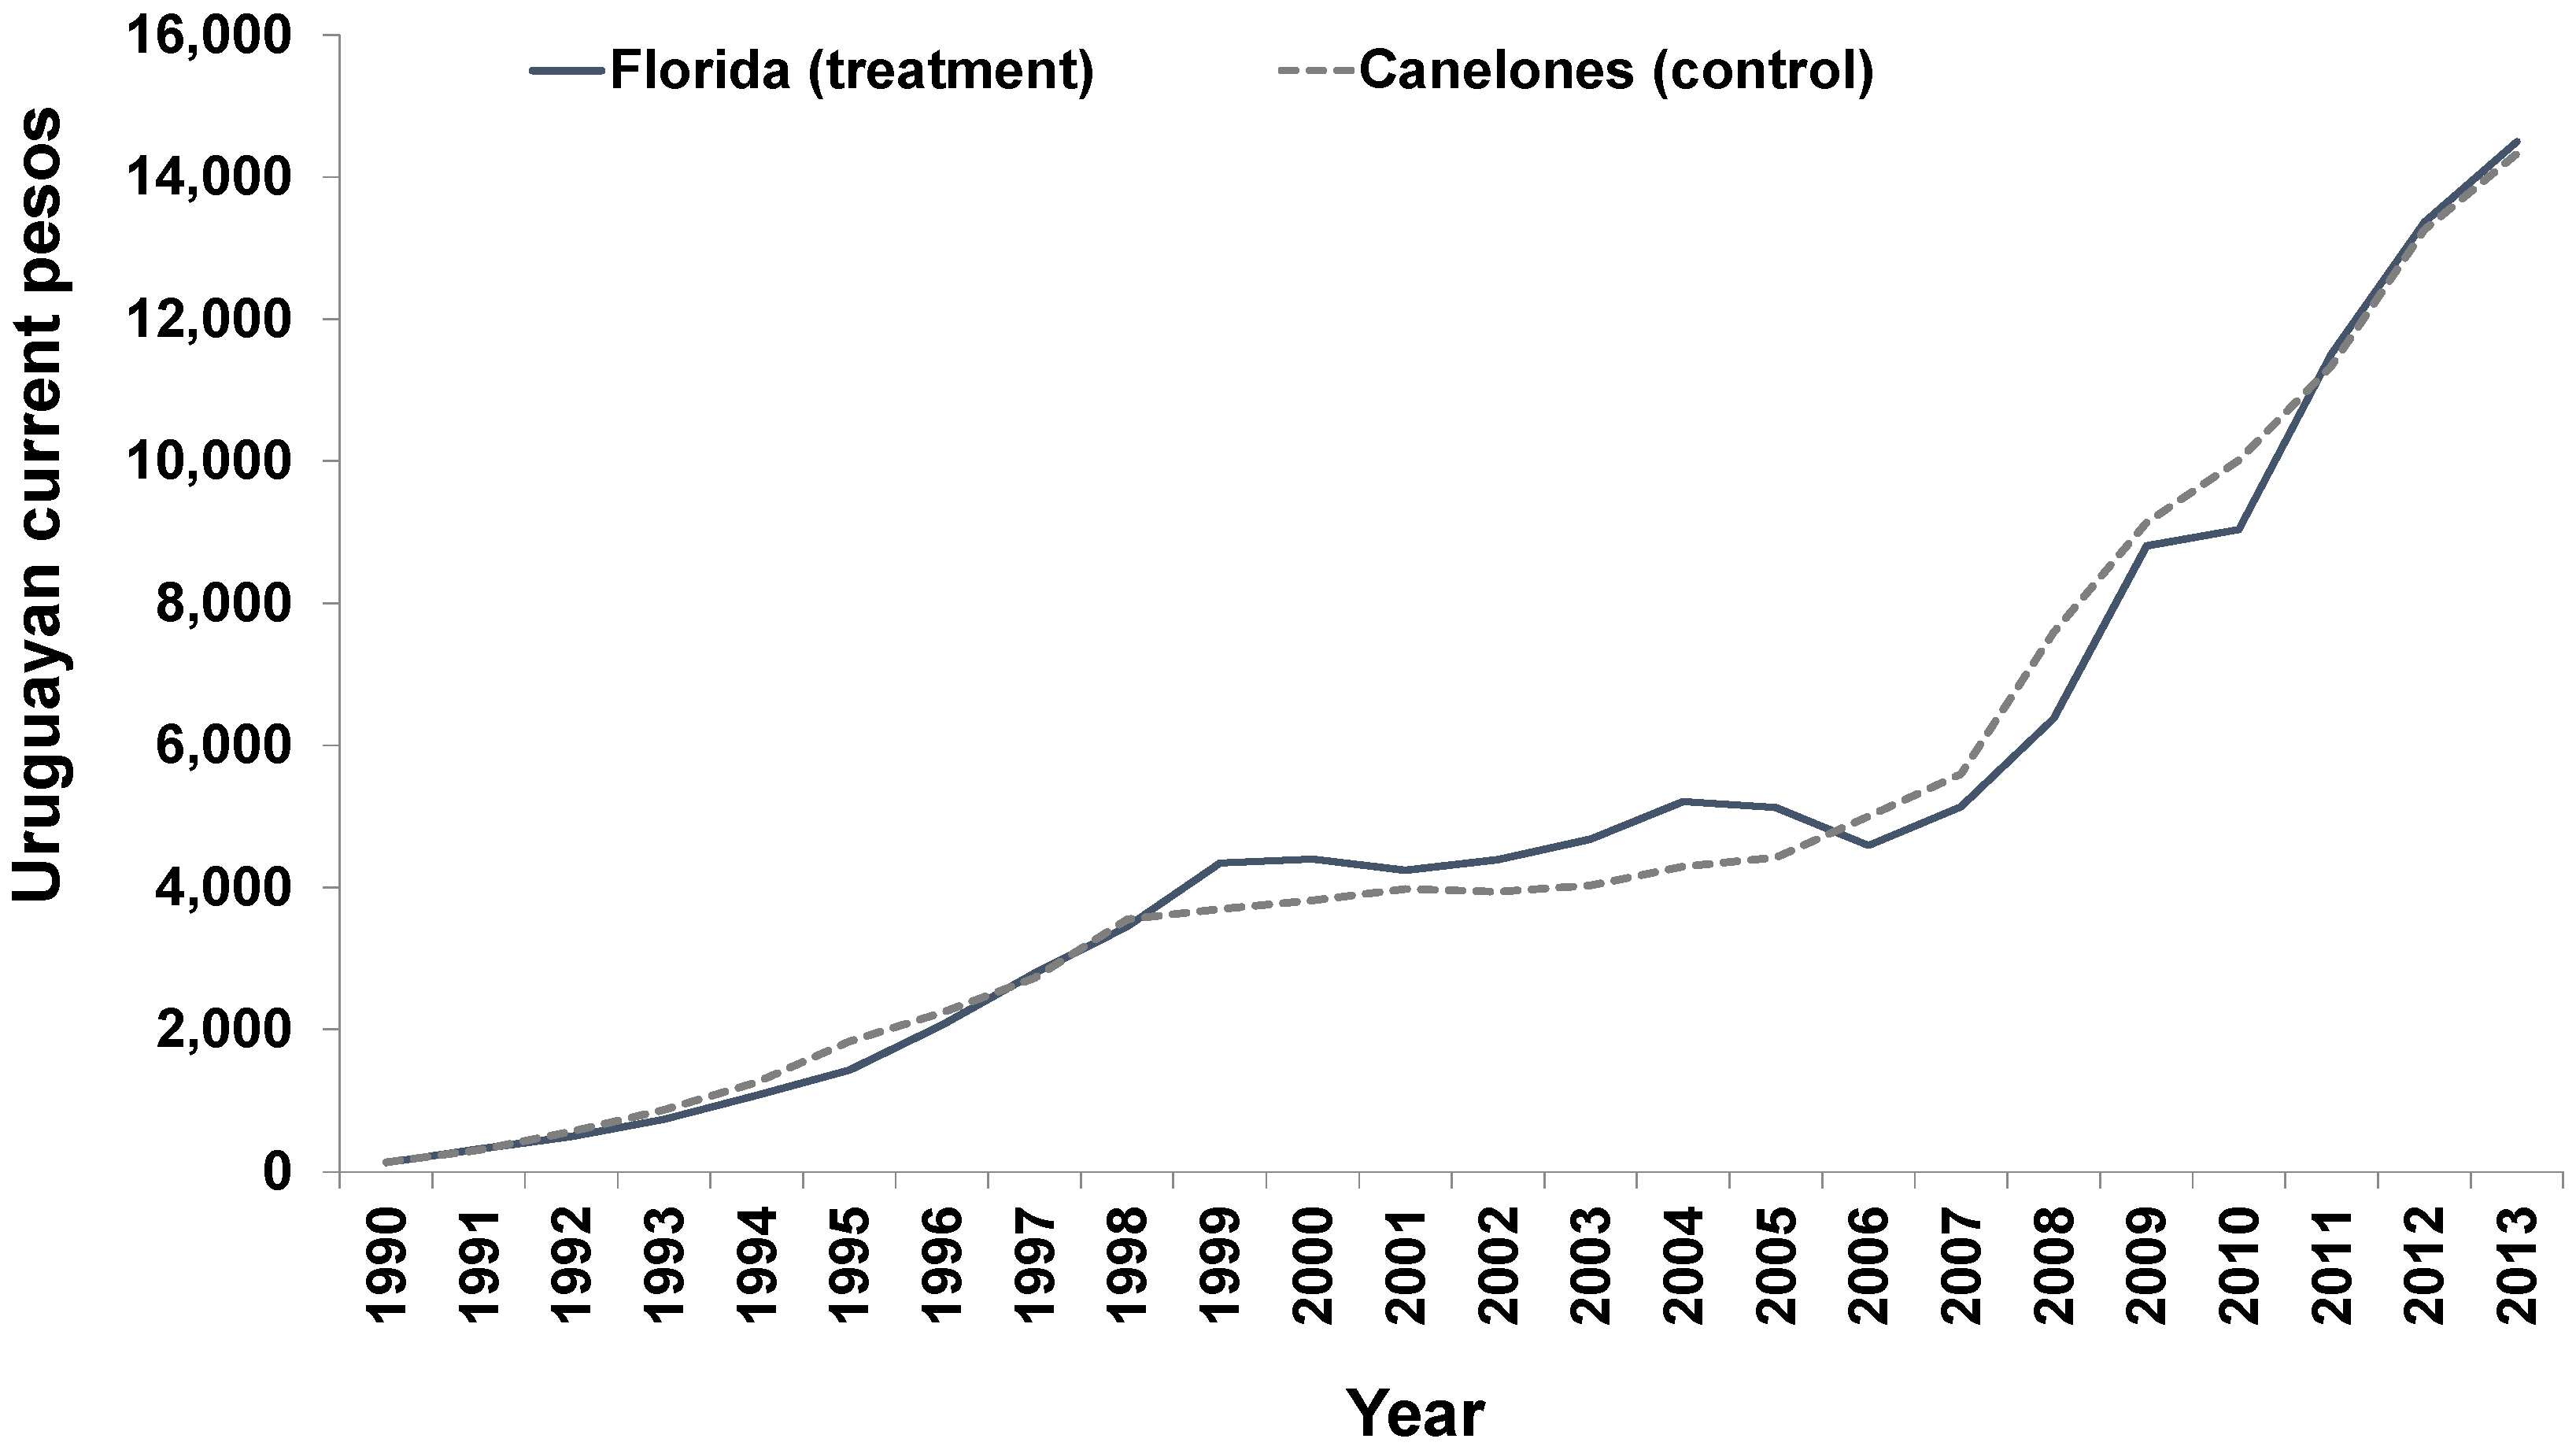
Figure 3.
Access to home computer per income quintile (percentage of households). Source: Plan Ceibal.
Figure 3.
Access to home computer per income quintile (percentage of households). Source: Plan Ceibal.

Table 1.
Summary statistics.
| Variable | Overall Sample n = 1637 | Below Median n = 817 | ||
|---|---|---|---|---|
| Mean | Std. Dev. | Mean | Std. Dev. | |
| Log of total real labor income | 9.50 | 0.85 | 8.88 | 0.70 |
| Treatment (household in Florida) | 0.29 | 0.46 | 0.29 | 0.46 |
| After(year 2009) | 0.58 | 0.49 | 0.58 | 0.49 |
| Treatment × After | 0.17 | 0.37 | 0.17 | 0.37 |
| Average education | 8.92 | 3.29 | 7.79 | 2.79 |
| Average experience | 23.45 | 10.07 | 23.90 | 11.23 |
| Male head of household | 0.77 | 0.42 | 0.73 | 0.44 |
| White head of household | 0.98 | 0.13 | 0.98 | 0.13 |
| Married head of household | 0.58 | 0.49 | 0.51 | 0.50 |
| Rural household | 0.13 | 0.34 | 0.15 | 0.35 |
| Home computer | 0.28 | 0.45 | 0.18 | 0.38 |
| Cellphone | 0.83 | 0.38 | 0.83 | 0.38 |
| Cable TV | 0.44 | 0.50 | 0.37 | 0.48 |
| Radio | 0.93 | 0.25 | 0.92 | 0.27 |
Source: Continuous Households Survey, 2006 and 2009. National Institute of Statistics (Uruguay).
Table 2.
Regression results.
| Dependent Variable: Log of Total Real Labor Income | Overall Sample | Below Median | ||||
|---|---|---|---|---|---|---|
| Independent Variables | Coeff. | SE | Coeff. | SE | ||
| F (Treatment) | −0.02 | 0.07 | −0.07 | 0.07 | ||
| A (After) | 0.17 | *** | 0.05 | 0.15 | ** | 0.06 |
| F × A | 0.08 | 0.08 | 0.27 | *** | 0.09 | |
| Average education | 0.10 | *** | 0.01 | 0.05 | *** | 0.01 |
| Average experience | 0.07 | *** | 0.01 | 0.05 | *** | 0.01 |
| Average experience squared | 0.00 | *** | 0.00 | 0.00 | *** | 0.00 |
| Male head of household | 0.20 | *** | 0.05 | 0.18 | *** | 0.07 |
| White head of household | −0.02 | 0.13 | −0.03 | 0.16 | ||
| Married head of household | 0.08 | * | 0.04 | 0.00 | 0.05 | |
| Rural | 0.01 | 0.05 | 0.07 | 0.06 | ||
| Non-XO computer | 0.14 | *** | 0.04 | −0.05 | 0.06 | |
| Cellphone | −0.14 | ** | 0.06 | −0.04 | 0.07 | |
| Cable TV | 0.16 | *** | 0.04 | 0.11 | ** | 0.05 |
| Radio | 0.19 | ** | 0.09 | 0.22 | * | 0.11 |
| _Constant | 7.24 | *** | 0.21 | 7.42 | *** | 0.25 |
| No. of Obs. | 1637 | 817 | ||||
| R-square | 0.258 | 0.135 | ||||
| F value | 34.02 (14, 1622) | 7.60 (14, 802) | ||||
* p < 0.10, ** p < 0.05, *** p < 0.010. Note: robust standard errors (SE).
Table 3.
Quantile regression results for q10, q20, and q30.
| Dependent Variable: Log of Total Real Labor Income | q10 | q20 | q30 | ||||||
|---|---|---|---|---|---|---|---|---|---|
| Independent Variables | Coeff. | SE | Coeff. | SE | Coeff. | SE | |||
| F (Treatment) | −0.30 | ** | 0.14 | −0.19 | * | 0.11 | −0.15 | 0.11 | |
| A (After) | 0.18 | * | 0.11 | 0.25 | *** | 0.08 | 0.26 | *** | 0.07 |
| F × A | 0.49 | *** | 0.18 | 0.33 | ** | 0.15 | 0.20 | 0.13 | |
| Average education | 0.11 | *** | 0.01 | 0.10 | *** | 0.01 | 0.09 | *** | 0.01 |
| Average experience | 0.08 | *** | 0.02 | 0.07 | *** | 0.01 | 0.07 | *** | 0.01 |
| Average experience squared | 0.00 | *** | 0.00 | 0.00 | *** | 0.00 | 0.00 | *** | 0.00 |
| Male head of household | 0.37 | *** | 0.10 | 0.29 | *** | 0.07 | 0.22 | *** | 0.07 |
| White head of household | 0.20 | 0.26 | 0.07 | 0.28 | −0.13 | 0.21 | |||
| Married head of household | 0.01 | 0.09 | 0.11 | 0.08 | 0.14 | ** | 0.06 | ||
| Rural | 0.31 | *** | 0.10 | 0.15 | * | 0.09 | 0.06 | 0.06 | |
| Non-XO computer | 0.18 | * | 0.11 | 0.25 | *** | 0.07 | 0.23 | *** | 0.06 |
| Cellphone | −0.16 | 0.11 | −0.11 | 0.09 | −0.17 | ** | 0.08 | ||
| Cable TV | 0.18 | ** | 0.08 | 0.12 | 0.08 | 0.18 | *** | 0.07 | |
| Radio | 0.43 | * | 0.22 | 0.10 | 0.16 | 0.14 | 0.09 | ||
| _Constant | 5.61 | *** | 0.38 | 6.59 | *** | 0.39 | 7.15 | *** | 0.31 |
| No. of Obs. | 1637 | 1637 | 1637 | ||||||
| Pseudo R-square | 0.1715 | 0.1503 | 0.1452 | ||||||
* p < 0.10, ** p < 0.05, *** p < 0.010. Note: robust standard errors (SE).
© 2017 by the authors. Licensee MDPI, Basel, Switzerland. This article is an open access article distributed under the terms and conditions of the Creative Commons Attribution (CC BY) license (http://creativecommons.org/licenses/by/4.0/).
Share and Cite
MDPI and ACS Style
Marandino, J.; Wunnava, P.V. The Effect of Access to Information and Communication Technology on Household Labor Income: Evidence from One Laptop Per Child in Uruguay. Economies 2017, 5, 35. https://doi.org/10.3390/economies5030035
AMA Style
Marandino J, Wunnava PV. The Effect of Access to Information and Communication Technology on Household Labor Income: Evidence from One Laptop Per Child in Uruguay. Economies. 2017; 5(3):35. https://doi.org/10.3390/economies5030035
Chicago/Turabian StyleMarandino, Joaquin, and Phanindra V. Wunnava. 2017. "The Effect of Access to Information and Communication Technology on Household Labor Income: Evidence from One Laptop Per Child in Uruguay" Economies 5, no. 3: 35. https://doi.org/10.3390/economies5030035
Note that from the first issue of 2016, this journal uses article numbers instead of page numbers. See further details here.