
Labor Costs and Foreign Direct Investment: A Panel VAR Approach

1
Department of Economics, Hacettepe University, Beytepe 06800, Ankara, Turkey
2
Department of Economics, Bilkent University, Bilkent 06800, Ankara, Turkey
*
Author to whom correspondence should be addressed.
Economies 2017, 5(4), 36; https://doi.org/10.3390/economies5040036
Submission received: 22 May 2017
/
Revised: 2 August 2017
/
Accepted: 8 September 2017
/
Published: 26 September 2017
(This article belongs to the Special Issue FDI and Development: Emerging Issues)
Abstract
:This paper examines the endogenous interaction between labor costs and Foreign Direct Investment (FDI) in the OECD countries via the Panel VAR approach under system GMM estimates for the period 1995–2009. The available data allows identifying the relevance of the components of labor costs, and allows a detailed analysis across different sectors. Empirical findings have revealed that sectoral composition of FDI and the decomposition of labor costs play a significant role in investigating the dynamic association between labor costs and FDI. Further, results suggest that labor market policies should focus on productivity-enhancing tools in addition to price hindering tools.
JEL Classification:
F23; J31; C331. Introduction
The prominent role of Multinational Enterprises (MNEs) in the global and host country labor markets has led to increased discussion of the implications on labor market indicators, especially wages. One strand of the literature focuses on labor costs as an investment motive of MNEs. One of the basic motives behind the foreign direct investment (FDI) is the search by firms for lower production costs (Eckel 2003). One argument is that this motive leads to the flow of FDI from high-wage to low-wage countries (OECD 1993; Feenstra and Hanson 1996 and 1997; Lemoine 1998 and Eckel 2003). While several studies find evidence supporting the cost-seeking motives of FDI (see Wei (2000), Campos and Kinoshita (2003), and Janicki and Wunnava (2004), among others), several studies find either no robust relationship between labor cost and FDI (see Dunning (1993) and Chakrabarti (2001), among others) or even a positive relationship (see Wheeler and Mody (1992), Schneider and Frey (1985), and Vijayakumar et al. (2010), among others).
The perception that MNEs seek cheap labor has convinced some policy-makers to pursue low wages as an FDI policy (Eckel 2003). Particularly, low wage competition among many countries to attract and preserve the investments by MNEs has increased apprehensions about job losses and declining wages, threatening the economic well-being of the workers. Competition to preserve the relative labor cost advantage may generate significant downward pressure on wages, leading to the race to the bottom hypothesis (Crotty et al. 1998; Burke and Epstein 2001; Harrison 2002; Rodrik 1998). This debate is built on the argument that the foreign investment activities contribute to lower wages.
In this context, a large body of theoretical and empirical literature on FDI has visited this issue of wage spillovers from foreign firms to the local labor market. Several studies, including those by Baldwin (1995) for OECD countries, Conyon et al. (2002) and Driffield and Girma (2003) for the UK, Cragg and Epelbaum (1995) and Feenstra and Hanson (1997) for Mexico, Aitken et al. (1996) for Venezuela, Mexico, and United States, Almeida (2007) for Portugal, Gopinath and Chen (2003) for developing/developed countries, Ruane and Uğur (2004) for Ireland, and Lipsey and Sjöholm (2004, 2006) for Indonesia, have found positive effects of FDI on wages. On the other hand, respectively studying Ireland and developing countries, Barry et al. (2005) and Das (2002) have found supporting evidence for the negative effects of FDI on wages. Finally, Onaran (2009) studying Turkey, Korea, and Mexico, and Feliciano and Lipsey (2006) studying the United States, have found no significant impact of FDI on wages. A recent study by Economou et al. (2017) identified labor costs as one of the most important determinants of FDI for 24 OECD countries and 22 developing countries over the period 1980–2012. For China, Girma et al. (2016), and for France, Gazaniol and Laffineur (2015) found that FDI has a positive and significant impact on wages. But for Swedish manufacturing firms, over the period 1980–2005, the results do not indicate a significant impact of foreign presence on wages. The variation in results may be on account of the use of different time frames, country samples, estimation techniques and theoretical frameworks.
What matters for our discussion is that there is significant interest in understanding the link between FDI and labor costs. Yet, none of the existing studies have taken into account that the relationship between FDI and labor costs is dynamic in nature. All of the existing studies consider the static association between labor costs and FDI where one of these variables is assumed to be exogenous. In this paper, we seek to contribute to the discussion by providing empirical evidence of the dynamic interaction between labor cost and MNEs, rather than on one of the dimensions of this interaction. As such, one of the empirical questions posed in this paper is which dimension of this dynamic interaction dominates: the contribution of MNEs in keeping the wages low, or MNEs’ desire to invest in countries with already low wages. A testing of the existence of this bi-directional, dynamic association between labor costs and FDI will add to the debate on the contribution of FDI to the race-to-the-bottom hypothesis.
While so far we have used the terms “labor costs” and “wages” interchangeably, an exact definition of the two concepts would point to significant differences. Labor costs encompass wages, as well as non-wage factors such as benefits and taxes. This wage and non-wage decomposition of labor costs could provide further important information. One interpretation of such decomposition could be that the dominant part of compensation to labor—wages—is mainly reflective of labor’s productivity, whereas the non-wage component is mainly reflective of taxes and firm-side labor market frictions (such as training costs, costs of hiring/firing, etc.). The non-wage component of labor costs is mainly reflective of the regulatory burdens of the labor market that is determined by the policy-makers. This decomposition is also reflective of the labor cost that is relevant for the firms and workers: While the total labor cost is the relevant indicator from the perspective of the labor demanders (firms), the labor suppliers are mainly concerned about the wage/compensation component of this total cost.
Finally, it is important to note that while the discussion so far has focused on overall FDI, the sectoral composition of this overall FDI has been changing over time and differs across regions. The foreign investment activities of these MNEs take place predominantly in the manufacturing and services sectors. In 2014, the latest year for which sectoral breakdown estimates are available, services accounted for 64 percent of FDI, followed by manufacturing (27 percent) and the primary sector (7 percent), with 2 percent unspecified (UNCTAD 2016). Therefore, analyzing the dynamic association among labor costs and FDI across different sectors is also of significance, particularly for the manufacturing sector.
Within this context, this paper seeks to contribute to these debates by providing an integrated assessment of the role of FDI on different types of labor costs in the different sectors in the OECD countries by using panel Granger-Causality analysis under system GMM estimates for the period 1995–2009. This framework will allow testing for the existence of any bi-directional association between labor costs and FDI. Even though many observers have emphasized the crucial role of labor costs in attracting FDI, no study up to date has questioned this issue by employing the methodology of panel VAR (panel Granger Causality and Impulse Response Functions), or by studying the macroeconomic endogenous association between the two relevant variables. Thereby, the main goal of this paper is to enrich the existing literature by combining the time series and the cross sectional dimensions of the data via panel VAR and highlight the endogenous interaction between different labor costs and FDI. The application of panel VAR analysis based on the system GMM approach is the first attempt to check for the endogenous interaction different labor costs and FDI, where the system GMM allows us to take better care of a small sample, the omitted variables, and endogeneity problems. Moreover, the available data allows for the identification of the relevance of the components of labor costs, and allows for a detailed analysis across different sectors. For the robustness of the results, we re-derive the impulse response functions by excluding the year 2008–2009.
2. Data and Methodology
Our analysis is based on data for the 23 OECD economies for the period 1995 to 2010 for which the data is available. The data is obtained from the OECD database, which allows combining cross-sectional and time series information to test for any endogenous interaction between different labor costs and FDI, and to do so across a range of sectors.
2.1. Data
The analysis is made possible by the availability of a detailed dataset across sectors and data on the decomposition of unit labor costs. Given the significance of the labor cost indicators and FDI for the analysis, a detailed discussion of these two variables is important.
The most basic measure of labor returns is the wage rate, which includes the basic wage, cost-of-living allowances, and other guaranteed and regularly paid allowances. This is different than the earnings of the workers, where earnings include not only wages but also the overtime payments, bonuses, the gratuities irregularly paid, and payments in kind. To earnings one can add the employer contribution to statutory social security schemes or privately funded social insurance schemes, and the unfunded employee social benefits paid by employers in the form of: (a) children, spouses, family, education, or other allowances in respect of dependents; (b) payments made to workers because of illness, accidental injury, maternity leave, etc.; (c) severance payments, to obtain the compensation of employees’ measurements. This measure— the compensation of employees—is the relevant labor cost measure from the perspective of labor itself. Those who supply labor care about this part of the labor cost. If one were to add to this compensation of employees measures of labor market taxes (payroll or employment taxes), labor costs not classified anywhere else (such as the costs of the transport of workers, the cost of clothing for workers, the costs of recruitment, etc.), and the costs of vocational and welfare training, then one would obtain the total labor cost measure. The total labor costs expended for the production of one unit of output is then defined as the unit labor cost, and is the relevant measure of labor cost from the firm’s perspective.
It is this difference between the labor cost that is relevant for the labor itself and for the firms that is of interest for the following analysis. The questions we seek to answer in this analysis is which of these labor costs is relevant for the FDI flows, and whether this differs across sectors. The decomposition of total labor costs, as such, not only provides labor cost measures pertinent to the labor and the firm, respectively, but also pertains to economic information. One could argue that the productivity of labor is reflected in the compensation to labor component, whereas the cost of labor driven by the regulatory burdens determined by the business environment is captured in the discrepancy between the total labor costs and the compensation to the employees. In other words, the total labor cost is reflective of both the labor productivity (captured in the labor compensation component) and the regulatory burdens that directly or indirectly impact the labor market. This interpretation of the total labor cost decomposition allows us to make use of this dataset to seek the association between labor costs that are reflective of productivity (a positive aspect) and regulatory burdens (a negative aspect), respectively, and FDI.
The other variable of interest is FDI. FDI data is also obtained from the OECD. According to the OECD, FDI is defined as “obtaining a lasting interest by a resident entity in one economy (direct investor) in an entity resident in an economy other than that of the investor (direct investment enterprise). The lasting interest implies the existence of a long-term relationship between the direct investor and the enterprise and a significant degree of influence on the management of the enterprise. Direct investment involves both the initial transaction between the two entities and all subsequent capital transactions between them and among affiliated enterprises, both incorporated and unincorporated.” The FDI data used in the following analysis is the share of FDI in a sector (or overall) as a share of the value added of that sector (or overall). The sector’s value added data is obtained from the STAN database of the OECD. Value conversions are made possible by the use of exchange rate data obtained from the OECD database.
Table 1 presents the descriptive statistics for the share of FDI in a sector (or overall) as a share of the value added of that sector (or overall), labor compensation per hour worked (measured as compensation of employees in national currency divided by total hours worked by workers), and unit labor costs (measured as the average cost of labor per unit of output). The average share of FDI as a share of total value added is highest in the finance sector and the lowest in the construction sector. Average unit labor costs are highest and labor compensation is lowest in the construction sector. Under the period 1995–2009, labor compensation is highest in the finance sector.
2.2. Methodology
In this paper, the choice of a panel VAR approach has been motivated by mainly three reasons. First, the panel VAR approach allows us to explore the endogenous interaction between labor costs and FDI. That is, it allows us to highlight the lagged effects of labor costs on FDI and to check whether the feedbacks from FDI to labor costs are realized or not. Second, panel Granger causality analysis allows us to identify the direction of the intricate link between labor costs and FDI, which allows a discussion of a possible bi-directional link. Third, Impulse Response Functions (IRFs) help us to evaluate the dynamic links between labor costs and FDI.
A time stationary VAR model as in Casu and Girardone (2009), Holtz-Eakin et al. (1988), and Hartwig (2010) is adopted to examine the possible linkages between different labor costs and different sectors. The model has the following form:
Here, i (= 1,..., N) refers to the country, t (= 1,.., T) refers to the time period, and m refers to the lag number. and are white noise errors. and are individual fixed effects for the panel member i. denotes foreign direct investment in different sectors (manufacturing, finance, industry, and construction) while denotes various types of labor costs.
Over the past decade, the notion of Granger causality tests are well accepted and widely used in the panel econometrics. Most of the papers that have made use of the panel Granger-causality framework examine the causality between certain variables and economic growth (Hartwig 2010). For instance, the relationship between health and economic growth is tested in Hartwig (2010), between investment and economic growth in Podrecca and Carmeci (2001), between export and economic growth in Kónya (2006), between telecommunication and economic growth in Pradhan et al. (2014), and between foreign direct investment and economic growth in Hsiao and Hsiao (2006).
According to the definition of Granger Causality, a stationary time series is said to predict another stationary time series if the lagged information on a variable provides any statistically significant information about a variable in the presence of lagged (FDI). The corresponding null hypothesis is given as follows
On the other hand, we test whether the is said to have a predictive power for and the corresponding null hypothesis is
Within this framework, the panel VAR approach through testing the lagged coefficients of the different labor costs allows us to check whether the labor costs help us to predict FDI or the lagged effects of FDI can allow us to predict labor costs.
The correct choice of lag length before testing for causality is determined to avoid misleading results on Granger-causality. Both Akaike Information Criterion (AIC) and Schwartz Information Criteria (SIC) reveal two as an optimal lag length. As the Granger-causality tests require the data to be stationary, a battery of standard panel unit root tests are performed in Table 1 for all variables. All tests performed in Table 2 do not reject the null hypothesis of non- stationarity for all variables at levels but reject for the first differences.1
To estimate the parameters of a dynamic panel like Equations (1) and (2), we use fixed effect and system GMM estimation methods; however, the system GMM estimates are a more reliable and efficient fixed effect since they allow us to solve problems of serial correlation, heteroskedasticity, and endogeneity of variables (Arellano and Bond (1991), Arellano and Bover (1995), and Blundell and Bond (1998)).2 However, the basic weakness in the system GMM estimation is the use of too many instruments leading to the misspecification of the model. In this context, to get valid instruments, we follow Roodman (2009). First, a high p-value of the Hansen test is preferred rather than the conventional level of 0.05. Second, the “collapse” option available in stata v.12 is used to limit the proliferation of instruments. In addition, econometric analysis relies on both Arellano Bond (AB) one-step and two-step system GMM estimation techniques.3 In the two-step system GMM estimates, the Windmeijer’s (2005) method for the small sample correction is utilized. In the following analysis the reliability of the estimates of the AB one step-system GMM and the AB two step-system GMM are verified by the Hansen test and the Difference Hansen test to check for instrument validity and the AB(2) test to check for serial correlation. These diagnostics are reported in each relevant table of results that are discussed in detail in the following section. The instrument specification test (Hansen test, Difference Hansen test) and the serial correlation test (AB test) reveals the validity of the system GMM estimates for all reported regressions. For further analysis, IRFs are presented for the corresponding panel VAR models4. The figures in Appendix A display the IRFs with their corresponding confidence bands. The confidence bands were generated by Monte Carlo simulation methods based on 500 draws.
3. Empirical Results
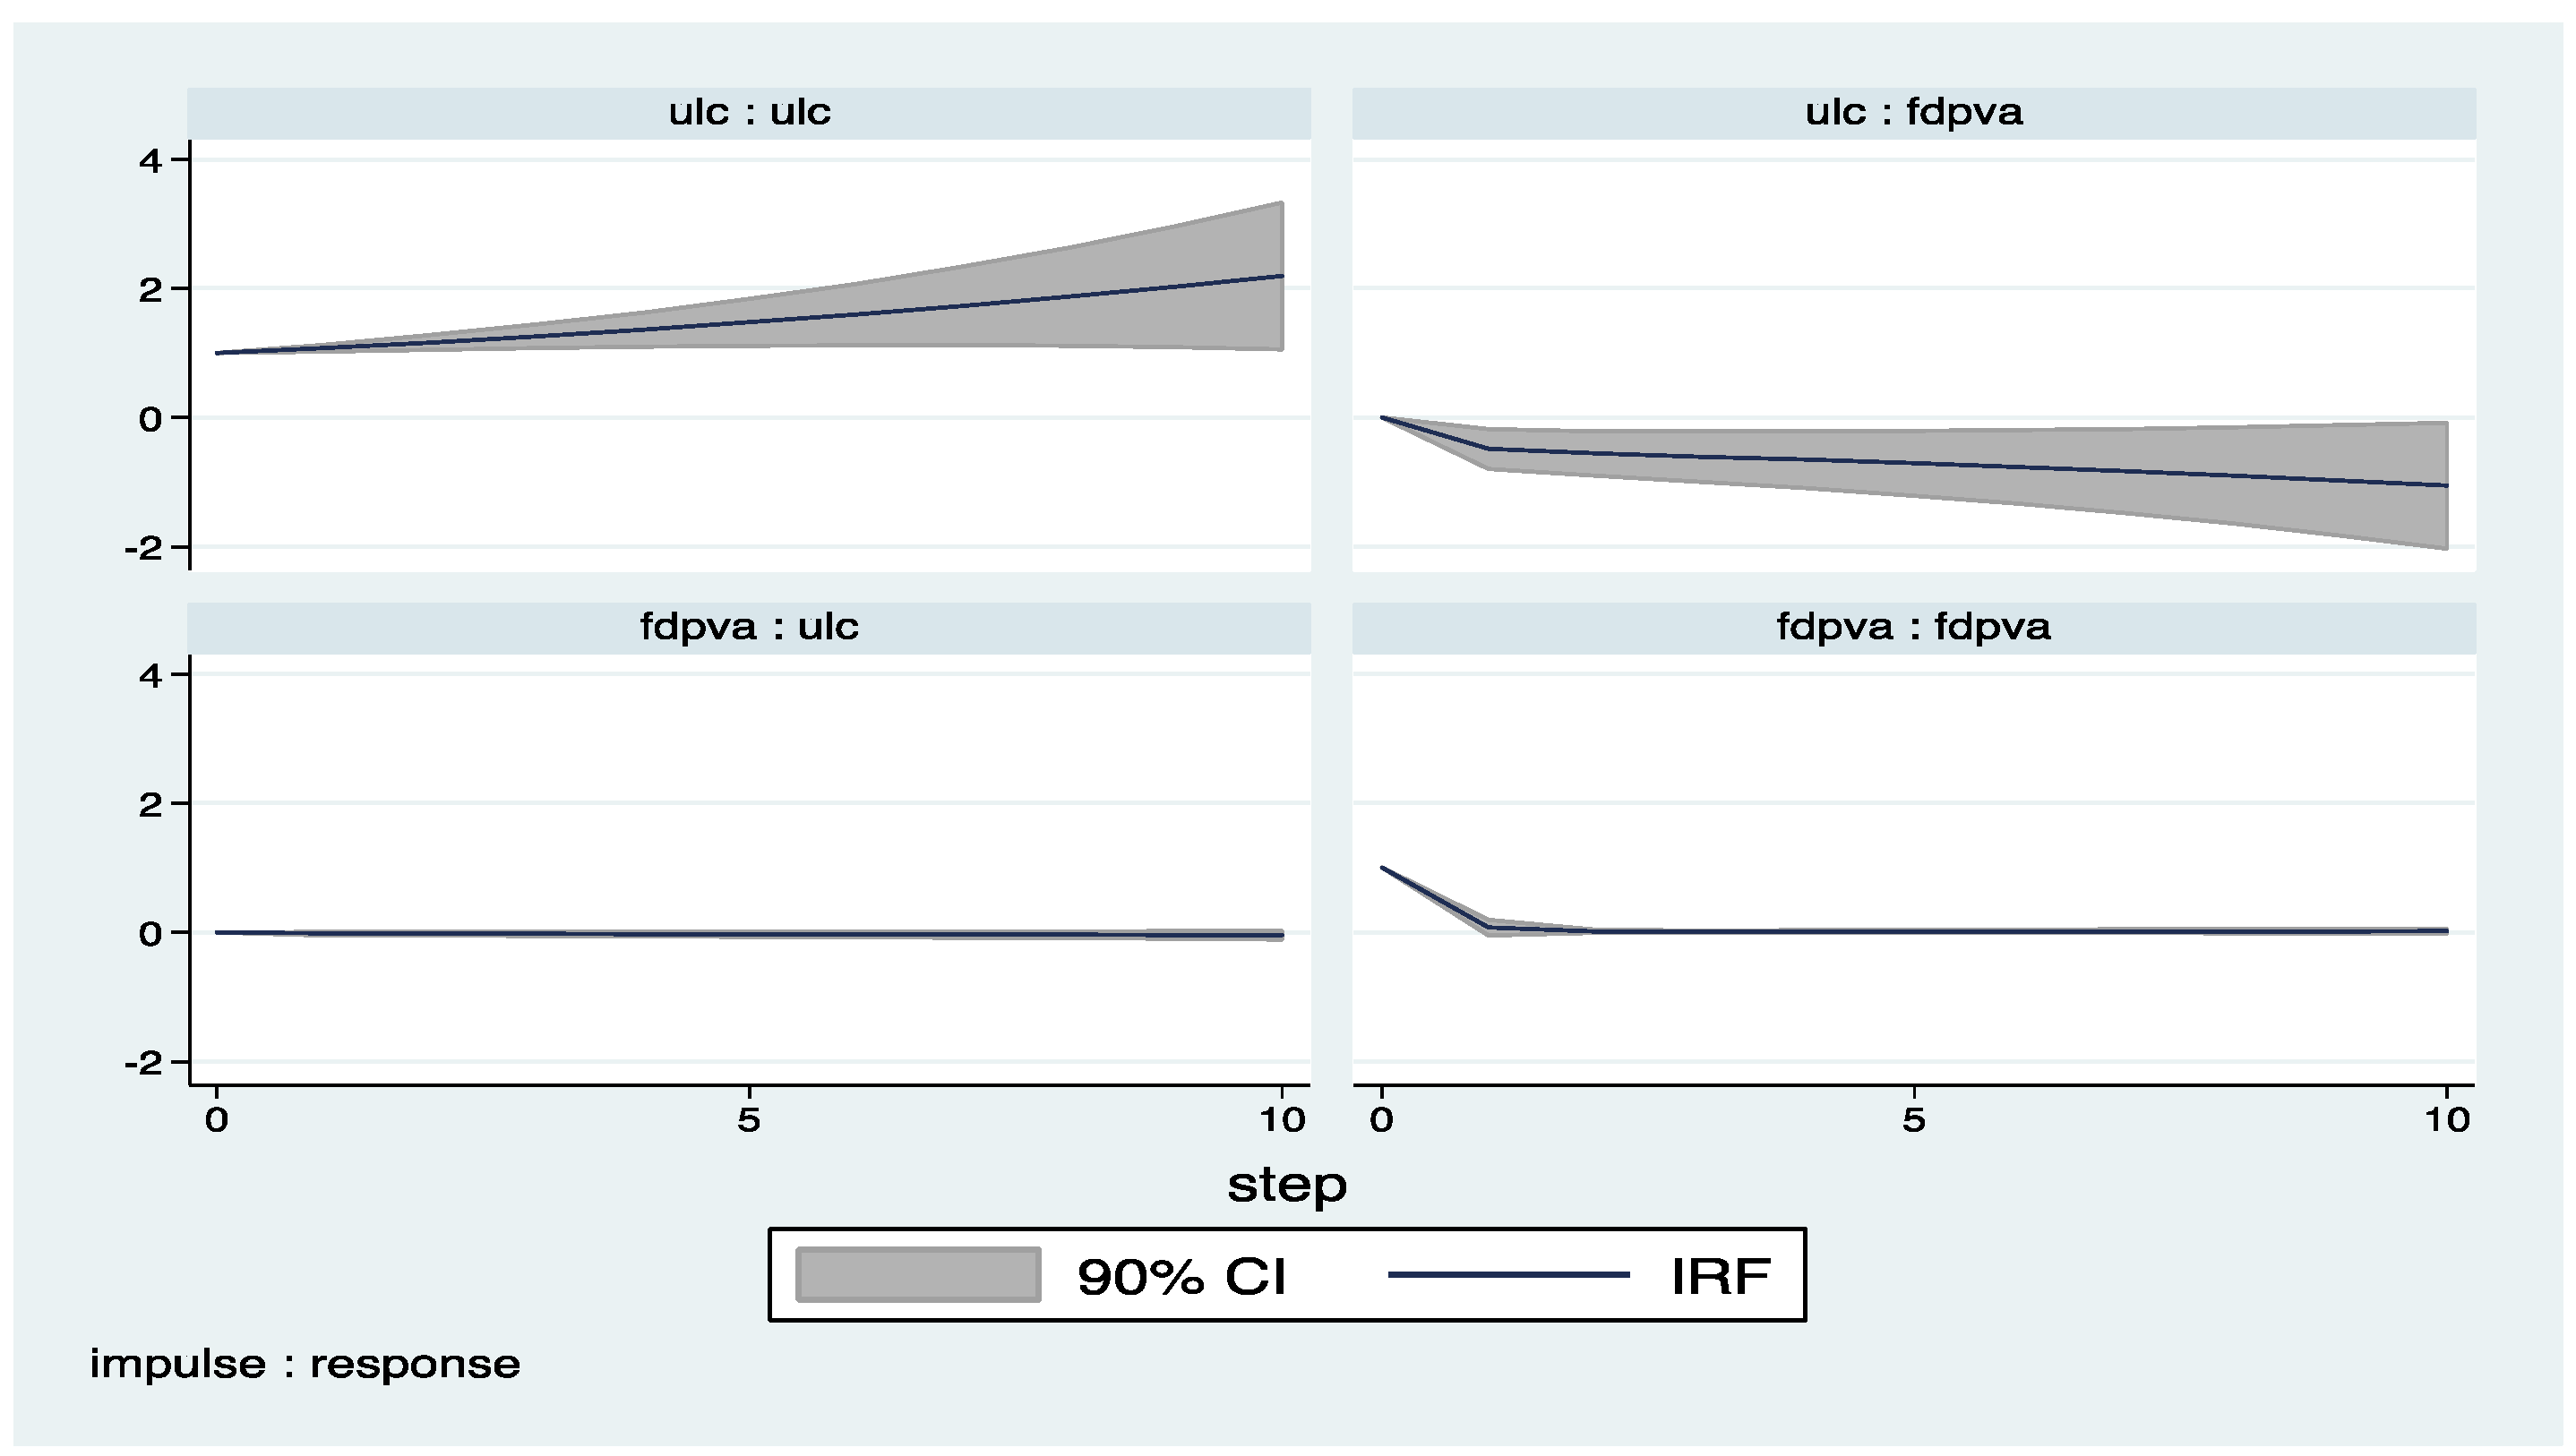
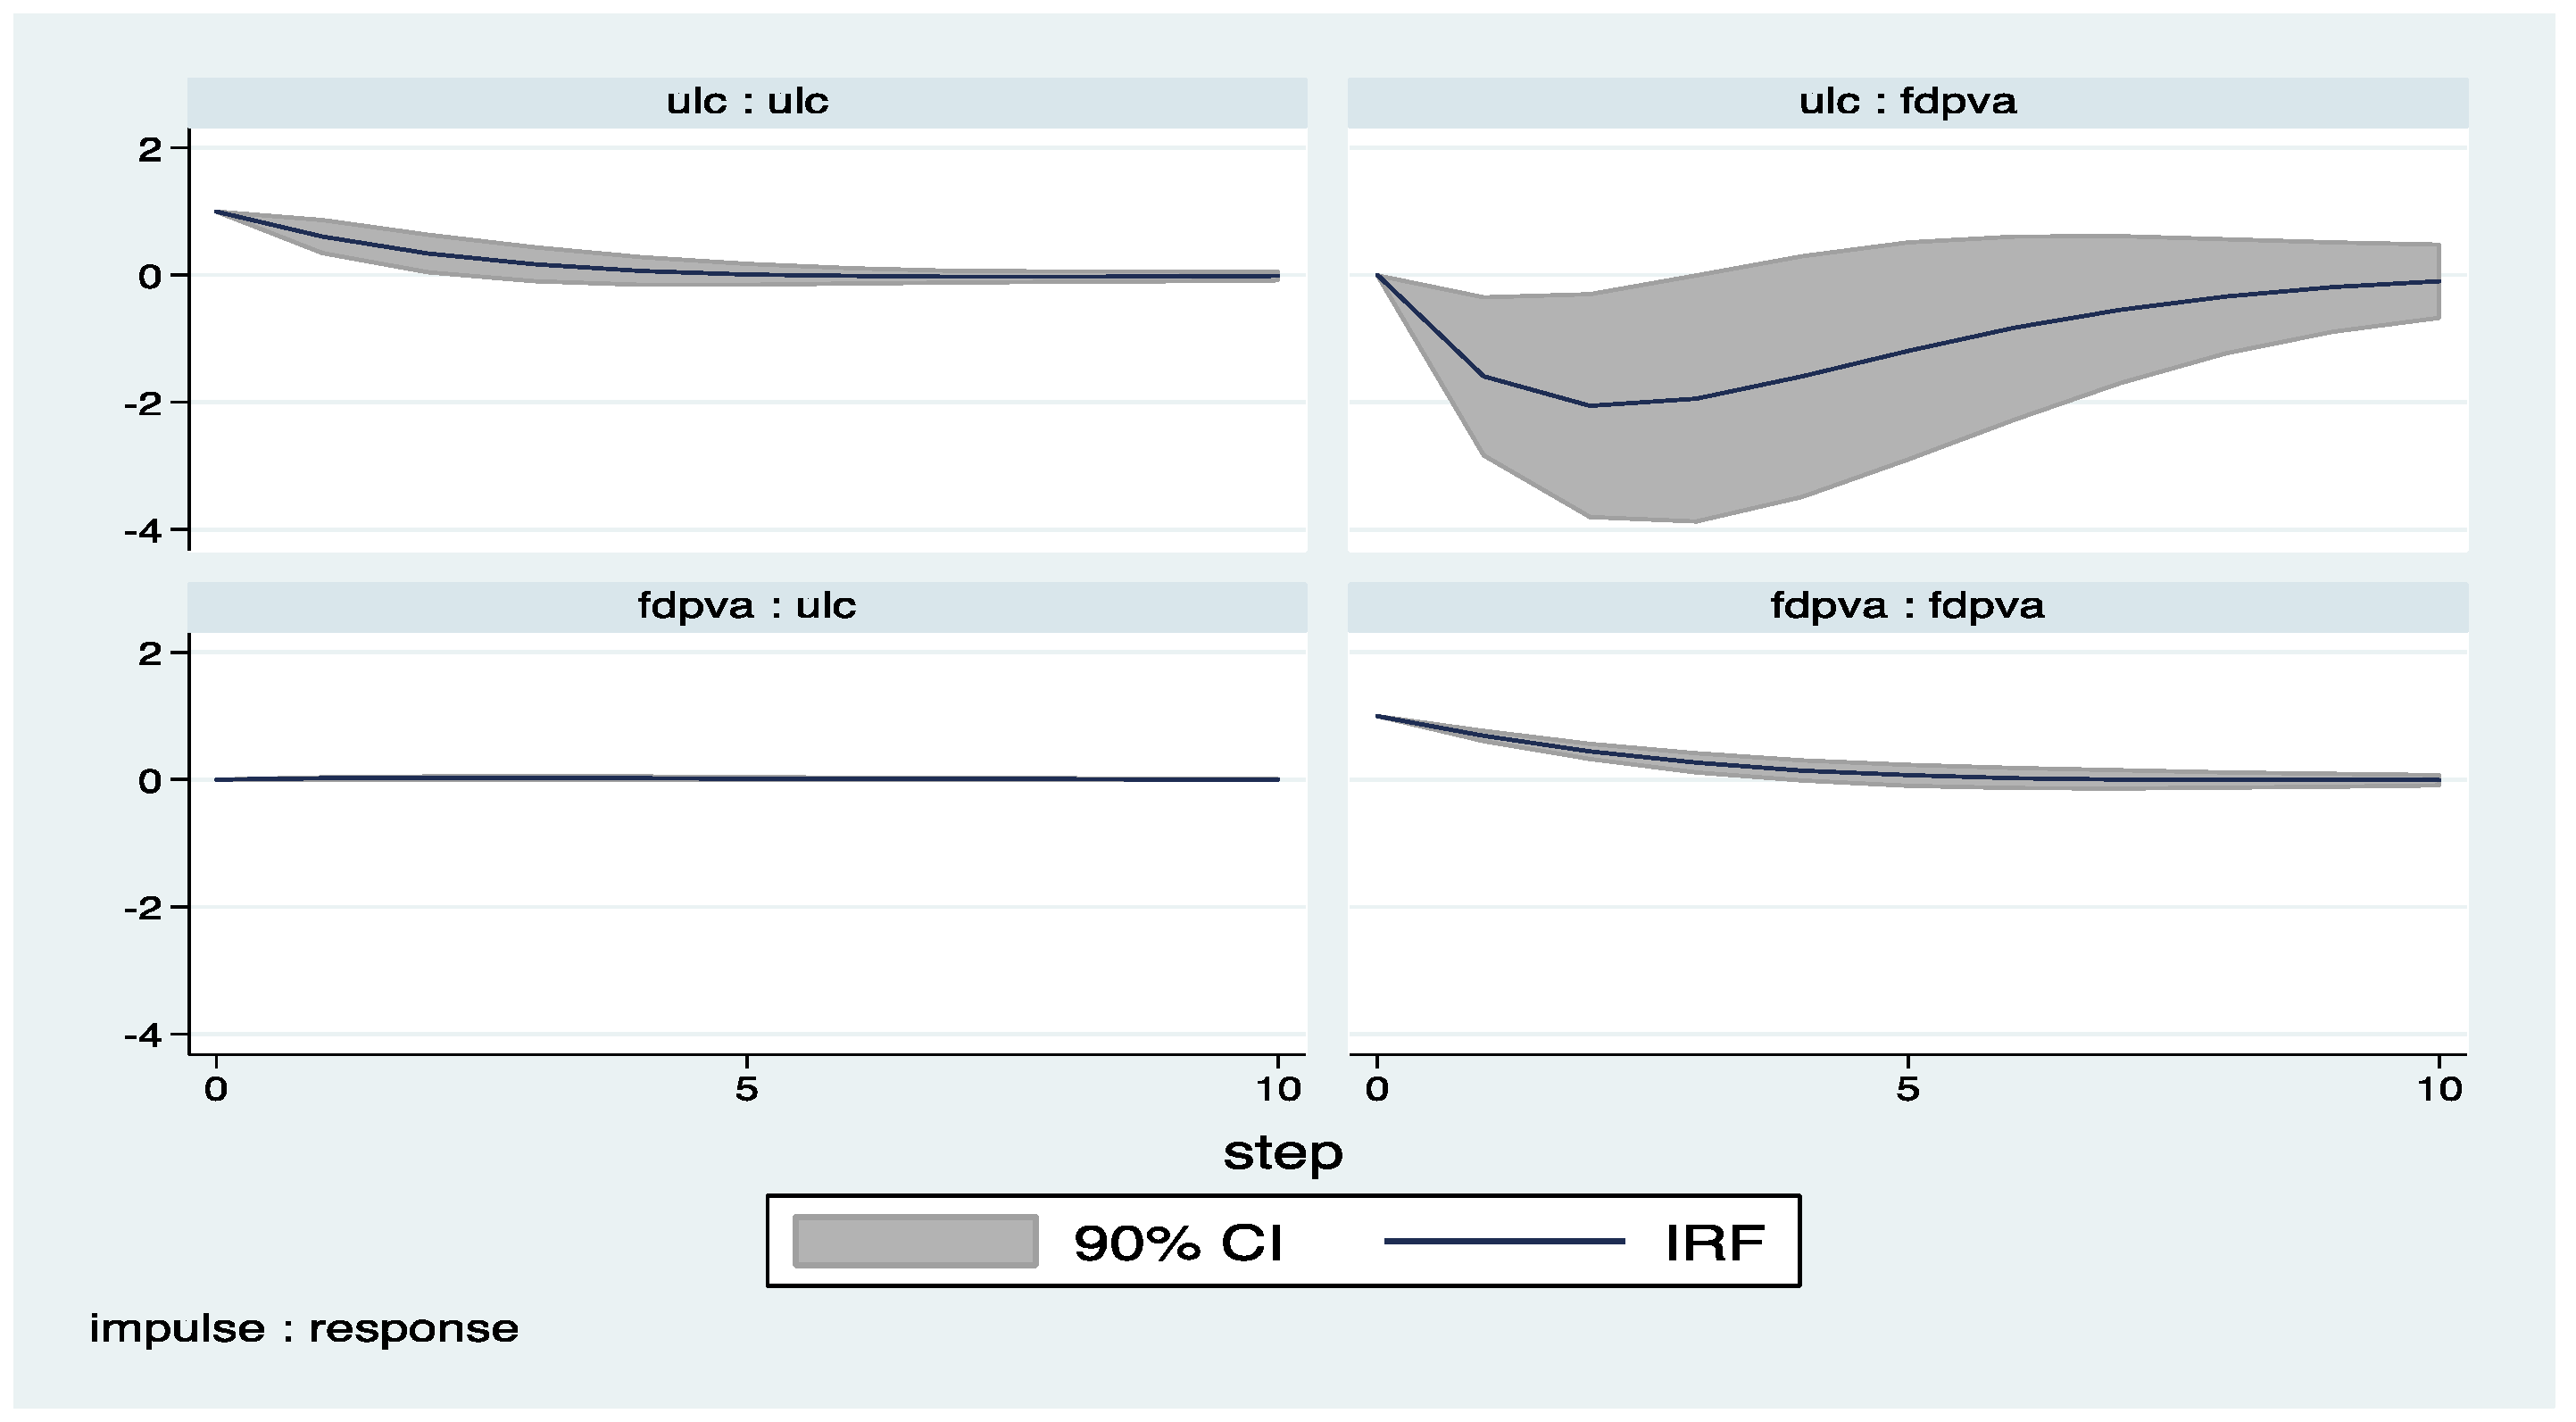
In Table 3 the results of the dynamic interaction between FDI and labor costs are provided for aggregate FDI flows for the OECD countries. Columns (1) through (6) study the relationship using the unit labor cost indicator. The unit labor cost results reported in columns (1) through (6) point out the uni-directional link running from unit labor cost to FDI (see columns (1) through (3)). The results suggest that FDI seek cheap labor, but the existence of FDI does not necessarily have an impact on the labor costs (see columns (4) through (6)).
In Table 4, Columns (1) through (6), on the other hand, study the same relationship using the compensation to the labor supplier as the labor cost indicator. However, the results focusing only on the compensation to the labor, excluding the labor costs on account of regulatory burdens in the labor market, suggest of a positive effect of labor compensation on FDI (see columns (1) through (6)). Increases in labor compensation encourage FDI. This result suggests that labor compensation is reflective of the productivity of labor, and this is what is mainly relevant for foreign firms. That is, multinational firms do not only seek cheap labor, but they also seek qualified and productive labor. This finding points to the importance of focusing labor market policies on productivity-enhancing tools in addition to the price hindering tools. On the other hand, FDI has a positive and significant contribution to labor compensation (see columns (4) through (6)). That is, FDI not only seeks productive labor but, also, FDI improves the productivity of labor through rising labor compensation.
Stated differently, higher labor productivity, which reflects itself in higher compensation to labor, attracts more FDI, and this increased FDI leads to higher labor compensation; this relationship can be labeled as a virtuous cycle where higher productivity of labor induces FDI, which in turn feeds back into higher productivity. However, if the higher labor costs are due to an increase in labor market regulatory burdens, this leads to a drop in FDI, which leads to a drop in the compensation of labor and labor productivity. This association can be labeled as a vicious cycle, where the labor market regulatory burdens not only impede FDI but would also lead to productivity/compensation losses due to lower FDI.
Moreover, the findings provide evidence for the “race-to-the-bottom” popular anti-thesis of multinational firms, since unit labor costs, including the labor costs on account of regulatory burdens in the labor market, have significant and negative impacts on the flow of FDI. Due to data availability, the analysis is limited to the OECD countries. It could well be argued that the race-to-the-bottom hypothesis is relevant for low-wage countries rather than the more developed OECD countries. Given lack of data, it is impossible to test this hypothesis for low-wage countries.
This aggregate relationship could mask significant differences across sectors. Accordingly, Table 3 through Table 12 reports the endogenous interaction between FDI and labor costs across different sectors, namely in manufacturing, finance, industry, and construction.5 Table 13 provides a summary of these results, for ease of presentation.
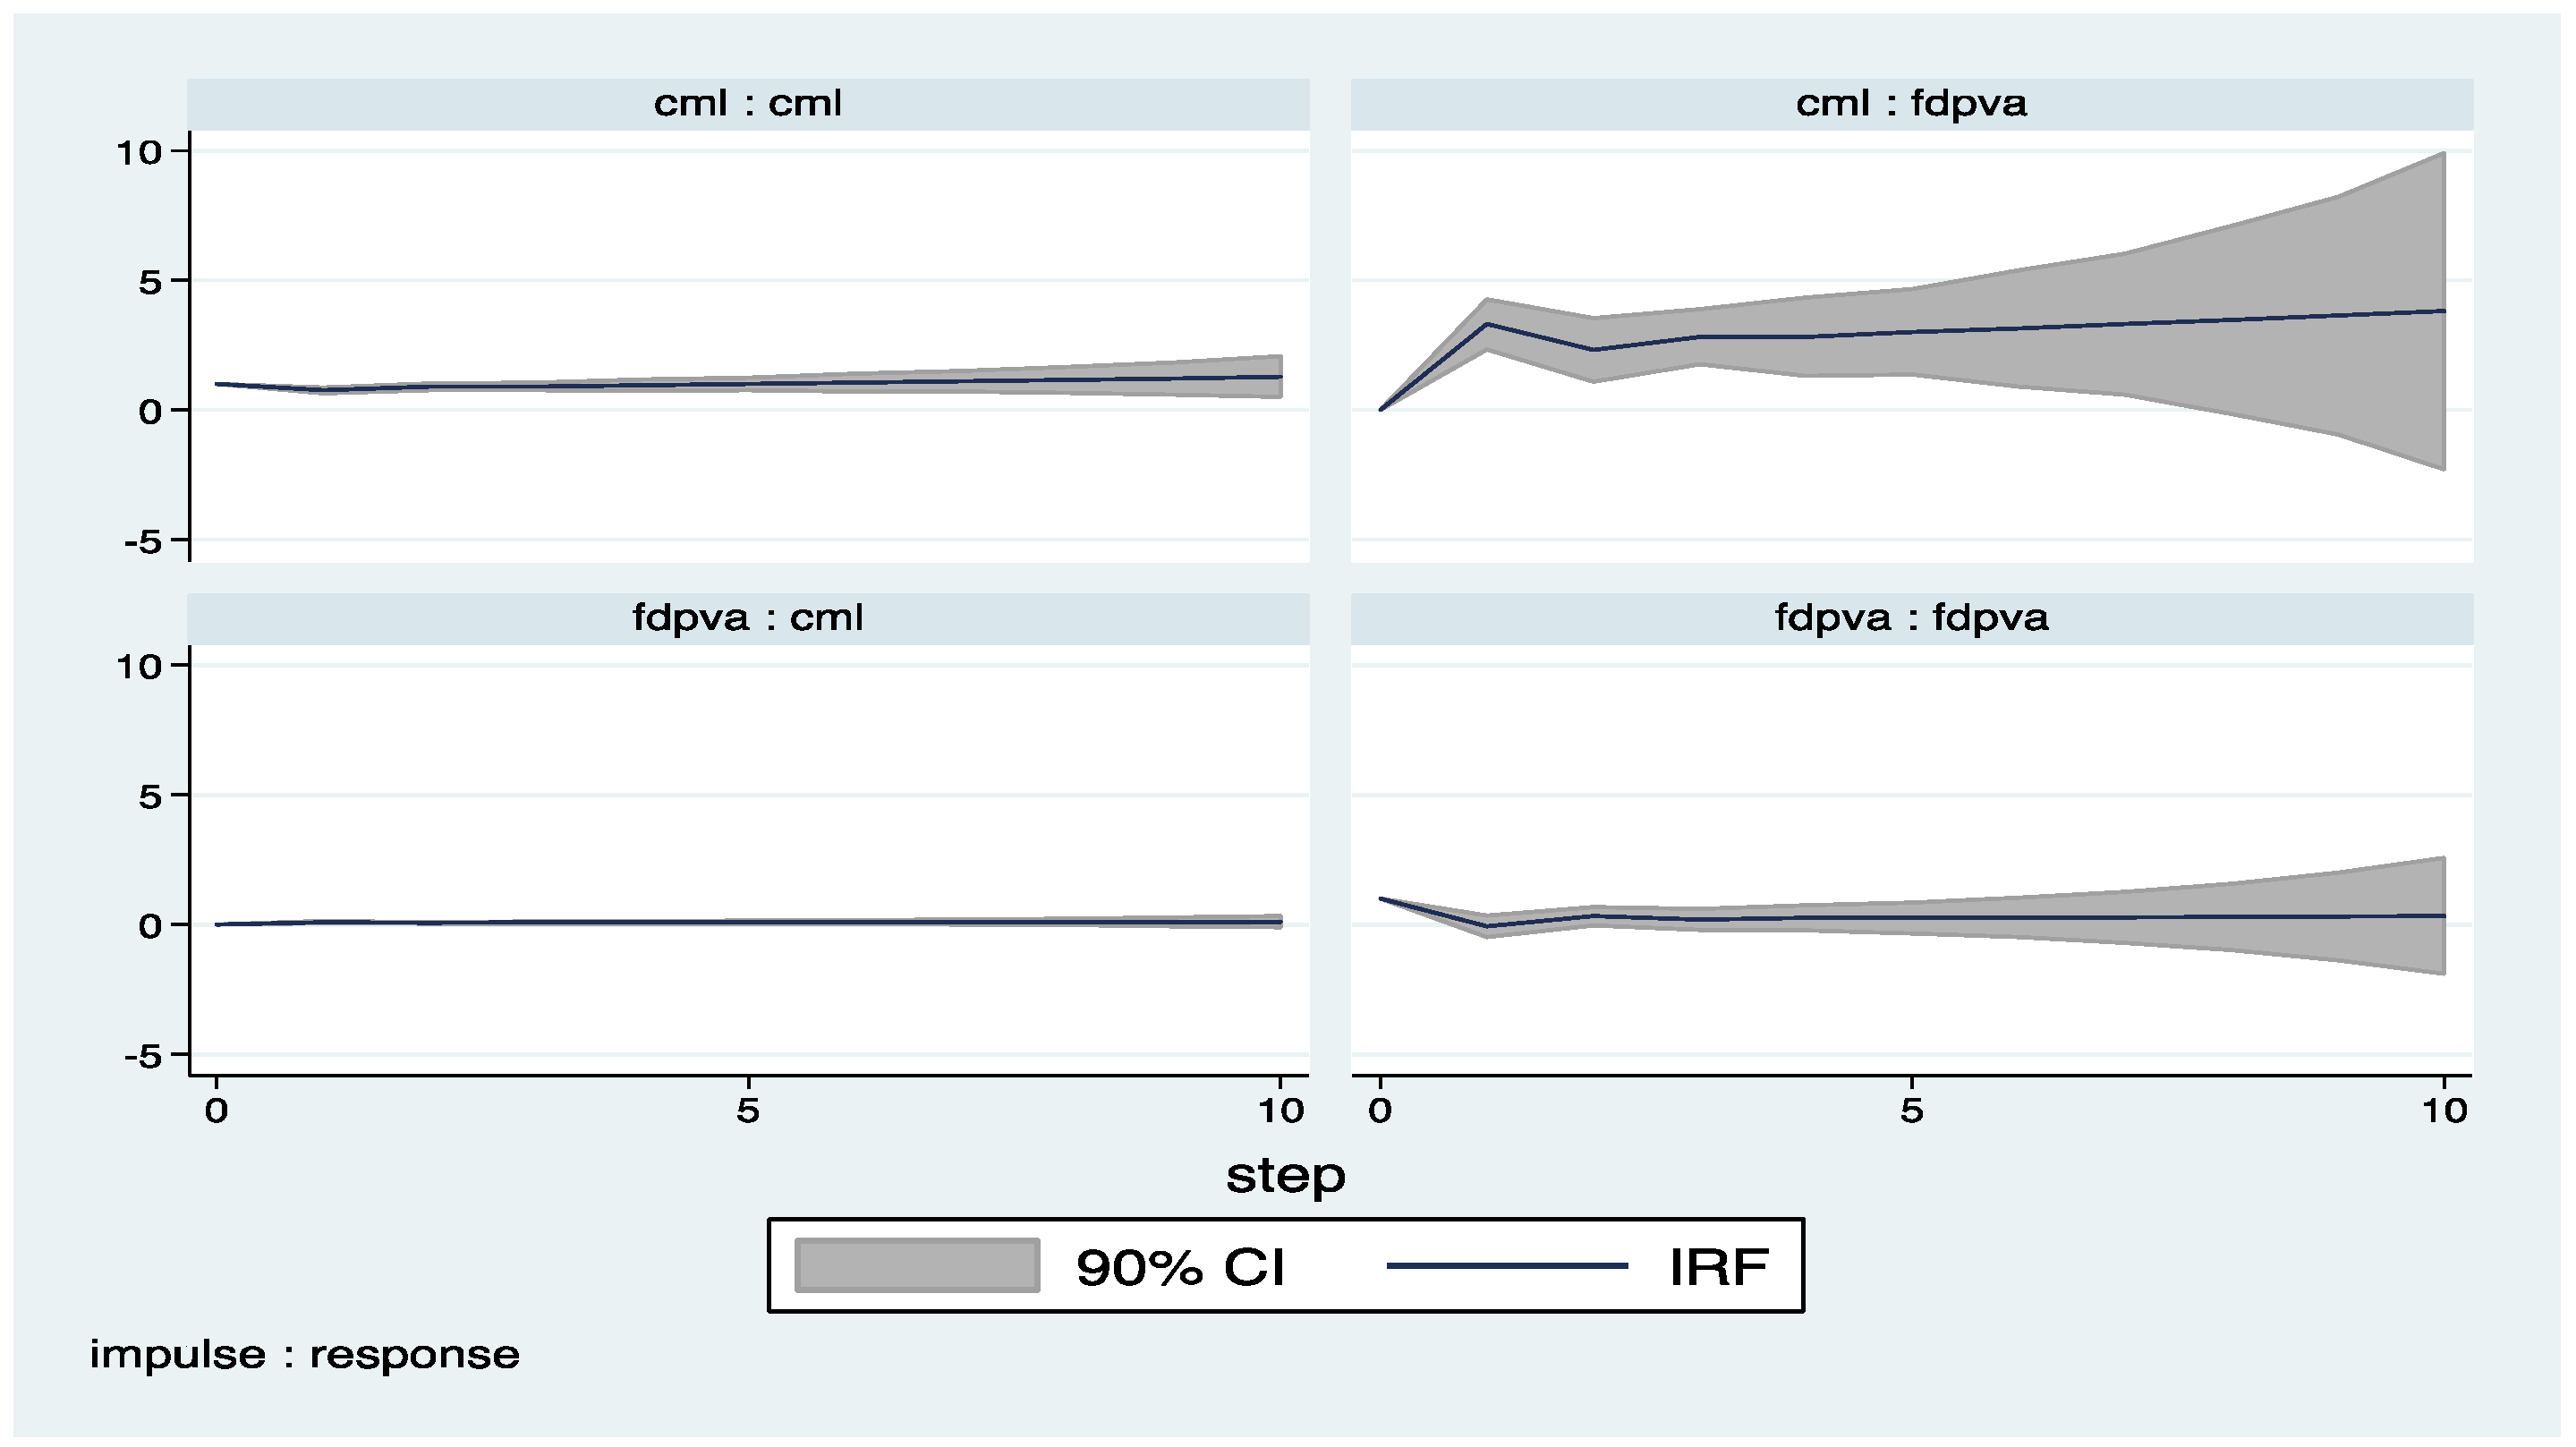
Table 5 reflects valuable information regarding the associations between labor market indicators and FDI for the manufacturing sector. Focusing on the labor costs pertinent to the firms, i.e., the unit labor costs, one observes the uni-directional association between FDI and unit labor costs in the manufacturing sector. A decrease in unit labor costs in the manufacturing sector becomes an attractive feature for foreign firms (see columns (1) through (3) of Table 5). This result seems to be supportive of the phenomenon of cheap-labor seeking FDI in manufacturing.
On the other hand, Table 6 focuses on the link between FDI and labor compensation. Columns (1) through (3) of Table 6 point out a positive association between the compensation to labor, the part of labor cost that is relevant to the worker, and FDI. These two results together suggest that the part of labor costs that is deterrent to foreign firms is not the compensation to labor itself but rather it is the regulatory burdens in the labor market. The compensation to labor itself is mainly reflective of the productivity of the labor and it is the monetary return that creates the incentive to work for labor. As such, a positive effect of this compensation on FDI is quite understandable. On the other hand, any additional labor costs on account of labor taxes (employment, payrolls), vocational training, welfare training (cost of canteens), and other labor costs unclassified (worker transportation, cost of recruitment) hinder FDI.
Given that these additional labor costs are mainly determined in the business environment, we interpret them as reflective of the regulatory burdens existent in the labor markets. The policy implication of this finding is that countries seeking to attract more FDI in manufacturing should focus on eliminating regulatory burdens while implementing policies to improve the productivity of workers that will be reflected in higher returns (compensation to labor). In other words, skill development accompanied by a reduction in red tape would lead to increased FDI in the manufacturing sector.
Another important finding is that the endogenous association between labor costs and FDI in the manufacturing sector coincides with the findings of the aggregate analysis. Since the manufacturing sector has a considerable share in the distribution of FDI, this could be an expected finding. Specifically, the results for both aggregate data and the manufacturing sector point to a robust link from labor costs pertinent to labor itself (CML) and labor costs pertinent to the firm (ULC) to the FDI. An increase in FDI leads to higher labor compensation and, in turn, higher labor compensation reflecting the higher productivity of labor attracts more FDI, generating a vicious circle. On the other hand, increased regulatory burdens not only hinder FDI but also reduce the productivity of labor in terms of decreased labor compensation due to a fall in the FDI.
Table 7 and Table 8 report the findings of the same endogenous association for the finance sector. Of the four possible associations, the only one that applies to the finance sector is the link from unit labor costs to FDI. This finding is suggestive that the main labor market factor that concerns the finance sector is the regulatory burdens relevant to the labor market. Foreign firms in the finance sector prefer investing in host countries with lower unit labor costs; of the factors that create the labor costs, they are not concerned with the compensation to labor, suggesting that the main concern is the regulatory burdens. Results suggest no labor cost feedback from FDI in the finance sector to labor compensation in the finance sector or to the total labor costs in the finance sector. Most importantly, these results point to differences across sectors. While there was a bi-directional association between labor compensation and FDI in the manufacturing sector, there is only one uni-directional link between total unit labor costs and FDI in the finance sector. It is these sectoral differences that necessitate a disaggregated analysis of these relationships rather than a restrictive analysis limited to that in Table 3.
These sectoral differences are further evident in Table 9, Table 10, Table 11 and Table 12, where the results for industry and construction are reported respectively. Similar to the finance sector, the association between labor costs and FDI in the industry or construction sector is also not bi-directional. Indeed, for the industry sector we find no association between labor costs and FDI, where neither labor costs are a determining factor for FDI, nor does FDI have any implications on the labor costs in these sectors. The uni-directional relationship between labor costs and FDI that is evident in the finance sector also prevails in the construction sector, though for a different pair of variables. In the construction sector, the only uni-directional relationship that is significant is that of FDI leading to higher unit labor costs. Once again, the main result that we take from these tables is that the aggregate relationship between labor costs and FDI masks significant sectoral differences, as well as the differential roles, played by sub-components of labor costs.

Table 9.
Construction: FDI and Unit Labor Cost.
| Fixed Effect | AB One Step System GMM | AB Two Step System GMM | Fixed Effect | AB One Step System GMM | AB Two Step System GMM | |
|---|---|---|---|---|---|---|
| Dependent Variable | 1 | 2 | 3 | 4 | 5 | 6 |
| fdpva | fdpva | fdpva | ulc | ulc | ulc | |
| L.fdpva | −0.246 ** (0.100) | 0.469 *** (0.146) | 0.530 *** (0.163) | 0.0156 ** (0.00737) | 0.0148 ** (0.00581) | 0.00962 ** (0.00479) |
| L2.fdpva | 0.0660 (0.101) | 0.265 ** (0.111) | 0.184 (0.134) | 0.000670 (0.00659) | 0.0113 * (0.00648) | 0.00571 (0.00653) |
| L.ulc | −0.938 (2.294) | 0.464 (3.915) | 1.195 (2.937) | 0.395 *** (0.0973) | 0.699 *** (0.219) | 0.703 * (0.373) |
| L2.ulc | 1.928 (1.973) | −0.112 (3.343) | −0.807 (2.483) | 0.348 ** (0.160) | 0.119 (0.184) | 0.123 (0.310) |
| Hansen Test | 0.648 | 0.648 | 0.476 | 0.476 | ||
| Difference Hansen Test | 0.307 | 0.307 | 0.563 | 0.563 | ||
| AB Test | 0.444 | 0.990 | 0.843 | 0.861 | ||
| Wald Test ulc | 0.108 | 0.577 | 0.743 | |||
| Wald Test fdpva | 0.038 | 0.034 | 0.089 |
Note: fdpva: Foreign Direct Investment, cml: Labor Compensation Cost, ulc: Unit Labor Cost. Robust standard errors are in parenthesis. Time dummies are included. Estimates for constant terms are nor shown. AB test: Arellano-Bond test for AR(2) in first differences. * Significance at the 10% level; ** significance at the 5% level; *** significance at the 1% level.
Table 10.
Construction: FDI and Labor Compensation.
| Fixed Effect | AB One Step System GMM | AB Two Step System GMM | Fixed Effect | AB One Step System GMM | AB Two Step System GMM | |
|---|---|---|---|---|---|---|
| Dependent Variable | 1 fdpva | 2 fdpva | 3 fdpva | 4 cml | 5 cml | 6 cml |
| L.fdpva | −0.221 ** (0.100) | −0.206 (0.295) | −0.265 (0.380) | −0.000461 (0.00337) | 0.00477 (0.00528) | 0.00443 (0.00726) |
| L2.fdpva | 0.086 (0.099) | −0.141 (0.266) | −0.147 (0.325) | 0.00107 (0.00343) | 0.00528 (0.00471) | 0.00177 (0.00599) |
| L.cml | 0.881 (0.295) | −0.774 (3.223) | −0.977 (3.655) | 0.948 *** (0.0912) | 0.942 *** (0.135) | 0.968 *** (0.172) |
| L2.cml | 0.561 (2.501) | 0.634 (3.225) | 0.847 (3.638) | 0.0639 (0.0905) | 0.0475 (0.0998) | 0.0695 (0.129) |
| Hansen Test | 0.266 | 0.266 | 0.279 | 0.279 | ||
| Difference Hansen Test | 0.491 | 0.491 | 0.356 | 0.356 | ||
| AB Test | 0.994 | 0.923 | 0.104 | 0.134 | ||
| Wald Test cml | 0.413 | 0.130 | 0.255 | |||
| Wald Test fdpva | 0.936 | 0.534 | 0.812 |
Note: fdpva: Foreign Direct Investment, cml: Labor Compensation Cost, ulc: Unit Labor Cost. Robust standard errors are in parenthesis. Time dummies are included. Estimates for constant terms are not shown. AB test: Arellano-Bond test for AR(2) in first differences. * Significance at the 10% level; ** significance at the 5% level; *** significance at the 1% level.
Table 11.
Industry: FDI and Unit Labor Cost.
| Fixed Effect | AB One Step System GMM | AB Two Step System GMM | Fixed Effect | AB One Step System GMM | AB Two Step System GMM | |
|---|---|---|---|---|---|---|
| Dependent Variable | 1 | 2 | 3 | 4 | 5 | 6 |
| fdpva | fdpva | fdpva | ulc | ulc | ulc | |
| L.fdpva | 0.813 *** (0.0818) | 0.796 *** (0.145) | 0.908 *** (0.141) | −0.00713 (0.00605) | −0.00245 (0.0187) | −0.00139 (0.0253) |
| L2.fdpva | 0.000441 (0.0757) | 0.108 (0.142) | 0.0163 (0.0759) | 0.00414 (0.00561) | 0.00138 (0.0260) | 0.0007 (0.0292) |
| L.ulc | −0.175 (1.100) | −1.197 (0.760) | 0.0319 (1.129) | 0.996 *** (0.0806) | 0.859 *** (0.103) | 0.852 *** (0.130) |
| L2.ulc | 0.696 (1.007) | 0.464 (0.716) | −0.530 (1.051) | −0.186 ** (0.0745) | 0.128 (0.0903) | 0.133 (0.105) |
| Hansen Test | 0.753 | 0.753 | 0.358 | 0.358 | ||
| Difference Hansen Test | 0.450 | 0.450 | 0.780 | 0.780 | ||
| AB Test | 0.939 | 0.646 | 0.363 | 0.392 | ||
| Wald Test ulc | 0.537 | 0.113 | 0.504 | 0.989 | 0.997 | |
| Wald Test fdpva | 0.450 | 0.989 | 0.997 |
Note: fdpva: Foreign Direct Investment, cml: Labor Compensation Cost, ulc: Unit Labor Cost. Robust standard errors are in parenthesis. Time dummies are included. Estimates for constant terms are nor shown. AB test: Arellano-Bond test for AR(2) in first differences. * Significance at the 10% level; ** significance at the 5% level; *** significance at the 1% level.
Table 12.
Industry: FDI and Labor Compensation.
| Fixed Effect | AB One Step System GMM | AB Two Step System GMM | Fixed Effect | AB One Step System GMM | AB Two Step System GMM | |
|---|---|---|---|---|---|---|
| Dependent Variable | 1 | 2 | 3 | 4 | 5 | 6 |
| fdpva | fdpva | fdpva | cml | cml | cml | |
| L.fdpva | 0.796 *** (0.0827) | 0.685 (0.590) | 0.491 (0.352) | −0.000628 (0.00527) | 0.00297 (0.00713) | 0.00409 (0.00790) |
| L2.fdpva | 0.00272 (0.0758) | −0.0382 (0.181) | 0.00425 (0.113) | −0.00135 (0.00484) | 0.00163 (0.00644) | 0.00462 (0.00725) |
| L.cml | −0.995 (1.373) | 1.967 (5.421) | 0.614 (5.116) | 0.826 *** (0.0824) | 0.979 *** (0.143) | 0.877 *** (0.192) |
| L2.cml | 1.240 (1.436) | −1.835 (4.701) | −0.315 (4.607) | 0.169 * (0.0854) | 0.00974 (0.131) | 0.0790 (0.189) |
| Hansen Test | 0.486 | 0.486 | 0.380 | 0.380 | ||
| Difference Hansen Test | 0.683 | 0.683 | 0.857 | 0.857 | ||
| AB Test | 0.364 | 0.608 | 0.505 | 0.749 | ||
| Wald Test | 0.616 | 0.913 | 0.903 | 0.762 | 0.834 | 0.160 |
Note: fdpva: Foreign Direct Investment, cml: Labor Compensation Cost, ulc: Unit Labor Cost. Robust standard errors are in parenthesis. Time dummies are included. Estimates for constant terms are not shown. AB test: Arellano-Bond test for AR(2) in first differences. * Significance at the 10% level; ** significance at the 5% level; *** significance at the 1% level.
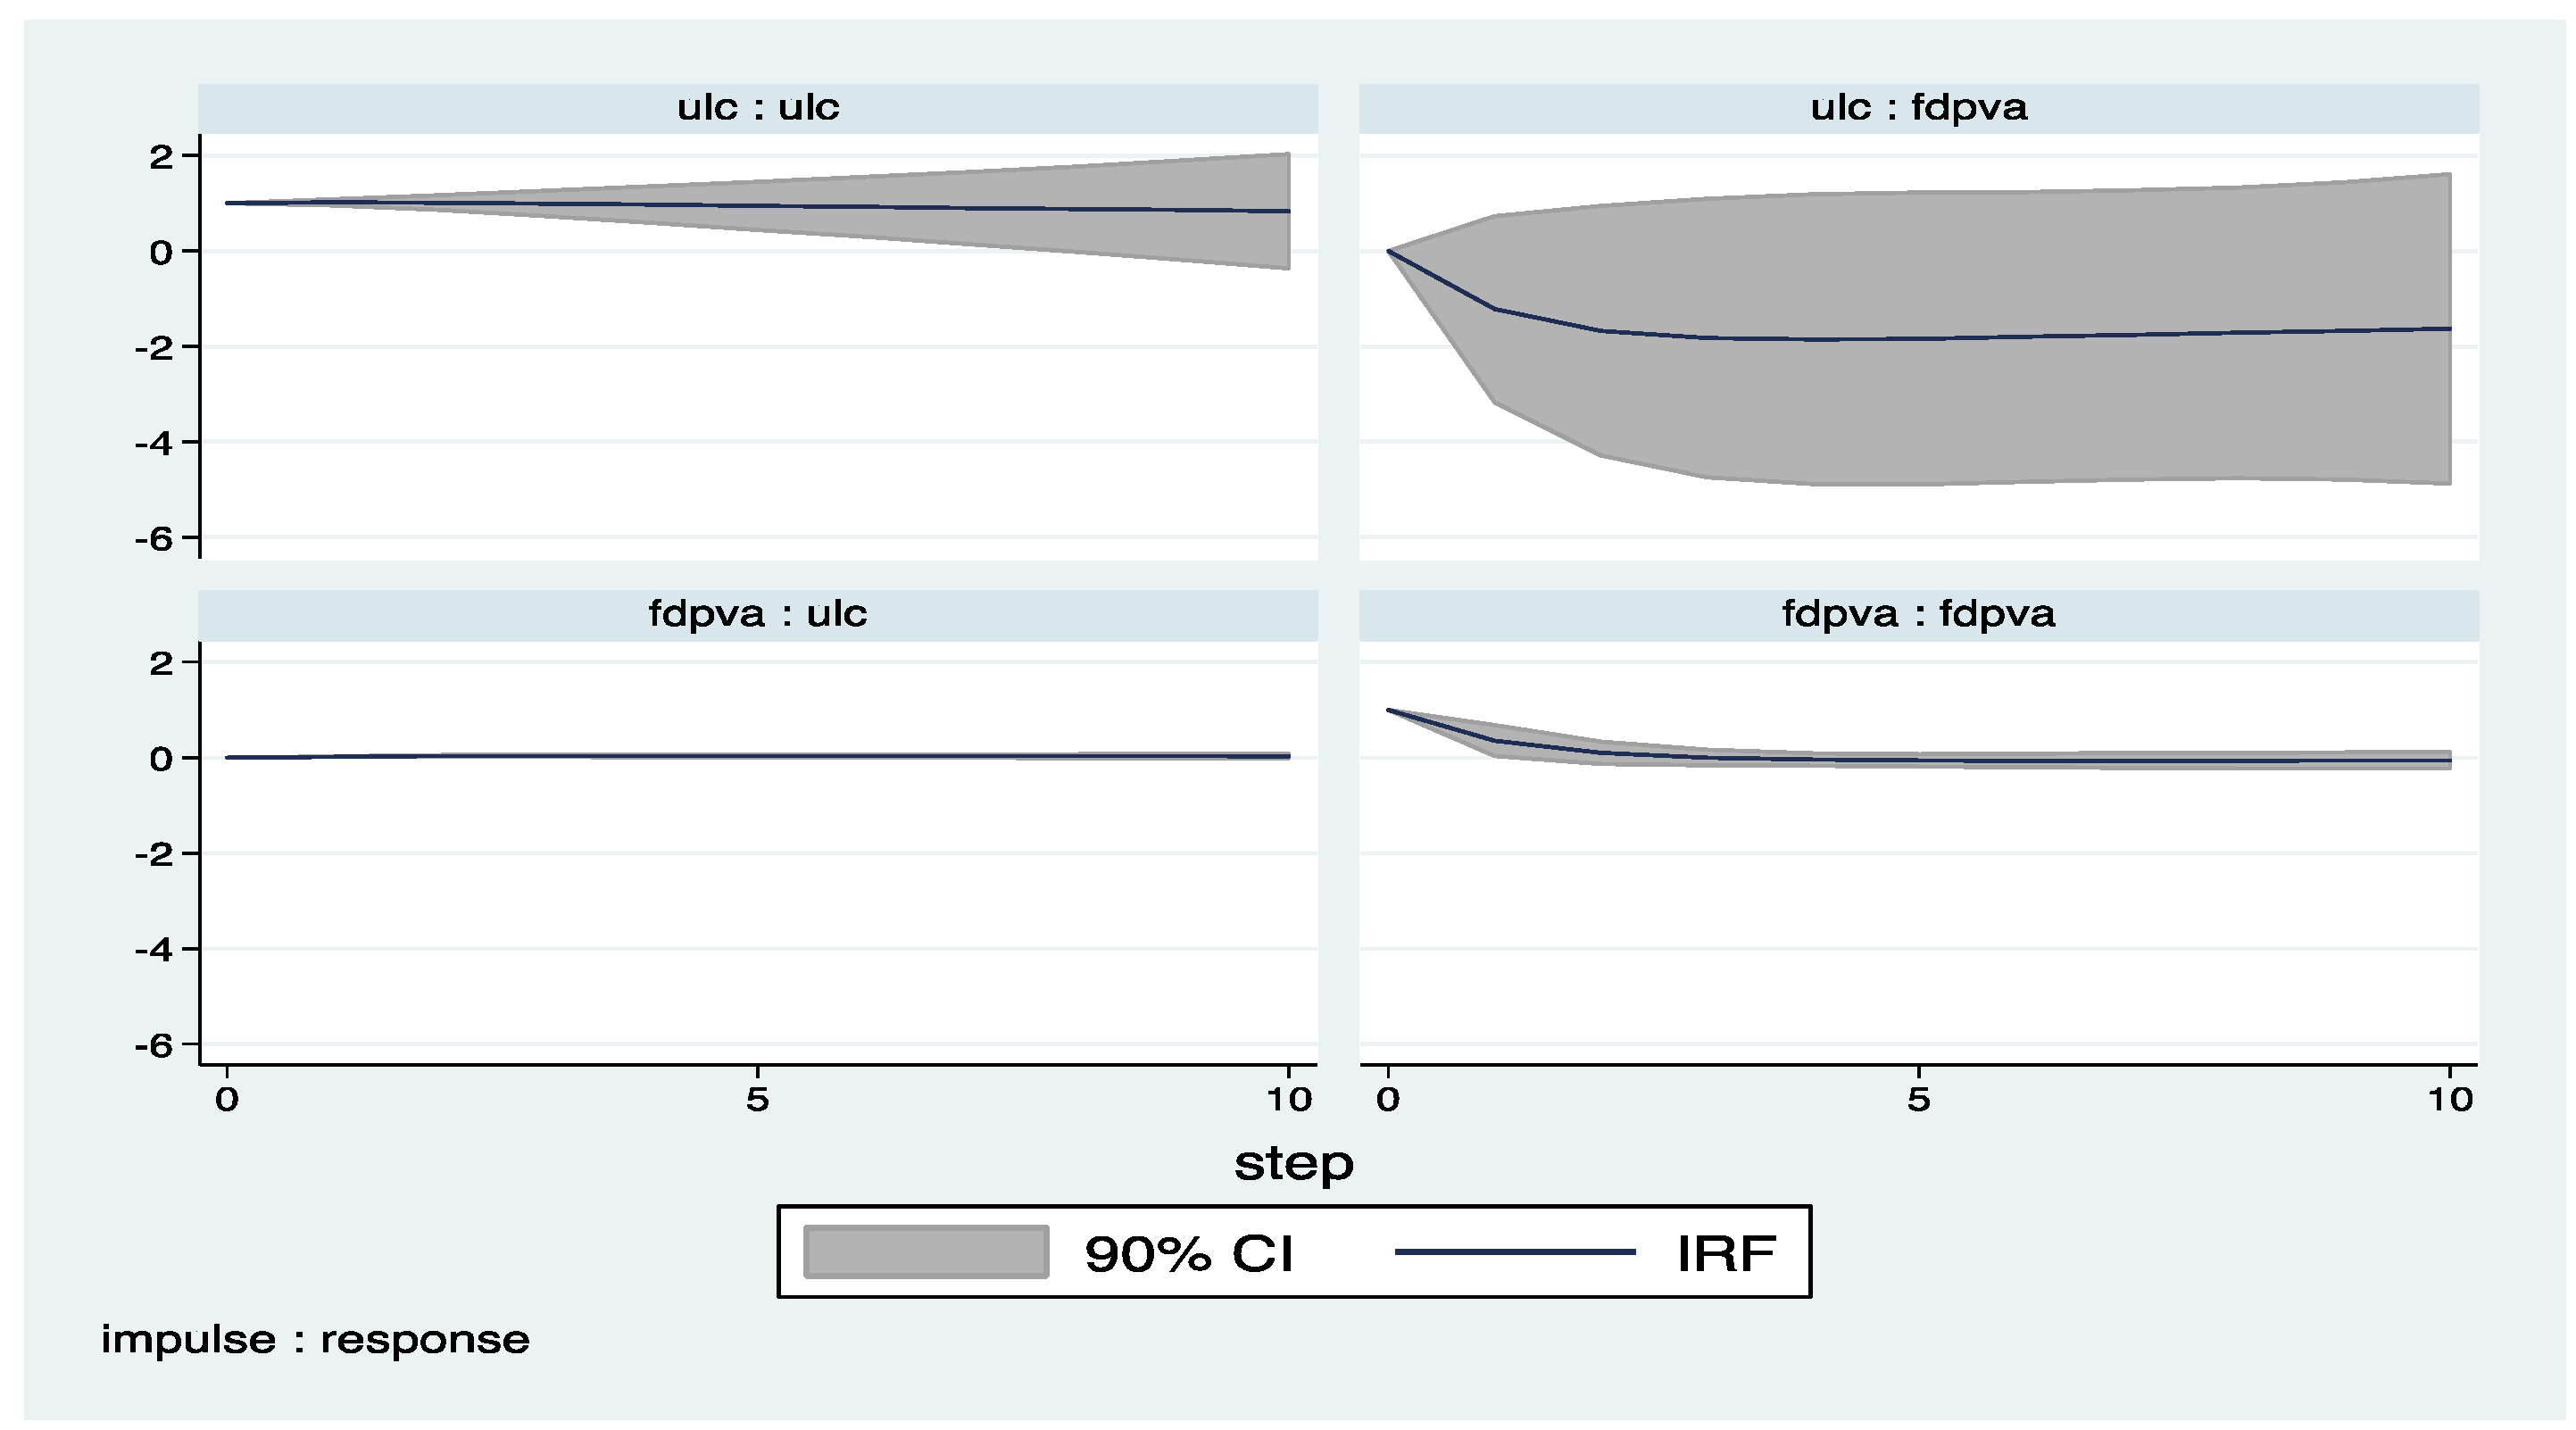
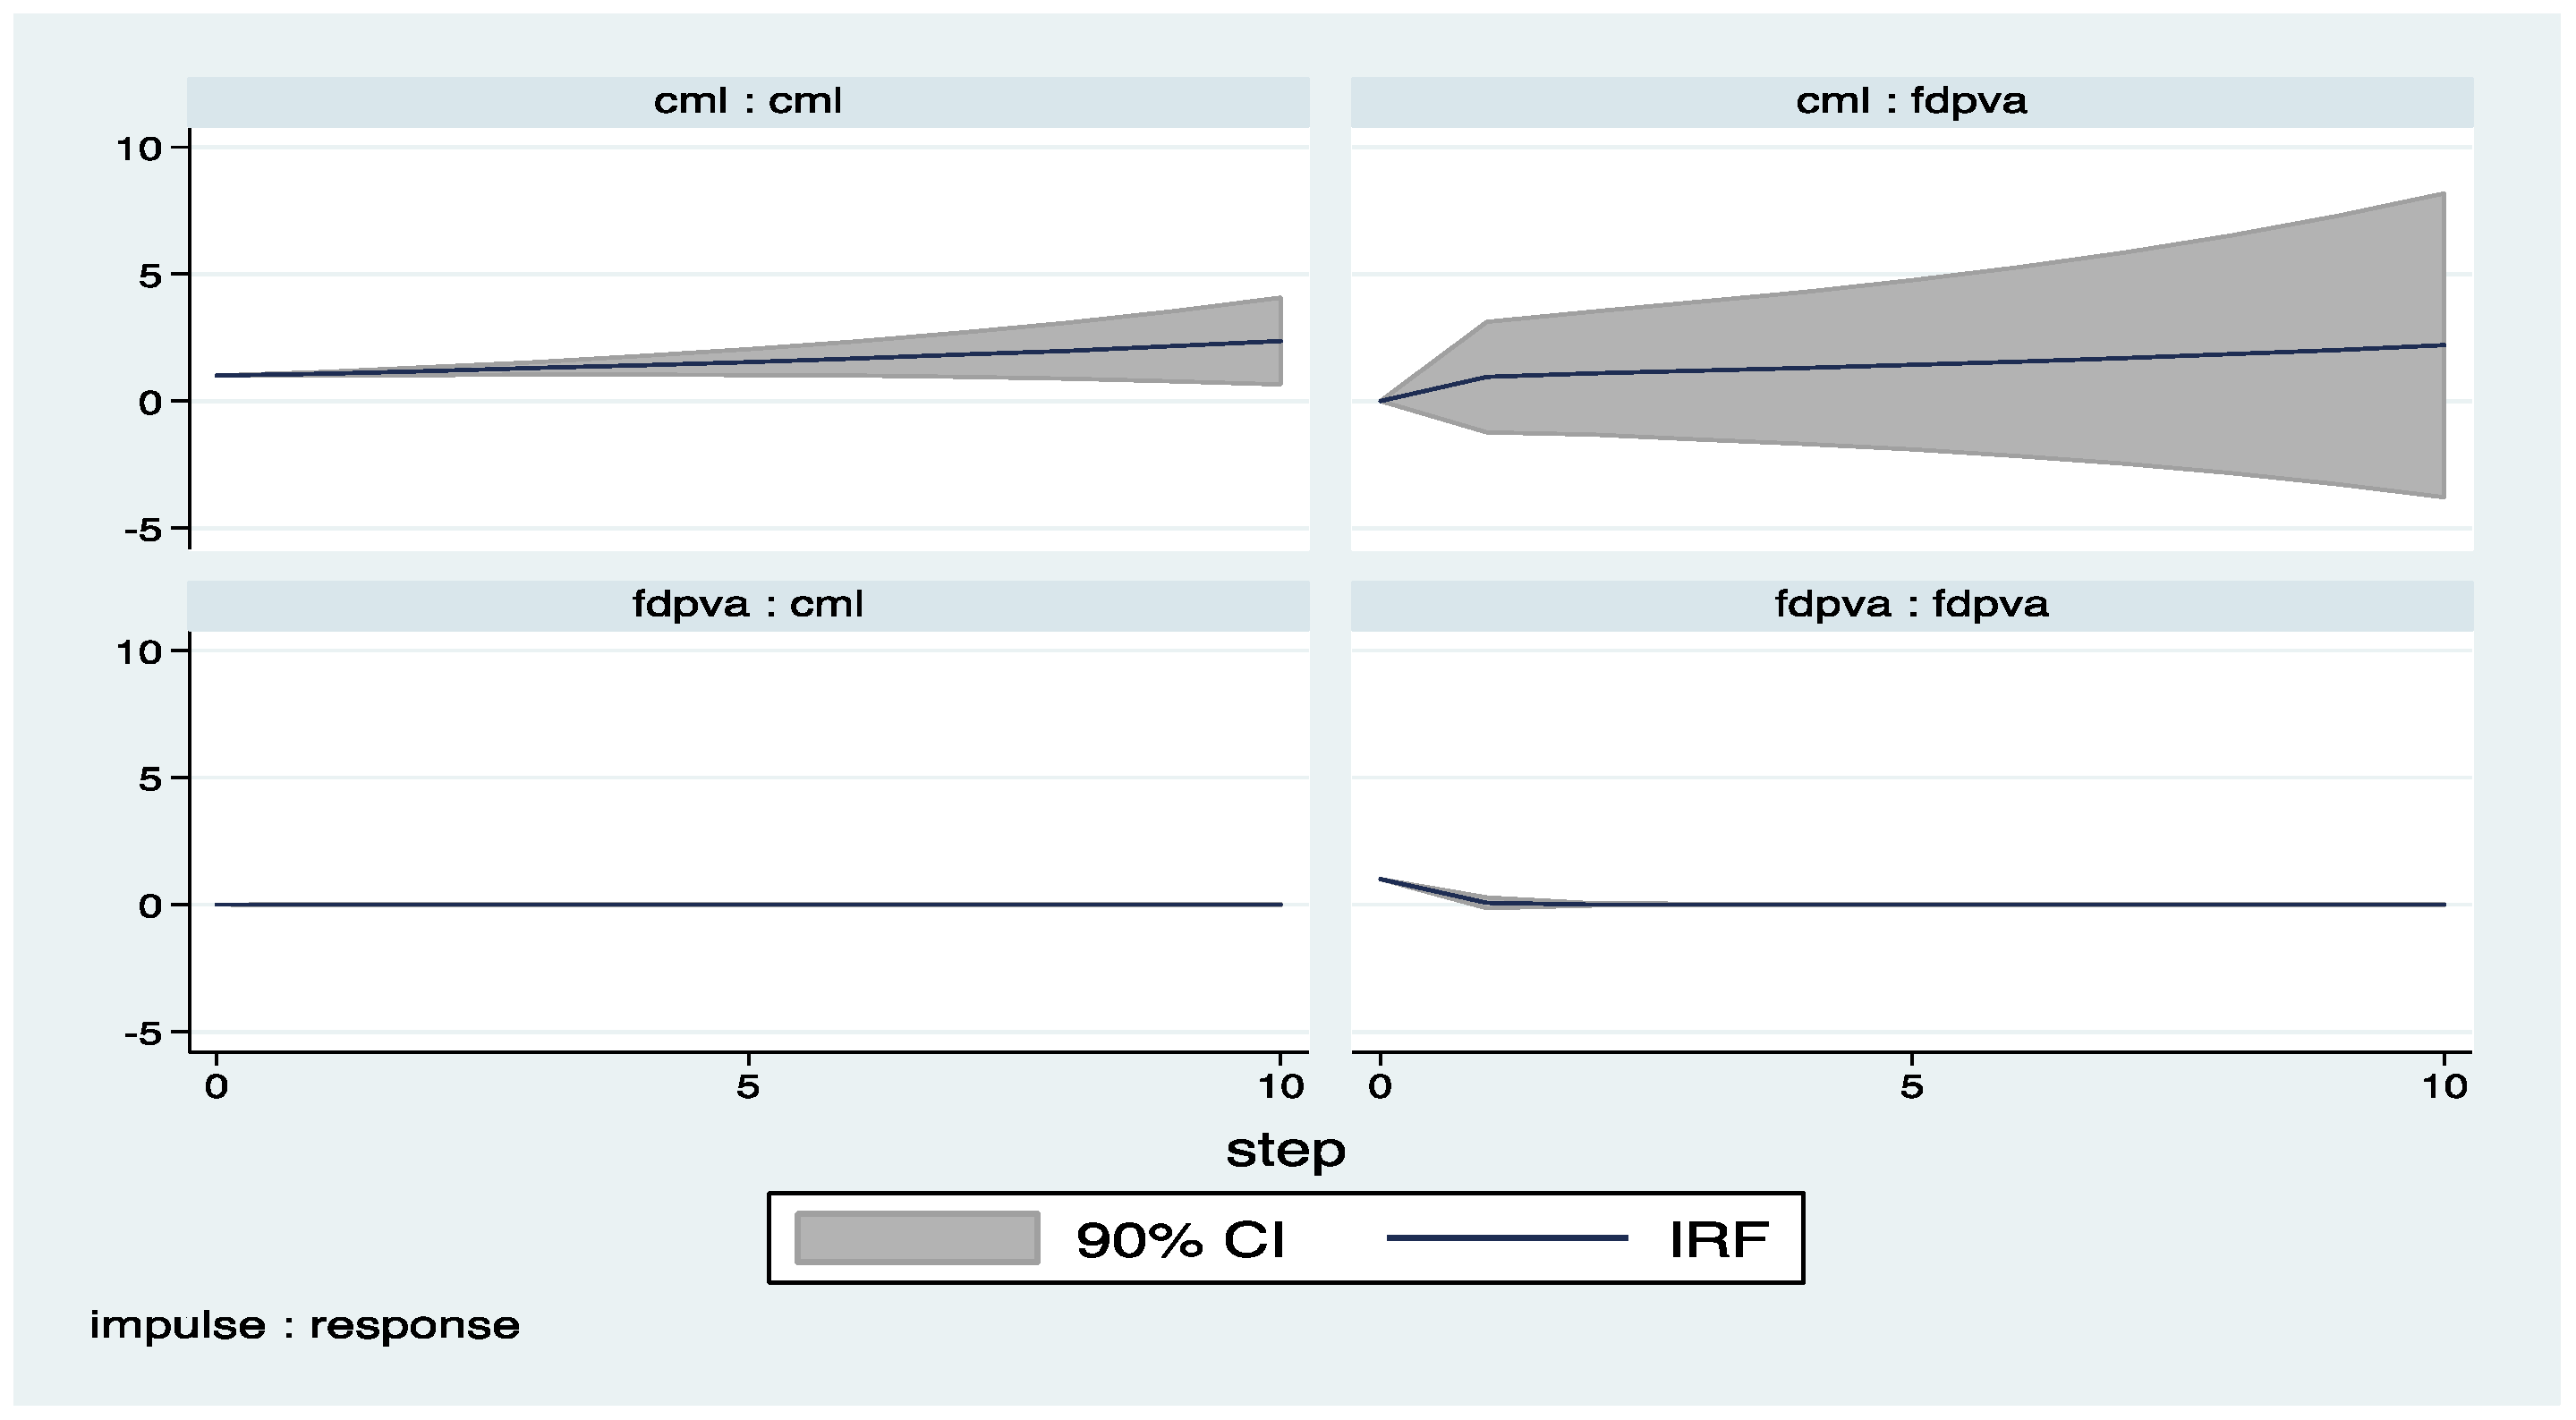
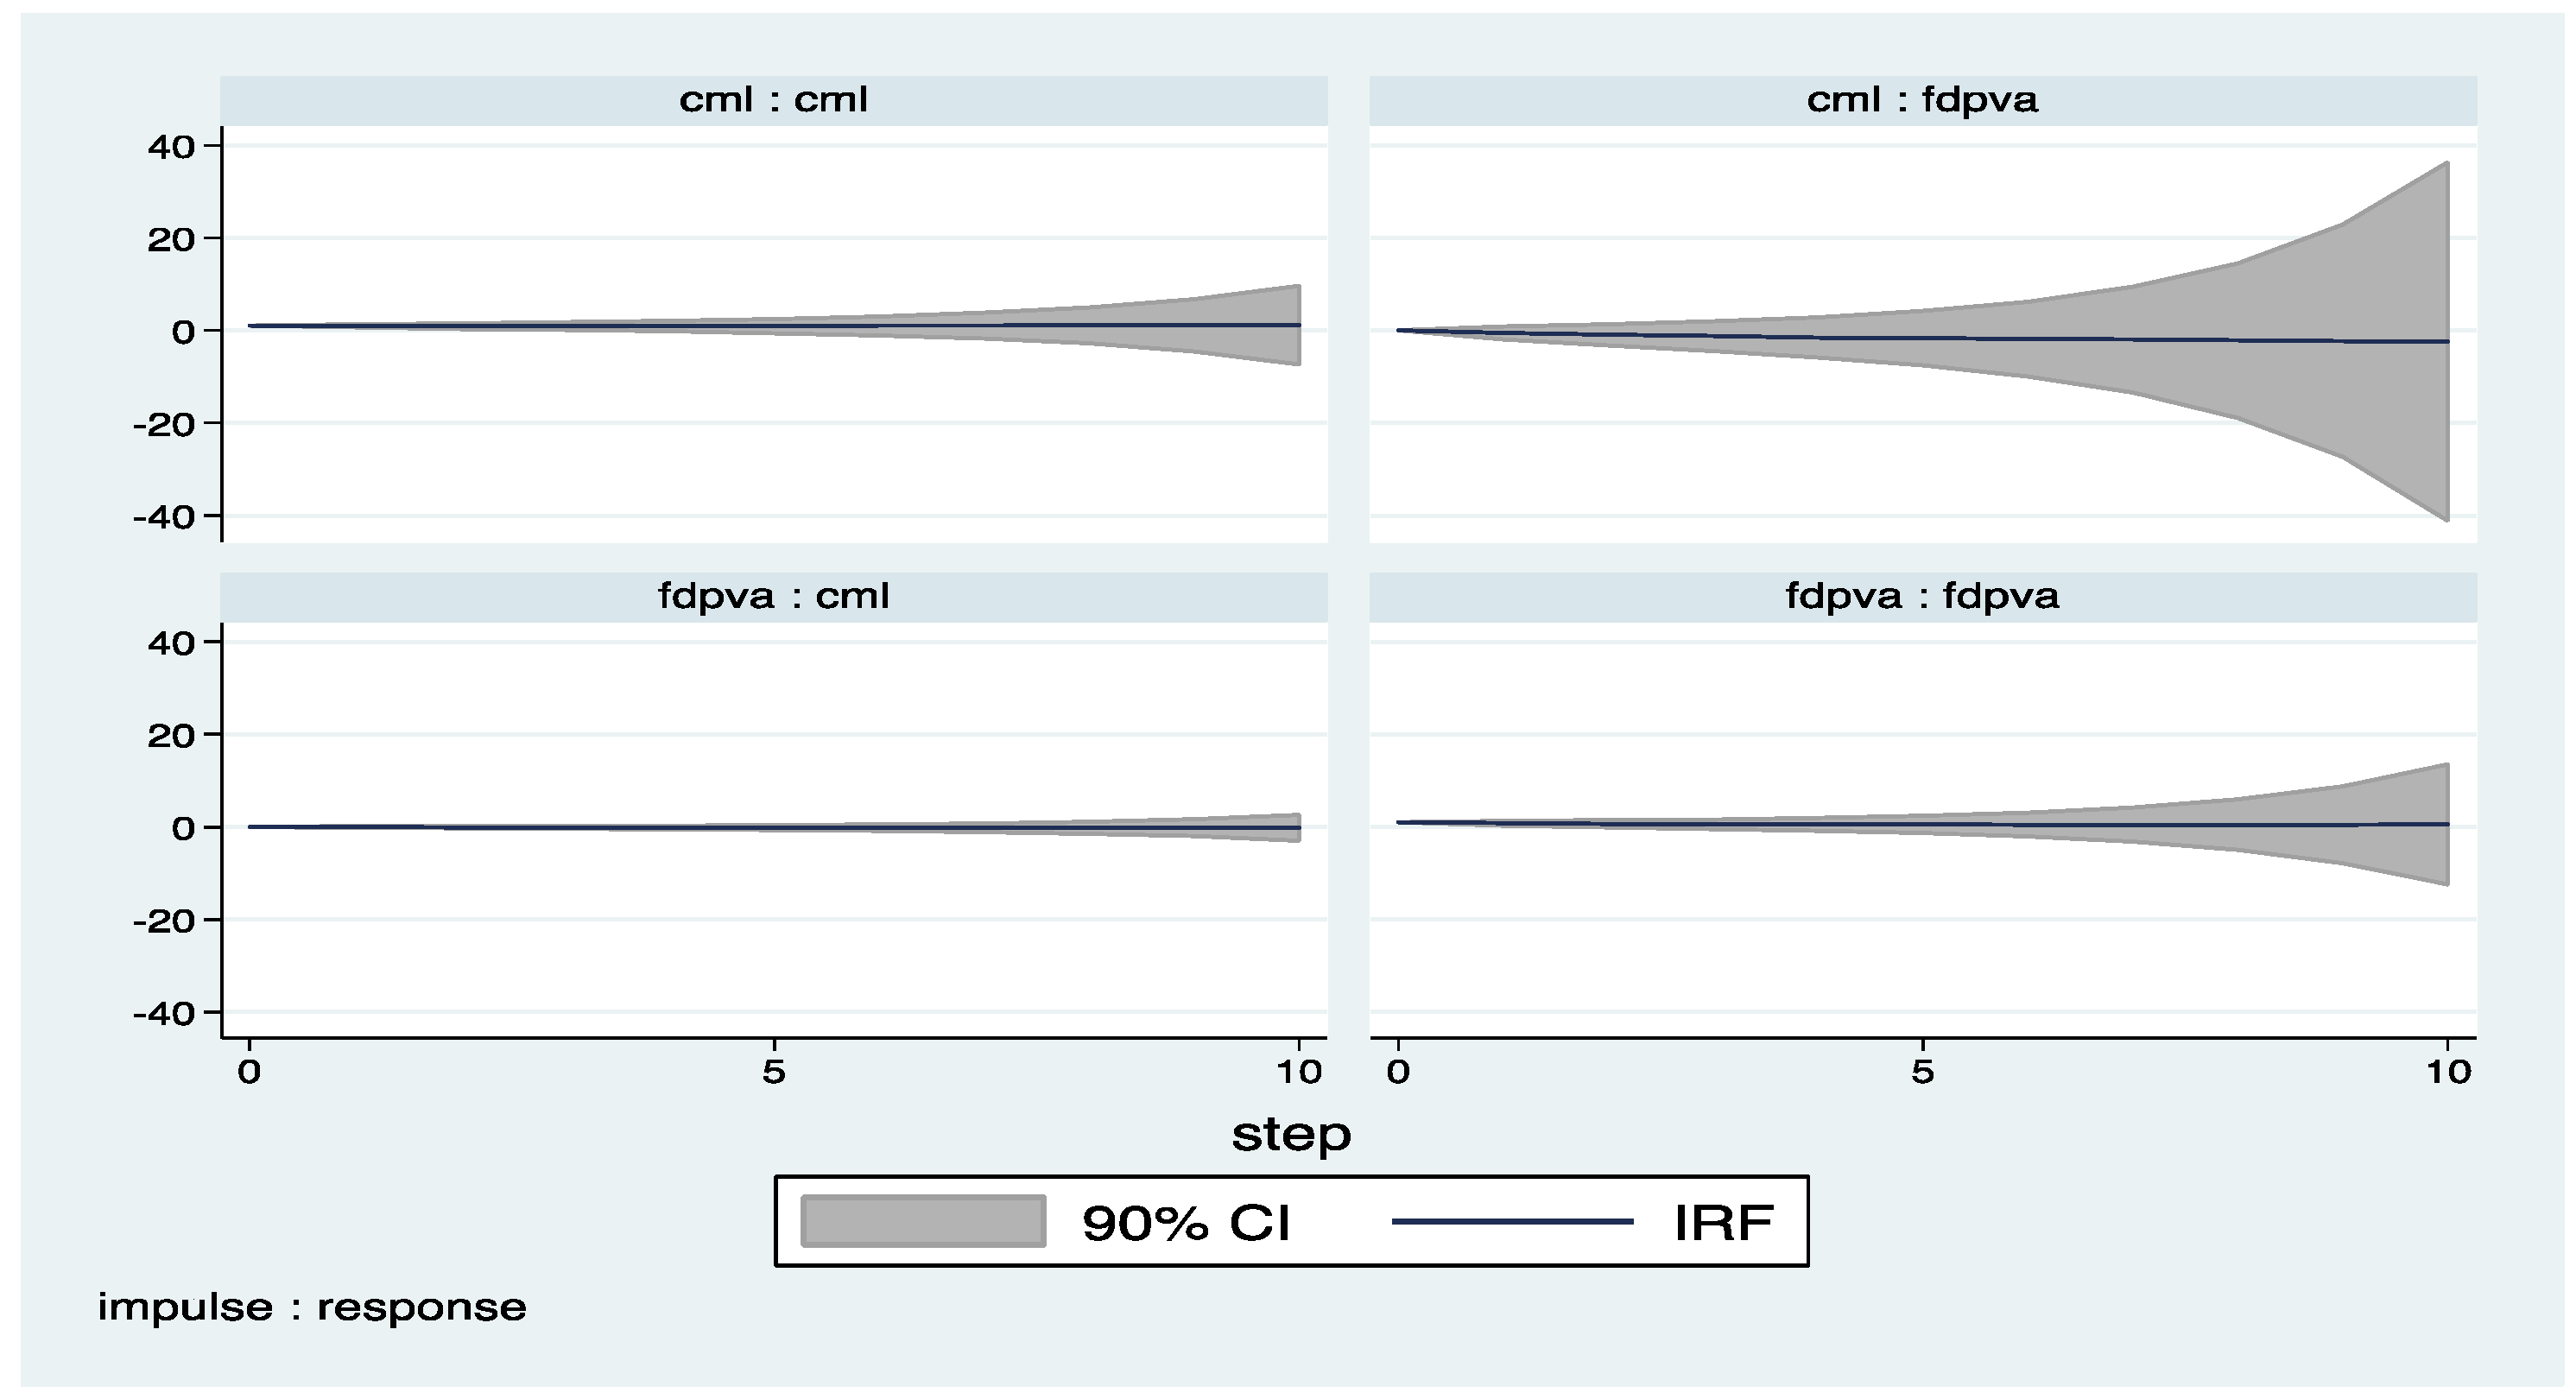
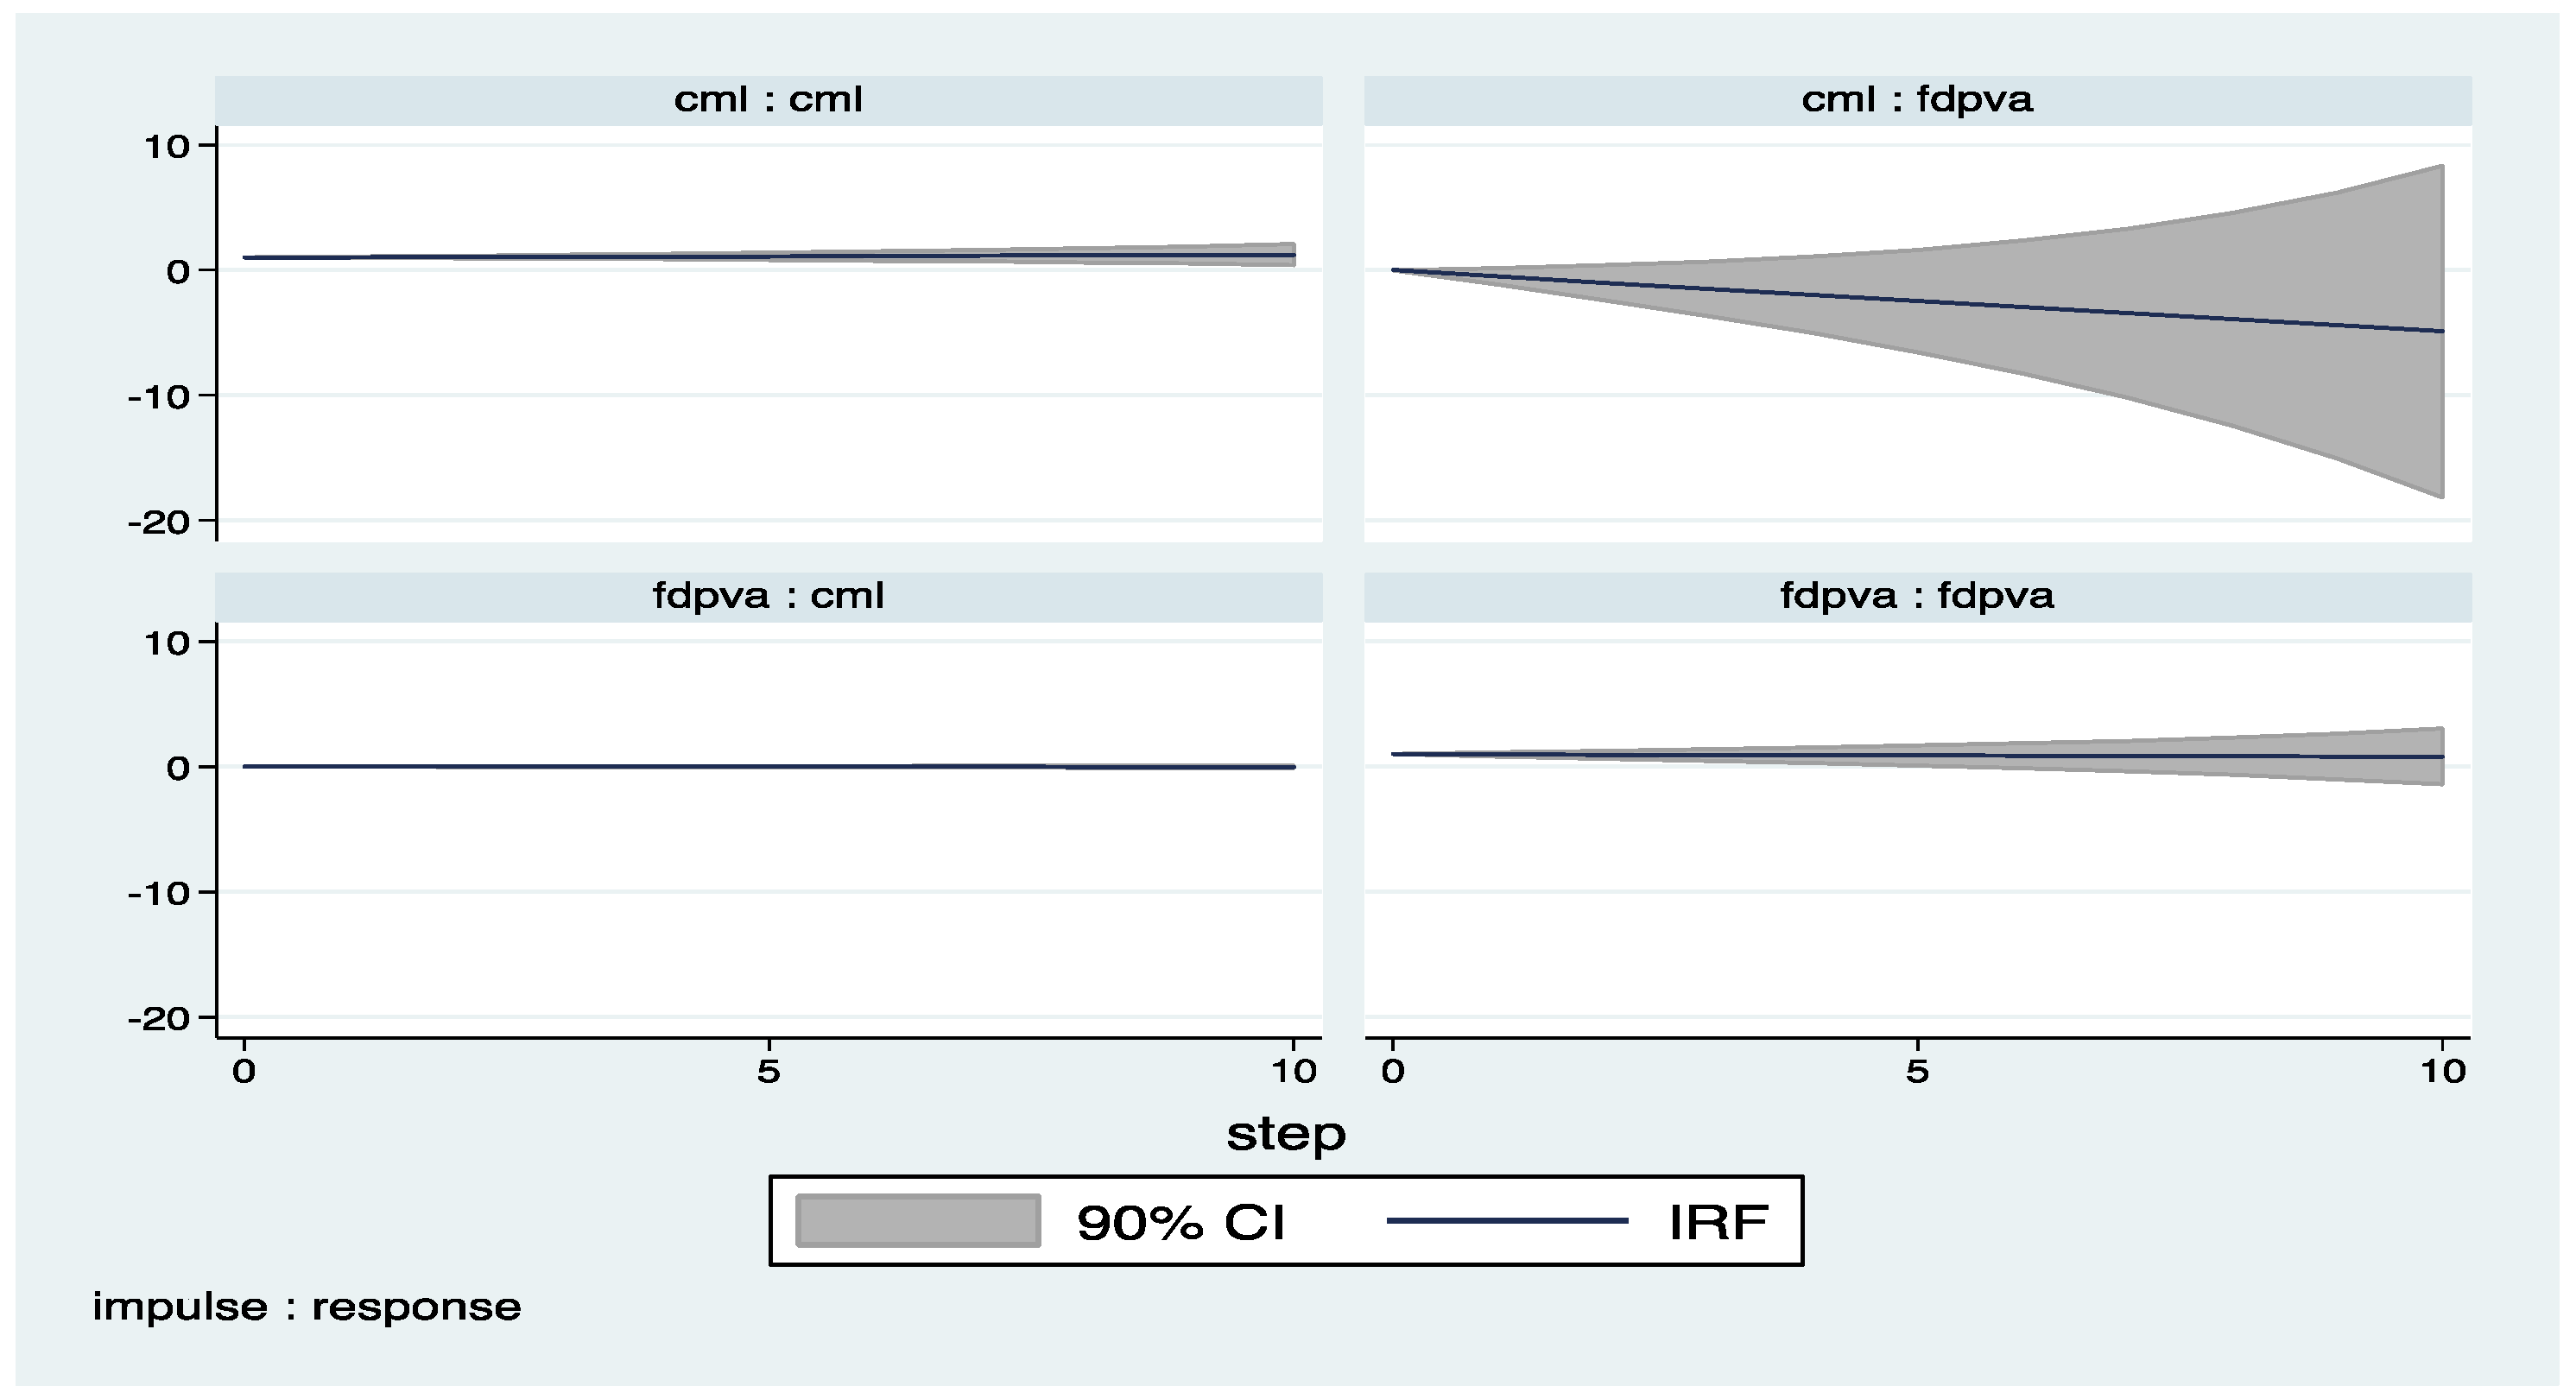
On the other hand, the figures in Appendix A display the IRFs for the panel VAR models and support the findings presented in Table 3, Table 4, Table 5, Table 6, Table 7, Table 8, Table 9, Table 10, Table 11 and Table 126. IRFs also show that FDI not only seeks cheap labor but also seeks qualified and productive labor according to the aggregate econometric evidence. Further, higher productivity of labor reflecting higher compensation to labor attracts more FDI, and this increase in FDI leads to higher labor compensation; this relationship can be labeled as a virtuous cycle. On the other hand, a rise in the labor market regulatory burdens reflected itself in higher unit labor cost, which lowers FDI, and a reduction in FDI leads to a drop in the compensation of labor, which in turn lowers FDI, and this association can be labeled as a vicious cycle. The virtuous and vicious cycles in the aggregate data analysis are also encountered in the manufacturing sector where the manufacturing sector comprises the dominant part of FDI flows. Moreover, the results display the significant differences across sectors. While there is no relationship between labor costs and FDI in the industry sector, unit labor costs matter for FDI in the manufacturing and finance sectors. The race to the bottom hypothesis could be valid for only the manufacturing and finance sectors, but there is no evidence for the race to the bottom hypothesis in the industry and construction sectors. Further evidence indicates that the bi-directional relationship between labor compensation and FDI is only experienced by the manufacturing sector. In the light of these findings, policy makers should concentrate on the sectoral composition of FDI and the sub-components of labor costs when seeking to understand the overall interaction between labor costs and FDI. In addition, regulatory burdens on the labor market should be reduced not only to attract and to preserve FDI but also to benefit from increased productivity with the flow of FDI.
4. Conclusions
During the past decade, the outstanding role of MNEs on the global labor market outcomes has attracted a great deal of attention on many perspectives. While some part of the literature argues that foreign investment activities lower wages based on the cost seeking motive of MNEs, another strand of the literature claims the existence of positive wage spillovers from foreign to local firms. Therefore, the main rationale of this paper is to combine both the strands of the literature to capture the endogenous interaction between FDI and labor costs for the 23 OECD countries during the period 1995–2009 by adopting the panel VAR approach based on system GMM estimates. Even though many empirical studies have analyzed the intricate link between FDI and labor costs, none of them have considered the dynamic interaction between FDI and labor costs under panel VAR framework.
The findings of the paper could be summarized as follows (See Table 13). As for the manufacturing sector, which has a considerable share in overall FDI flows, the econometric evidence follows the aggregate findings. Particularly, a fall in the unit labor costs encourages FDI, which supports the cost seeking motive of FDI and the evidence for the race to the bottom hypothesis. On the other hand, a rise in the compensation of labor (reflecting the productivity of labor) induces higher FDI in the manufacturing sector. Therefore, this suggests that compensation of labor, which reflects the productivity of labor, supports the flow of FDI, but unit labor costs associated with regulatory burdens in the labor market hinder the flow of FDI in the manufacturing sector. A policy recommendation for host countries to attract more FDI in the manufacturing sector is to implement policies to enhance the productivity of labor, which will be reflected in higher returns (compensation to labor) and lower the regulatory burdens (lowering unit labor costs). On the other hand, the higher productivity of labor attracts more FDI, which in turn leads to FDI generating higher productivity. This relationship can be labeled as a virtuous cycle. However, increased labor costs reduce FDI, which leads to a reduction in the compensation of labor (a fall in the productivity), which in turn lowers FDI. This association could be labeled as a vicious cycle. That is, labor market regulatory burdens not only have a negative impact on FDI but also indirectly generate productivity/compensation losses due to the lower FDI.
Table 13.
Summary of Findings—Direction of Endogenous Interactions.
| ULC to FDI | FDI to ULC | CML to FDI | FDI to CML | |
|---|---|---|---|---|
| All sectors | Negative | None | Positive | Positive |
| Manufacturing | Negative | None | Positive | Positive |
| Finance | Negative | None | None | None |
| Industry | None | None | None | None |
| Construction | None | Positive | None | None |
As for the finance sector, the regulatory burdens in the labor market captured in the labor cost indicator deter FDI in the finance sector. On the other hand, in the construction sector, FDI increases unit labor costs. Therefore, policy makers should consider sectoral differences and underline the importance of the differential roles played by the sub-components of labor cost in designing policies for attracting and preserving FDI. In addition, regulatory labor market burdens should be reduced not only to attract FDI but also to increase the productivity of the labor.
Author Contributions
Bahar Bayraktar Sağlam has focused on econometrics and Selin Sayek Böke has contributed for the data and interpretation of results. Both have studied the main contribution and the literature.
Conflicts of Interest
The authors declare no conflict of interest.
Appendix A
Figure A1.
Impulse Response Functions: FDI and Unit Labor Cost.

Figure A2.
Impulse Response Functions: FDI and Labor Compensation Cost.
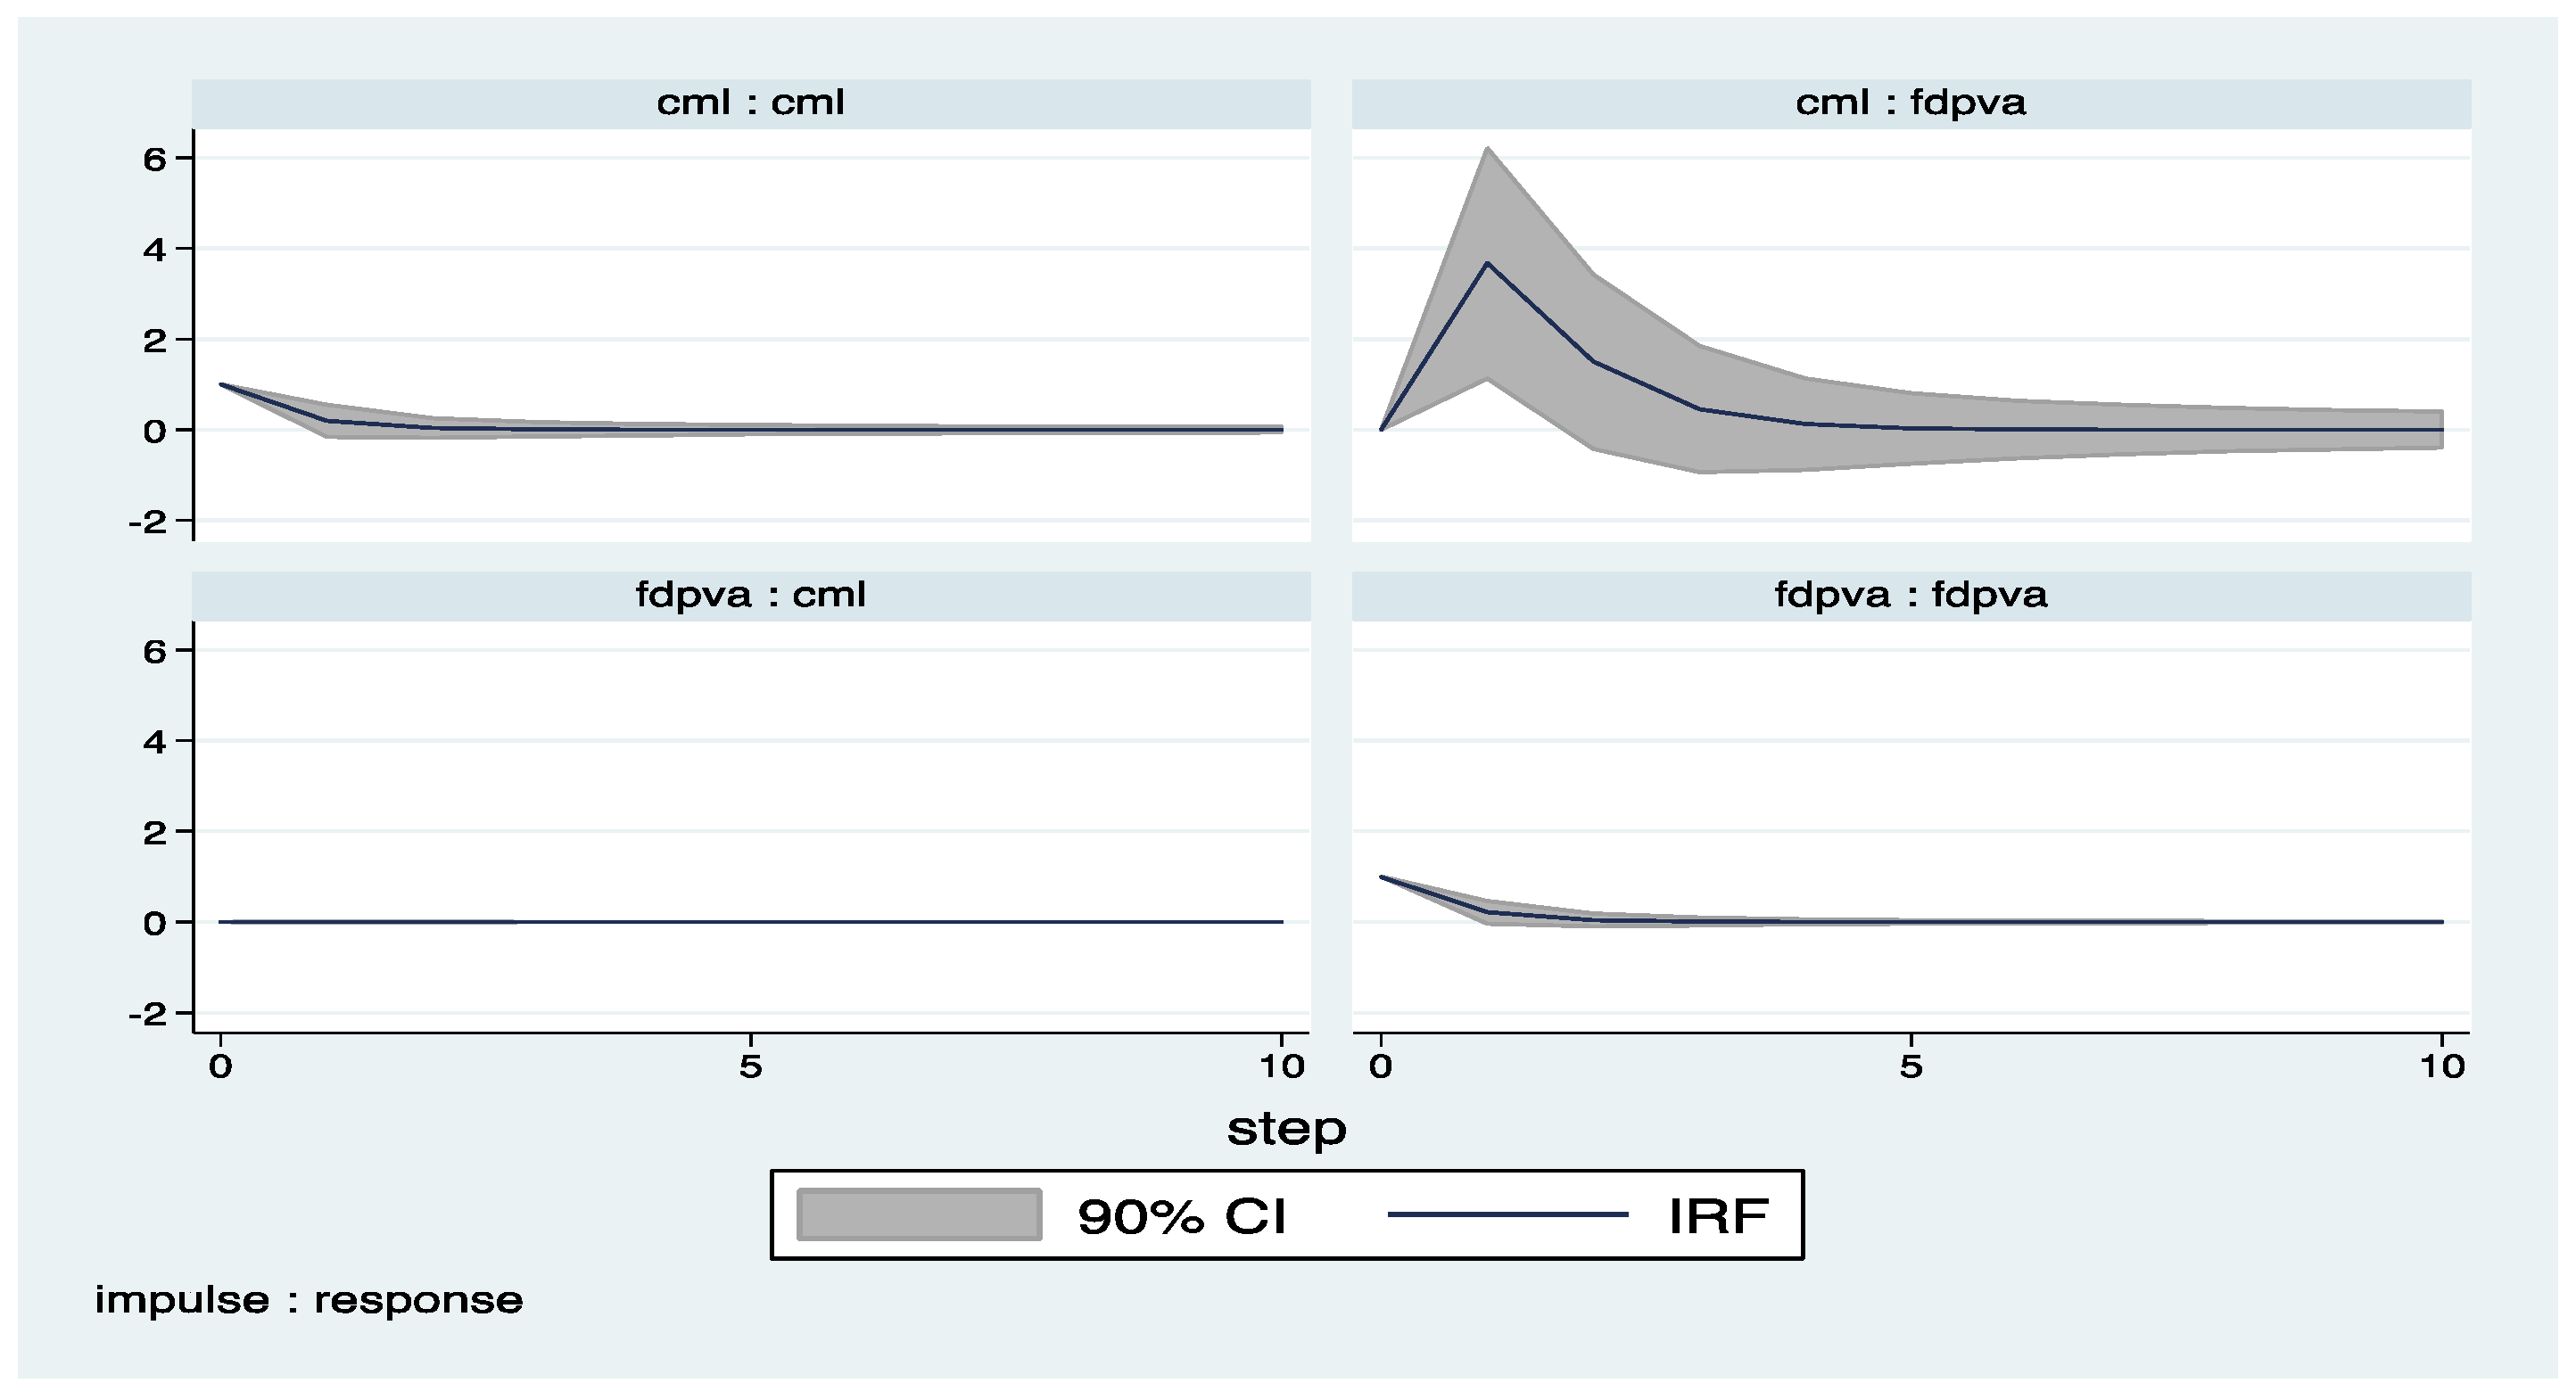
Figure A3.
Manufacturing Impulse Response Functions: FDI and Unit Labor Cost.

Figure A4.
Manufacturing Impulse Response Functions: FDI and Labor Compensation.

Figure A5.
Finance Impulse Response Functions: FDI and Unit Labor Cost.
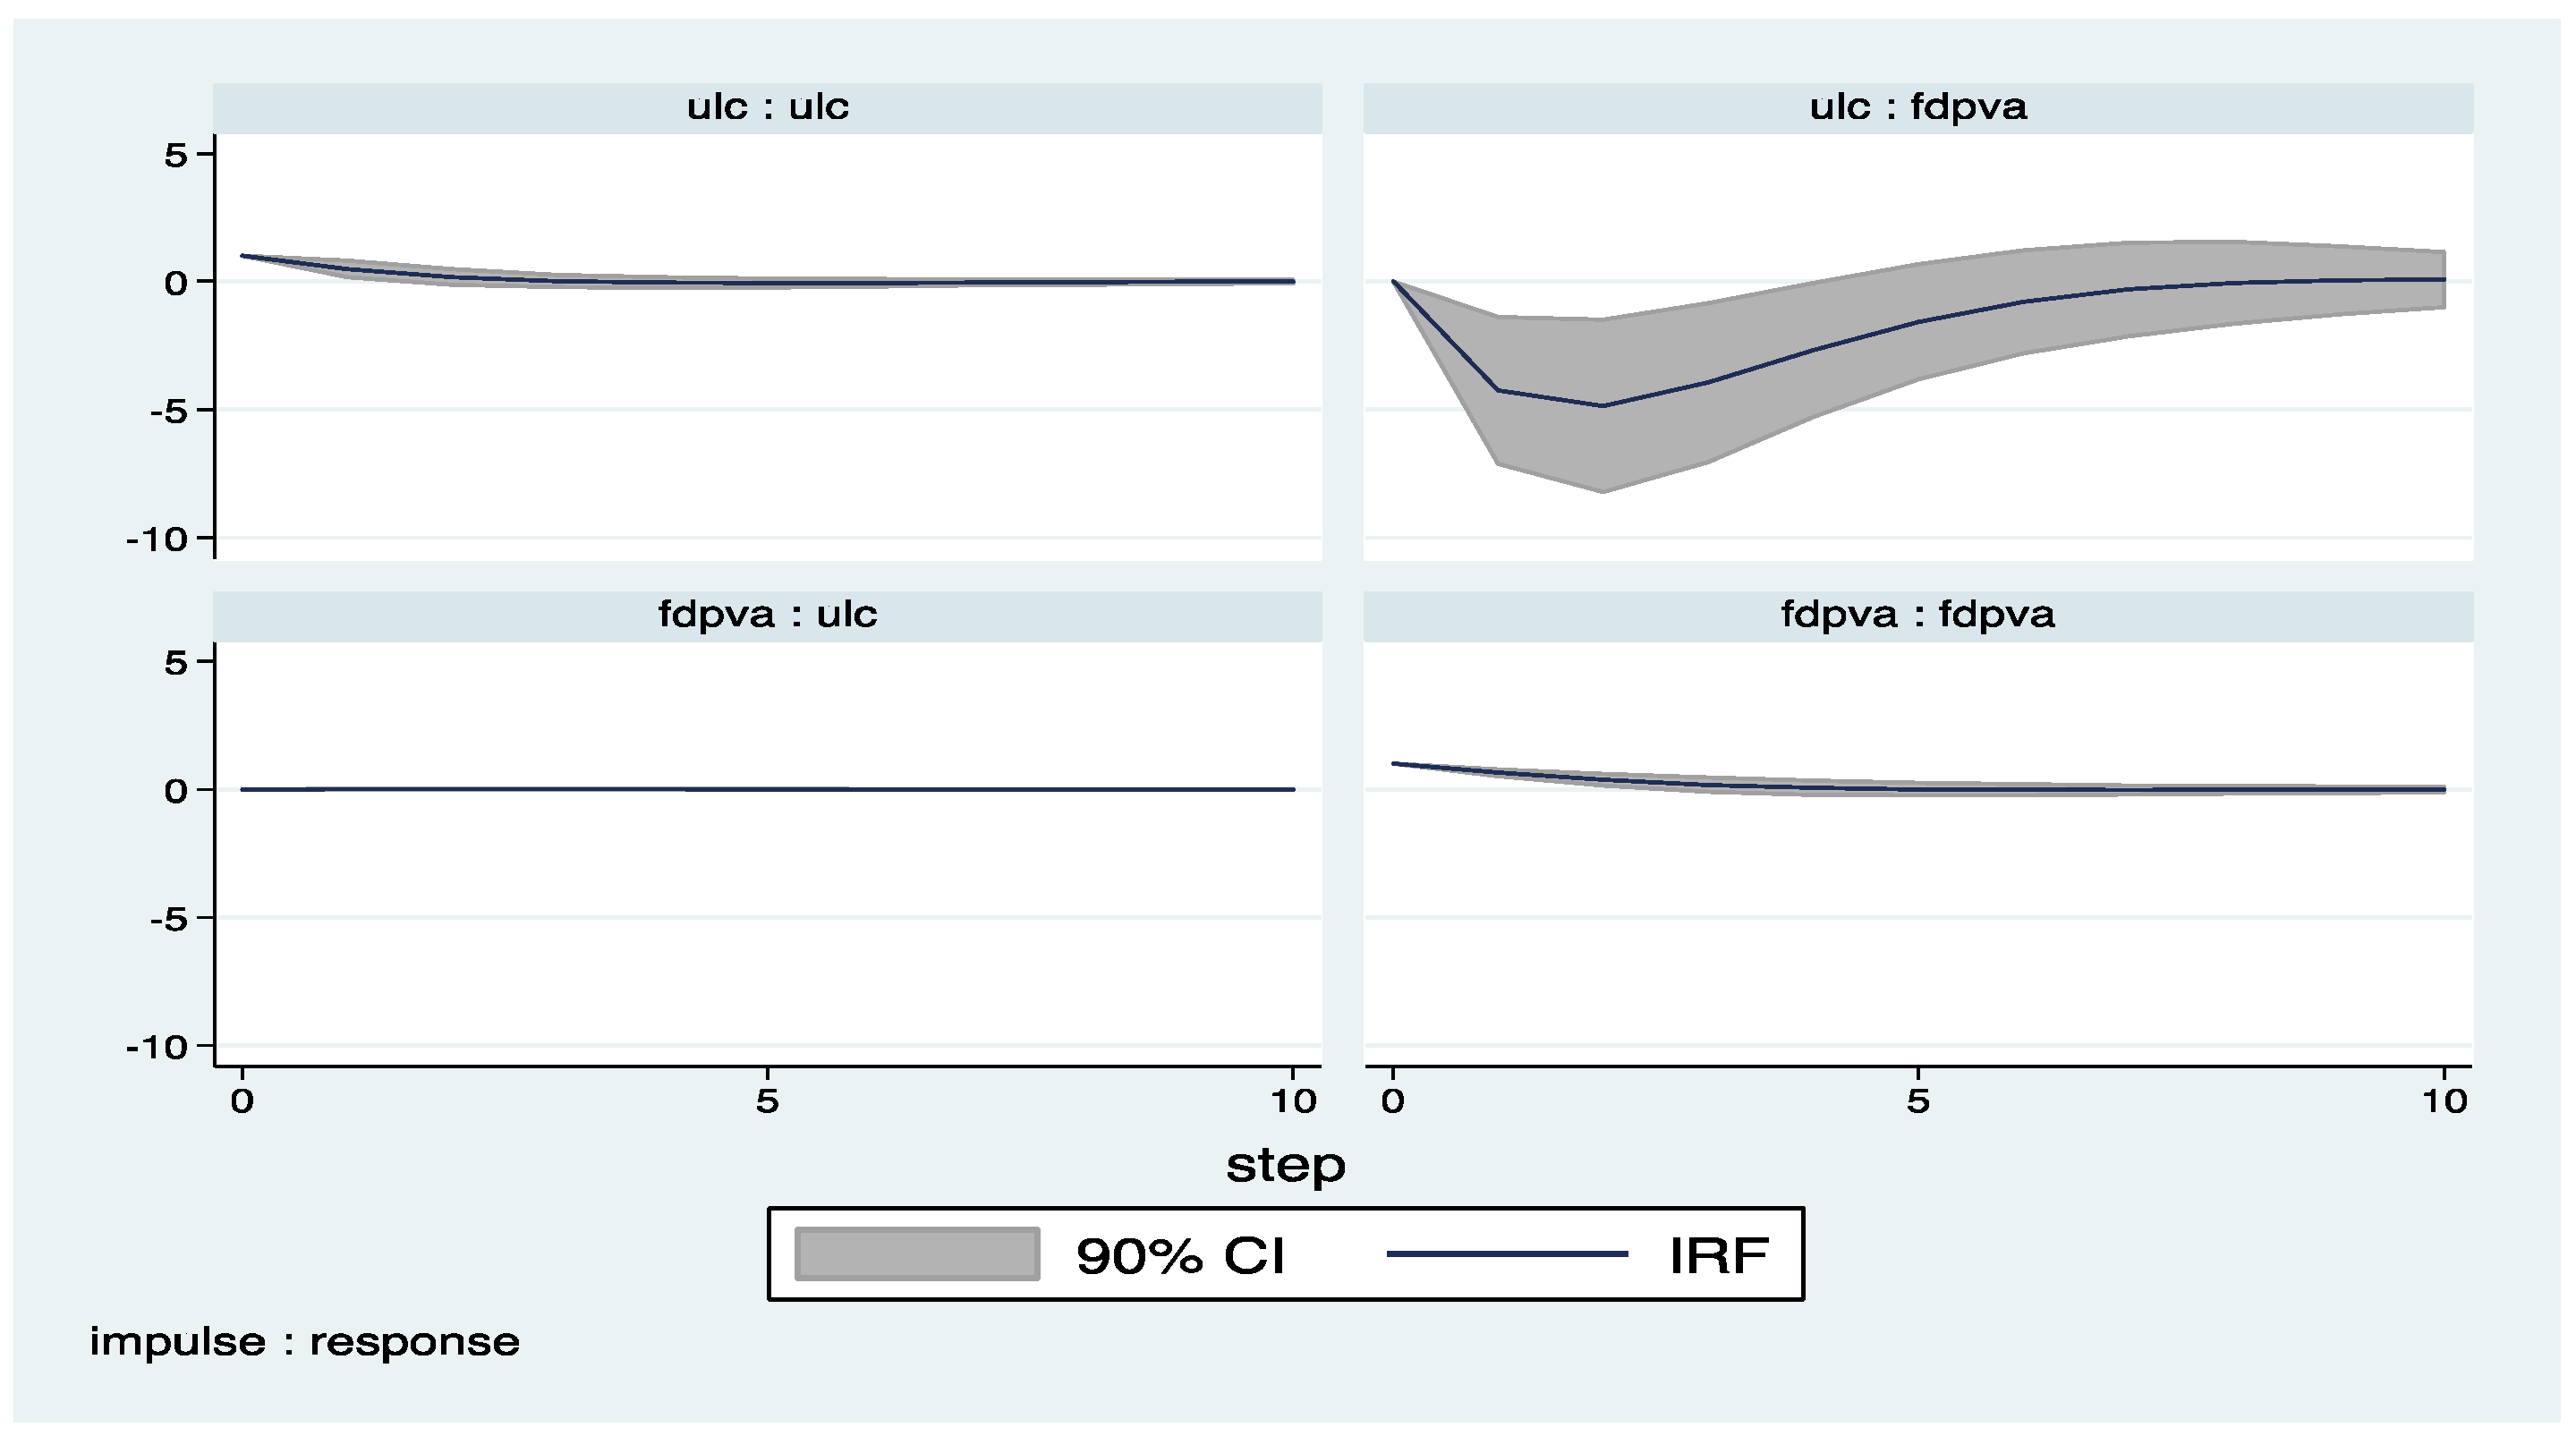
Figure A6.
Finance Impulse Response Functions: FDI and Labor Compensation.

Figure A7.
Construction Impulse Response Functions: FDI and Unit Labor Cost.

Figure A8.
Construction Impulse Response Functions: FDI and Labor Compensation.

Figure A9.
Industry Impulse Response Functions: FDI and Unit Labor Cost.
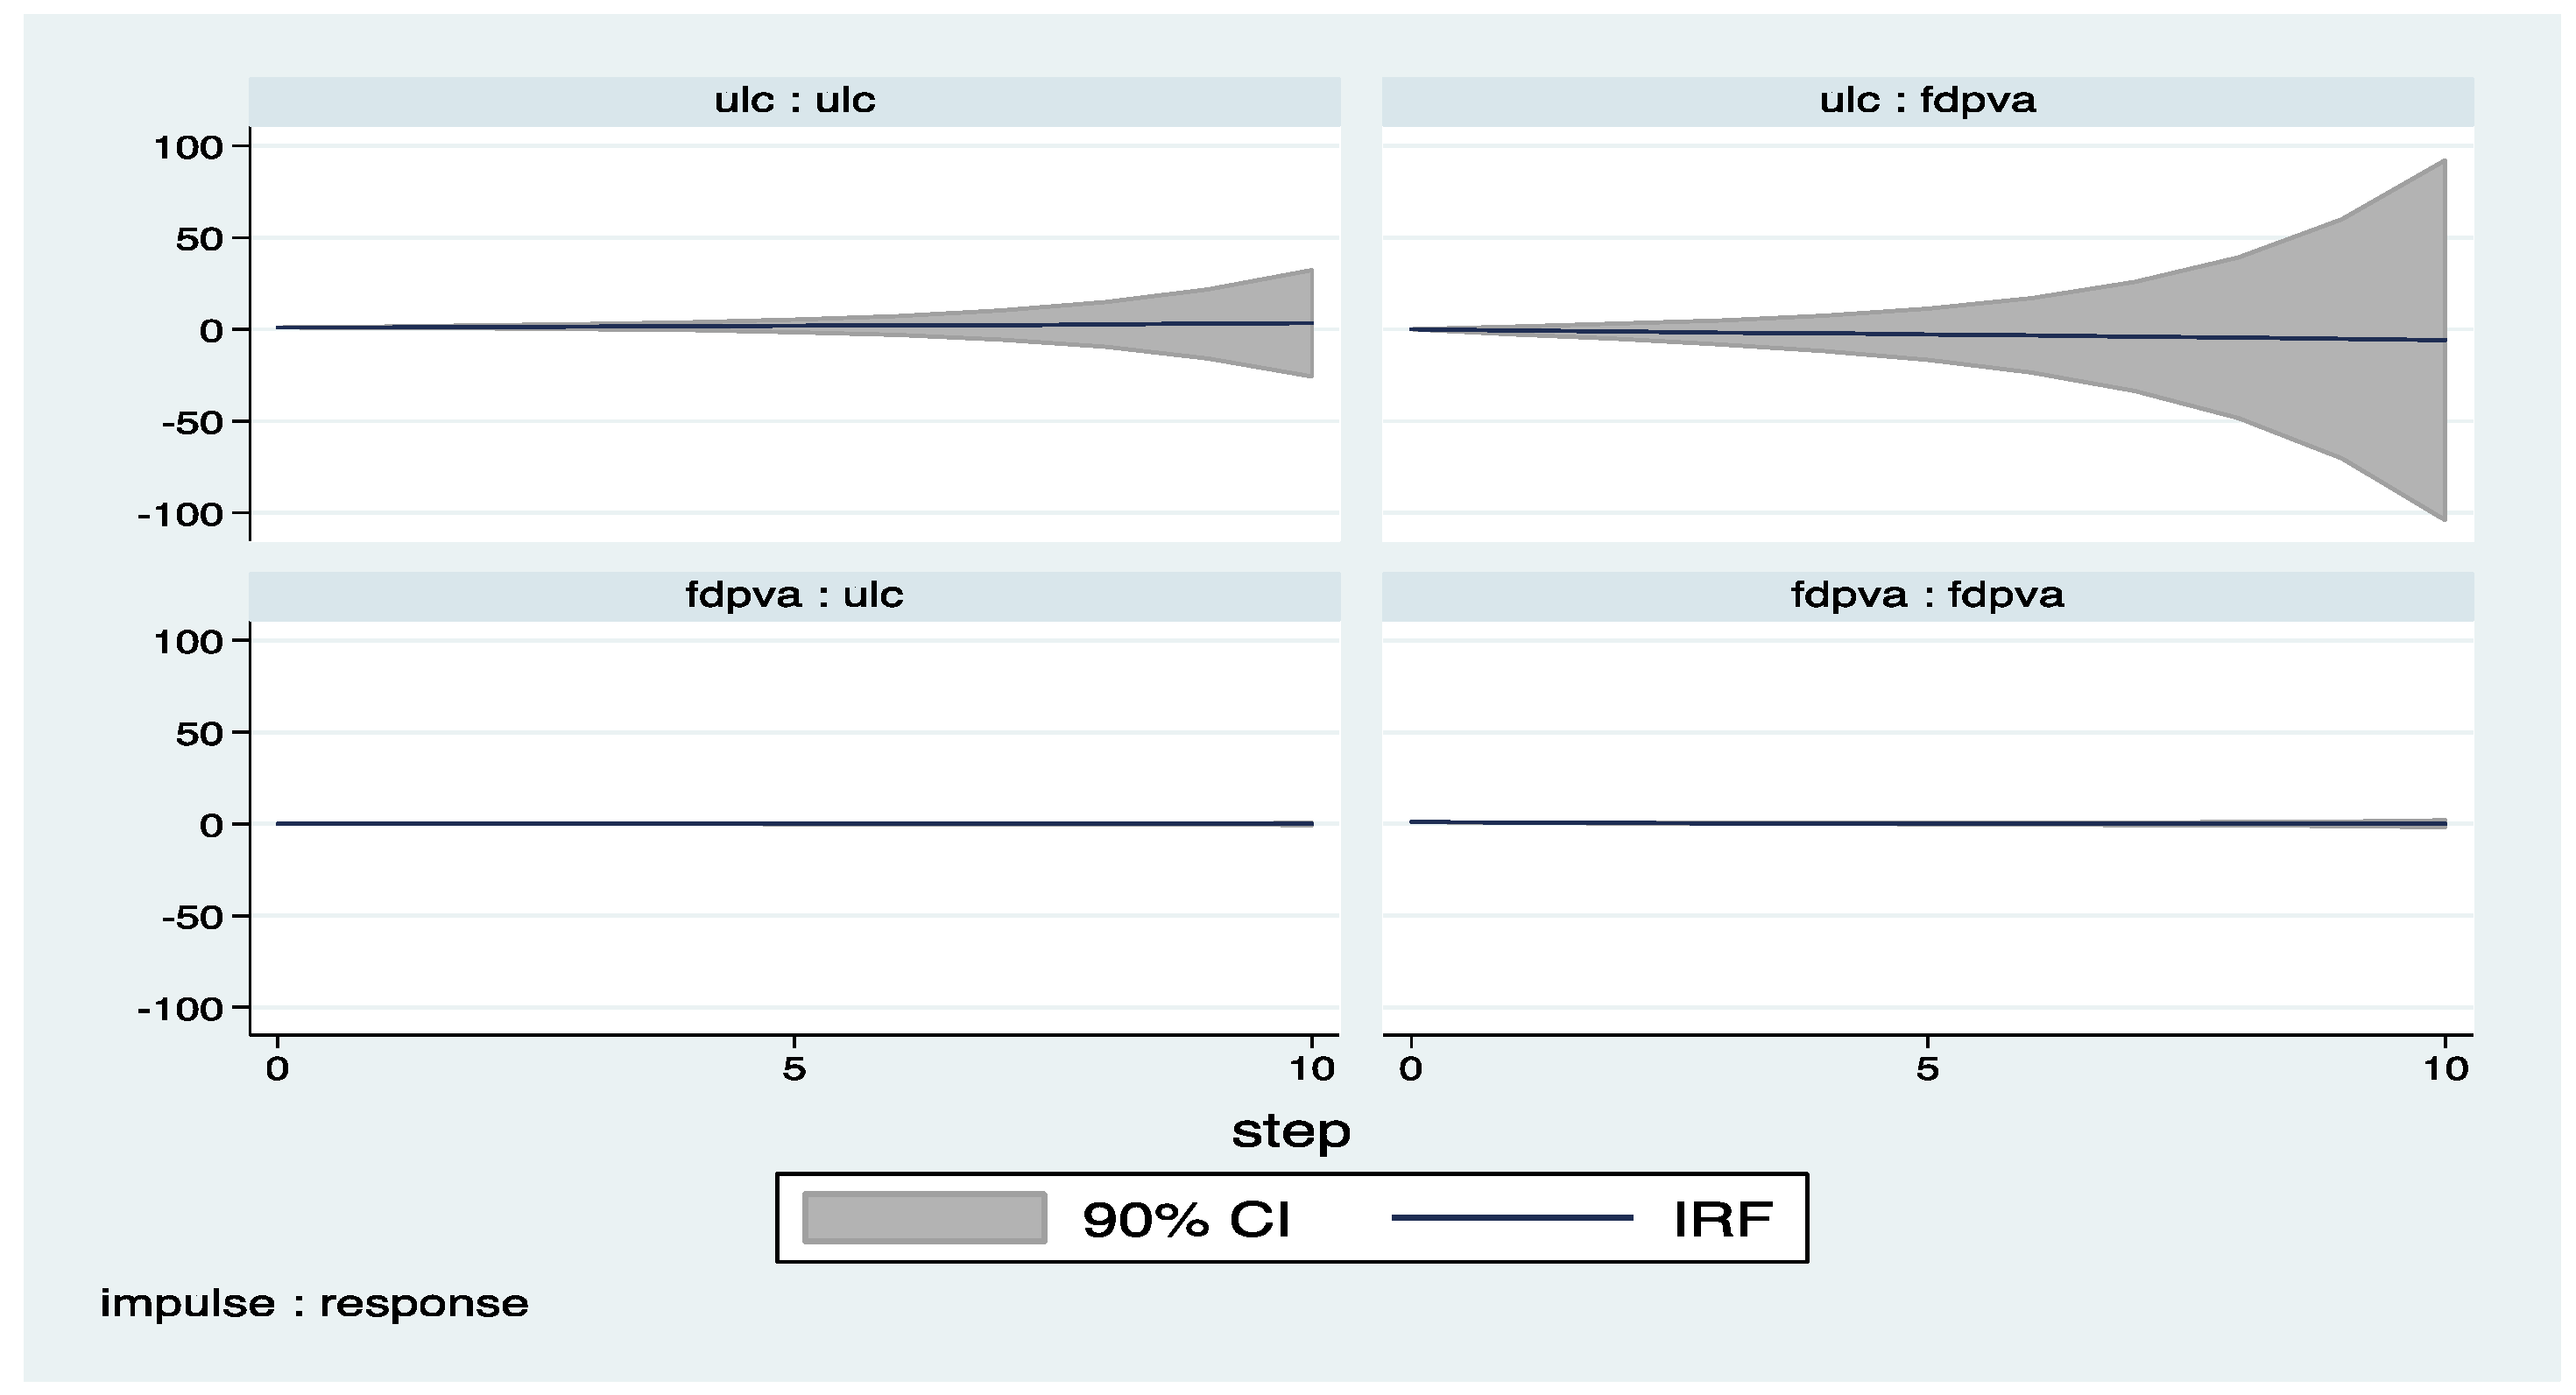
Figure A10.
Industry Impulse Response Functions: FDI and Labor Compensation.

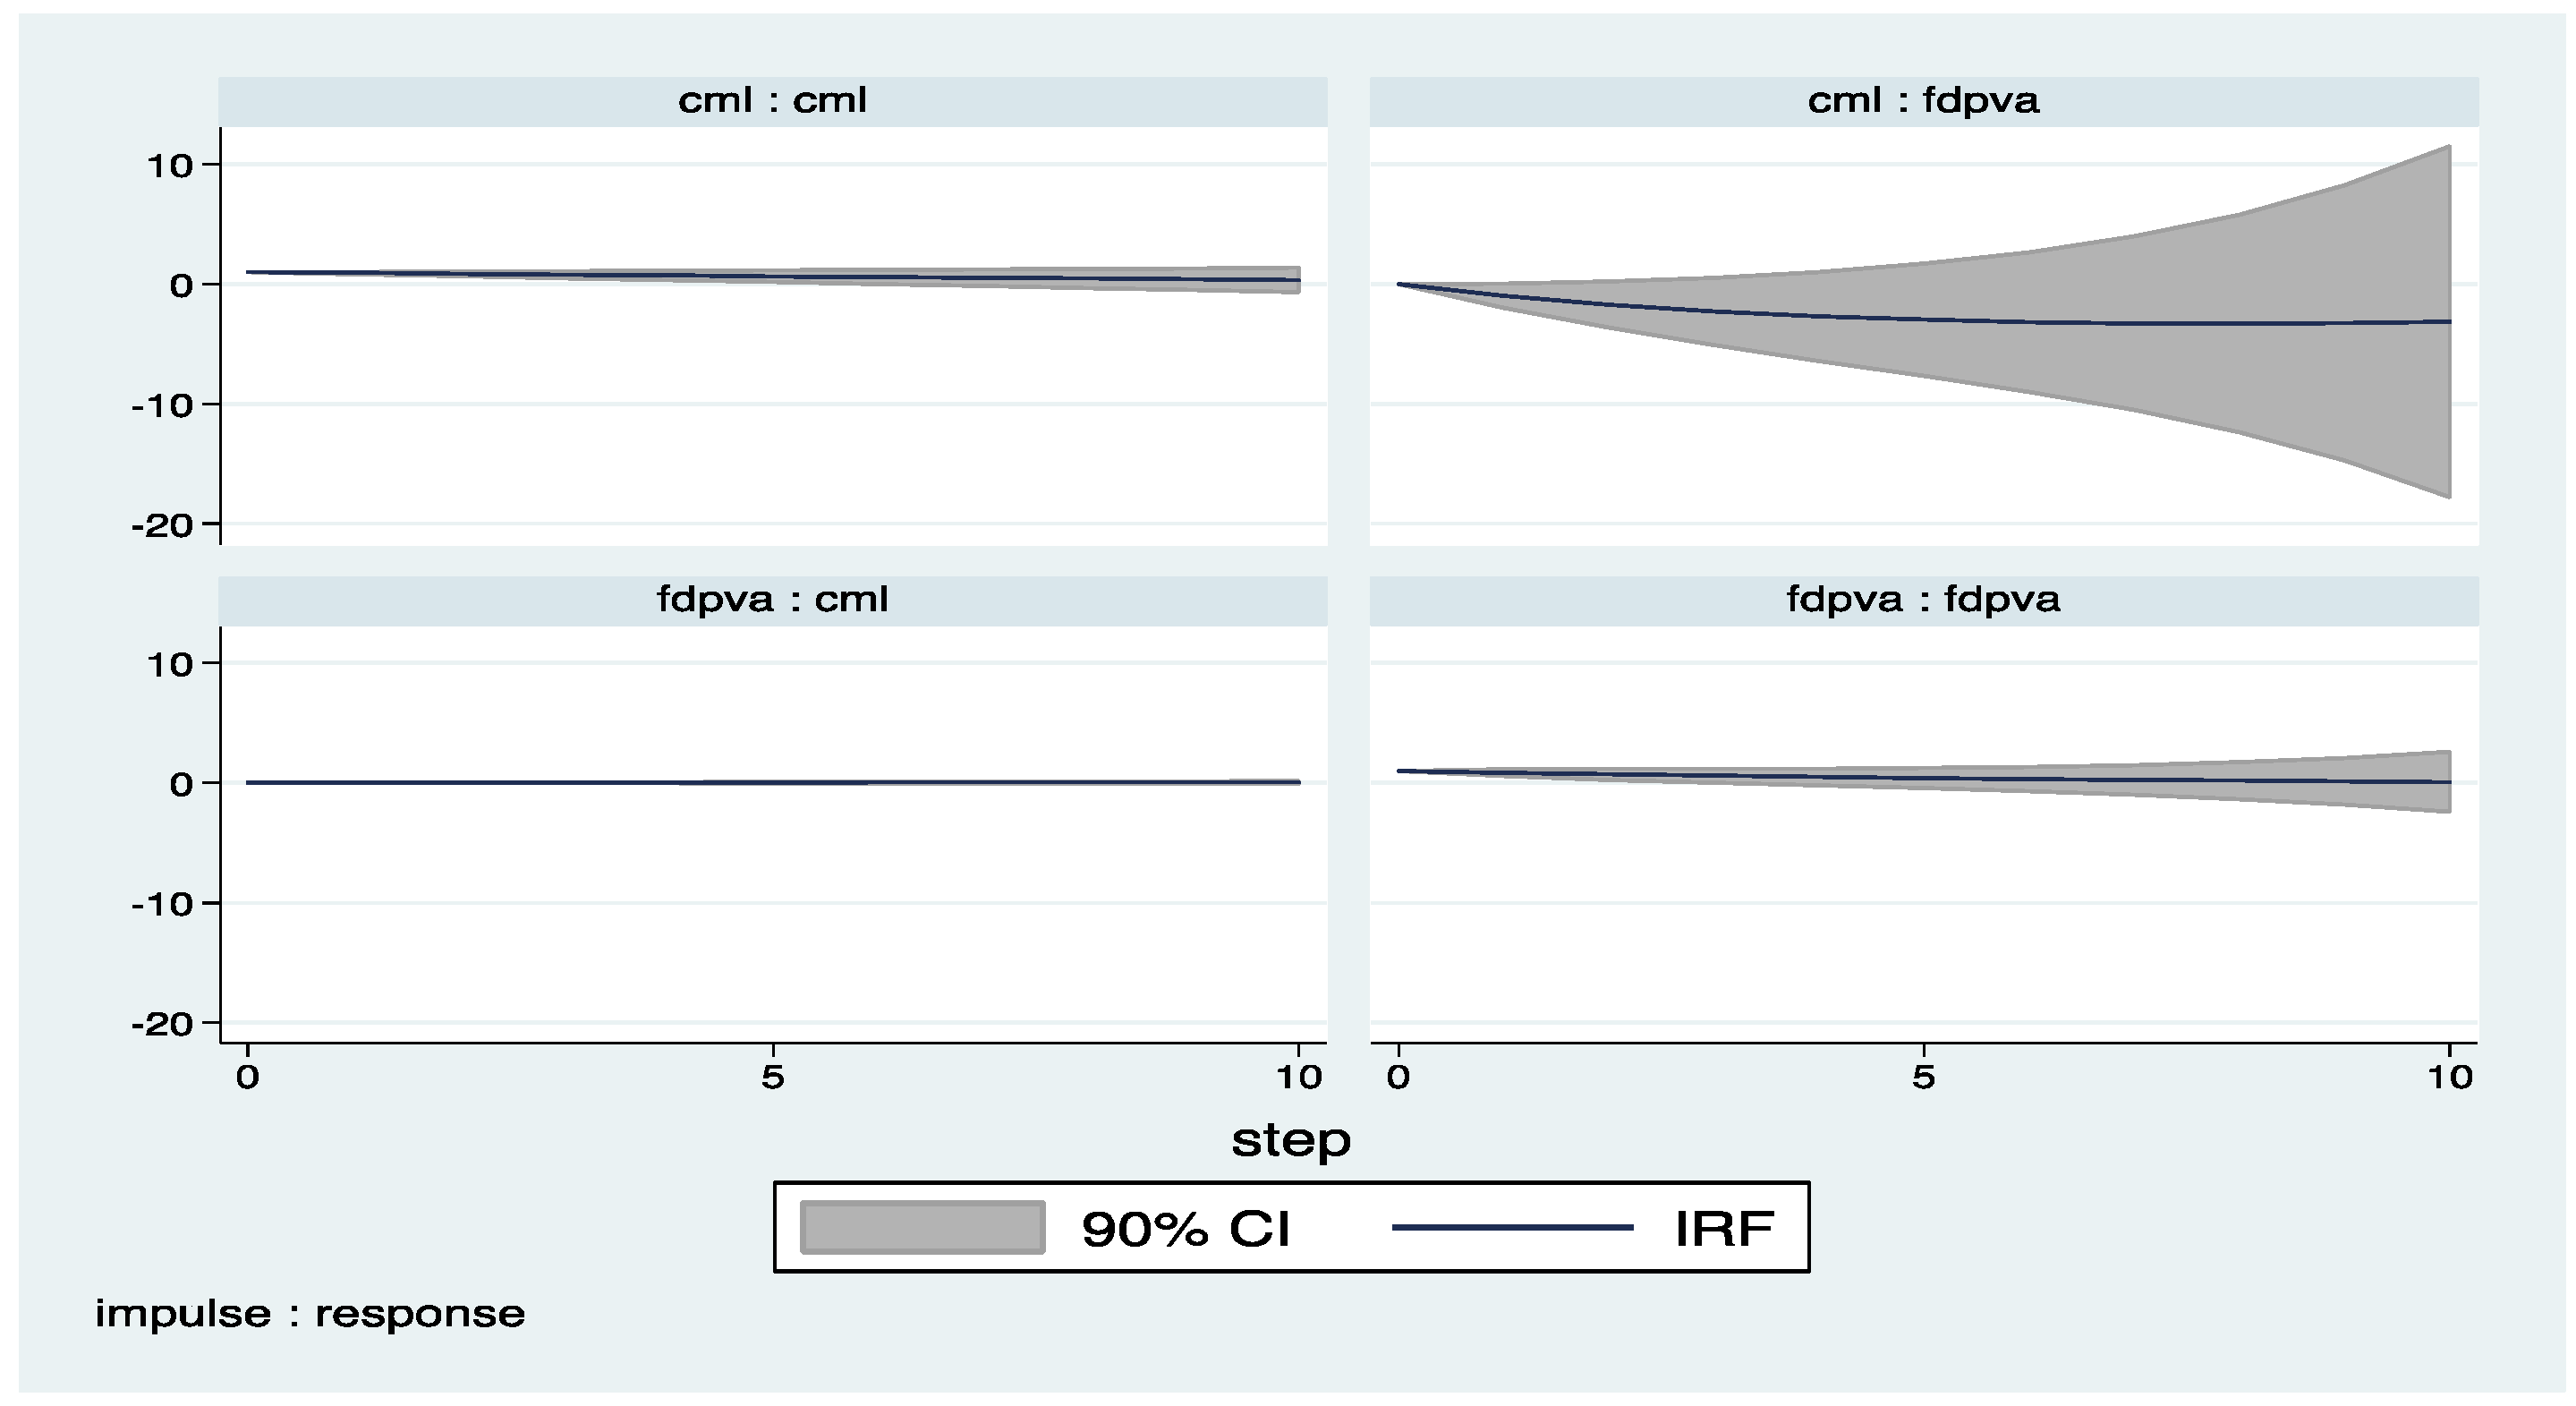
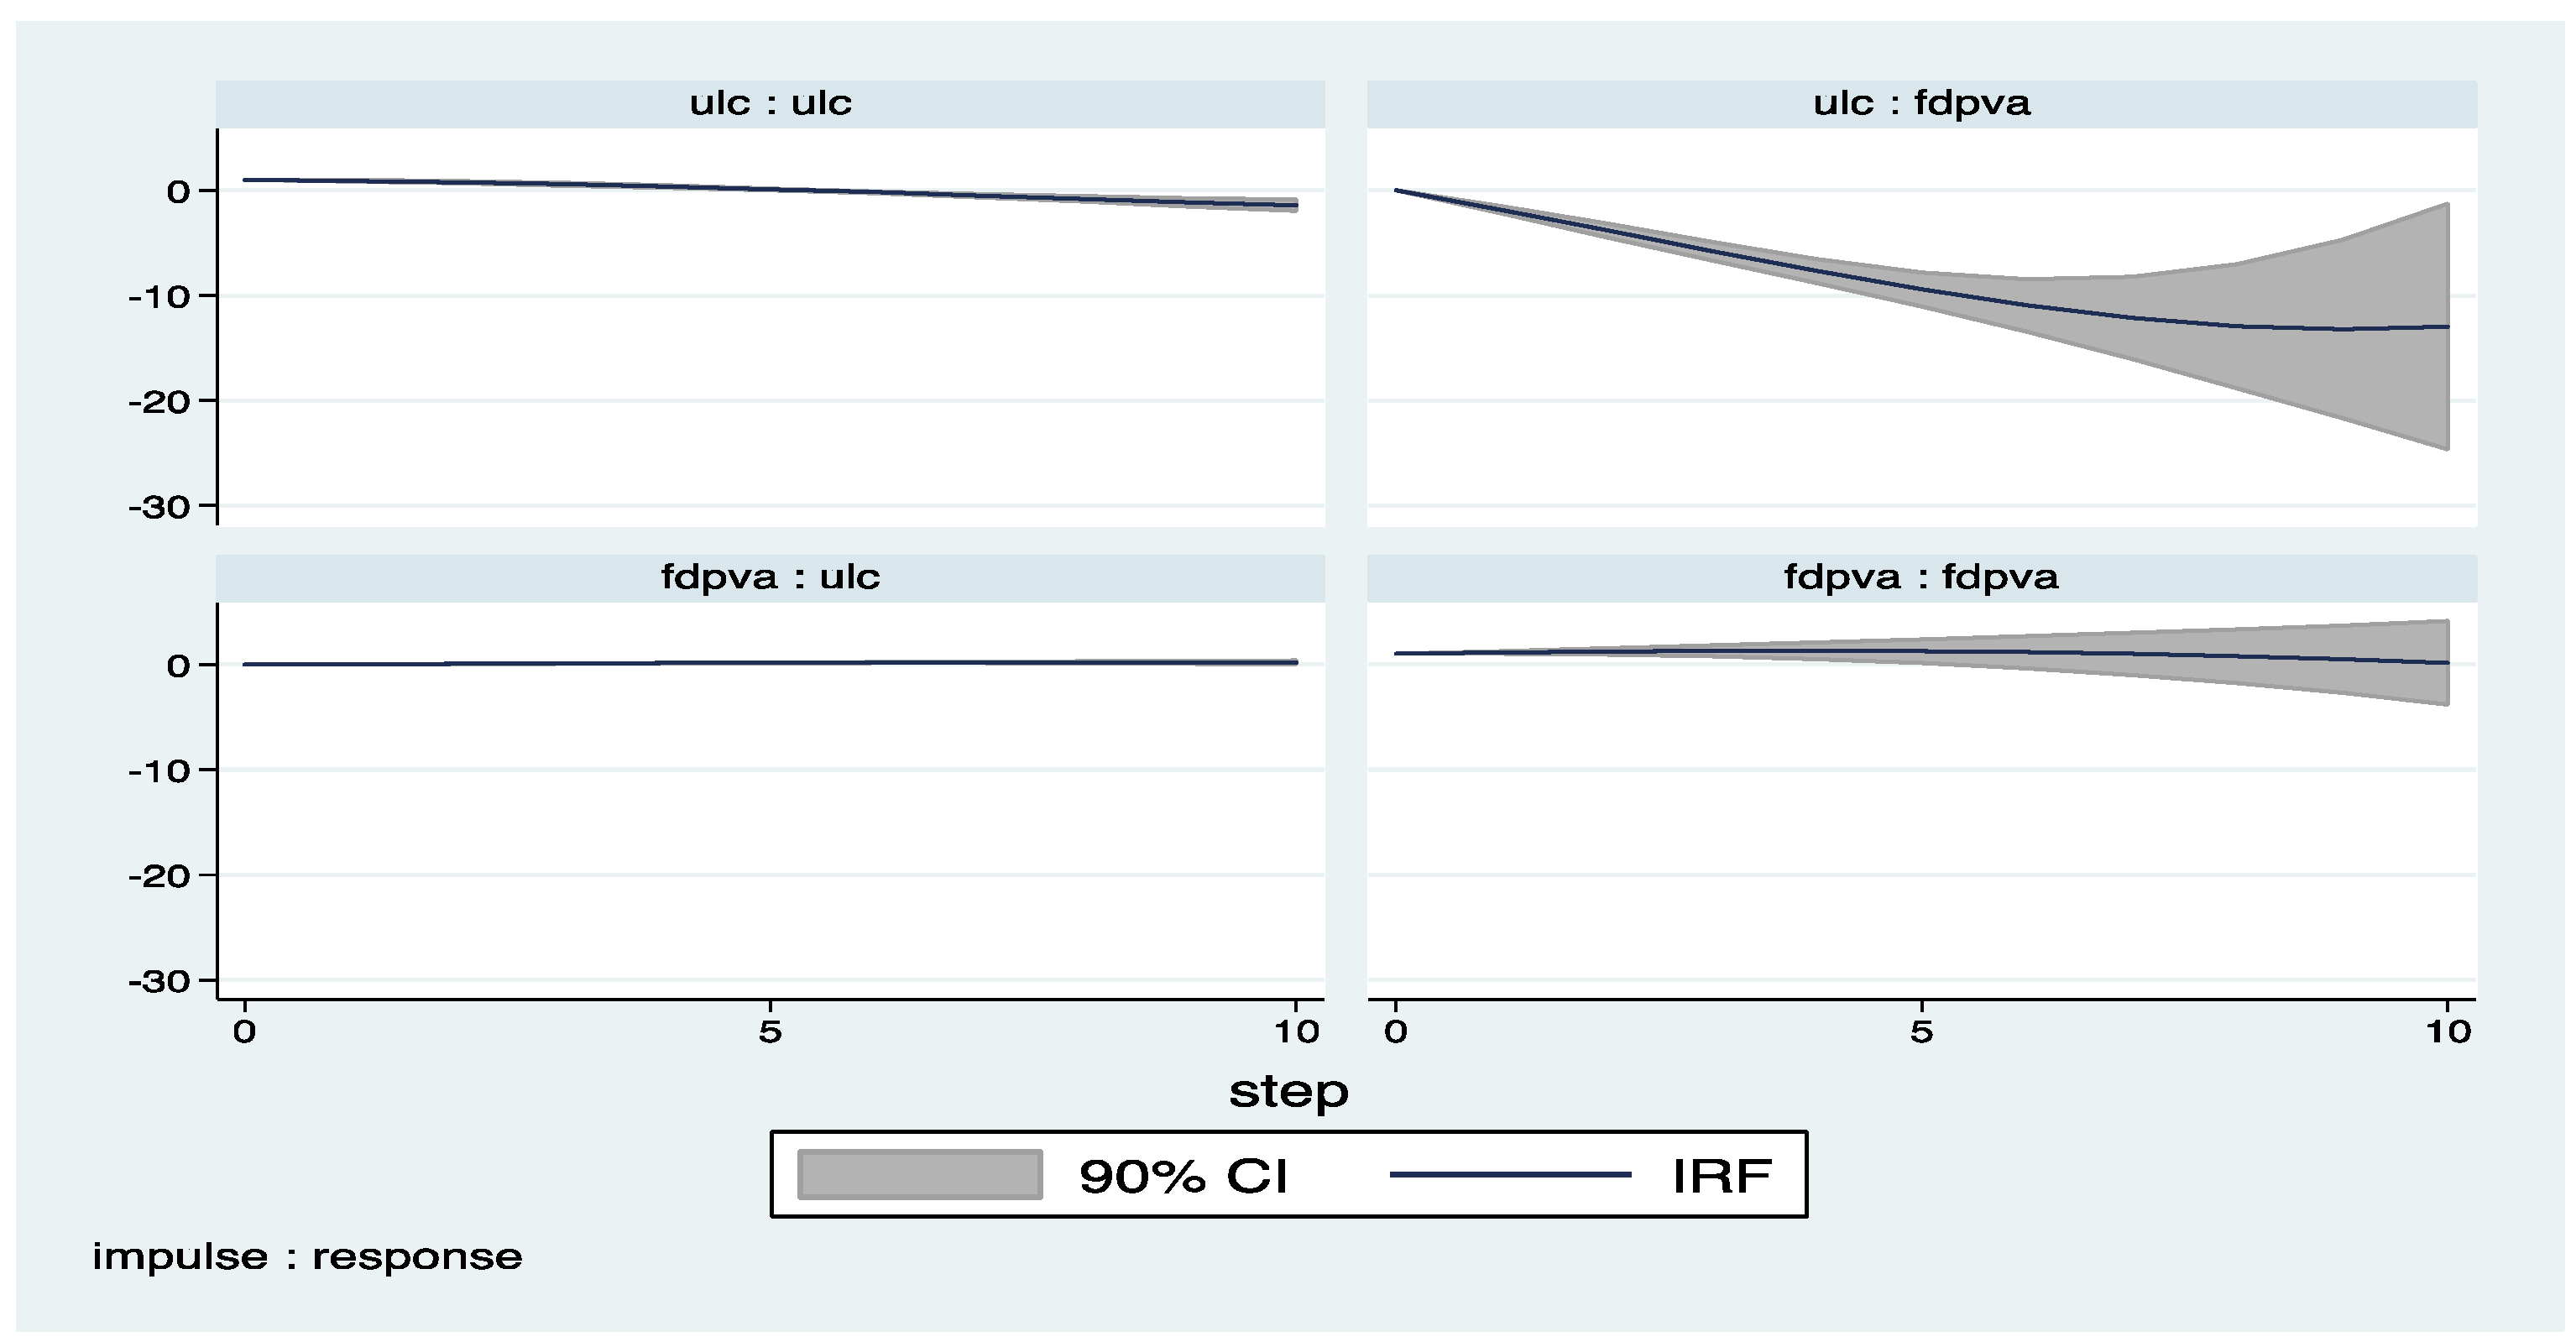
Appendix B (Exluding 2008–2009)
Figure A11.
Impulse Response Functions: FDI and Unit Labor Cost.
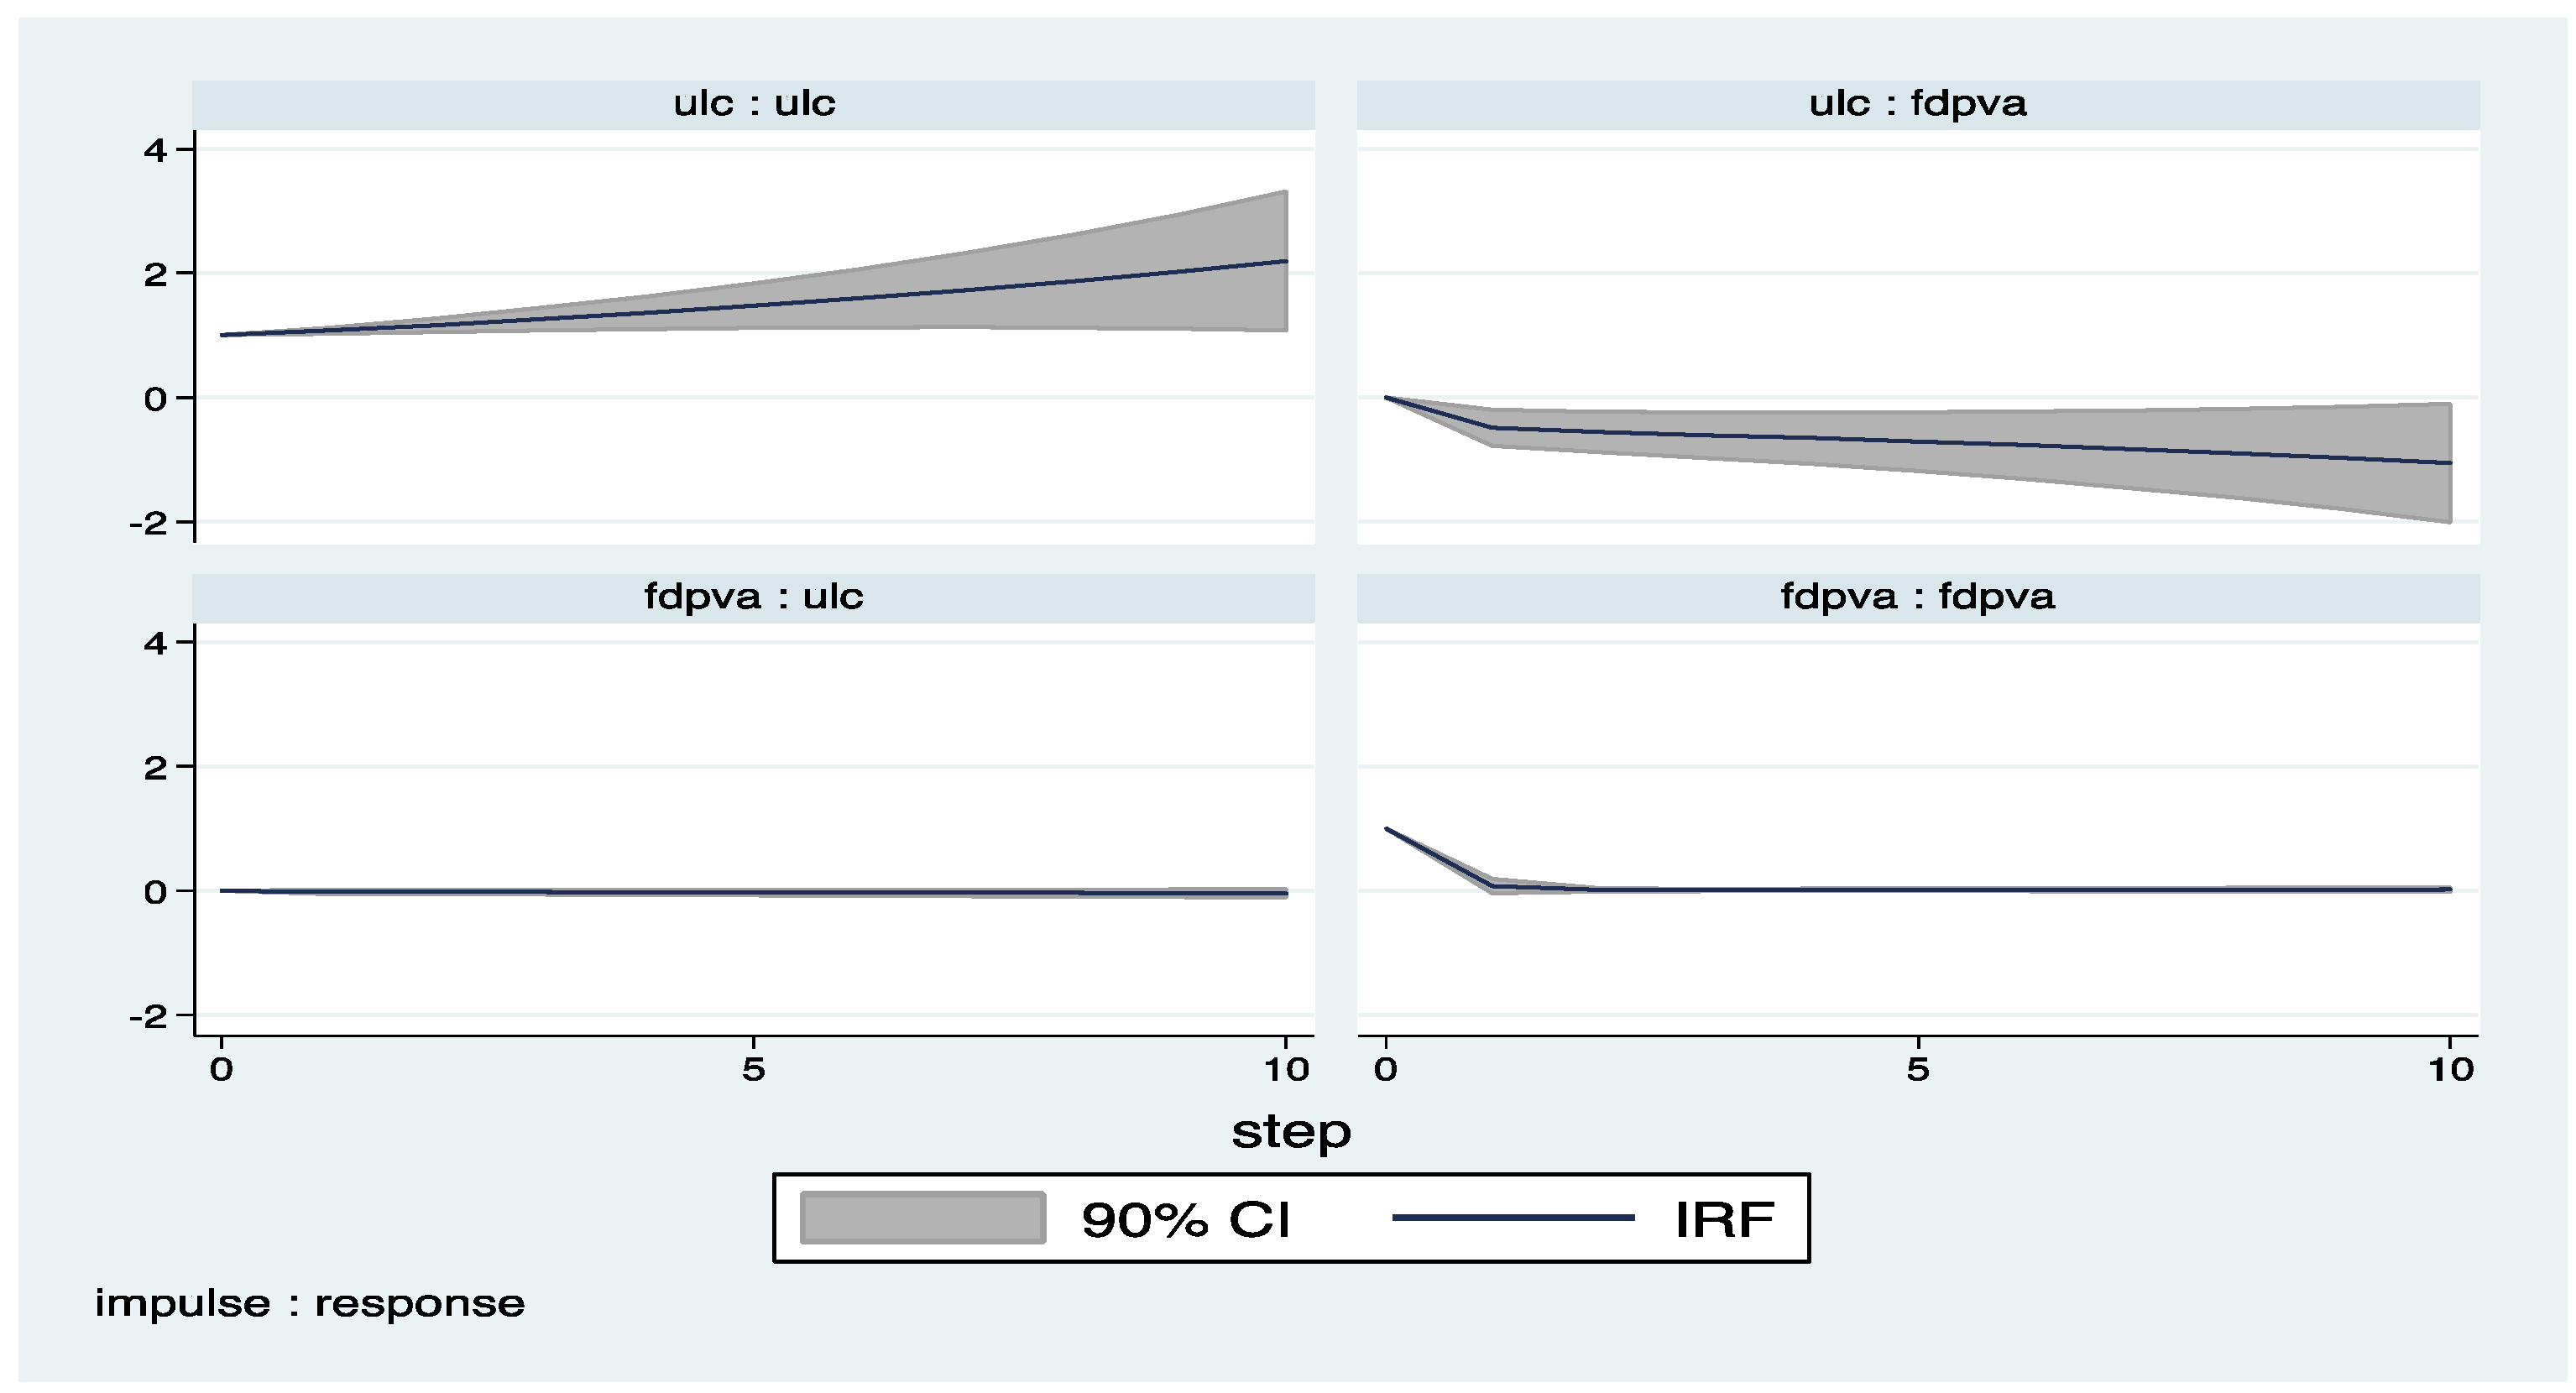
Figure A12.
Impulse Response Functions: FDI and Labor Compensation.
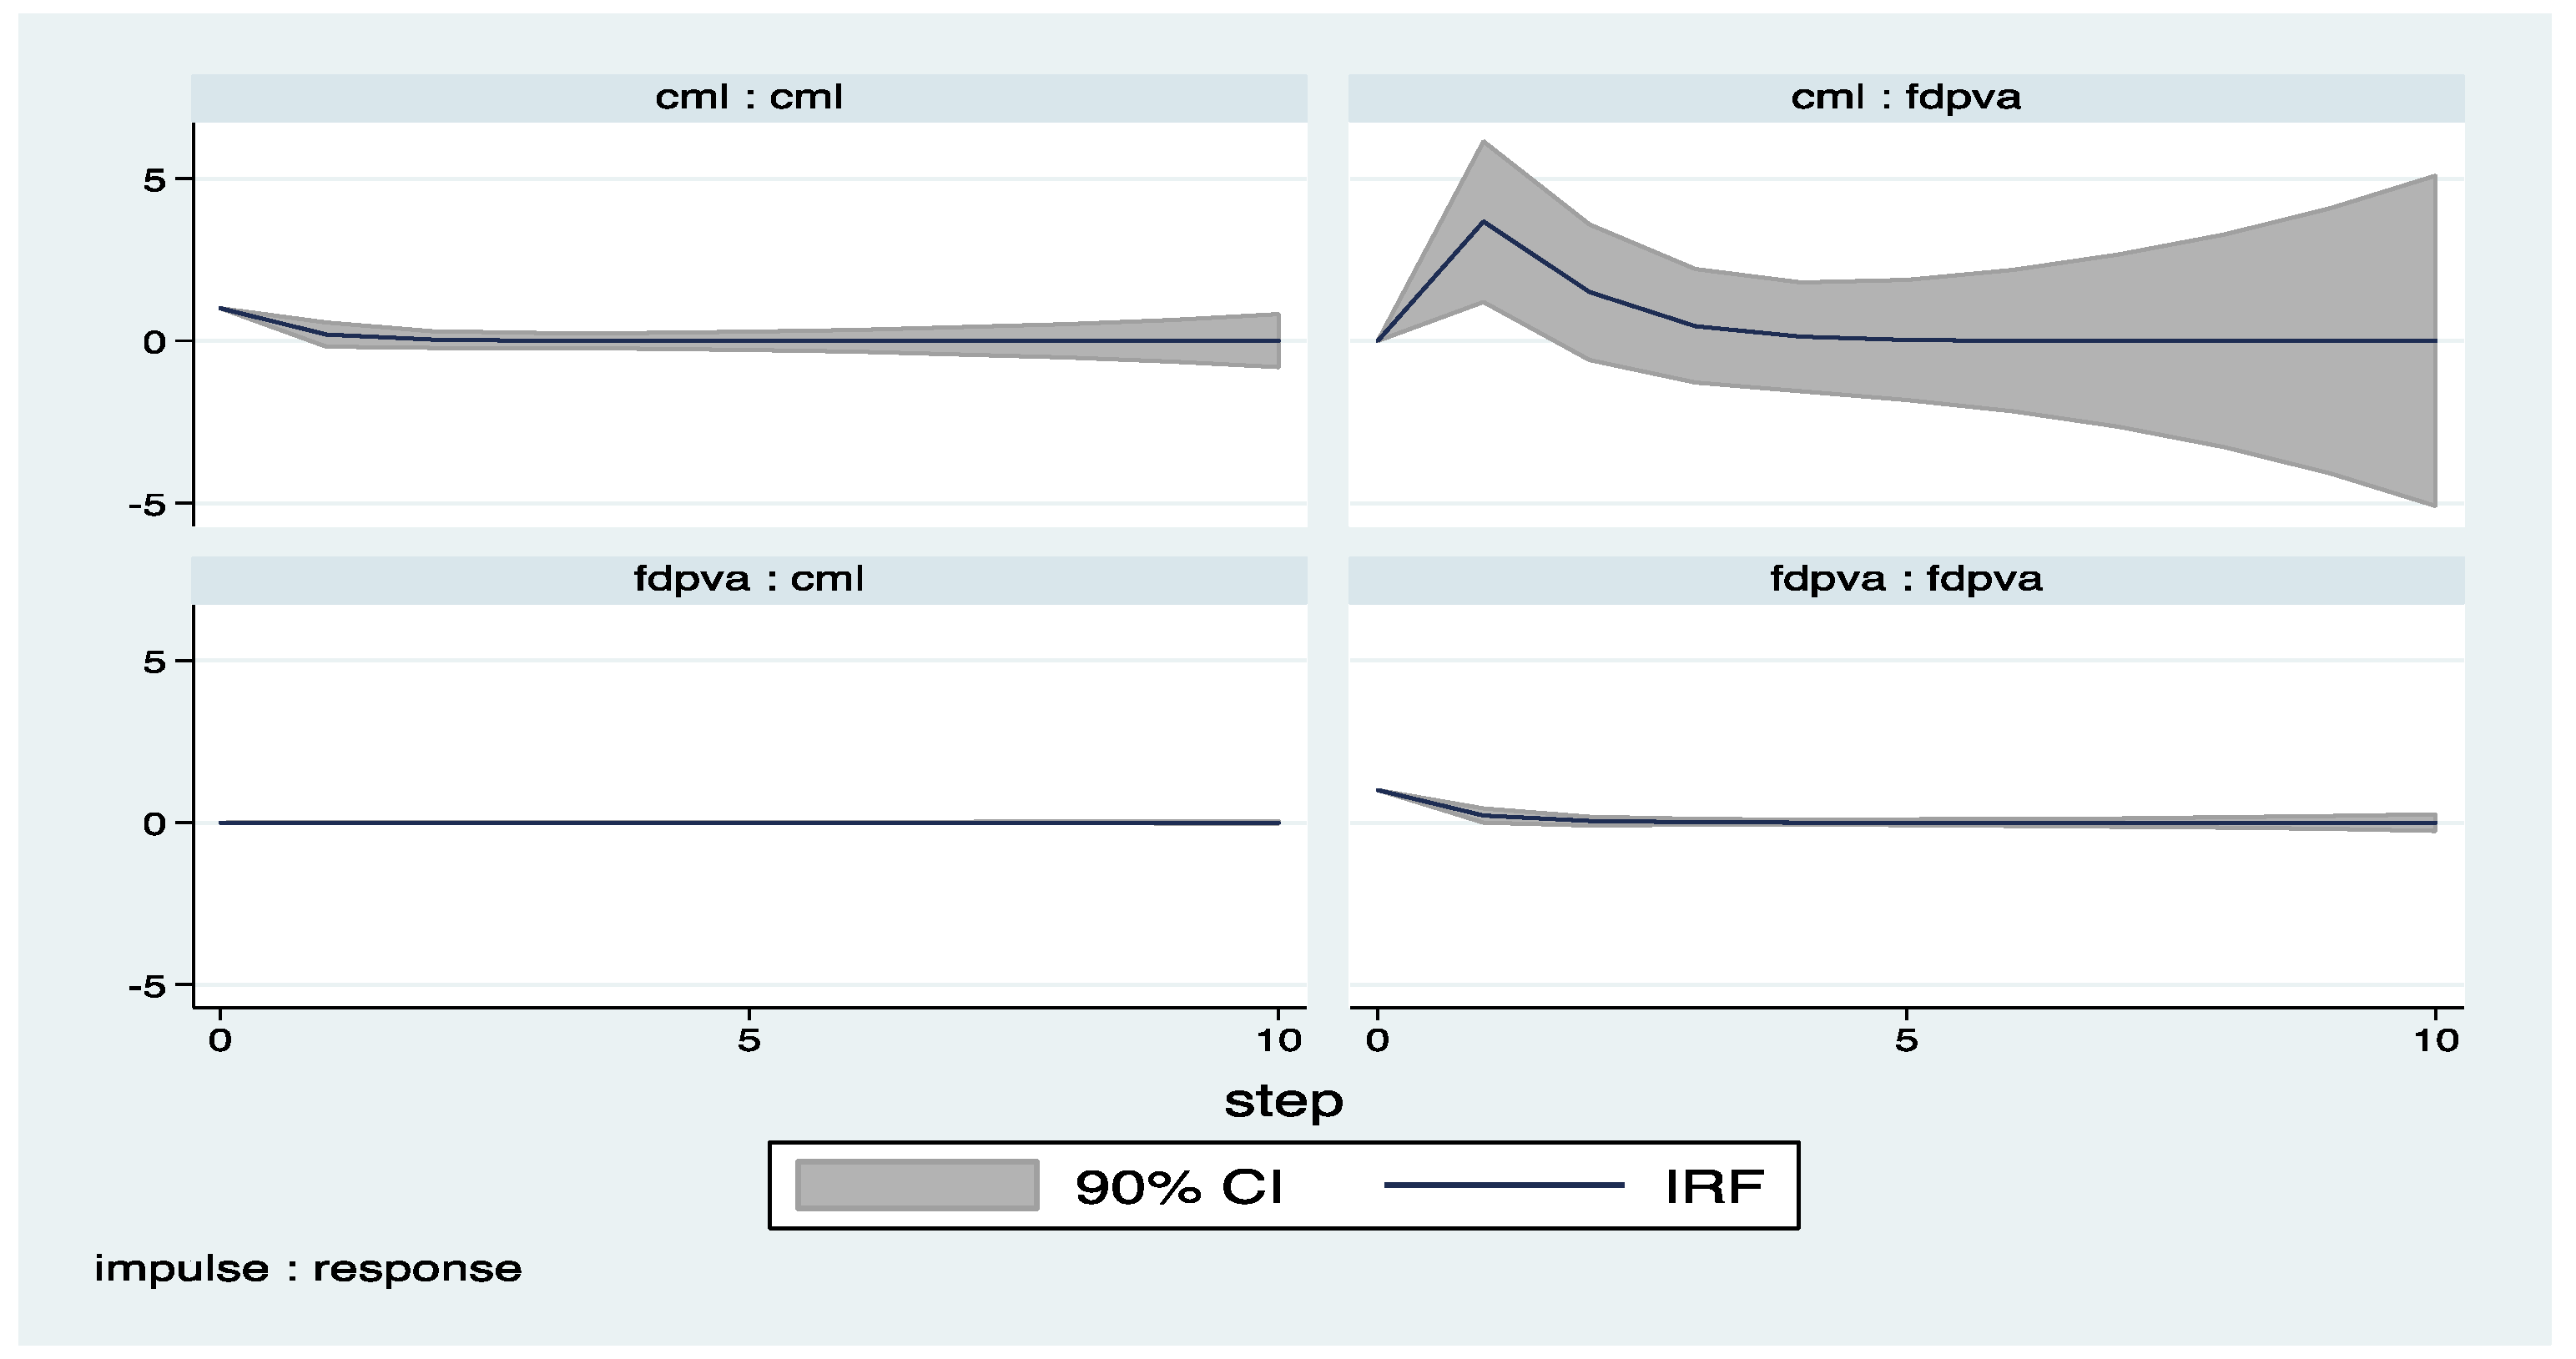
Figure A13.
Manufacturing Impulse Response Functions: FDI and Unit Labor Cost.

Figure A14.
Manufacturing Impulse Response Functions: FDI and Labor Compensation.
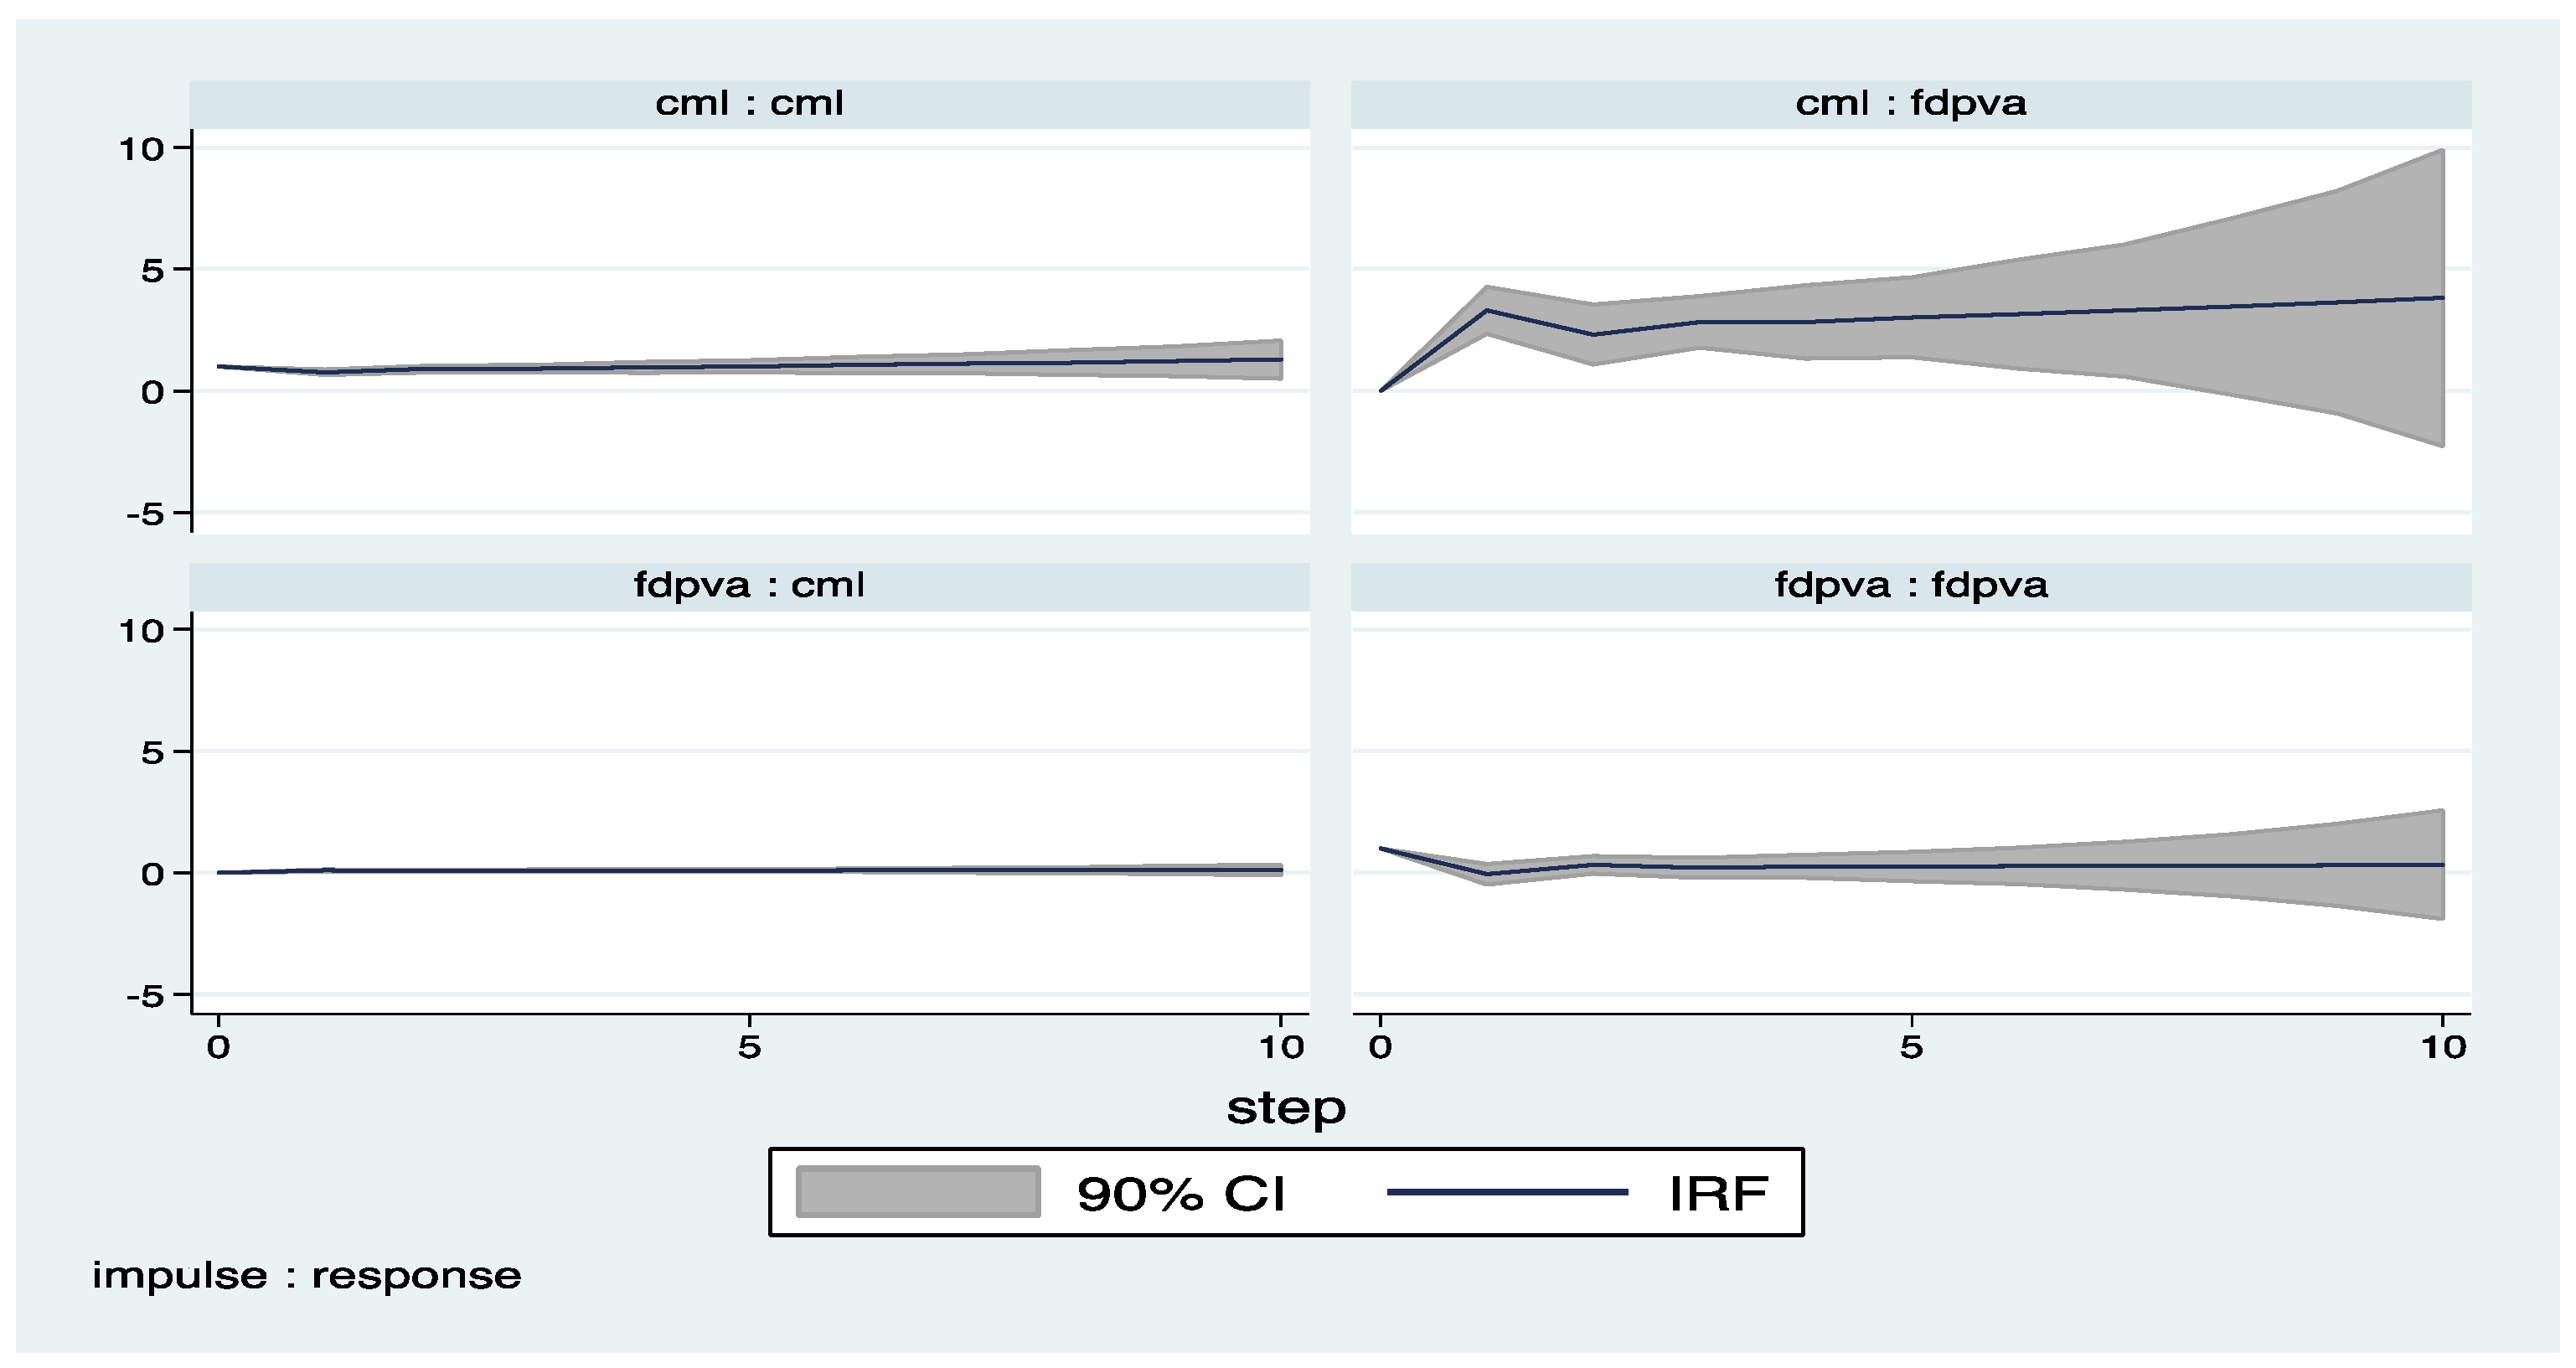
Figure A15.
Finance Impulse Response Functions: FDI and Unit Labor Cost.
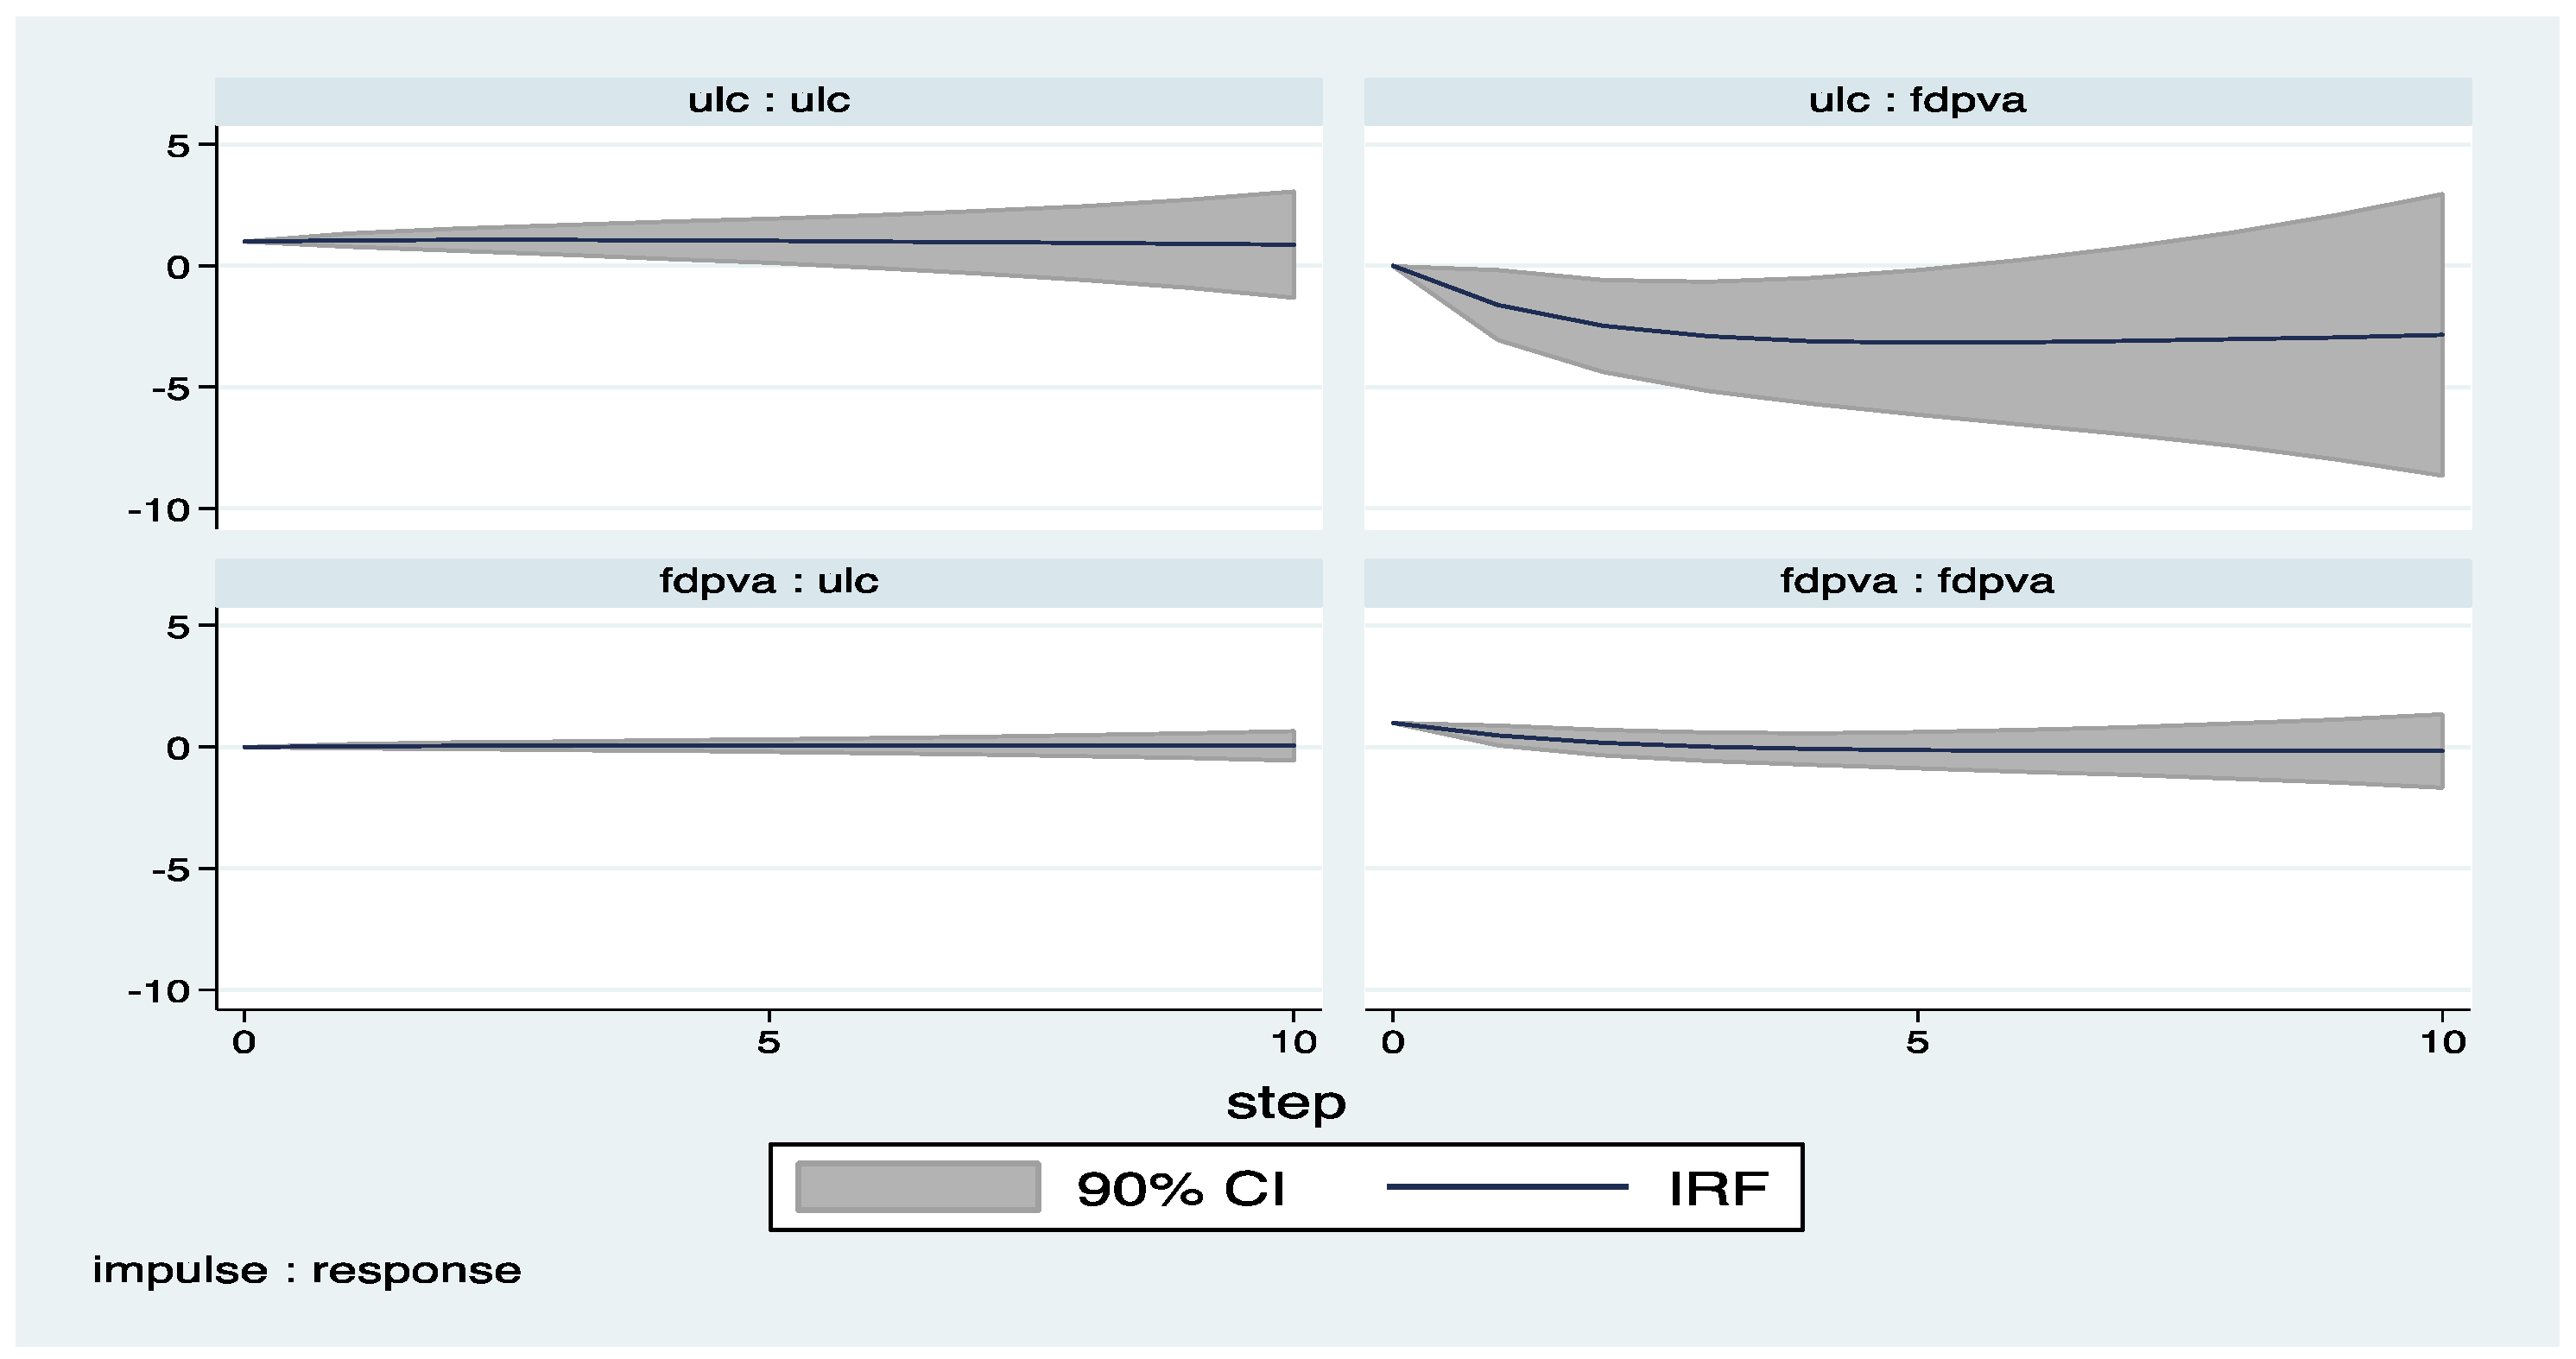
Figure A16.
Finance Impulse Response Functions: FDI and Labor Compensation.

Figure A17.
Construction Impulse Response Functions: FDI and Unit Labor Cost.
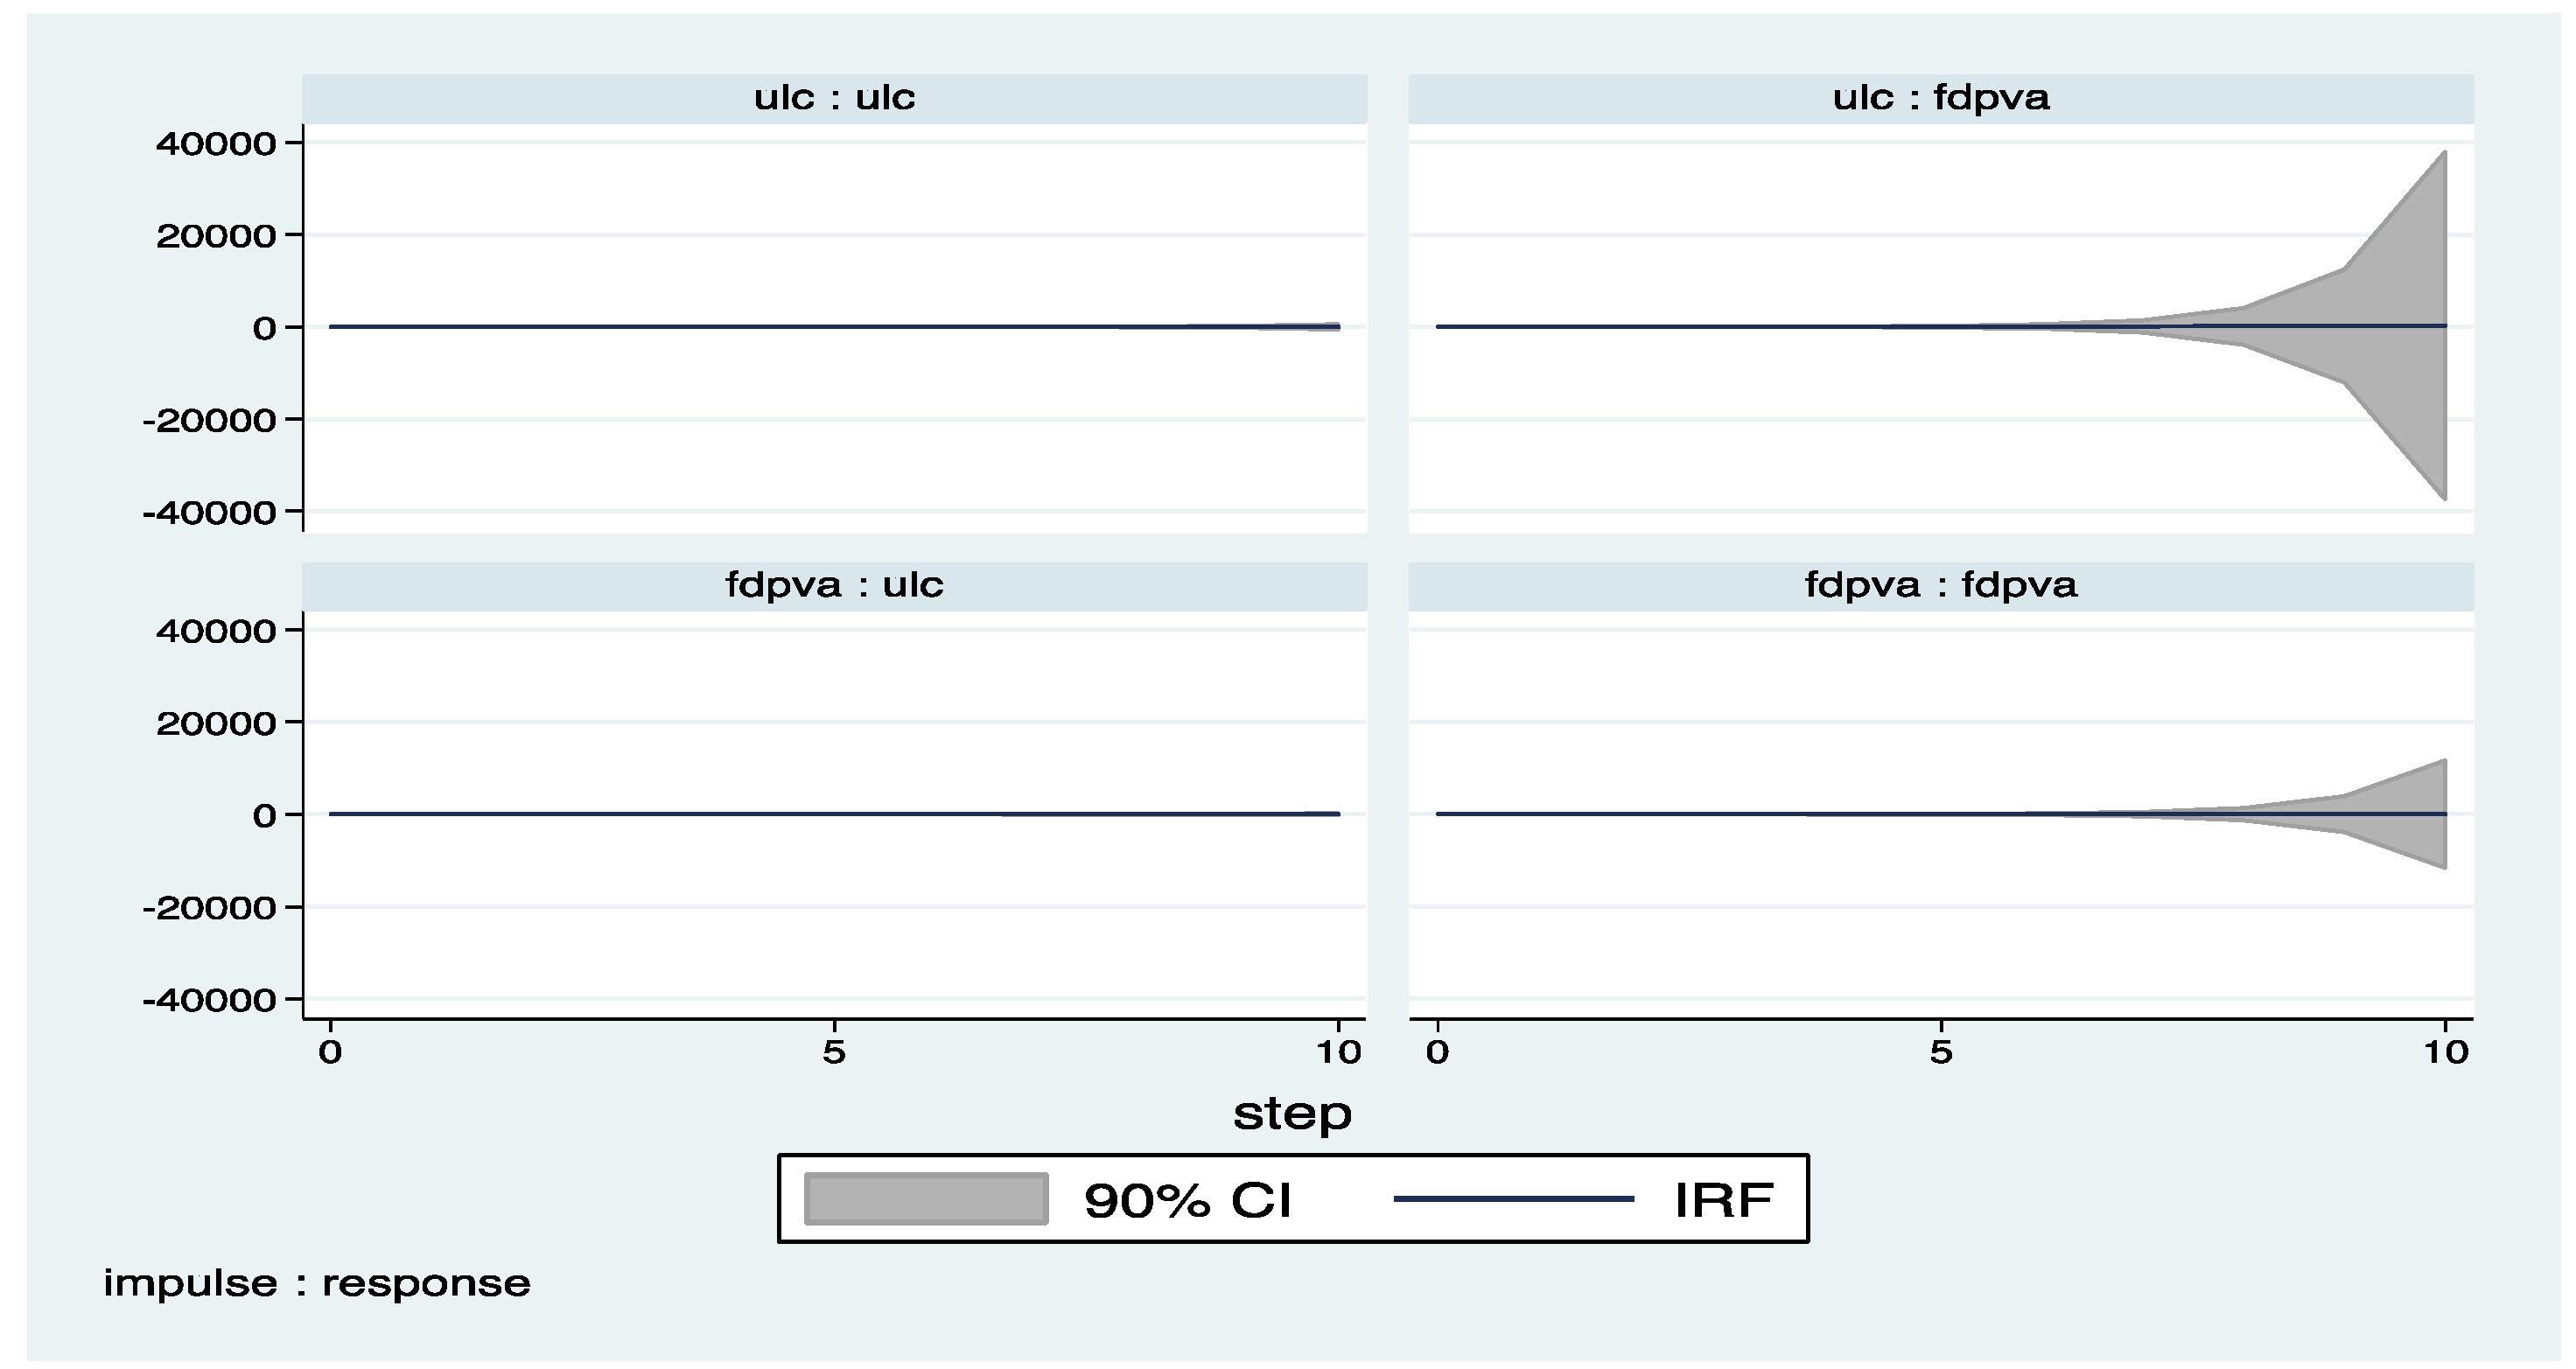
Figure A18.
Construction Impulse Response Functions: FDI and Labor Compensation.
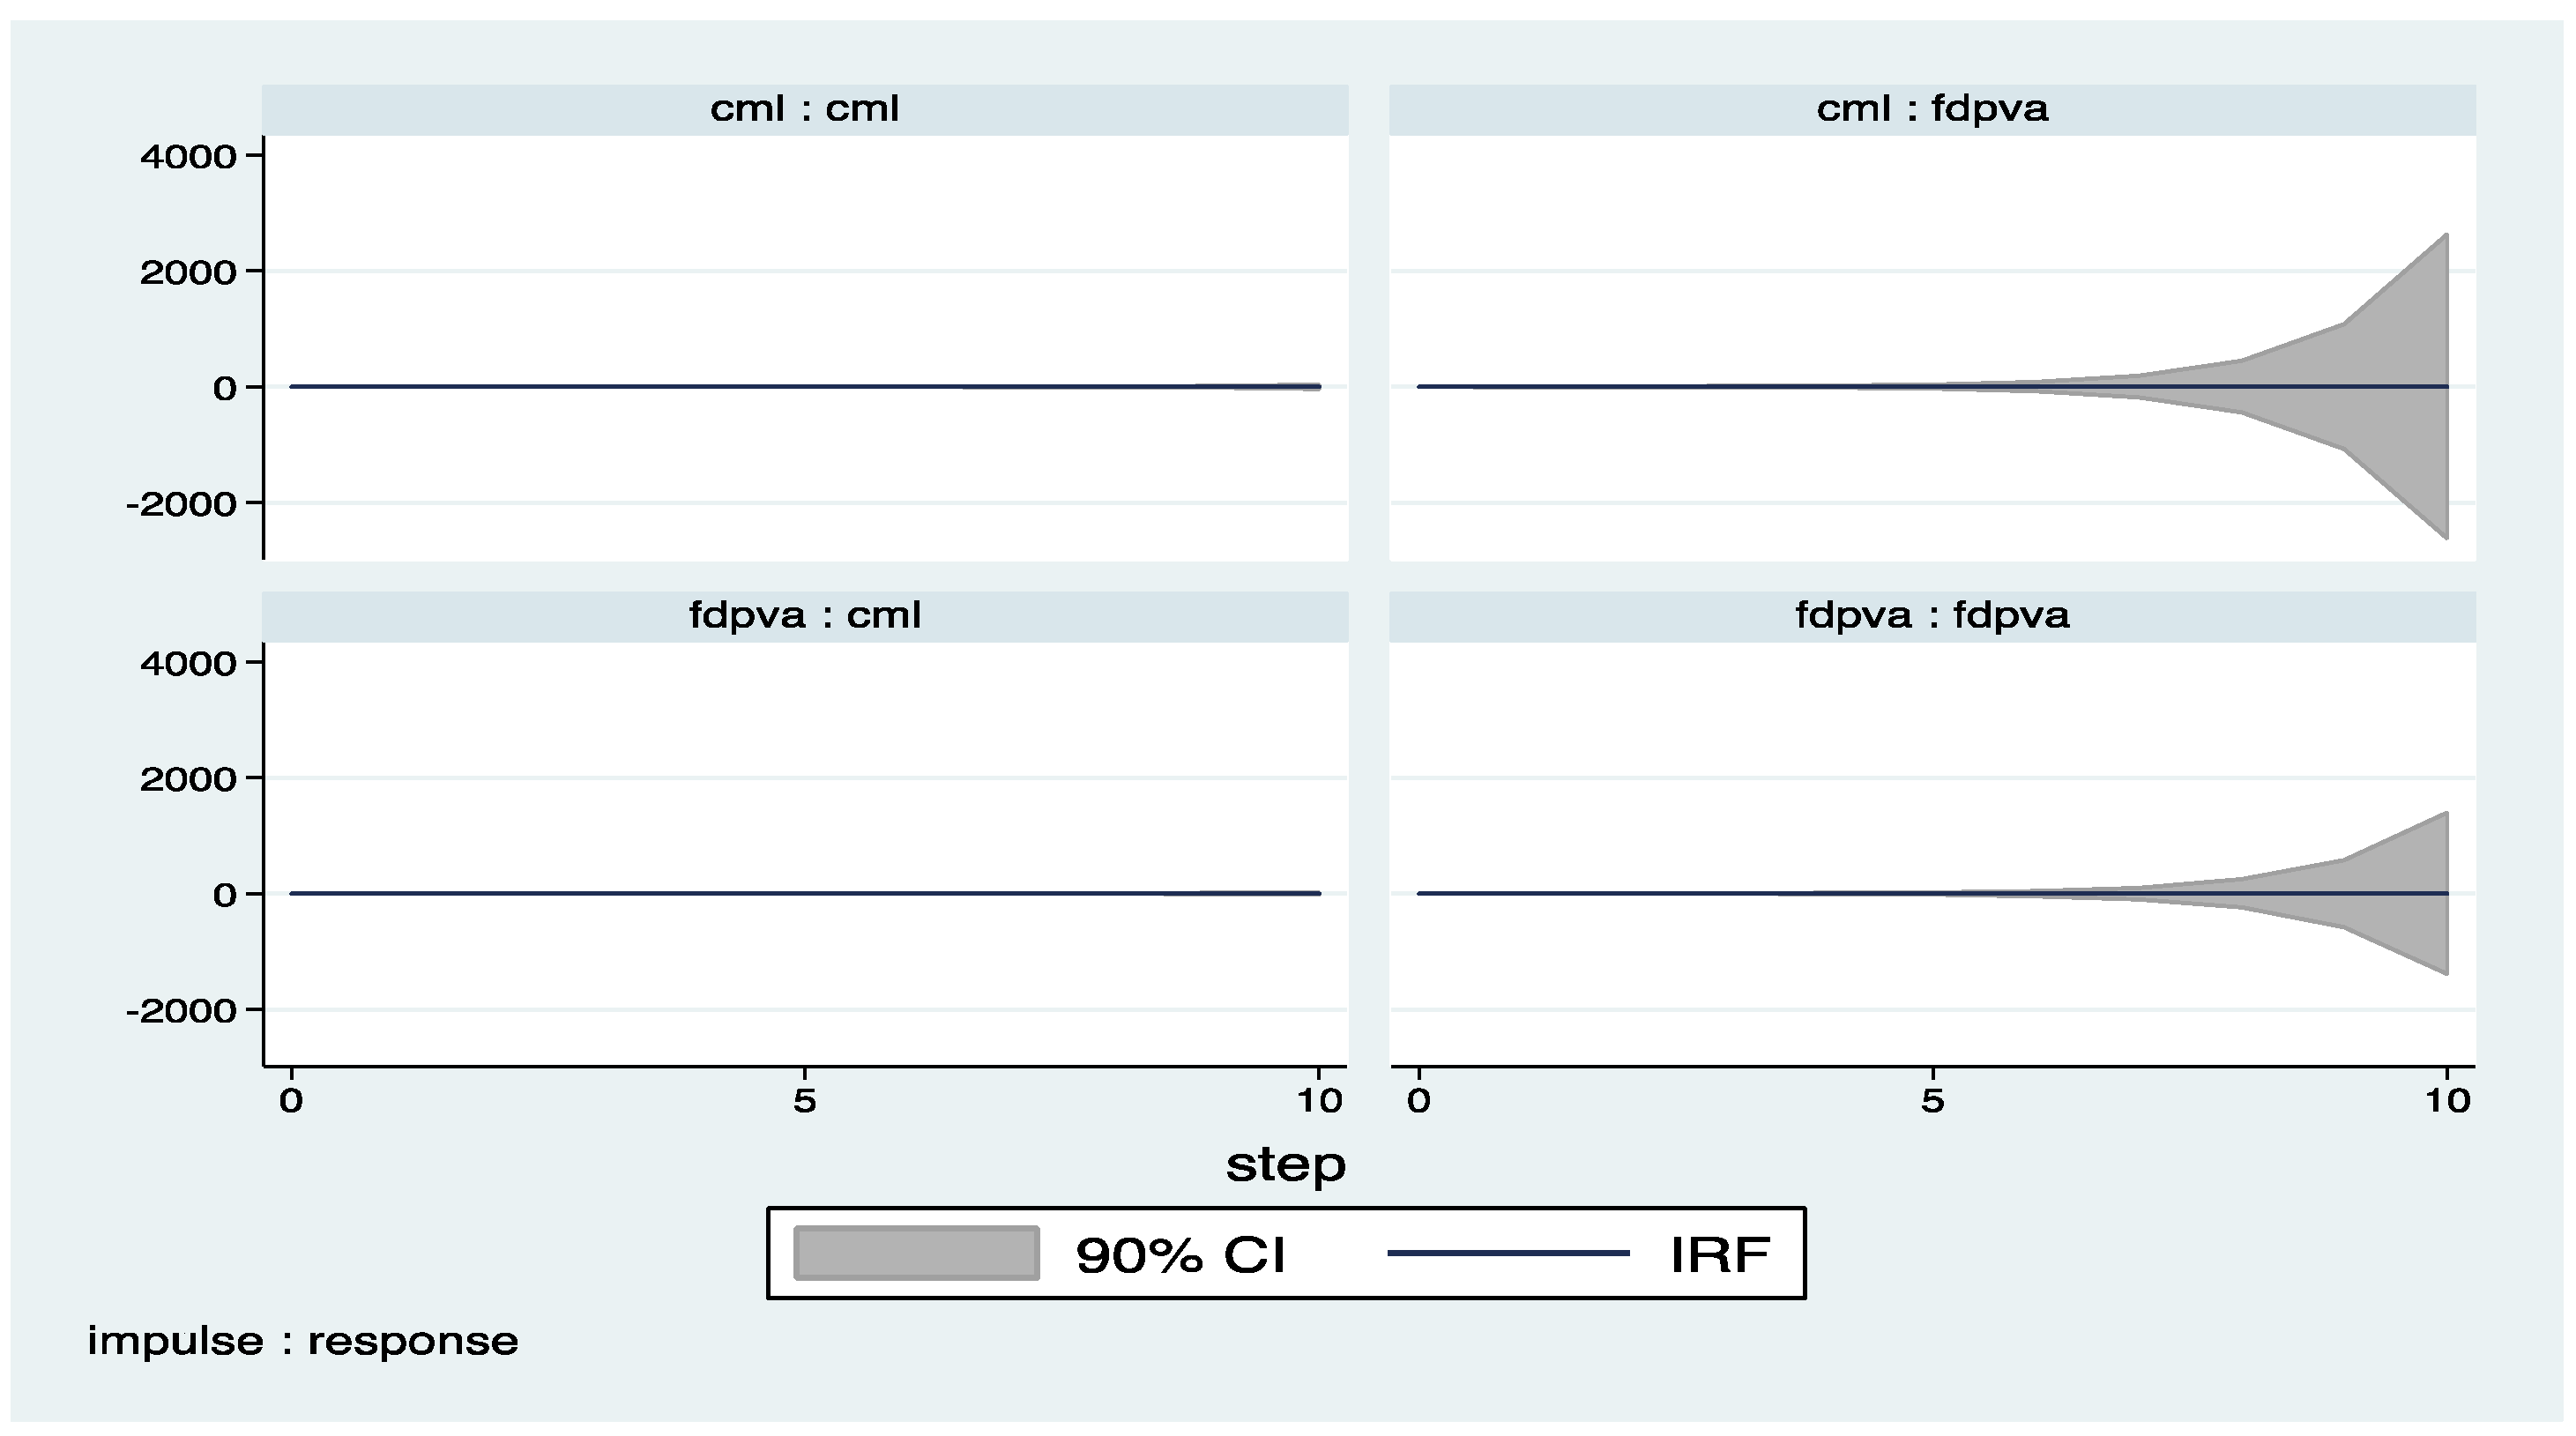
Figure A19.
Industry Impulse Response Functions: FDI and Unit Labor Cost.
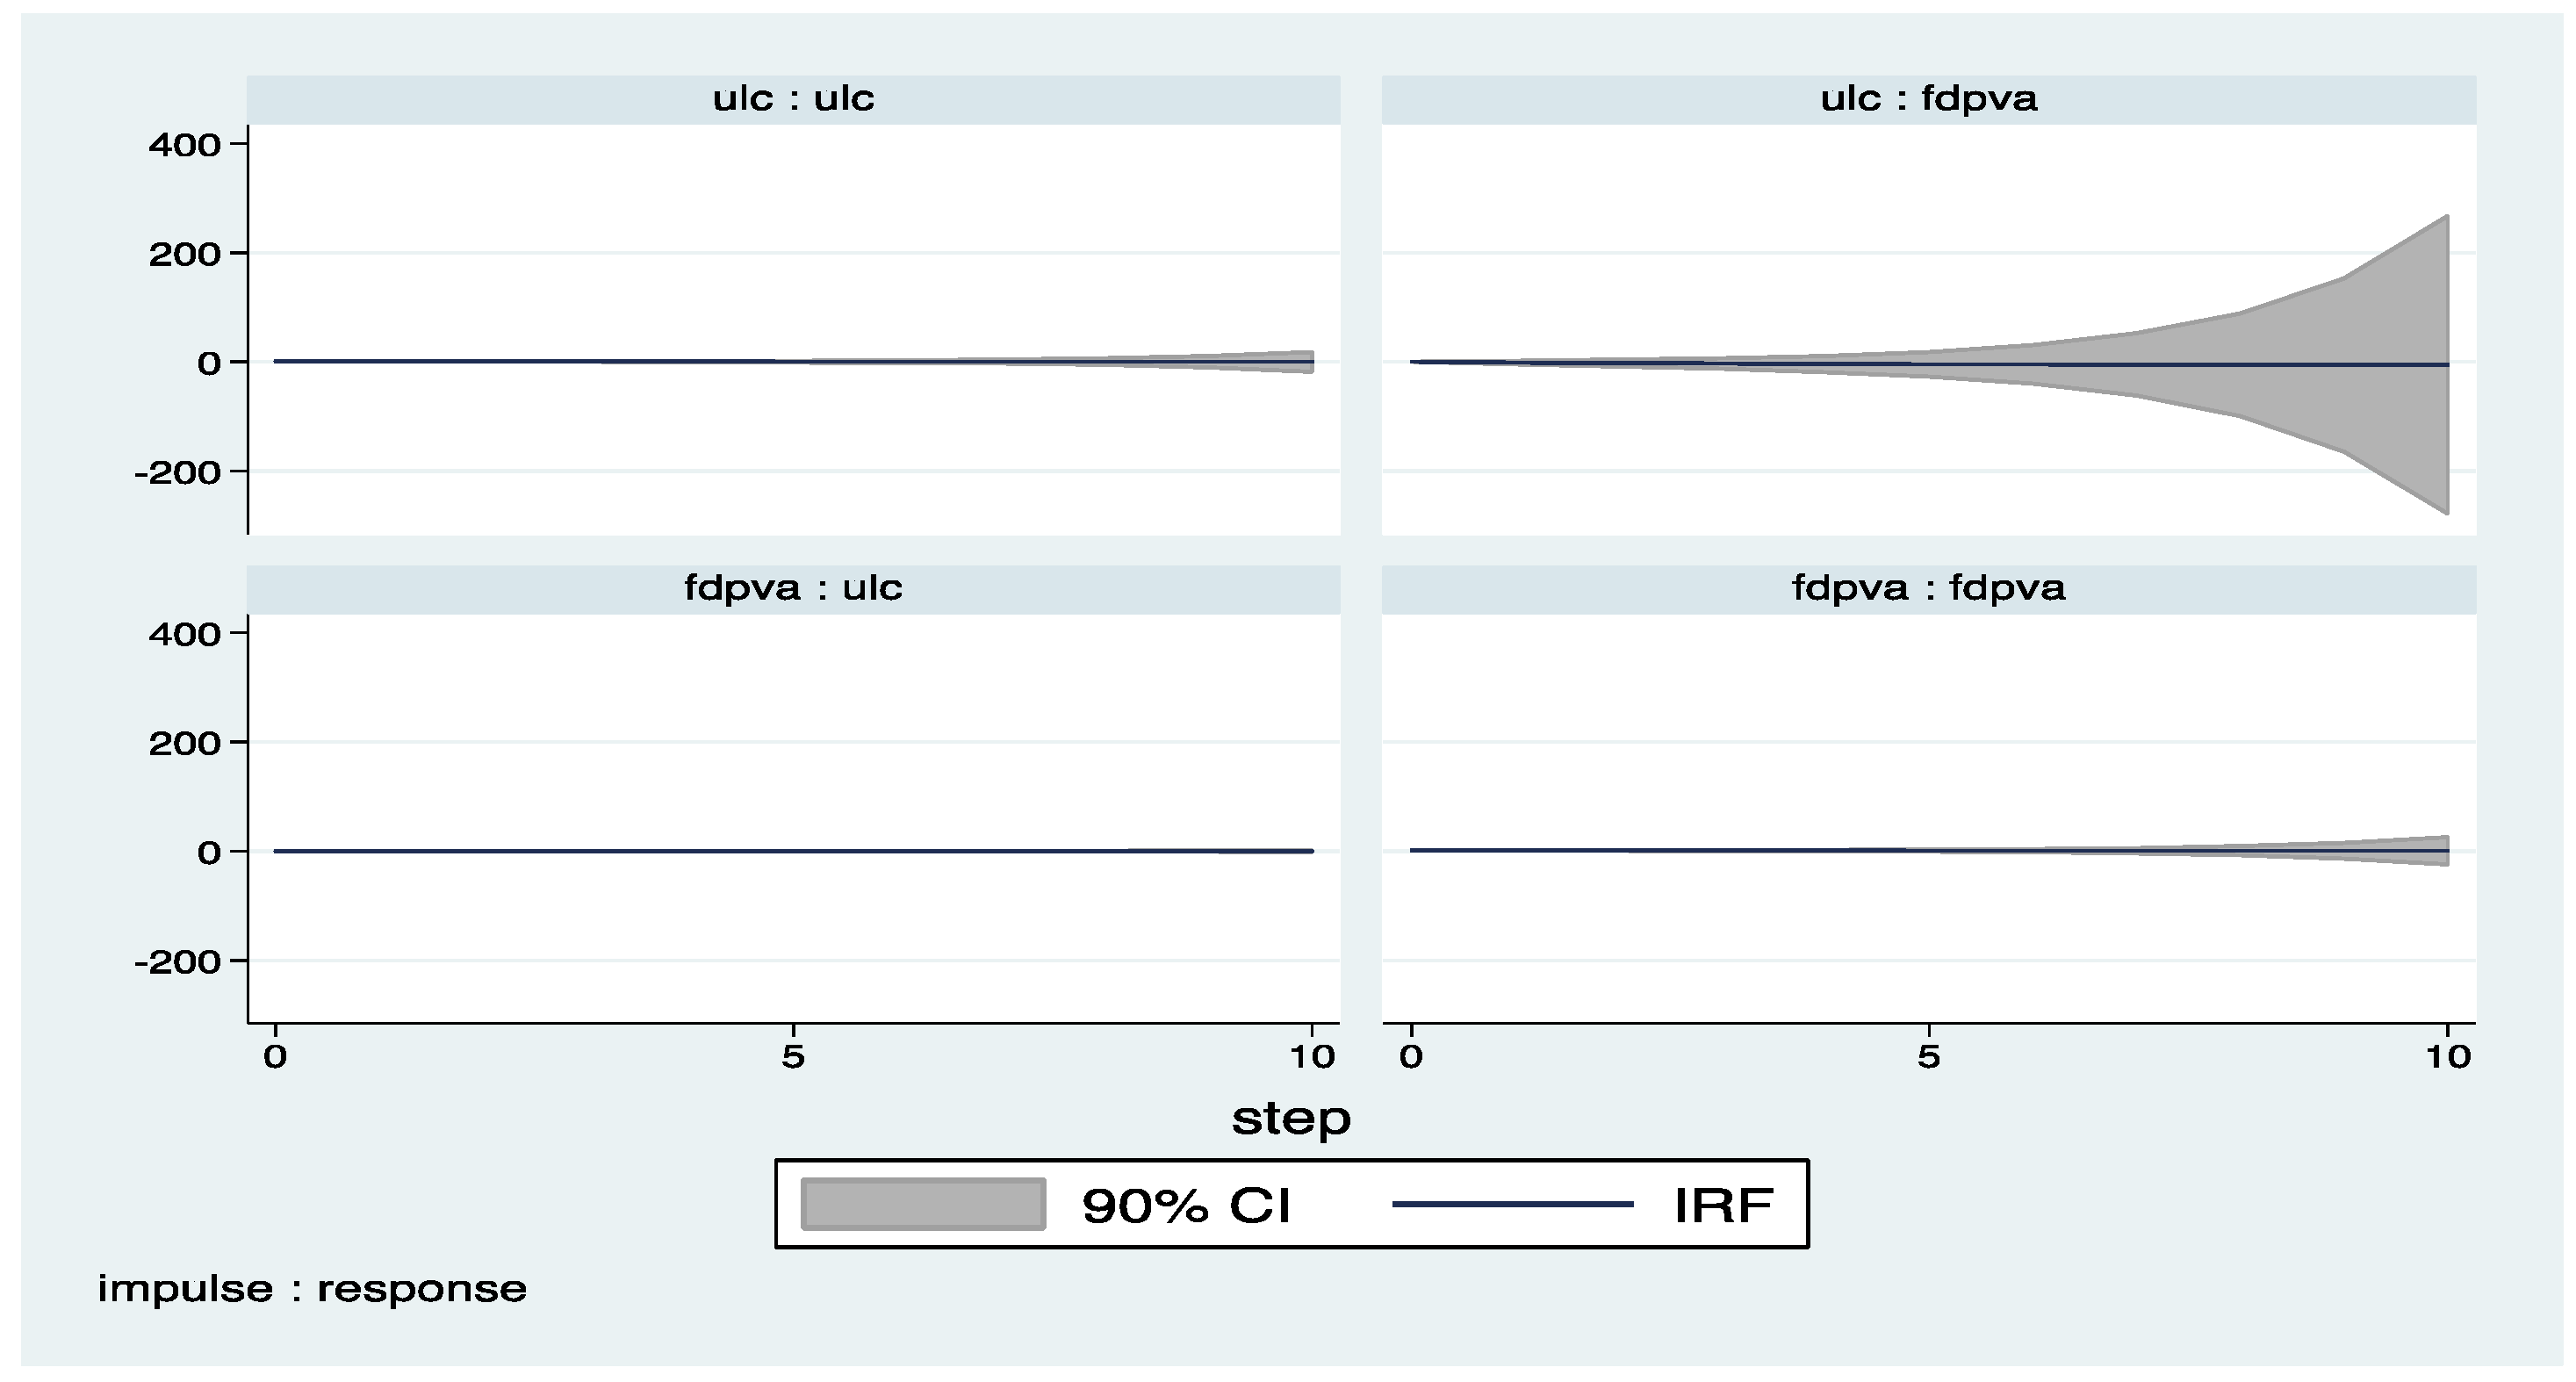
Figure A20.
Industry Impulse Response Functions: FDI and Labor Compensation.

Appendix C. Country Classifications
All: Australia, Austria, Canada, Czech Republic, Denmark, Finland, France, Germany, Hungary, Ireland, Italy, Japan, Korea, Netherlands, New Zealand, Norway, Poland, Portugal, Spain, Sweden, Switzerland, UK and US.
Manufacturing: Austria, Canada, Czech Republic, Denmark, Finland, France, Germany, Hungary, Italy, Korea, Netherlands, Norway, Poland, Sweden, Switzerland, UK and US.
Finance: Australia, Austria, Czech Republic, Denmark, Finland, France, Germany, Korea, Netherlands, New Zealand, Norway, Poland, Portugal, UK and US.
Construction: Australia, Austria, Canada, Czech Republic, Denmark, Finland, France, Germany, Hungary, Italy, Korea, Netherlands, Norway, Poland, Portugal, Sweden, UK and US.
Industry: Australia, Austria, Czech Republic, Denmark, France, Germany, Hungary, Korea, Netherlands, Poland, Portugal, UK and US.
References
- Abrigo, Michael R., and Inesa Love. 2015. Estimation of Panel Vector Autoregression in Stata: A Package of Programs. Available online: http://paneldataconference2015.ceu.hu/Program/Michael-Abrigo.pdf (accessed on 4 July 2017).
- Aitken, Brian J., Ann E. Harrison, and Robert E. Lipsey. 1996. Wages and foreign ownership: A comparative study of Mexico, Venezuela, and United States. Journal of International Economics 40: 345–71. [Google Scholar] [CrossRef]
- Almeida, Rita. 2007. The labor market effects of foreign owned firms. Journal of International Economics 72: 75–96. [Google Scholar] [CrossRef]
- Arellano, Manuel, and Stephen R. Bond. 1991. Some tests of specification for panel data: Monte Carlo evidence and an application to employment equations. Review of Economic Studies 58: 277–97. [Google Scholar] [CrossRef]
- Arellano, Manuel, and Olympia Bover. 1995. Another look at the instrumental variables estimation of error-components models. Journal of Econometrics 68: 29–51. [Google Scholar] [CrossRef]
- Baldwin, Robert E. 1995. The Effects of Trade and Foreign Direct Investment on Employment and Relative Wages. NBER Working Paper 5037. Cambridge: National Bureau of Economic Research. [Google Scholar]
- Barry, Frank, Holger Görg, and Eric Strobl. 2005. Foreign direct investment and wages in domestic firms: Productivity spillovers vs. labor market crowding-out. International Journal of the Economics of Business 12: 67–84. [Google Scholar] [CrossRef]
- Blundell, Richard, and Stephen Bond. 1998. Initial conditions and moment restrictions in dynamic panel data models. Journal of Econometrics 87: 115–43. [Google Scholar] [CrossRef]
- Burke, James, and Gerald Epstein. 2001. Threat effects and the internationalization of production. Political Economy Research Institute Working Papers, No. 15. Available online: http://scholarworks.umass.edu/cgi/viewcontent.cgi?article=1009&context=peri_workingpapers (accessed on 16 September 2017).
- Campos, Nauro, and Yuko Kinoshita. 2003. Why Does FDI Go Where it Goes? New Evidence from the Transitional Economies. CEPR Discussion Paper No. 3984. Londra: Centre for Economic Policy Research. Available online: http://www.cepr.org/pubs/dps/DP3984.asp (accessed on 24 November 2016).
- Casu, Barbara, and Claudia Girardone. 2009. Testing the relationship between competition and efficiency in banking: A panel data analysis. Economics Letters 105: 134–37. [Google Scholar] [CrossRef]
- Chakrabarti, Avik. 2001. The Determinants of Foreign Direct Investment: Sensitivity Analyses of Cross-Country Regressions. Kyklos 54: 89–114. [Google Scholar] [CrossRef]
- Conyon, Martin, Sourafel Girma, Steve Thompson, and Peter Wrigh. 2002. The impact of foreign acquisition on wages and productivity in the U.K. Journal of Industrial Economics 50: 85–102. [Google Scholar] [CrossRef]
- Cragg, Michael Ion, and Mario Epelbaum. 1995. Why has wage dispersion grown in Mexico? Is it the incidence of reforms or the growing demand for skills? Journal of Development Economics 51: 99–116. [Google Scholar] [CrossRef]
- Crotty, James, Gerald Epstein, and Patricia Kelly. 1998. Multinational corporations in the neoliberal regime. In Globalization and Progressive Economic Policy. Edited by Gerald Epstein, Dean Baker and Robert Pollin. Cambridge: Cambridge University Press. [Google Scholar]
- Das, Satya P. 2002. Foreign direct investment and the relative wage in a developing economy. Journal of Development Economics 67: 55–77. [Google Scholar] [CrossRef]
- Driffield, Nigel, and Sourafel Girma. 2003. Regional FDI and wages spillovers: Evidence from the UK electronics industry. Oxford Bulletin of Economics and Statistics 65: 453–74. [Google Scholar] [CrossRef]
- Dunning, John. 1993. Multinational Enterprises and the Global Economy. Boston: Addison-Wesley Publishing Company. [Google Scholar]
- Eckel, Carsten. 2003. Fragmentation, efficiency-seeking FDI, and employment. Review of International Economics 11: 317–31. [Google Scholar] [CrossRef]
- Economou, Fotini, Chiristis Hassapis, Nikolaos Philippas, and Mike Tsionas. 2017. Foreign direct investment determinants in OECD and developing countries. Review of Development Economics 21: 527–42. [Google Scholar] [CrossRef]
- Feenstra, Robert C., and Gordon H. Hanson. 1996. Foreign investment, outsourcing and relative wages. In The Political Economy of Trade Policy: Papers in Honor of Jagdish Bhagwati. Edited by Gene Grossman, Douglas Irwin and Robert C. Feenstra. Cambridge: MIT Press, pp. 89–127. [Google Scholar]
- Feenstra, Robert C., and Gordon H. Hanson. 1997. Foreign direct investment and relative wages: Evidence from Mexico’s Maquiladoras. Journal of International Economics 42: 371–94. [Google Scholar] [CrossRef]
- Feliciano, Zadia M., and Robert E. Lipsey. 2006. Foreign ownership, wages, and wage changes in U.S. industries, 1987–1992. Contemporary Economic Policy 24: 74–91. [Google Scholar] [CrossRef]
- Gazaniol, Alexandre, and Catherine Laffineur. 2015. Does Outward Foreign Direct Investment Affect Domestic Real Wages? An Investigation Using French Micro-Data (No. 155). FIW Working Paper. Available online: http://www.fiw.ac.at/fileadmin/Documents/Publikationen/Working_Paper/N_155_Gazaniol_Laffineur.pdf (accessed on 16 September 2017).
- Girma, Sourafel, Holger Görg, and Erasmus Kersting. 2016. Which Boats are lifted by a Foreign Tide? Direct and Indirect Wage Effects of Foreign Ownership. Available online: http://econ.au.dk/fileadmin/Economics_Business/Research/TGF/DIEW2016/HGoerg.pdf (accessed on 13 September 2017).
- Gopinath, Munisamy, and Weiyan Chen. 2003. Foreign direct investment and wages: A cross country analysis. Journal of International Trade and Development 12: 285–309. [Google Scholar] [CrossRef]
- Harrison, Ann E. 2002. Has Globalization Eroded Labor’s Share? Some Cross-Country Evidence. Available online: http://citeseerx.ist.psu.edu/viewdoc/download?doi=10.1.1.198.9065&rep=rep1&type=pdf (accessed on 13 September 2017).
- Hartwig, Jochen. 2010. Is health capital formation good for long-term economic growth?—Panel Granger-causality evidence for OECD countries. Journal of Macroeconomics 32: 314–25. [Google Scholar] [CrossRef]
- Holtz-Eakin, Douglas, Whitney Newey, and Harvey S. Rosen. 1988. Estimating vector auto regressions with panel data. Econometrica 56: 1371–95. [Google Scholar] [CrossRef]
- Hsiao, Frank S. T., and Mei-Chu W. Hsiao. 2006. FDI, exports, and GDP in East and Southeast Asia—Panel data versus time-series causality analyses. Journal of Asian Economics 17: 1082–106. [Google Scholar] [CrossRef]
- Janicki, H., and P. V. Wunnava. 2004. Determinants of foreign direct investment: Empirical evidence from EU accession candidates. Applied Economics 36: 505–9. [Google Scholar] [CrossRef]
- Kónya, Laszio. 2006. Exports and growth: Granger-causality analysis on OECD countries with a panel data approach. Economic Modelling 23: 978–92. [Google Scholar] [CrossRef]
- Lemoine, Françoise. 1998. Integrating Central and Eastern Europe in the European Trade and Production Network. Working Paper 107. Available online: http://brie.berkeley.edu/publications/WP107.pdf (accessed on 16 September 2017).
- Lipsey, Robert E., and Fredrik Sjöholm. 2004. Foreign direct investment, education, and wages in Indonesian manufacturing. Journal of Development Economics 73: 415–22. [Google Scholar] [CrossRef]
- Lipsey, Robert E., and Fredrik Sjöholm. 2006. Foreign Firms and Indonesian Manufacturing Wages: An Analysis with Panel Data. Economic Development and Cultural Change 55: 201–21. [Google Scholar]
- OECD. 1993. Absolute Levels of Cost-Competitiveness: Methodological Aspects and Preliminary Estimates. Paris: OECD. [Google Scholar]
- Onaran, Özlem. 2009. Wage Share, Globalization and Crisis: The Case of the Manufacturing Industry in Korea, Mexico and Turkey. International Review of Applied Economics 23: 113–34. [Google Scholar] [CrossRef]
- Podrecca, Elana, and Gaetano Carmeci. 2001. Fixed investment and economic growth: New results on causality. Applied Economics 33: 177–82. [Google Scholar] [CrossRef]
- Pradhan, Rudra P., Mak B. Arvin, Neville R. Norman, and Samadran K. Bele. 2014. Economic growth and the development of telecommunications infrastructure in the G-20 countries: A panel-VAR approach. Telecommunications Policy 38: 634–49. [Google Scholar] [CrossRef]
- Rodrik, Dani. 1998. Capital Mobility and Labor. Cambridge: Harward University. [Google Scholar]
- Roodman, David. 2009. How to do xtabond2: An introduction to difference and system GMM in Stata. The Stata Journal 9: 86–136. [Google Scholar] [CrossRef]
- Ruane, Frances, and Ali Uğur. 2004. Foreign direct investment and productivity spillovers in Irish manufacturing industry: Evidence from firm level panel data. International Journal of Economics and Business 12: 53–66. [Google Scholar] [CrossRef]
- Schneider, Fredrich, and Bruno S. Frey. 1985. Economic and political determinants of foreign direct investment. World Development 13: 161–75. [Google Scholar] [CrossRef]
- UNCTAD. 2016. World Investment Report. New York and Geneva: UNCTAD. [Google Scholar]
- Vijayakumar, Narayanamurthy, Peruma Sridharan, and Kode Chandra S. Rao. 2010. Determinants of FDI in BRICS: A Panel Analysis. International Journal of Business Science and Applied Management 5: 1–13. [Google Scholar]
- Wei, Shang-Jin. 2000. How Taxing is Corruption on International Business. Review of Economics and Statistics 82: 1–11. [Google Scholar] [CrossRef]
- Wheeler, David, and Ashoka Mody. 1992. International Investment Location Decisions: The Case for U.S. Firms. Journal of International Economics 33: 57–76. [Google Scholar] [CrossRef]
- Windmeijer, Frank. 2005. A finite sample correction for the variance of linear two-step GMM estimators. Journal of Econometrics 126: 25–51. [Google Scholar] [CrossRef]
| 1 | Panel unit root tests provided in Table 1 are done in Stata (v. 12). Since the variables are not stationary at levels, the data is first differenced for further work. |
| 2 | All system GMM estimates are carried out by the Roodman’s ‘xtabond2’ command in Stata (v.12). The remaining results are available upon request. |
| 3 | Due to the heteroscedasticity problem in the one-step model, a robust-to-heteroscedasticity variance-covariance estimator is used. As such, the Sargan test statistics cannot be presented. |
| 4 | The impulse response functions with confidence intervals are derived by the help of pvar package by Abrigo and Love (2015). |
| 5 | The sectors are selected based on data availability. Industry includes the electricity sector. The labor cost indicators used in the analysis of manufacturing, construction, and finance are reflective exactly of labor costs in these sectors, whereas the labor cost indicator used in the analysis of the industry sector (i.e., electricity) makes use of what is labeled as the “business and/or industry” labor cost by the OECD. |
| 6 | Figures presented in Appendix B are produced by dropping the years of financial crisis (2008-2009), but there is no significant change on the results. |
Table 1.
Descriptive Statistics.
| Observation | Mean | Standard Deviation | ||
|---|---|---|---|---|
| All | fdpva | 345 | 35.28 | 29.88 |
| cml | 345 | 19.18 | 7.26 | |
| ulc | 345 | 0.58 | 0.109 | |
| Manufacturing | fdpva | 255 | 49.81 | 44.7 |
| cml | 255 | 19.81 | 8.31 | |
| ulc | 255 | 0.616 | 0.11 | |
| Finance | fdpva | 225 | 59.54 | 70.6 |
| cml | 225 | 21.88 | 7.55 | |
| ulc | 225 | 0.57 | 0.13 | |
| Construction | fdpva | 270 | 5.30 | 5.53 |
| cml | 270 | 17.30 | 6.66 | |
| ulc | 270 | 0.66 | 0.17 | |
| Industry | fdpva | 195 | 33.19 | 38.65 |
| cml | 195 | 19.40 | 9.82 | |
| ulc | 195 | 0.53 | 0.13 |
Note: fdpva: Foreign Direct Investment, cml: Labor Compensation Cost, ulc: Unit Labor Cost.
Table 2.
Panel Unit Root Tests.
| fdpva | cml | ulc | |||||||||||
|---|---|---|---|---|---|---|---|---|---|---|---|---|---|
| Levin | IPS | ADF-Fisher Chi-square | PP-Fisher Chi-square | Levin | IPS | ADF-Fisher Chi-square | PP-Fisher Chi-square | Levin | IPS | ADF-Fisher Chi-square | PP-Fisher Chi-square | ||
| Panel A. Level | |||||||||||||
| All | Stat | 0.835 | 0.580 | 31.794 | −0.263 | 3.631 | −0.806 | 53.446 | 31.928 | 2.347 | 1.881 | 0.3871 | 33.526 |
| Prob | 0.7984 | 0.719 | 0.8739 | 0.396 | 0.999 | 0.210 | 0.110 | 0.870 | 0.990 | 0.970 | 0.650 | 0.821 | |
| Manufacturing | Stat | 1.906 | 0.717 | 32.884 | 45.285 | 2.790 | 3.197 | 31.560 | −0.794 | −0.437 | −0.671 | 0.625 | −0.284 |
| Prob | 0.971 | 0.763 | 0.617 | 0.138 | 0.997 | 0.999 | 0.679 | 0.2134 | 0.330 | 0.2511 | 0.734 | 0.388 | |
| Finance | Stat | −0.3396 | −1.005 | 30.301 | 38.758 | 0.604 | −0.840 | 31.414 | 25.539 | −0.285 | −0.447 | 37.918 | 0.795 |
| Prob | 0.367 | 0.158 | 0.450 | 0.131 | 0.727 | 0.200 | 0.305 | 0.698 | 0.387 | 0.327 | 0.151 | 0.786 | |
| Construction | Stat | 0.857 | 0.446 | 29.989 | 0.6273 | 1.936 | −0.902 | 36.020 | 28.412 | −0.971 | −0.748 | 36.735 | 0.765 |
| Prob | 0.804 | 0.672 | 0.568 | 0.734 | 0.973 | 0.183 | 0.285 | 0.648 | 0.165 | 0.220 | 0.258 | 0.777 | |
| Industry | Stat | −0.400 | −0.637 | 29.352 | 30.861 | 0.898 | −0.874 | 17.449 | 23.711 | 1.199 | −0.637 | 28.401 | −0.502 |
| Prob | 0.344 | 0.261 | 0.295 | 0.233 | 0.815 | 0.191 | 0.894 | 0.592 | 0.884 | 0.261 | 0.339 | 0.307 | |
| Panel B. First Difference | |||||||||||||
| All | Stat | −6.756 | −1.886 | 70.597 | 74.803 | −1.634 | −2.390 | 80.372 | 101.41 | −4.143 | −1.960 | 107.34 | 77.973 |
| Prob | 0.000 | 0.002 | 0.003 | 0.001 | 0.005 | 0.008 | 0.000 | 0.000 | 0.000 | 0.002 | 0.000 | 0.000 | |
| Manufacturing | Stat | −4.184 | −3.211 | 116.65 | 91.470 | −3.547 | −2.473 | 68.431 | 192.02 | −2.590 | −1.344 | 90.240 | 85.319 |
| Prob | 0.000 | 0.0000 | 0.000 | 0.000 | 0.000 | 0.006 | 0.000 | 0.000 | 0.004 | 0.008 | 0.000 | 0.000 | |
| Finance | Stat | −5.650 | −1.446 | 51.457 | 59.633 | −1.980 | −1.843 | 80.902 | 86.320 | −2.774 | −4.596 | 71.185 | 76.242 |
| Prob | 0.000 | 0.007 | 0.000 | 0.001 | 0.002 | 0.003 | 0.000 | 0.0000 | 0.002 | 0.000 | 0.000 | 0.000 | |
| Construction | Stat | −3.870 | −4.465 | 51.649 | 111.058 | −4.212 | −3.121 | 185.30 | 68.039 | −5.584 | −2.714 | 104.34 | 104.57 |
| Prob | 0.000 | 0.000 | 0.001 | 0.000 | 0.000 | 0.000 | 0.000 | 0.000 | 0.000 | 0.003 | 0.000 | 0.000 | |
| Industry | Stat | −5.109 | −1.555 | 56.993 | 58.115 | −3.556 | −3.319 | 66.584 | 144.13 | −1.322 | −4.401 | 63.894 | 70.449 |
| Prob | 0.0000 | 0.00 | 0.000 | 0.000 | 0.000 | 0.000 | 0.000 | 0.000 | 0.000 | 0.000 | 0.000 | 0.000 | |
Table 3.
Foreign direct investment (FDI) and Unit Labor Cost.
| Fixed Effect | AB One Step System GMM | AB Two Step System GMM | Fixed Effect | AB One Step System GMM | AB Two Step System GMM | |
|---|---|---|---|---|---|---|
| Dependent Variable | 1 | 2 | 3 | 4 | 5 | 6 |
| fdpva | fdpva | fdpva | ulc | ulc | ulc | |
| L.fdpva | 0.024 | 0.930 *** | 0.953 *** | −0.008 | −0.014 | −0.011 |
| (0.037) | (0.113) | (0.103) | (0.013) | (0.012) | (0.01) | |
| L2.fdpva | 0.679 | 0.0358 | 0.0204 | −0.004 | 0.0121 | 0.0210 |
| (0.058) | (0.107) | (0.0992) | (0.014) | (0.0107) | (0.010) | |
| L.ulc | −1.284 | −1.204 ** | −1.255 * | −0.960 *** | 1.635 *** | 1.674 *** |
| (0.586) | (0.566) | (0.640) | (0.076) | (0.127) | (0.129) | |
| L2.ulc | −0.349 | 0.804 | 0.920 | 1.896 *** | −0.663 | −0.696 |
| (0.611) | (0.517) | (0.599) | (0.058) | (0.107) | (0.109) | |
| Hansen Test | 0.284 | 0.284 | 0.292 | 0.592 | ||
| Difference Hansen Test | 0.874 | 0.874 | 0.712 | 0.712 | ||
| AB Test | 0.618 | 0.690 | 0.570 | 0.297 | ||
| Wald Test ulc | 0.028 | 0.010 | 0.002 | |||
| Wald Test fdpva | 0.849 | 0.522 | 0.611 |
Note: fdpva: Foreign Direct Investment; cml: Labor Compensation Cost; ulc: Unit Labor Cost. Robust standard errors are in parenthesis. Time dummies are included. Estimates for constant terms are not shown. AB test: Arellano-Bond test for AR(2) in first differences.* Significance at the 10% level; ** significance at the 5% level; *** significance at the 1% level.
Table 4.
FDI and Labor Compensation.
| Fixed Effect | AB One Step System GMM | AB Two Step System GMM | Fixed Effect | AB One Step System GMM | AB Two Step System GMM | |
|---|---|---|---|---|---|---|
| Dependent Variable | 1 | 2 | 3 | 4 | 5 | 6 |
| fdpva | fdpva | fdpva | cml | cml | cml | |
| L.fdpva | 0.406 (0.071) | 0.078 (0.124) | 0.0877 (0.153) | −0.011 (0.009) | 0.042 *** (0.010) | 0.0400 *** (0.0103) |
| L2.fdpva | −0.095 (0.057) | −0.148 (0.159) | −0.109 (0.181) | 0.038 *** (0.007) | 0.003 (0.723) | 0.005 (0.010) |
| L.cml | −0.484 (0.585) | 0.987 ** (0.546) | 0.864 (0.600) | 0.885 *** (0.072) | 0.658 *** (0.091) | 0.6457 *** (0.103) |
| L2.cml | 1.397 *** (1.941) | 1.393 *** (0.430) | 1.298 *** (0.487) | −0.176 (0.074) | 0.239 ** (0.102) | 0.2577 (0.107) |
| Hansen Test | 0.279 | 0.279 | 0.236 | 0.236 | ||
| Difference Hansen Test | 0.411 | 0.411 | 0.773 | 0.773 | ||
| AB Test | 0.297 | 0.490 | 0.495 | 0.493 | ||
| Wald Test cml | 0.000 | 0.000 | 0.0000 | |||
| Wald Test fdpva | 0.000 | 0.000 | 0.000 |
Note: fdpva: Foreign Direct Investment, cml: Labor Compensation Cost, ulc: Unit Labor Cost. Robust standard errors are in parenthesis. Time dummies are included. Estimates for constant terms are not shown. AB test: Arellano-Bond test for AR(2) in first differences. * Significance at the 10% level; ** Significance at the 5% level; *** Significance at the 1% level.
Table 5.
Manufacturing: FDI and Unit Labor Cost.
| Fixed Effect | AB One Step System GMM | AB Two Step System GMM | Fixed Effect | AB One Step System GMM | AB Two Step System GMM | |
|---|---|---|---|---|---|---|
| Dependent Variable | 1 | 2 | 3 | 4 | 5 | 6 |
| fdpva | fdpva | fdpva | ulc | ulc | ulc | |
| L.fdpva | 0.780 | 0.757 *** | 0.776 *** | 0.015 | −0.0349 | −0.0359 |
| (0.064) | (0.0821) | (0.0885) | (0.016) | (0.0271) | (0.0250) | |
| L2.fdpva | 0.065 (0.066) | 0.226 *** (0.0801) | 0.205 ** (0.085) | −0.007 (0.015) | 0.0167 (−0.0236) | 0.0177 (0.0225) |
| L.ulc | 0.721 (0.505) | −0.701 *** (0.237) | −0.688 (0.437) | 0.944 *** (0.054) | 0.530 *** (0.0817) | 0.530 *** (0.0844) |
| L2.ulc | −1.13 *** (0.481) | −0.827 ** (0.360) | −0.746 ** (0.296) | −0.124 ** (0.050) | 0.569 *** (0.220) | 0.562 ** (0.232) |
| Hansen Test | 0.393 | 0.393 | 0.481 | 0.481 | ||
| Difference Hansen Test | 0.326 | 0.326 | 0.797 | 0.797 | ||
| AB Test | 0.328 | 0.497 | 0.587 | 0.653 | ||
| Wald Test ulc | 0.036 | 0.015 | 0.039 | |||
| Wald Test fdpva | 0.281 | 0.143 | 0.146 |
Note: fdpva: Foreign Direct Investment, cml: Labor Compensation Cost, ulc: Unit Labor Cost. Robust standard errors are in parenthesis. Time dummies are included. Estimates for constant terms are not shown. AB test: Arellano-Bond test for AR(2) in first differences. * Significance at the 10% level; ** Significance at the 5% level; *** Significance at the 1% level.
Table 6.
Manufacturing. FDI and Labor Compensation.
| Fixed Effect | AB One Step System GMM | AB Two Step System GMM | Fixed Effect | AB One Step System GMM | AB Two Step System GMM | |
|---|---|---|---|---|---|---|
| Dependent Variable | 1 | 2 | 3 | 4 | 5 | 6 |
| fdpva | fdpva | fdpva | cml | cml | cml | |
| L.fdpva | 0.597 *** (0.086) | 0.425 *** (0.131) | 0.366 *** (0.128) | 0.035 *** (0.011) | 0.0379 *** (0.0125) | 0.0362 *** (0.0110) |
| L2.fdpva | 0.135 (0.089) | 0.110 (0.234) | 0.161 (0.195) | 0.002 (0.011) | −0.0025 (0.0323) | 0.007 (0.030) |
| L.cml | −0.974 (0.813) | 0.981 ** (0.459) | 0.986 ** (0.417) | 0.684 *** (0.104) | 0.006 (0.134) | 0.0124 (0.156) |
| L2.cml | 1.45 ** (0.7753) | −0.480 (0.527) | −0.476 (0.475) | 0.203 ** (0.100) | 0.937 *** (0.136) | 0.885 *** (0.120) |
| Hansen Test | 0.624 | 0.624 | 0.395 | 0.395 | ||
| Difference Hansen Test | 0.513 | 0.513 | 0.750 | 0.750 | ||
| AB Test | 0.234 | 0.268 | 0.061 | 0.067 | ||
| Wald Test cml | 0.063 | 0.000 | 0.000 | |||
| Wald Test fdpva | 0.030 | 0.000 | 0.001 |
Note: fdpva: Foreign Direct Investment, cml: Labor Compensation Cost, ulc: Unit Labor Cost. Robust standard errors are in parenthesis. Time dummies are included. Estimates for constant terms are not shown. AB test: Arellano-Bond test for AR(2) in first differences. * Significance at the 10% level; ** significance at the 5% level; *** significance at the 1% level.
Table 7.
Finance: FDI and Unit Labor Cost.
| Fixed Effect | AB One Step System GMM | AB Two Step System GMM | Fixed Effect | AB One Step System GMM | AB Two Step System GMM | |
|---|---|---|---|---|---|---|
| Dependent Variable | 1 | 2 | 3 | 4 | 5 | 6 |
| fdpva | fdpva | fdpva | ulc | ulc | ulc | |
| L.fdpva | 0.859 (0.073) | 0.819 *** (0.0735) | 0.814 *** (0.076) | 0.005 (0.0098) | −0.0103 (0.0129) | −0.00776 (0.0108) |
| L2.fdpva | 0.078 *** (0.066) | 0.149 *** (0.0473) | 0.148 *** (0.050) | 0.0034 (0.016) | 0.00761 (0.00950) | 0.00704 (0.00970) |
| L.ulc | 1.082 (0.253) | −0.0706 (0.454) | −0.488 (0.488) | 0.709 *** (0.108) | 0.113 (0.128) | 0.126 (0.103) |
| L2.ulc | −1.806 *** (0.942) | −0.262 ** (0.126) | −0.306 * (0.165) | 0.403 *** (0.126) | 0.716 *** (0.110) | 0.735 *** (0.106) |
| Hansen Test | 0.299 | 0.299 | 0.277 | 0.277 | ||
| Difference Hansen Test | 0.507 | 0.507 | 0.568 | 0.568 | ||
| AB Test | 0.054 | 0.104 | 0.114 | 0.230 | ||
| Wald Test ulc | 0.007 | 0.001 | 0.007 | |||
| WaldTest fdpva | 0.763 | 0.653 | 0.719 |
Note: fdpva: Foreign Direct Investment, cml: Labor Compensation Cost, ulc: Unit Labor Cost. Robust standard errors are in parenthesis. Time dummies are included. Estimates for constant terms are not shown. AB test: Arellano-Bond test for AR(2) in first differences. * Significance at the 10% level; ** significance at the 5% level; *** significance at the 1% level.
Table 8.
Finance. FDI and Labor Compensation.
| Fixed Effect | AB One Step System GMM | AB Two Step System GMM | Fixed Effect | AB One Step System GMM | AB Two Step System GMM | |
|---|---|---|---|---|---|---|
| Dependent Variable | 1 | 2 | 3 | 4 | 5 | 6 |
| fdpva | fdpva | fdpva | cml | cml | cml | |
| L.fdpva | 0.682 *** (0.0784) | 0.921 *** (0.0880) | 0.963 *** (0.0659) | 0.00147 (0.00914) | −0.000321 (0.00823) | 0.00140 (0.00915) |
| L2.fdpva | 0.0387 (0.0733) | 0.0831 (0.0696) | 0.0794 (0.0801) | 0.00547 (0.00739) | 0.00831 (0.0105) | 0.00743 (0.0107) |
| L.cml | 0.696 (0.561) | −0.328 (0.779) | −0.422 (0.657) | 0.999 *** (0.0320) | 0.943 *** (0.136) | 0.955 *** (0.213) |
| L2.cml | −0.391 (0.538) | −0.275 (0.566) | −0.348 (0.398) | 0.00161 (0.029) | 0.0585 (0.135) | 0.0458 (0.213) |
| Hansen Test | 0.651 | 0.651 | 0.439 | 0.439 | ||
| Difference Hansen Test | 0.738 | 0.738 | 0.645 | 0.645 | ||
| AB Test | 0.381 | 0.370 | 0.992 | 0.954 | ||
| Wald Test cml | 0.197 | 0.307 | 0.111 | |||
| Wald Test fdpva | 0.403 | 0.448 | 0.307 |
Note: fdpva: Foreign Direct Investment, cml: Labor Compensation Cost, ulc: Unit Labor Cost. Robust standard errors are in parenthesis. Time dummies are included. Estimates for constant terms are not shown. AB test: Arellano-Bond test for AR(2) in first differences. * Significance at the 10% level; ** significance at the 5% level; *** significance at the 1% level.
© 2017 by the authors. Licensee MDPI, Basel, Switzerland. This article is an open access article distributed under the terms and conditions of the Creative Commons Attribution (CC BY) license (http://creativecommons.org/licenses/by/4.0/).
Share and Cite
MDPI and ACS Style
Bayraktar-Sağlam, B.; Sayek Böke, S. Labor Costs and Foreign Direct Investment: A Panel VAR Approach. Economies 2017, 5, 36. https://doi.org/10.3390/economies5040036
AMA Style
Bayraktar-Sağlam B, Sayek Böke S. Labor Costs and Foreign Direct Investment: A Panel VAR Approach. Economies. 2017; 5(4):36. https://doi.org/10.3390/economies5040036
Chicago/Turabian StyleBayraktar-Sağlam, Bahar, and Selin Sayek Böke. 2017. "Labor Costs and Foreign Direct Investment: A Panel VAR Approach" Economies 5, no. 4: 36. https://doi.org/10.3390/economies5040036
Note that from the first issue of 2016, this journal uses article numbers instead of page numbers. See further details here.