Article

Estimating Infrastructure Financing Needs in the Asia-Pacific Least Developed Countries, Landlocked Developing Countries, and Small Island Developing States

1
Global Environment Finance, United Nations Development Programme, Bangkok 10200, Thailand
2
Independent Researcher, Yanji 133000, China
3
Macroeconomic Policy and Financing for Development Division, United Nations Economic and Social Commission for Asia and the Pacific, Bangkok 10200, Thailand
*
Author to whom correspondence should be addressed.
Economies 2018, 6(3), 43; https://doi.org/10.3390/economies6030043
Submission received: 23 April 2018 / Revised: 25 June 2018 / Accepted: 11 July 2018 / Published: 1 August 2018

Abstract

:
To assist with the achievement of the Sustainable Development Goals by 2030, this paper develops a framework to estimate infrastructure financing needs of the Asia-Pacific least developed countries (LDCs), landlocked developing countries (LLDCs), and small island developing States (SIDS) by 2030. The framework takes into account the financing required to close existing infrastructure gaps, keep up with growing demands for new infrastructure, maintain existing infrastructure, and mitigate the vulnerability of infrastructure to climate-related risks. Based on a panel of 71 developing economies from 1990 to 2015 and the application of unit costs to the level of physical infrastructure stock projected to 2030, the required resources are estimated to amount to 8.1% of GDP per annum on weighted average, which exceeds current levels of infrastructure funding of 5–7% of GDP. The paper finds that a large proportion of financing needs in LDCs and SIDS arises from the current infrastructure shortages, particularly in the transport and energy sector, implying that provision of universal access to basic infrastructure services would require large outlays of resources. The results also suggest that LLDCs and some SIDS require over one-third of their spending to be allocated to maintenance and replacement of existing assets, while those in low-lying coastal areas face substantial long-run costs in improving infrastructure to mitigate climate change and protect them against loss and damages caused by extreme weather events. Meeting future infrastructure financing needs will require greater engagement of the private sector and other global and regional initiatives to ensure that sufficient resources can be raised for investment in infrastructure.

1. Introduction

The Asia-Pacific least developed countries (LDCs), landlocked developing countries (LLDCs), and small island developing States (SIDS) continue to face significant challenges and constraints in achieving inclusive growth and sustainable development. Such challenges and constraints are associated with remoteness; geographic features; availability of resources; demography; weather; or, most commonly, a combination of these factors. The result has been limited progress in structural transformation, slower development of productive capacities and heightened vulnerability to external shocks, such as those arising from volatile commodity prices, climate change, and natural disasters.
While each of these economies faces its own unique circumstances, they share one characteristic that applies to most developing countries—a significant deficit in physical infrastructure such as transport, energy, information and communications technology (ICT), and water supply and sanitation (WSS). In many of these economies, particularly in the least developed ones, access to basic infrastructure services is still far from universal; in Afghanistan, Cambodia, and Solomon Islands, more than 70 percent of the rural population does not have access to improved water sources and more than half of the population lacks access to electricity. A lack of physical infrastructure is the principle obstacle to sustainable development as it not only limits opportunities to expand productive capacities and improve connectivity across and among countries, thereby restricting economic growth, but also constrains social development and harms environmental sustainability (United Nations Economic and Social Commission for Asia and the Pacific (ESCAP 2017)). Paying full regard to the critical development need, the 2030 Agenda for Sustainable Development and the Sustainable Development Goals (SDGs) aim at providing universal access to water, sanitation, electricity, and so on, by 2030.
In addition to the current infrastructure deficit, the Asia-Pacific LDCs, LLDCs, and SIDS will face new demands for physical infrastructure stemming from their rising wealth and rapid urbanization. Although population growth is expected to slow down over the medium-term, urban growth pressures will remain high in coming decades, particularly in LDCs and LLDCs. While in these economies, only one in three persons lived in urban areas as of 2014, projections suggest that about half of the population will live in urban areas by 2050, aggravating infrastructure shortages in cities (ESCAP 2015a). In addition, a rapidly rising middle-income class in LLDCs and an expansion of the transitional income category—defined as people in the income bracket right below the middle-income class—in LDCs will create further demand for public infrastructure services that go beyond basic needs, including reliable energy and ICT infrastructure.
Inadequate maintenance could also add to the expansion of future infrastructure deficits. Countries tend to prioritize development of new infrastructure over maintenance of existing facilities and end up reducing the useful life of these assets (Rioja 2003; Kalaitzidakis and Kalyvitis 2004). World Bank (2005) estimates that preference towards building new road infrastructure, for instance, has led investments in maintenance to be only between 20% and 50% of what they should be to effectively maintain the road network. Similarly, the Pacific Region Infrastructure Facility (2013) admits that “there is common agreement that maintenance is being avoided within the ‘build–neglect–rebuild’ paradigm.” To make matters worse, in countries that have chronically weak public revenues, such as LDCs, shortfalls in government review targets are often accompanied by cuts in maintenance spending. The degradation of existing infrastructure not only diminishes the benefits of network development, but also results in costly reconstruction projects or repair jobs in the future.
Moreover, climate change will necessitate the development of more sustainable and climate-resilient infrastructure. For instance, in the 2030 Agenda for Sustainable Development, Goal 7 is set to ensure universal access to affordable, reliable, sustainable, and modern energy. Goal 7 also aims to substantially increase the share of renewable energy in the global energy mix and to support the expansion of modern and sustainable energy services, particularly in LDCs, LLDCs, and SIDS, which will involve additional costs. The United Nations estimated that developing Asia will need an additional investment of $232 billion annually to double its renewable energy consumption by 2030, plus $211 billion for energy efficiency improvements in a scenario that is consistent with the two-degree target of the Paris Agreement (SE4All, 2015). SIDS and other countries with low-lying coastal areas also face substantial long-run infrastructure costs to mitigate losses and damages caused by climate change or extreme weather events. For instance, the International Monetary Fund (IMF) estimates that Kiribati’s operating expenditures related to climate change contingencies and to new infrastructure maintenance costs amount to 2–3% of GDP (IMF 2016).
While it is clear that the Asia-Pacific LDCs, LLDCs, and SIDS will have to invest significant financial resources to address these issues, quantifying how much is needed for these economies is not an easy undertaking. This is partly because information on the magnitude of their past infrastructure investment is often not available. Thus, although some studies have included these economies as the “rest” of the world or of the region, those estimates are typically extrapolated from data for other countries (see, for instance, McKinsey Global Institute 2013, 2016).
The main challenge in estimating financing needs for LDCs, LLDCs, and SIDS arises from differences in the nature of infrastructure needs in these economies and other developing countries. In the latter, most needs are a result of either increasing demand for new infrastructure or maintenance and rehabilitation of existing infrastructure. Thus, estimating future levels of infrastructure can be based upon historical trends of infrastructure provision and projections of demand arising from population growth, increasing urbanization and per capita income growth assumptions. However, infrastructure needs in LDCs, LLDCs, and SIDS may be more related to supply constraints and resulting infrastructure shortages. Therefore, estimates for these economies cannot be based solely on historical trends and need to include a component of financing needs that would be required to fill the existing infrastructure gaps.
This paper, therefore, aims to develop a framework to estimate the infrastructure financing needs of the Asia-Pacific LDCs, LLDCs, and SIDS, taking into account four components: (1) financing that is needed to meet the growing demand for new infrastructure as populations increase and become more urbanized; (2) financing that is needed to effectively maintain existing infrastructure; (3) financing that is needed to fill existing infrastructure shortages; and (4) financing that will be needed for improving infrastructure to mitigate losses and damages caused by climate change or extreme weather events.
The methodology developed in this paper partly builds upon the “top-down” approach developed by Fay (2000) and Fay and Yepes (2003) and later extended by Bhattacharyay (2012), Ruiz-Nunez and Wei (2015), and Asian Development Bank (ADB 2017). It first estimates financing needs to meet the growing demand for infrastructure and to effectively maintain existing infrastructure (i.e., the first and second components). Second, for countries or sectors in which universal access to physical infrastructure will not be achieved by 2030, the estimated capital costs of universal access are added (i.e., the third component). Finally, these estimates are adjusted by factoring in the costs of climate mitigation and adaptation (i.e., the fourth component).
The paper contributes to the literature of estimating infrastructure financing needs in the following ways. First, it focuses on a number of ‘small’ Asia-Pacific countries that have been often omitted from existing analyses or included only as part of the ‘rest’ of the world because of limited data availability. Second, in addition to the conventional factors of infrastructure financing needs that arise from growing future demand for infrastructure, the paper considers financing that is needed to fill existing infrastructure shortages. This component is typically assumed to constitute only a small proportion of total financing needs, and is thus excluded from analyses. This is a valid assumption to be made as long as countries/sectors assessed are sufficiently developed and have adequate provision of basic services. As the focus of the paper is on the Asia-Pacific LDCs, LLDCs, and SIDS, this assumption has to be relaxed. Third, this paper partly addresses the drawback of the “top-down” approach by actively incorporating country-specific unit cost data to universal unit cost estimates. Finally, this paper considers climate adaptation and mitigation as one of the key drivers of financing needs in these economies, especially in the Pacific. With a notable exception of the latest study by ADB (2017), this component has not been taken into account in the context of estimating infrastructure financing needs.
The rest of the paper is organized as follows: Section 2 reviews the current state of infrastructure in the Asia-Pacific LDCs, LLDCs, and SIDS to demonstrate how universal access to basic services is still limited and narrow in some economies; Section 3 provides the overview of previous studies and methodologies adopted to estimate infrastructure financing needs; Section 4 presents the methodologies used for estimating the four components of infrastructure financing needs; Section 5 provides the results from the estimation of infrastructure financing needs of 29 countries by sector; Section 6 discusses the policy implication of the findings; and Section 7 draws conclusions.

2. The State of Infrastructure in the Asia-Pacific LDCs, LLDCs, and SIDS

The infrastructure sectors covered in this paper are (1) transport, (2) energy/electricity, (3) information and communications technology (ICT), and (4) water supply and sanitation (WSS). The review of the state of infrastructure in the Asia-Pacific LDCs, LLDCs, and SIDS is based on the following eleven indicators representing the four categories of physical infrastructure:
  • Paved roads (total route km per 1000 people);
  • Unpaved roads (total route km per 1000 people);
  • Rail lines (total route km per 1,000,000 people);
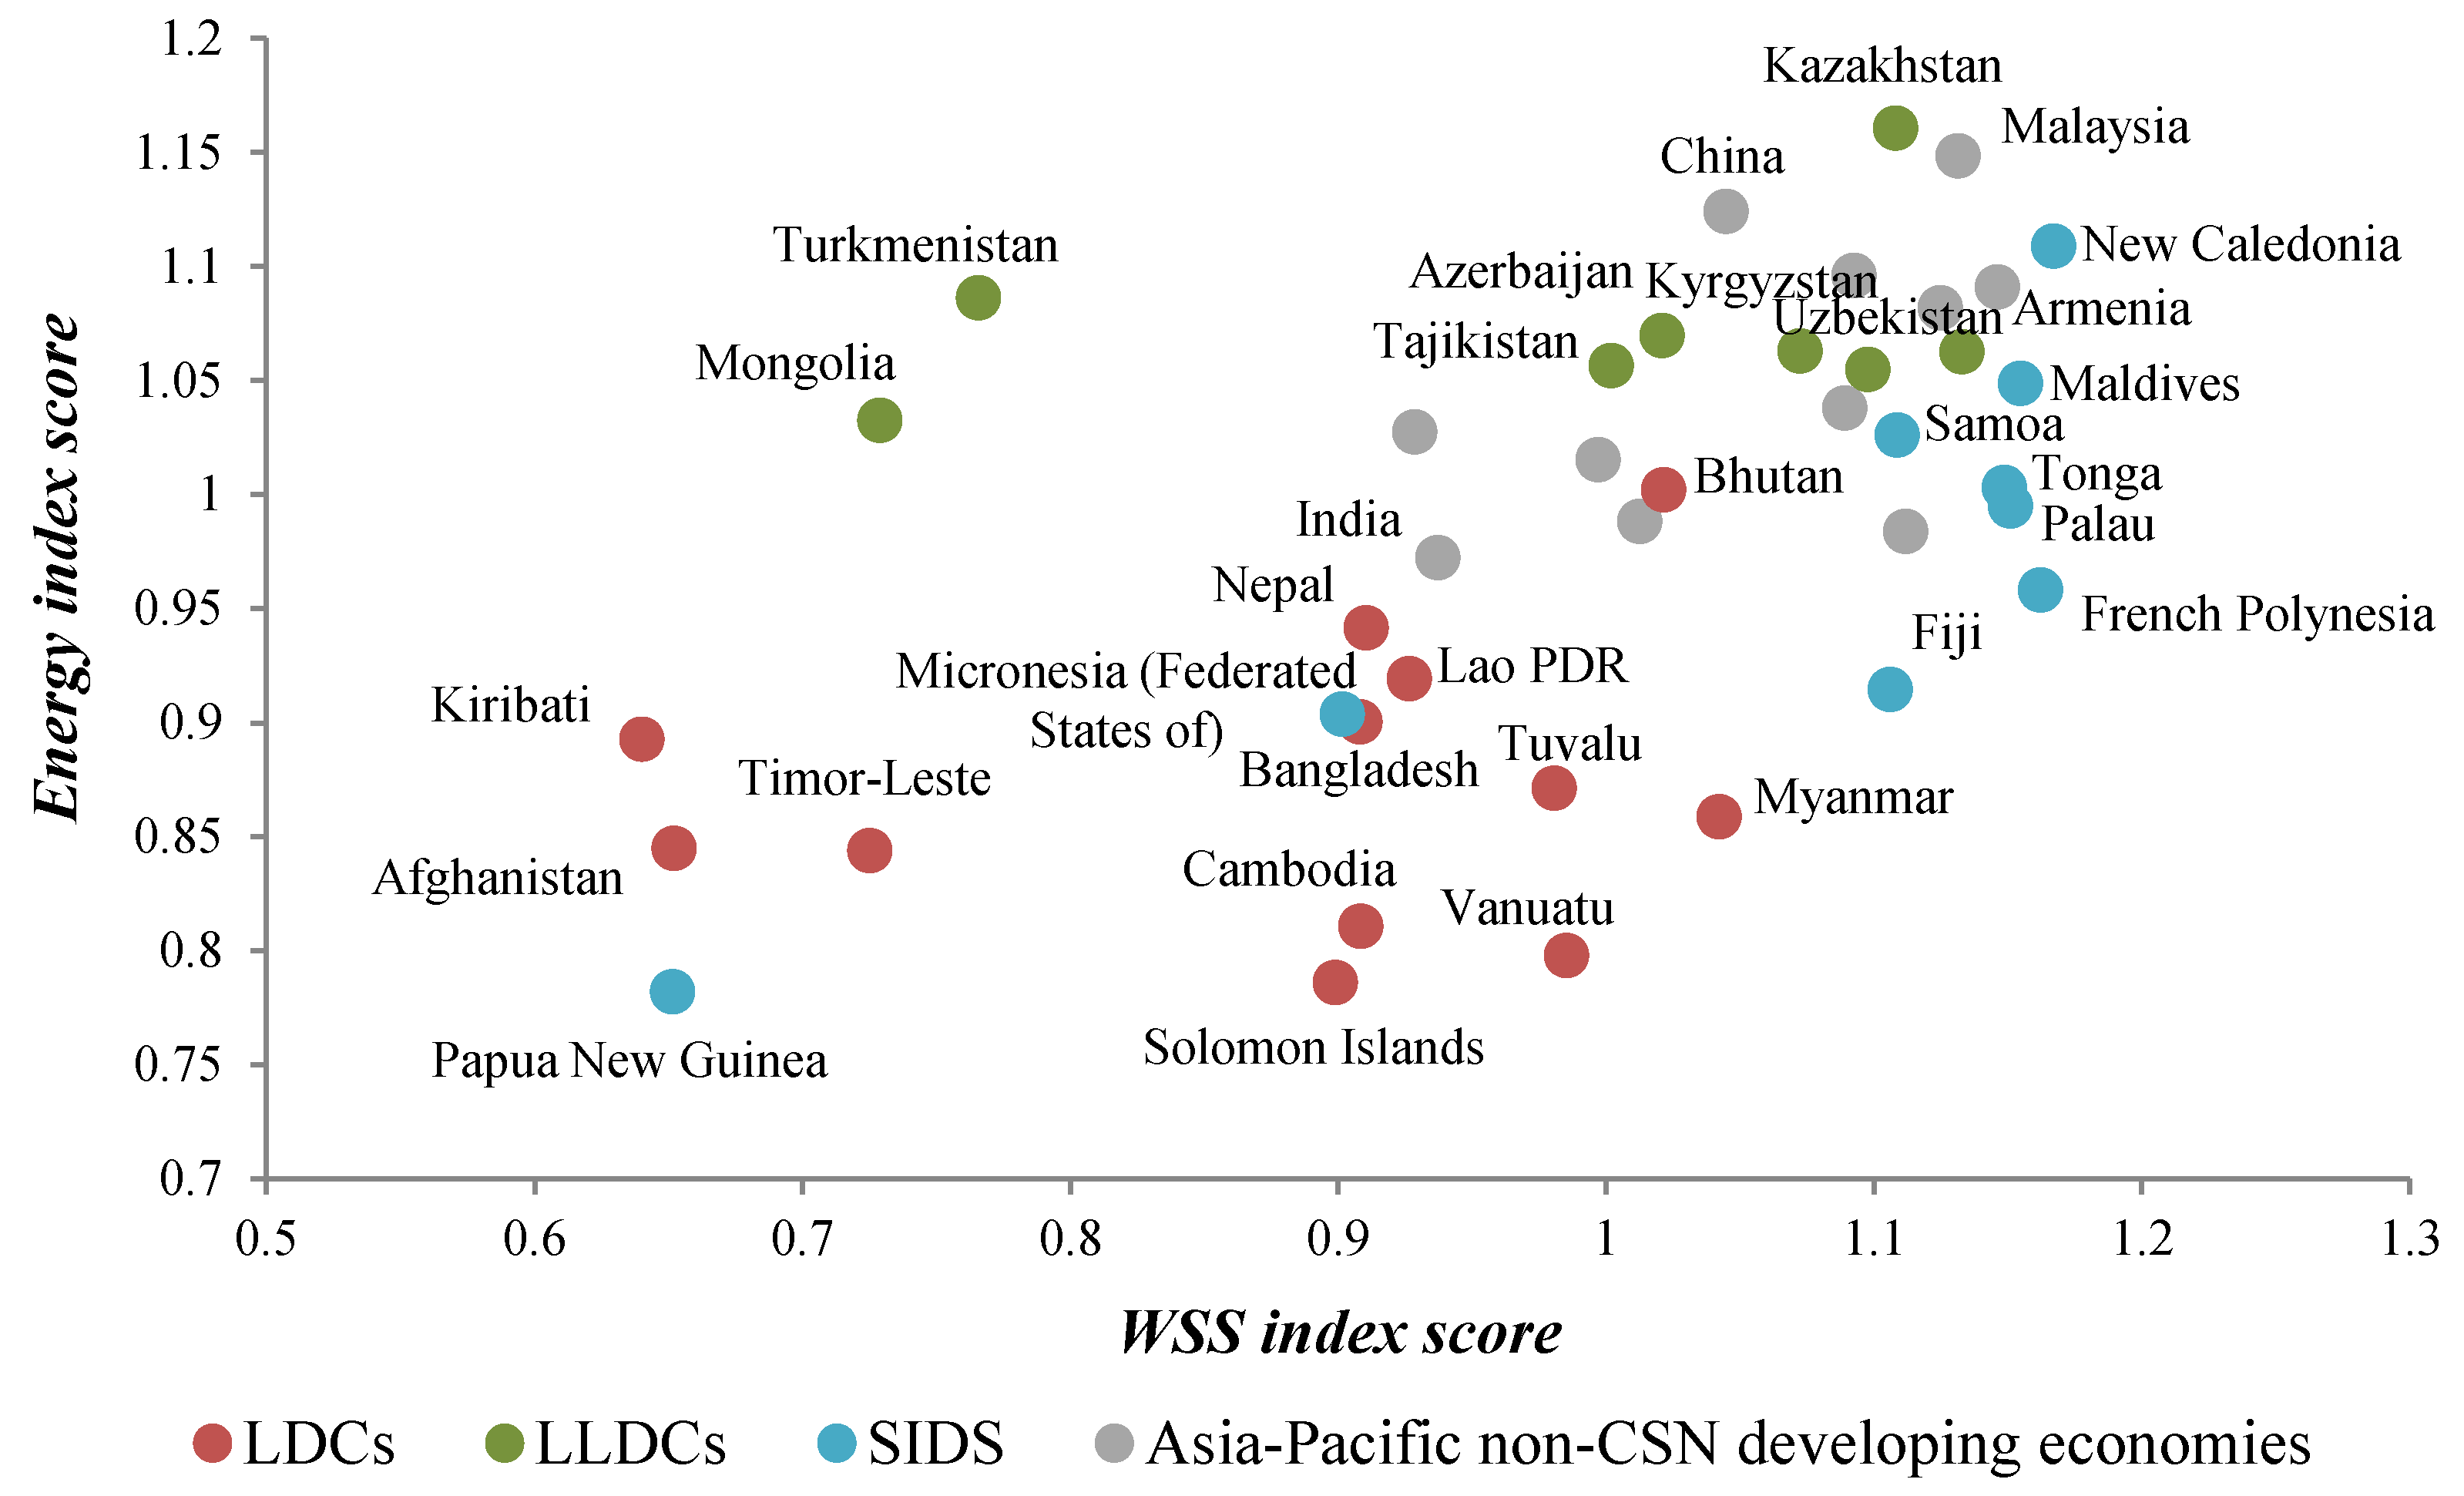
  • Electric power consumption (kWh per capita);
  • Access to electricity (% of population);
  • Fixed telephone subscriptions per 100 people;
  • Mobile telephone subscriptions per 100 people;
  • Access to improved water sources, rural (% of rural population);
  • Access to improved water sources, urban (% of urban population);
  • Access to improved sanitation facilities, rural (% of rural population); and
  • Access to improved sanitation facilities, urban (% of urban population).
Appendix A (Table A1) provides a list of countries and country groupings used in the paper. Detailed definitions and sources of the infrastructure indicators can be found in Appendix B (Table A2).
Table 1 offers a review of access to infrastructure services by presenting simple averages by indicator for each of the three country groups, LDCs, LLDCs, and SIDS, as well as for other Asian developing countries. It reveals that overall access to physical infrastructure is significantly less developed in LDCs than in LLDCs and SIDS, while that in LLDCs and SIDS is still much lower than the average of other Asian developing counties in many aspects. Across the four sectors of infrastructure, LLDCs perform relatively well in transport and energy sectors, while they still have room for improvement in access to water sources and sanitation facilities, particularly in the rural areas. In SIDS, provision of energy infrastructure services should be ameliorated as more than 30 percent of the population still lacks access to electricity. LDCs severely lack access to infrastructure services across all sectors. All three groups share a similar pattern for the WSS sector: the rural population has a significantly lower accessibility to both water sources and sanitation facilities than the urban population.
What is also evident from observing these infrastructure indicators is the significant variations in access to basic services across countries, even within each of the three country groups. To illustrate the high degree of variations, index scores are calculated for each country and for each of the four sectors of physical infrastructure; each of the eleven infrastructure indicators is first standardized to have a mean value of 1 and a standard deviation of 0.15 and then averaged by country and by sector. As an example, Figure 1 presents a scatterplot of the two index scores—one for the energy sector and the other for the WSS sector—of twelve LDCs, eight LLDCs, nine SIDS, and thirteen other Asian developing countries. These countries present a great variety of combinations with regard to accessibility to energy and WSS infrastructure. Across the three country groups, LDCs are all located in the bottom-left part of the graph, which reconfirms the presence of severe infrastructure shortages in both sectors in LDCs. LLDCs are all lined up horizontally on the top part of the graph. This implies that all LLDCs provide decent accessibility to energy infrastructure, relative to the Asia-Pacific developing countries average, while access to WSS infrastructure services varies widely by country. In contrast, most SIDS are scattered vertically on the right part of the graph. This indicates that they hold among the best scores in the WSS sector, but the pace of development in the energy sector is more disparate. The exceptions to this tendency are the Federal States of Micronesia and Papua New Guinea. These two countries have many dispersed islands and archipelagos and may encounter additional difficulty providing access to energy and WSS infrastructure. Other Asian developing countries are all located at the top-right corner of the graph, with little variation of achievements across countries.

3. Literature

A wide range of estimates on infrastructure financing needs has been produced in recent years. For instance, ESCAP (2015b) estimated that the Asia-Pacific developing region would need to mobilize $800–900 billion annually for the provision of transport infrastructure services, ICT, water supply and sanitation, and electricity access. Bhattacharyay (2012) reported that Asia-Pacific will need to spend approximately $8 trillion in infrastructure investment for the period 2010–2020 or equivalent to $800 billion per year in order to maintain current levels of economic growth. Similarly, Fay and Toman (2010) estimated that up to an additional $1.5 trillion will be necessary annually through 2020 to help low- and medium-income countries establish adequate levels of infrastructure. McKinsey Global Institute (2016) assessed that global infrastructure financing requirements for the period 2016–2030 would be around $3.3 trillion annually, 60% above the 2000–2015 trends. Most recently, ADB (2017) estimated that, over the period 2016–2030, developing Asia’s infrastructure investment needs would reach $26 trillion or $1.7 trillion per annum.
Although these studies agree that bridging infrastructure gaps will require massive investment, their estimates vary significantly as they rely upon various assumptions and definitions. The use of different assumptions, for instance, on future infrastructure needs, estimated rates of economic and population growth, assumed increases in rates of urbanization, and policy shocks, necessarily translates itself into wide discrepancies between the estimates. Moreover, as there is no universal database on infrastructure investment, different databases follow their own definitions and cover different aspects of infrastructure investment.
In terms of the methodologies, existing studies can be broadly classified into two categories based on the approaches adopted to estimate infrastructure financing needs: the “top-down” and the “bottom-up” approaches.
The “bottom-up” approach assesses the total infrastructure services demand by reviewing infrastructure investments demand at the project level. The methodology consists of reviewing the implementation costs of individual infrastructure projects and compiling the estimates to obtain the total demand by country and by sector. However, lack of relevant data obscures what is needed at a project level. For instance, data on projects or plans are often not available or confidential so the cost of these projects must be estimated, with varying assumptions based upon costs of past infrastructure projects, which are assumed to be in line with best practice scenarios.
The “top-down” approach quantitatively estimates infrastructure needs at the national level using econometric analysis techniques. This approach follows the works of Fay (2000) and Fay and Yepes (2003) that developed a model to predict future demand for infrastructure, which was later applied in a number of studies, including Bhattacharyay (2012), Ruiz-Nunez and Wei (2015), and ADB (2017). In this approach, the relationships between demand for infrastructure services and economic/demographic variable are established for each sector and extrapolated into the future using predicted growth rates. Once the projections of the infrastructure stock are obtained, standardized unit costs based on international best practice norms are applied to estimate the financing requirements for new infrastructure. However, by construction, such projections rely on unit cost estimates and ignore many national and regional specificities, as it is assumed that what happened in some countries in the past is a good predictor of what might happen in some other countries in the future (Fay and Toman 2010). Despite these caveats, the ‘top-down’ approach still forms the basis for many of the current estimates of multi-country infrastructure financing needs as the data requirements are relatively modest.

4. Methodology for Estimation

A conventional “top-down” approach to forecast infrastructure financing needs is to apply unit capital costs and unit maintenance costs to projected changes of physical infrastructure stock and to existing stock, respectively. However, earlier sections of this paper have pointed out that many LDCs, LLDCs, and SIDS currently lack basic infrastructure, and also that some of them will incur climate-related costs. Thus, the methodology developed in this paper takes into account these additional costs of filling those shortages and adapting to climate change.
The financing needs estimates are calculated using the following steps:
  • Needs of physical infrastructure stocks for each type of infrastructure are projected to 2030 using a dynamic data panel model to meet rising demographic, urbanization, and economic growth rates;
  • Current infrastructure stock shortages are estimated based on the current level of access to each type of infrastructure;
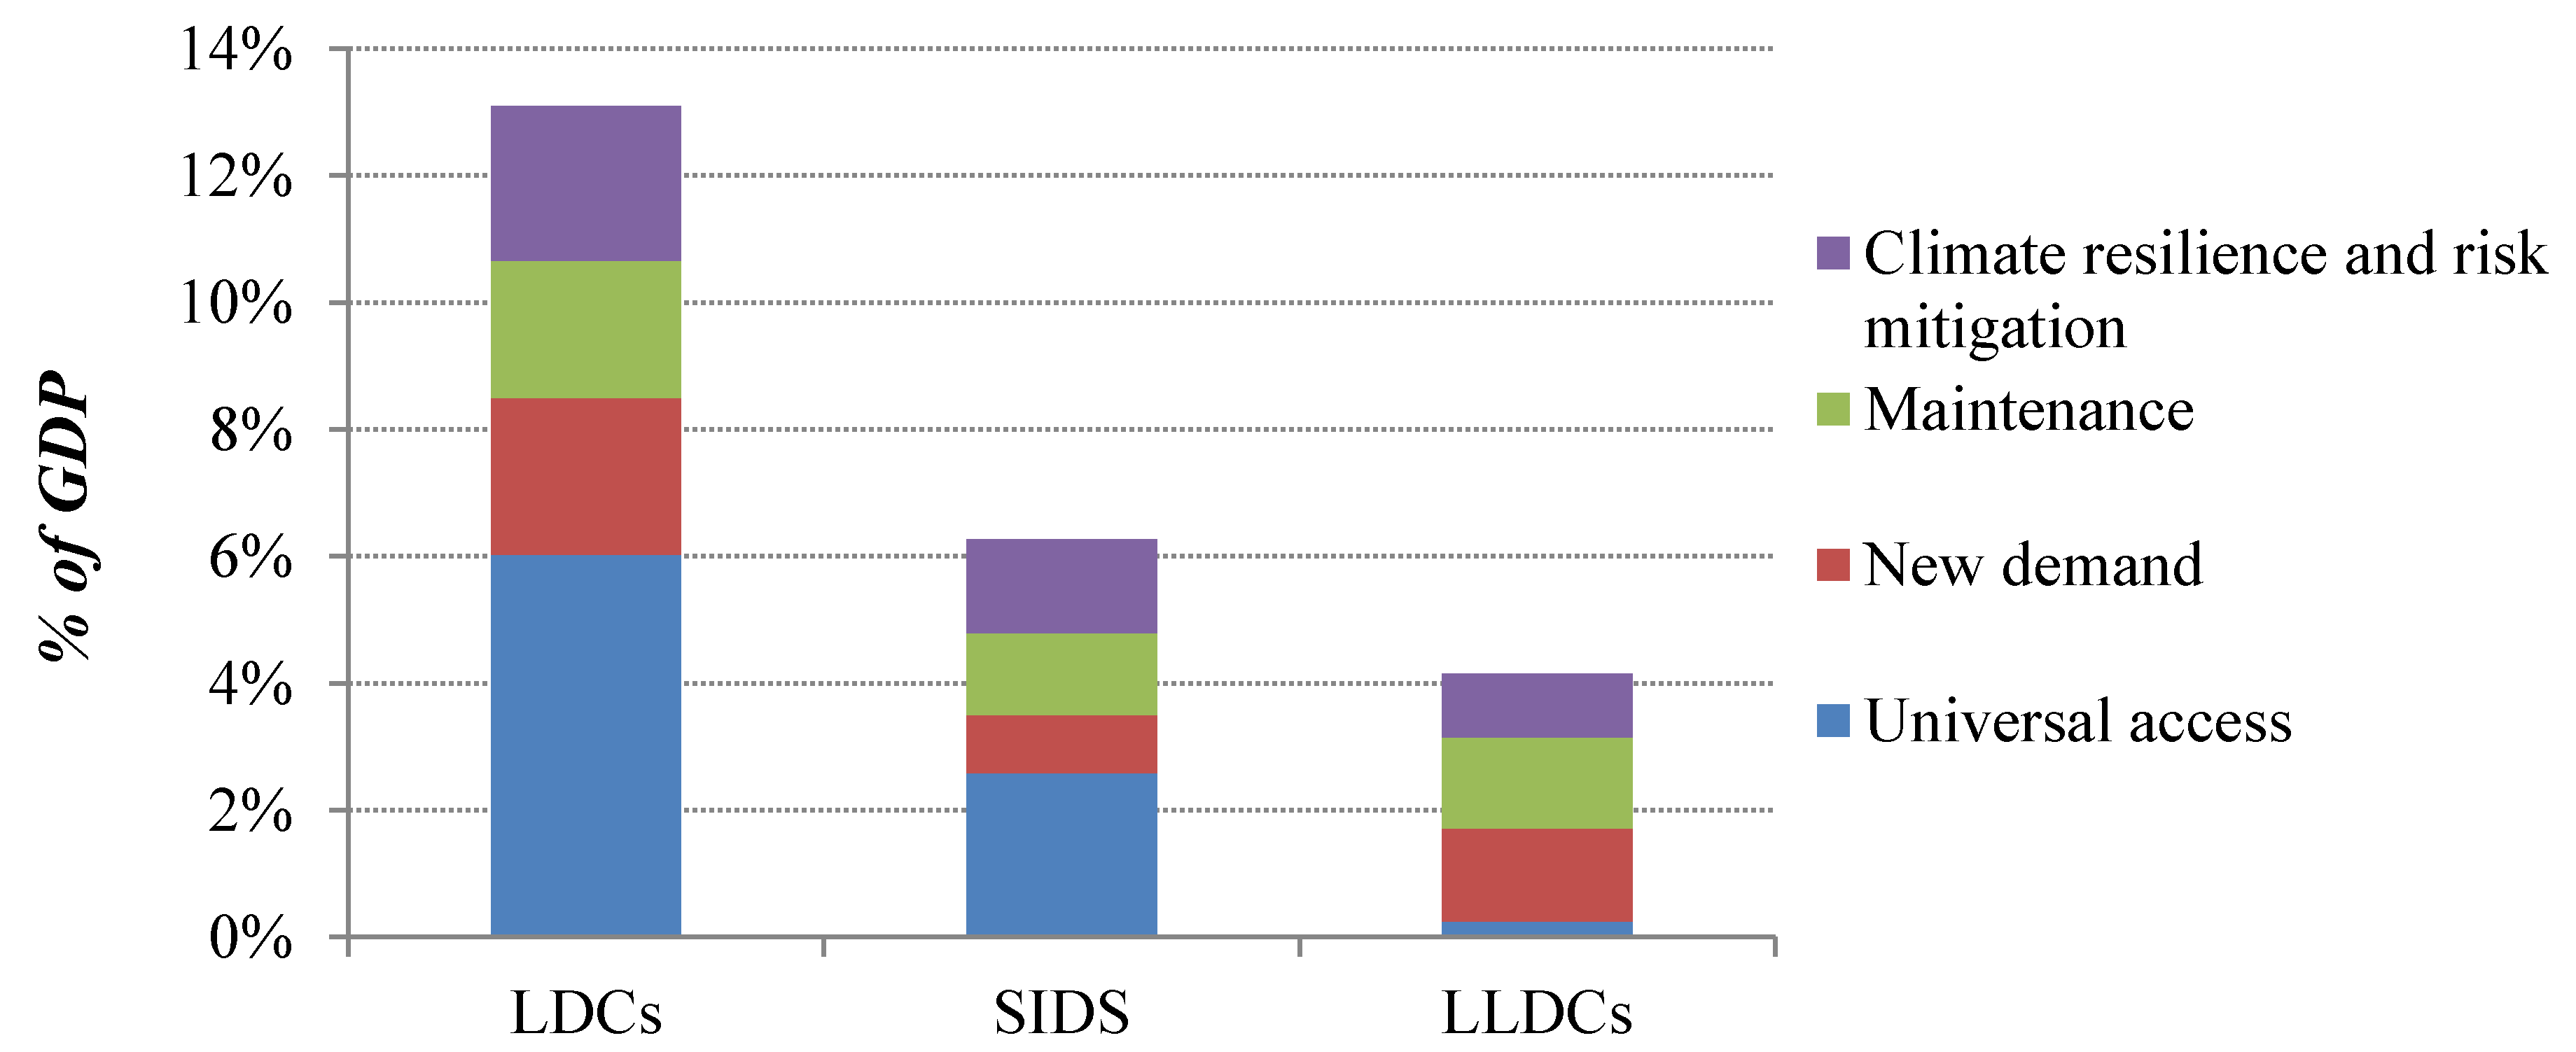
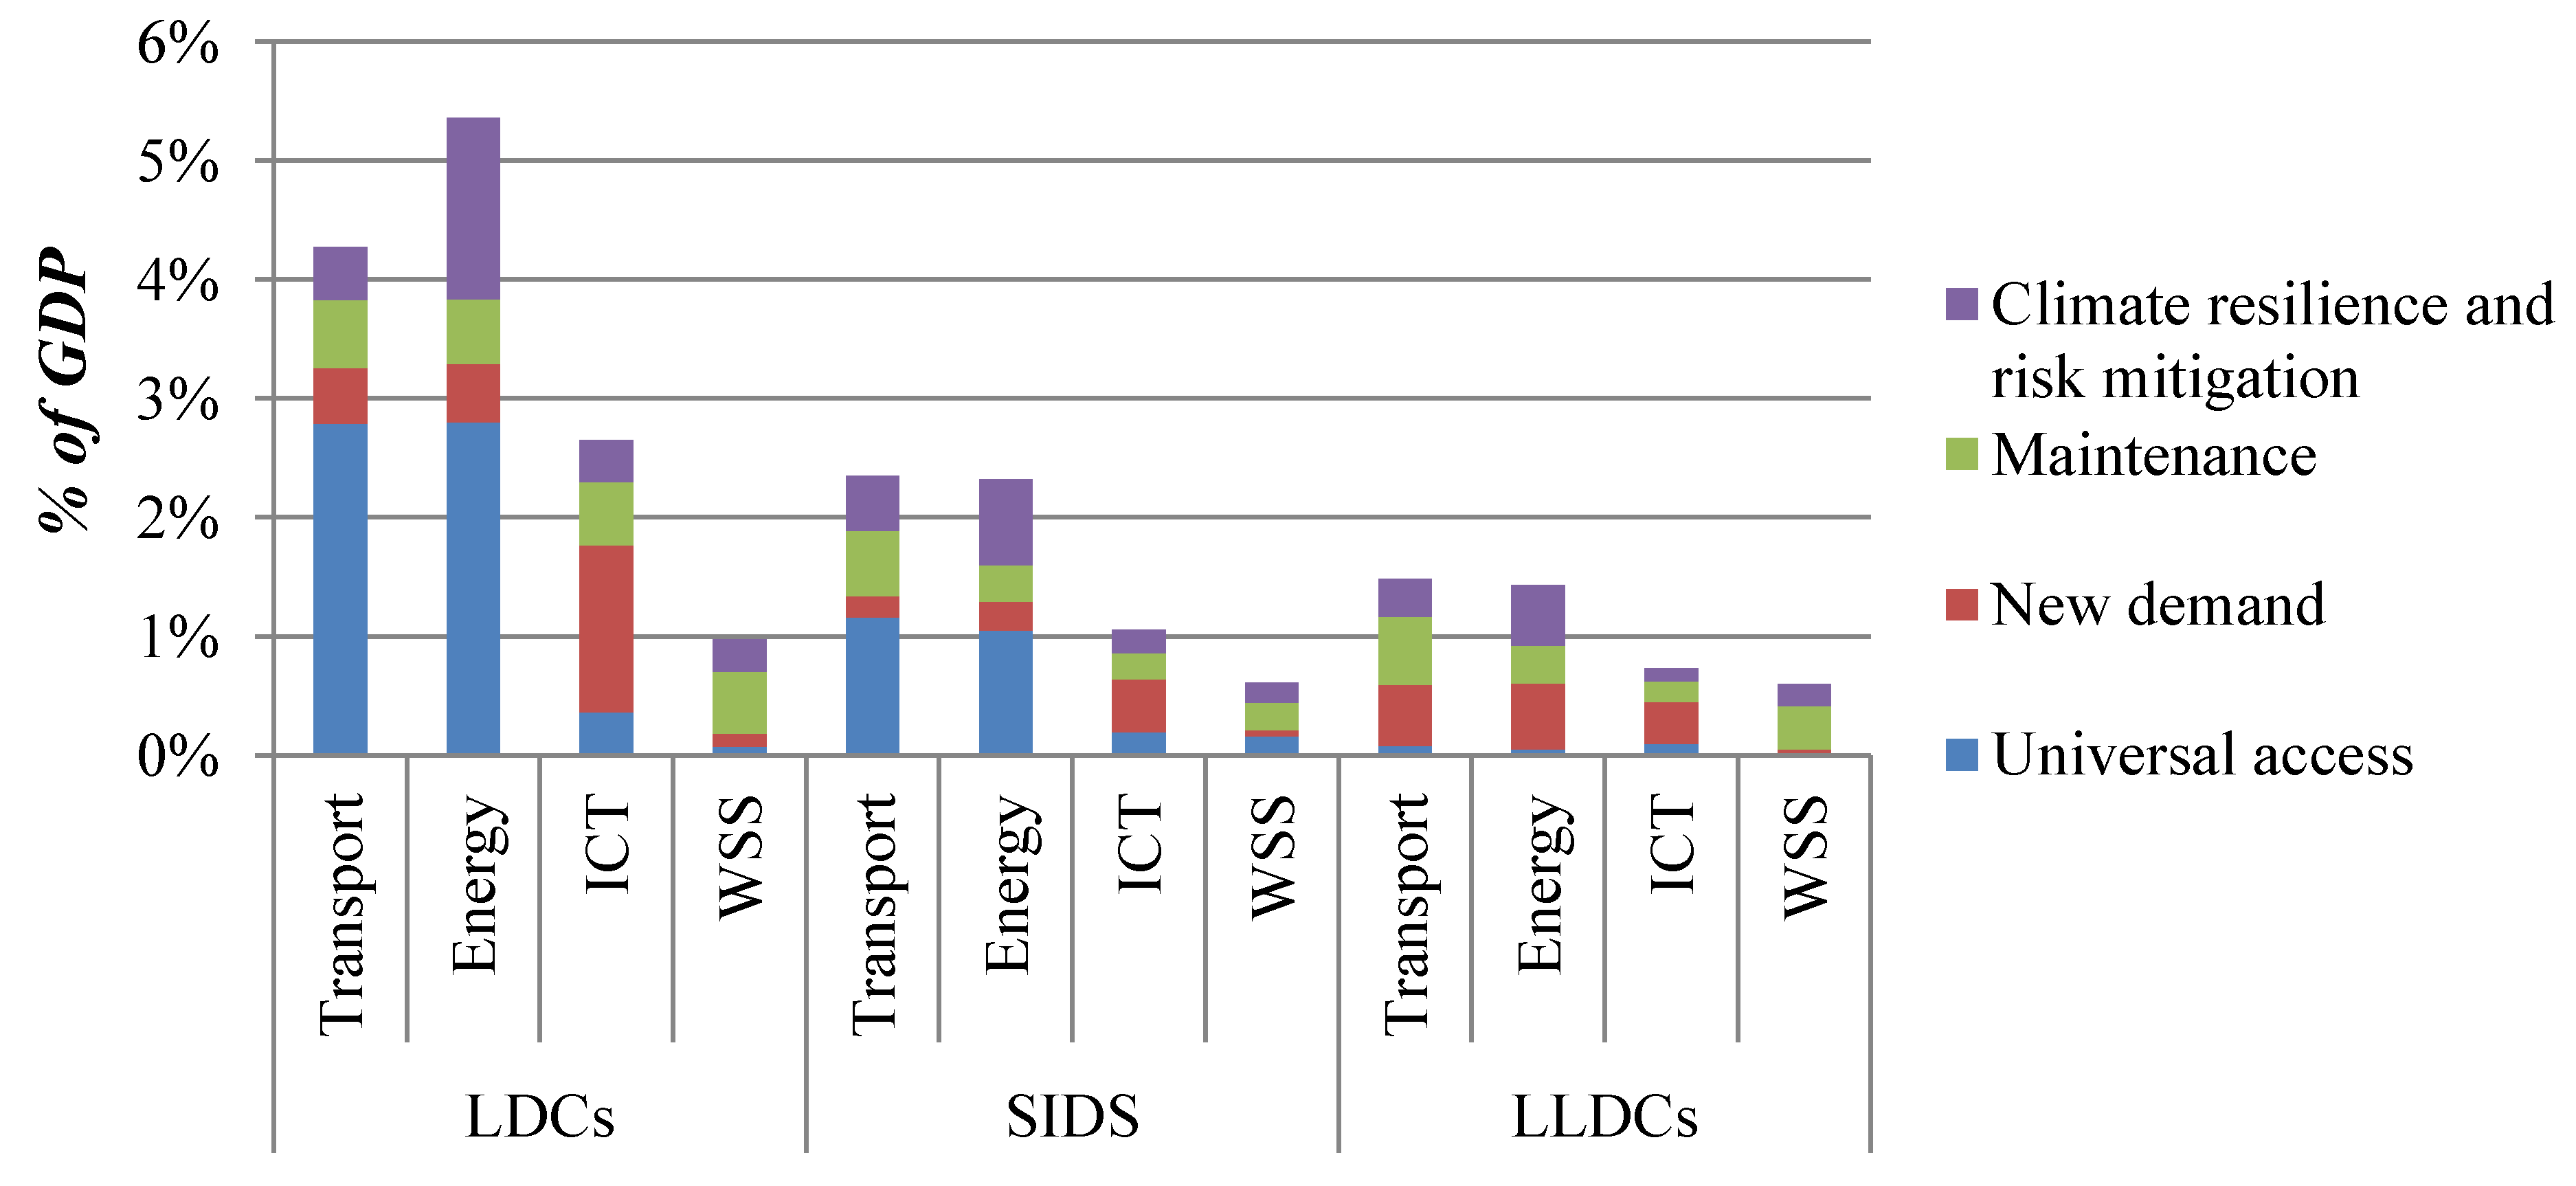
  • Unit costs are applied to the estimated lacking infrastructure stocks, thus calculating the financing requirements induced by the construction of the additional infrastructure facilities to be built by 2030;
  • Maintenance costs of the existing infrastructure stock are added to the previous financial estimate; and
  • Additional costs related to infrastructure climate-proofing and climate change mitigation are added to obtain the final financing needs estimates.
Following a similar methodology to Fay (2000), Fay and Yepes (2003), Bhattacharyay (2012), Ruiz-Nunez and Wei (2015), and ADB (2017), it is assumed that physical infrastructure stock is correlated with several variables including lagged values of the infrastructure stock, gross domestic product (GDP) per capita, shares of agriculture and industrial value-added in GPD, urbanization rate, and population density.
As a result, the annual financing needs by 2030, excluding climate-related considerations, are decomposed and expressed as follows:
F i , t = j F i , t j   and F i , t j = max ( I i , T j I i , t j T t , 0 ) × c i j + I i , t j × m i j + max ( U j I i , T j T t , 0 ) × c i j
where F i , t represents the total annual financing needs for country i at time t; F i , t j indicates financing needs for infrastructure type j; I i , t j is the infrastructure stock of type j in country i at time t; U j denotes the infrastructure stock of type j required to provide universal access; c i j and m i j are the annual unit capital costs and unit maintenance costs of infrastructure of type j in country I, respectively; and T is a targeted time period by which universal access should be provided.
The three terms of F i , t j represent the first three components of annual financing needs, respectively; the first term (1) indicates the costs induced by the construction of infrastructure stock to meet the rising demand driven by demographic evolution, economic growth, and urbanization by 2030; the second term (2) represents the maintenance cost of the existing stock of infrastructure; and the third term (3) signifies the additional financial cost required to palliate the existing infrastructure shortages by 2030. The fourth component of annual financing needs, which is associated with additional costs required for climate change mitigation and adaptation, will be factored in into each of the three terms of F i , t j through the annual unit capital cost c i j and unit maintenance cost m i j .
The same set of infrastructure indicators reviewed in Section 2 is used for estimating infrastructure financing needs. These indicators range from 1990 to 2015, except for that covering mobile phone subscriptions, which only starts in 2004. Because of limited availability of data, three-year-averages have been used instead of yearly data. This transformation also captures the fact that infrastructure development is a slow process. Linear intra/extrapolations have been performed to fill in the missing values and thus obtain a balanced data panel.
The methodology developed in this paper first estimates the component of financing needs that correspond to the growing demand for new infrastructure based on the “top-down” approach described above. This is done by projecting the demand for infrastructure to 2030 under the assumption that infrastructure services are demanded both as consumption goods by individuals and as inputs into the production process by firms, in accordance with the work of Fay (2000), Fay and Yepes (2003), Bhattacharyay (2012), and Ruiz-Nunez and Wei (2015). Once the new demand is projected to 2030, financing needs can be calculated by applying it to a set of unit cost estimates.
The projection of each indicator to 2030 is performed using an Ordinary Least Squares (OLS) regression with fixed effects on a sample of 71 developing economies, of which 29 are Asia-Pacific LDCs, LLDCs, and SIDS. In theory, the use of instrumental variables (IV)/generalized method of moments (GMM) estimator would be more appropriate than OLS given the presence of the lagged variable in the model. However, ADB (2017) found that its explanatory power was actually lower than OLS and that the performance in out-of-sample forecasting was uneven and unsatisfactory. The future infrastructure demand can thus be described by the following process:
I i , t j = α 0 j + α 1 j I i , t 1 j + α 2 j y i , t + α 3 j A i , t + α 4 j M i , t + α 5 j U i , t + α 6 j P i , t + α 7 j D i j + α 8 j t ,
where I i , t j is the infrastructure stock of type j needed in country i at time t; y i , t , A i , t , and M i , t represent the GDP per capita and shares of agriculture and manufacture value added in GDP, respectively; U i , t and P i , t stand for the urbanization rate and the population density, respectively; D i j is the country fixed effect; and t is a time trend, used to capture time effect. All the variables in the equation are expressed in natural logarithm to linearize the model.
The data sources of the independent variables and their projections are displayed in Appendix C (Table A3) and Appendix D (Table A4), respectively, and the regression results can be found in Appendix E (Table A5). Because of the absence of future estimations for gross domestic product (GDP) composition, the shares of agriculture and manufacture value added in GDP have been projected using basic linear extrapolations. Table 2 presents the unit costs employed in the paper. For transport, the estimated unit costs for paved roads, unpaved roads, and railways per kilometer are obtained from various studies, such as Collier et al. (2015), ADB (2012), Fay (2000), Ruiz-Nunez and Wei (2015), and Eliste and Ivailo (2015).
The estimates for annual unit capital costs for electricity generation are based on World Bank and International Energy Agency (IEA) (2015) and IEA (2016). It is assumed that newly installed generating capacity would use an energy source that is used predominantly in respective countries. For instance, in Afghanistan, Bhutan, Lao People’s Democratic Republic (Lao PDR), Kyrgyz Republic, Nepal, and Tajikistan, where more than 80% of electricity is generated from hydroelectric sources, it is assumed that new capacity would be also based on hydroelectric power. Similarly, in Azerbaijan, Bangladesh, Kazakhstan, Maldives, Mongolia, Solomon Islands, Tonga, Vanuatu, Turkmenistan, Kiribati, Palau, Tuvalu, New Caledonia, Timor-Leste, and Federated States of Micronesia, where more than 80% of electricity is generated from coal, gas, or oil sources, new capacity would be also fossil fuel-based. Countries in which electricity is generated from mixed sources are assumed to face the averages of the costs faced by the first two groups. The data on the energy mix for individual countries’ electricity generation are taken from United Nations Industrial Development Organization (UNIDO) and International Center on Small Hydro Power (ICSHP) (2013) and IEA (2014). The unit cost for providing access to electricity is the unit costs for electricity generating capacity multiplied by the average power consumption of people with access to electricity. This calculation makes the estimates for access to electricity country-specific, depending on the current composition of energy sources for electric power generation and the projected power consumption.
Unit costs for fixed and mobile telephone per subscription are borrowed from Ruiz-Nunez and Wei (2015) and ADB (2017). While we assume the same unit cost for all kinds of fixed telephone subscription, different unit costs are estimated for urban and rural areas’ mobile telephone subscriptions, which enables the country-level estimation when an individual country’s urbanization ratios are applied. For WSS indicators, country-level unit costs estimated by World Health Organization (WHO 2012) are applied. For water supply, a household connection and piped and treated household water supply for all are assumed, respectively, in rural and urban areas. For sanitation, a provision of a septic tank is assumed in a rural area, while sewerage with treatment for all is considered for an urban area. The unit costs used for Kiribati, Federated States of Micronesia, New Caledonia, Palau, and Tuvalu are unavailable in the original study, so the averages of SIDS are applied.
The second component of financing, which is needed for maintenance of existing infrastructure, is calculated by applying depreciation rates to the predicted total value of infrastructure stocks. Based on various sources, the paper assumes a depreciation rate of 2% for paved roads, rail lines, 1% for unpaved roads, 2–3% for power, depending upon current energy mix, and 3% for telecommunication. For water and sanitation, depreciation rates vary across countries, depending upon the technologies used and whether the facilities are located in rural or urban areas. While rates of 2–13% for water and 10–17% for sanitation are assumed for most countries, some LDCs and LLDCs face substantially higher rates of up to 48% for water and up to 39% for sanitation (WHO 2012).
The third component of financing that is needed to fill existing infrastructure shortages is calculated as the cost of reaching the “unserved” by 2030, based on the same set of unit costs used to estimate the first component. While there is no obvious ‘optimal’ level of infrastructure that can be used to define the level up to which infrastructure gaps need to be filled, this framework uses as a normative target universal access to electricity and water and sanitation by 2030. Thus, for access to electricity and for the four indicators of WSS, the targets are to provide everyone with access to these types of infrastructure by 2030. For electricity, the targeted annual power consumption per capita is defined using the maximal value between countries’ 2030 power consumption projection and the current average of other Asian developing economies (3091 kWh per capita annually). The number of people that will not have access to these services in 2030 is calculated based on the projected stock of infrastructure obtained above and the projection of population and urbanization rate.
Because defining universal access to public transportation and telecommunications is less obvious, the average penetration rates or densities in other Asian developing countries are used as the normative target for LDCs, LLDCs, and SIDS. Thus, the target for ICT and transport indicators is to reach the average level of other Asian developing countries in 2015 by 2030. The amount of stock needed to reach this objective is calculated for each country by taking the difference between the average infrastructure stock of other Asian developing countries in 2015 and the previously projected values of infrastructure indicators in 2030. The same set of unit capital cost assumptions presented in Table 1 is then applied to get the amount needed to provide universal access by 2030.
The last component, related to climate change, covers three elements: (1) additional capital and maintenance costs of energetic transition to renewable sources for electricity generation; (2) costs of protecting infrastructure against changes in rainfall and temperature due to climate change; and (3) costs of protecting infrastructure in SIDs from extreme weather events.
The first element is to access additional financing needs for new electricity-generating capacity to be from green sources only. While the first three components of financing needs are estimated based on the assumption that countries will continue to rely on electricity generation sources that they are primarily reliant on at the moment, this additional element considers the case where some countries face higher unit costs. Because hydropower is clean energy, additional financing needs to adopt renewable energy technologies will be incurred only by a group of countries that predominantly use traditional fuels and mixed energy sources, which cost 1400 and 1800 USD per kW of generating capacity, respectively. Considering the fact that hydropower is among the most prevalent renewable energy technologies today, and also that hydropower is usually more affordable than other renewable energy technology types, the estimation of this element applies the hydropower unit cost, namely 2200 USD per kW of generating capacity, to all new provisions of electricity.
It should be noted, however, that some countries, including Kiribati, Maldives, Palau, Tonga, and Tuvalu, have limited hydropower potential and would necessarily face higher costs for shifting their current energy mix towards renewables such as solar and wind. For example, the Model for Electricity Technology Assessment, developed by the Energy Sector Management Assistance Program of the World Bank1, assumes that solar/wind technologies would cost more than twice as much as hydropower electricity generation, even after taking into account the recent cost reduction in these types of clean energy technology. In this light, the estimation of this component of financing needs should be interpreted as a lower bound of the actual requirements for countries with limited hydropower potential.
The second element is associated with the needs to integrate climate resilience into infrastructure. It is assumed that climate proofing will increase capital and maintenance costs of providing infrastructure. Taking paved roads as an example, activities such as upgrading concrete mix and improving the structure of drainage to strengthen their capacity to manage heavy rainfalls would increase the capital investment cost. Following ADB (2014), this paper assumes that at least 5% of total capital investment is required as the cost of protecting infrastructure against changes in rainfall and temperature. Some atoll countries, such as the Federated States of Micronesia and Kiribati, face higher costs, which climb up to 21% of total expenditures. Besides, 0.5–1.5 additional percentage points of maintenance cost for new and existing infrastructure is also employed for all countries considered. Finally, the third element is to incorporate costs of protecting infrastructure in SIDS from increased tropical cyclone wind intensity. Following the World Bank (2016), this paper estimates the adaptation cost to be 5% of replacement cost. While sea level rise, coastal erosion, and sea and river flooding induced by climate change do require huge amount of investment to mitigate losses, the estimation of related costs would be beyond the scope of this study, as the various engineering solutions such as sea walls building and beach nourishment cannot be incorporated into the discussion of four infrastructure sectors. Thus, the actual financing requirements in SIDS concerning climate resilience would be much higher than the estimation provided in this paper.

5. Results

The estimation results indicate that financing requirements to cover the four components from 2018 to 2030 in the Asia-Pacific LDCs, LLDCs, and SIDS would be more than $700 billion or $57.6 billion a year in 2010 dollars (Table 3). This represents a weighted average of 8.1% (or a simple average of 8%) of the total GDP per annum, which exceeds current levels of infrastructure funding of 5–7% of GDP2. Across the three country groups, financing needs of LDCs are by far the largest, both in terms of volume ($39.6 billion) and share of GDP (13.3% of GDP). Those of LLDCs and SIDS are estimated at approximately 4.3% and 6.4% of their respective GDP. At the sectoral level, the energy sector accounts for the largest share of overall investment needs, while the needs are also sizeable for transport infrastructure in LDCs and SIDS. Detailed results for each country are presented in Appendix F (Table A6).
Figure 2 and Figure 3 present the composition of annual financing needs for each of the three country groups and their break down by sector. They indicate that the largest share of infrastructure financing needs in LDCs and SIDS arise from their current infrastructure shortages, particularly in the transport sector and the energy sector. In Afghanistan, Nepal, and Solomon Islands, the provision of universal access to basic infrastructure services accounts for more than 50% of the total estimated financing requirements. These findings, while justifying the inclusion of this component of financing needs into the estimation framework, indicate that provision of universal access to basic infrastructure services would require large outlays of resources in these counties.
For LLDCs, the results suggest that more than one-third of the spending should be allocated to effectively maintain existing assets. SIDS also face large financing needs for maintenance of transport infrastructure and additional needs for the development of more sustainable and climate-resilient infrastructure. The former finding is closely in line with Pacific Region Infrastructure Facility (2013), in which the cost of infrastructure maintenance was found to be high and one of the major financing challenges for SIDS.
On average, financing equivalent to 1.7% of GDP will be required to achieve energetic transition and to protect infrastructure against extreme weather events. The results of LDCs (2.3% of GDP) are mainly driven by countries that are also SIDS, particularly Timor-Leste and Kiribati, where financing needs to cover the climate-change related component represent an additional 4.4% and 3.7% of GDP, respectively. In LLDCs, the energy sector accounts for almost half of this component, reflecting the fact that more than 70 percent of electricity is generated from coal, oil, or gas sources in most of these countries (World Bank 2017).

6. Policy Implication

Infrastructure development has traditionally been financed with domestic public funds. Public finance is crucial in providing public services that are necessary for people’s daily lives, such as social infrastructure, water and sanitation facilities, and basic transportation infrastructure. While improved tax policy and administration would be instrumental in expanding the fiscal space of governments, to address infrastructure shortages, these countries will need to go beyond mobilizing traditional domestic public resources and tap into other sources of finance by, for instance, leveraging the private sector, exploring various models of public–private partnerships, improving access to capital markets, and utilizing new infrastructure funds and global initiatives such as climate finance. Nevertheless, the ability of the Asia-Pacific LDCs, LLDCs, and SIDS to utilize various forms of financing vary greatly, according to their economic size and the various stages of economic development. Therefore, there cannot be a one-size-fits-all approach to infrastructure financing, and the individual financing approaches for each country need to be assessed on a case-by-case basis, with pragmatic solutions that are best suited to the financing capacity of the country.
Table 4 shows individual country’s current level of infrastructure investment coming from the three major financing sources. If we look at the countries with available data, except for Bangladesh, Nepal, Tajikistan, Kyrgyzstan, and Uzbekistan, we find that most countries are investing near the required amount of investment. If the flow is continued, this implies that it is possible for the countries to achieve decent and inclusive infrastructure development with further government reforms and development of the public–private partnership. As already explained above, in-depth individual case studies are needed for those who have significant funding gaps, but a straightforward analysis based on Table 4 indicates that Bangladesh, Nepal, and Tajikistan would need more external assistance as they need a huge amount of funding, while it is difficult to double the fiscal space of governments. As for Kyrgyzstan and Uzbekistan, public investment is relatively low, while their tax-to-GDP ratios are higher than the Millennium Development Goals (MDGs) suggested level of 18% (ESCAP 2017). For that reason, these two countries could consider increasing the amount of public investment while exploring other financing mechanisms as well.
Although the overall amount of investment in most countries is quite satisfactory, there is no available data showing the sectoral breakdown of the investments made. Our estimation shows that certain sectors need more investment than others, but focusing entirely on the total amount of the investment does not guarantee that different sectors are receiving a sufficient amount of investment. Practically, governments of these countries will necessarily have to prioritize which sectors are to be developed. This may be based upon where infrastructure gaps are greatest or the impact in terms of cross-sectoral synergy potential or expected sustainable development outcomes. For example, by focusing on providing a stable electricity supply (the area in which the financing needs are found to be greatest for LDCs), LDCs could accelerate the process of expanding productive capacity, which would facilitate a gradual shift from labor-intensive to capital-intensive activities. An ICT focus of SIDS could provide a robust way to optimize their infrastructure portfolio. Because ICT infrastructure could generate certain review streams, the private sector can be engaged in the process, while public funds can be used for development of infrastructure with high environmental or social returns, such as WSS, where the private sector does not usually play a major role without government intervention. For LLDCs, priority could be assigned to improving transport infrastructure that connects the missing links with neighboring countries and removes the bottlenecks to reduce trade costs. This could also boost export earning that could be used, in turn, to implement energy and WSS infrastructure projects that are necessary to make progress towards broad-based sustainable development.

7. Conclusions

This paper presented estimations of infrastructure financing requirements over 2018–2030, accounting for needs to close existing infrastructure gaps, keep up with growing demands for new infrastructure, maintain existing infrastructure, and mitigate the vulnerability of infrastructure to climate-related risks. Based on the assessments for 29 countries for which relevant data are available, the paper finds that the Asia-Pacific LDCs, LLDCs, and SIDS would need to spend on average 8.1% of their GDP per annum to cover the above four components. Given the limited resource availability and the large scale of investment needed, these economies will face significant challenges in accessing sufficient and appropriate financing from public and private, as well as domestic and external, sources.
The estimates presented in this paper are higher than those of other studies in Asia-Pacific (Table 5), such as 6.5% of GDP estimated by Bhattacharyay (2012) and 5.9% of GDP by ADB (2017). These discrepancies in estimates can be largely explained by the difference in countries of study interest, as well as the difference in components of financing needs considered. This paper, focusing only on the region’s LDCs, LLDCs, and SIDS, did not include high- or most of upper-middle income countries. Because, in general, the lower the income level of a country, the higher the infrastructure financing needs, our estimates should be, by default, larger than other studies that provide region-wide or world-wide comprehensive assessments. In addition, the estimation of this study included financing needs required to provide universal access, which turned out to be the largest financing component for LDCs and SIDS. In relatively rich countries, this component is usually assumed to be sufficiently small, and excluded from analysis. In addition, the climate change-proofing and mitigation component is included in our estimates, whereas such consideration is not taken into account in the studies of Ruiz-Nunez and Wei (2015) and Bhattacharyay (2012). Table 5 below summarizes the main limitations of the existing literature on economic infrastructure financing in Asia-Pacific that our paper addresses.
While the methodology proposed in this paper has many limitations, as in other similar studies, it builds on and pushes forward the existing knowledge on the topic. In the context of estimating financing needs for LDCs, LLDCs, and SIDS, the methodology of this paper is more refined than in other existing studies in the following ways: (1) current infrastructure shortages that account for the main financing component in LDCs and SIDS are taken into consideration, (2) all independent variables are projected to 2030 when estimating future demand, (3) unit costs for the water and sanitation and energy sectors are calculated at the country level, and (4) climate change-related components are included whereas this dimension was missing from the literature until the 2017 ADB study. The paper presents several insights as to where and how much financing is needed for infrastructure development in “small” economies of the Asia-Pacific region. LDCs, while recording remarkable progress in some countries in recent years, still require large outlays of resources to provide basic infrastructure services for all. LLDCs and SIDS are faced by high costs of maintenance, mostly in their transport sector. Finally, the upgrading of infrastructure for climate-proofing and climate adaption would require additional investment across the region and sectors, but especially in countries with a high reliance on fossil fuels for electricity generation, as well as in those that are susceptible to climate change impacts and other extreme weather events. This paper estimates required investments for “more” infrastructure, but it does not consider “better” quality infrastructure or improved efficiency. While we consider the unit cost of building 6 m wide road, basic railway, 3G connection, and so on, in our estimation, the required financing would be much higher if 7 m wide road, advanced railway, or 4G connection is to be developed. Considering the high financing requirements, governments would need more strategy as they finance infrastructure projects.

Author Contributions

This paper is conceptualized by Y.T., and its methodology and first draft is prepared by C.B., L.F. and Y.T. C.B. performed data curation, and Y.T. edited the final draft.

Funding

This research received no external funding.

Acknowledgments

The authors would like to thank Alberto Isgut, Oliver Paddison, Vatcharin Sirimaneetham and Mathieu Verougstraete for useful comments and suggestions on a previous version of this article. This article was initially prepared as a background document for the Asia-Pacific Countries with Special Needs Development Report 2017 (ISBN: 978-92-1-120746-9). The results reported in this article are not entirely identical to those previously reported in the above publication due to differences in sample countries and time periods covered by the study as well as differences in the methodology for calculating regional aggregates. Part of the article was written while the first and second authors were with the United Nations Economic and Social Commission for Asia and the Pacific. The views expressed in this article are those of the authors and should not necessarily be considered as reflecting the views or carrying the endorsement of the United Nations.

Conflicts of Interest

The authors declare no conflicts of interest.

Appendix A

Table A1. List of countries and country groups. LDCs—least developed countries; LLDCs—landlocked developing countries; SIDS—small island developing States.
LDCsLLDCsSIDSOther Asian Developing CountriesDeveloping Countries
Afghanistan *ArmeniaFijiChinaAlgeria
BangladeshAzerbaijanFrench PolynesiaIndiaArgentina
Bhutan *KazakhstanMaldivesIndonesiaBenin
CambodiaKyrgyzstanMicronesiaIranBotswana
Kiribati **MongoliaNew CaledoniaMalaysiaBrazil
Lao PDRTajikistanPalauPakistanCameroon
MyanmarTurkmenistanPapua New GuineaPhilippinesChile
Nepal *UzbekistanSamoaRepublic of KoreaColombia
Solomon Islands **TongaSingaporeCote d’Ivoire
Timor-Leste **Sri LankaEgypt
Tuvalu **ThailandGabon
Vanuatu **TurkeyGhana
Viet NamJordan
Kenya
Mexico
Morocco
Mozambique
Namibia
Nigeria
Paraguay
Peru
Saudi Arabia
Senegal
South Africa
Tunisia
Uruguay
Yemen
Zambia
Zimbabwe
Notes: (*) For simplicity, LDCs that are also LLDCs (Afghanistan, Bhutan, and Nepal) belong to the LDC group only. (**) Similarly, LDCs that are also SIDS (Kiribati, Solomon Islands, Timor-Leste, Tuvalu, and Vanuatu) belong to the LDC group only. In this way, these three groups are mutually exclusive (non-overlapping).

Appendix B

Table A2. Definition and sources of the infrastructure indicators. ADB—Asian Development Bank; CIA—Central Intelligence Agency; IEA—International Energy Agency.
Type of Physical InfrastructureName of IndicatorDefinition/Sources
TransportPaved roads (total route km per 1000 people)Paved roads are those surfaced with crushed stone (macadam) and hydrocarbon binder or bituminized agents with concrete or with cobblestones.World Bank Development Indicators, ADB, CIA World Factbook
Unpaved roads (total route km per 1000 people)Total road network excluding the paved road network.World Bank Development Indicators, ADB, CIA World Factbook
Rail lines (total route km per 1,000,000 people)Rail line is the length of railway route available for train service, irrespective of the number of parallel tracks.World Bank, Transportation, Water, and Information and Communications Technologies (ICT) Department, Transport Division.
EnergyPower consumption (kWh per capita)Electric power consumption measures the production of power plants and combined heat and power plants less transmission and other losses and own use by heat and power plants.IEA Statistics, Organisation for Economic Co-operation and Development (OECD)/IEA
Access to electricity (% of population)Access to electricity is the percentage of population with access to electricity.World Bank, Sustainable Energy for All (SE4ALL) database from World Bank, Global Electrification database.
ICTFixed telephone subscriptions per 100 peopleFixed telephone subscriptions refers to the sum of active number of analogue fixed telephone lines, voice-over-IP (VoIP) subscriptions, fixed wireless local loop (WLL) subscriptions, Integrated Services Digital Network (ISDN) voice-channel equivalents, and fixed public payphones.International Telecommunication Union, World Telecommunication/ICT Development Report and database.
Mobile telephone subscriptions per 100 peopleMobile telephone subscriptions refers to the subscriptions to a public mobile telephone service and provides access to Public Switched Telephone Network (PSTN) using cellular technology. This should include all mobile cellular subscriptions that offer voice communications.
Water supply and sanitation (WSS)Access to improved water sources, rural (% of rural population)The improved drinking water source includes piped water on premises (piped household water connection located inside the user’s dwelling, plot or yard), and other improved drinking water sources (public taps, standpipes, tube wells, etc.).World Bank Development Indicators
Access to improved water sources, urban (% of urban population)
Access to improved sanitation facilities, rural (% of rural population)Improved sanitation facilities include flush/pour flush, ventilated improved pit (VIP) latrine, pit latrine with slab, and composting toilet.
Access to improved sanitation facilities, urban (% of urban population)

Appendix C

Table A3. Definition and sources of the independent variables. GDP—gross domestic product.
Name of indicatorSources
GDP per capita (constant 2010 US$)GDP in constant 2010 U.S. dollars, comes from the World Bank Development Indicators
Agriculture, value added (% of GDP)Agriculture, value added (% of GDP) comes from the World Bank Development Indicators
Manufacturing, value added (% of GDP)Manufacturing, value added (% of GDP) comes from the World Bank Development Indicators
Urban population (% of total)Urban population refers to people living in urban areas as defined by national statistical offices. It is calculated using World Bank population estimates and urban ratios from the United Nations World Urbanization Prospects.
Population density (people per sq. km of land area)Population density, midyear population divided by land area in square kilometers, comes from the World Bank Development Indicators.
Notes: As a result of the absence of data, agriculture value added (% of gross value added (GVA)) and manufacture value added (% of GVA) have been used instead of GDP composition for French Polynesia and Samoa. Likewise, for French Polynesia and New Caledonia, GDP per capita (current US$) has been used instead of GDP per capita (2010 US$).

Appendix D

Table A4. Sources of the projections of the independent variables.
Name of IndicatorSources
Urban population (% total population)United Nations, World Urbanization Prospects
Population density
Population
GDP per capita (2010 USD)Economic Research Service of the United States Department of Agriculture
Notes: The projections of GDP per capita for French Polynesia, Kiribati, New Caledonia, Palau, Timor-Leste, and Tuvalu have been obtained by using the average growth rate of Asia Pacific SIDS (Fiji, Maldives, Federated States of Micronesia, Papua New Guinea, Samoa, Solomon Islands, Tonga, and Vanuatu).

Appendix E

Table A5. Regression results.
Independent Variables\Infrastructure IndicatorsPaved RoadsUnpaved RoadsRail LinesPower ConsumptionAccess to ElectricityMobile PhonesFixed TelephonesWater Sources RuralWater Sources UrbanSanitation Facilities RuralSanitation Facilities Urban
Lagged variable0.7930 ***0.6787 ***0.8215 ***0.8137 ***0.9062 ***0.5430 ***0.7954 **0.7271 ***0.9119 ***0.8107 ***0.9403 ***
(0.0293)(0.0332)(0.0191)(0.0170)(0.0145)(0.0391)(0.0297)(0.0115)(0.0079)(0.0094)(0.00732)
GDP per capita0.03070.1006−0.00620.1584 ***0.0128−0.38400.1350 *0.0356 **0.00630.0525 ***0.0080 ***
(0.0580)(0.0766)(0.0182)(0.0292)(0.0081)(0.2888)(0.1750)(0.0170)(0.0040)(0.0095)(0.0031)
Urbanization0.19450.09900.0597−0.01890.01110.35210.47640.1463 ***0.0296 ***0.0037−0.0030
(0.1239)(0.1662)(0.0388)(0.0574)(0.0169)(0.6823)(0.1750)(0.0353)(0.0082)(0.01976)(0.0065)
Population density0.0162−0.1387−0.1738 ***−0.01520.0526 **0.06190.66490.05930.0218 **0.1115 ***0.0357 ***
(0.1496)(0.2042)(0.0502)(0.0703)(0.0222)(0.7886)(0.2070)(0.0430)(0.0103)(0.0242)(0.0079)
Manufacture0.0473−0.0262−0.01180.0496 ***0.0078−0.3149 **−0.1308 **−0.0315 ***−0.0039−0.1625 ***0.0022
(0.0384)(0.0503)(0.0121)(0.0192)(0.0053)(0.1420)(0.0526)(0.0111)(0.0026)(0.0063)(0.0020)
Agriculture−0.0907 **0.01300.00110.00140.0059−0.4406 **0.0230−0.0019−0.00070.0141 *−0.0003
(0.4488)(0.0626)(0.0141)(0.0216)(0.0065)(0.1905)(0.0607)(0.0128)(0.0030)(0.0073)(0.0024)
Period−0.00690.00560.00190.0085 *−0.00090.0271−0.4145 ***0.0003−0.0014 **−0.0030 *−0.0020 ***
(0.0094)(0.0127)(0.0030)(0.0045)(0.0013)(0.0499)(0.0137)(0.0027)(0.0006)(0.0016)(0.0005)
Constant−0.8474−0.41271.1584 ***0.00900.03812.4860−1.39030.10250.1651 ***−0.17590.0905 *
(0.7952)(1.0342)(0.2831)(0.3762)(0.1114)(4.2535)(1.0824)(0.2324)(0.0535)(0.1331)(0.0510)
Rho0.64560.71420.97670.69970.88120.89610.72370.90220.92480.96070.9644
Notes: Standard errors are in parentheses. The levels of significance are as follows: *** p < 0.01, ** p < 0.05, and * p < 0.1. Rho represents the estimated variance of the overall error accounted for by the individual effect.

Appendix F

Table A6. Composition of annual financing needs, by country and sector, % of GDP, 2018–2030.
CountryTransportEnergyICTWSSTotal
Afghanistan9.9%12.3%5.9%0.7%28.8%
Armenia0.7%0.9%0.6%0.4%2.6%
Azerbaijan0.8%0.9%0.6%0.3%2.5%
Bangladesh3.9%4.9%2.1%0.4%11.4%
Bhutan3.7%3.3%0.7%0.1%7.8%
Cambodia4.3%5.1%2.2%0.6%12.2%
Fiji1.4%1.2%0.5%0.4%3.5%
French Polynesia0.5%0.4%0.1%0.1%1.1%
Kazakhstan0.8%0.9%0.3%0.1%2.1%
Kiribati4.3%4.1%1.3%0.7%10.5%
Kyrgyz Republic10.2%4.5%3.4%1.2%19.3%
Lao PDR3.5%3.6%2.6%0.4%10.2%
Maldives0.7%0.7%0.5%0.1%1.9%
Micronesia (F.S. of)2.4%2.3%0.7%0.4%5.7%
Mongolia2.3%1.5%0.6%0.3%4.7%
Myanmar2.9%3.9%2.5%0.4%9.8%
Nepal6.6%8.1%4.3%0.4%19.4%
New Caledonia0.7%1.5%0.1%0.1%2.4%
Palau0.5%1.2%0.3%0.2%2.2%
Papua New Guinea4.2%4.0%2.0%0.6%10.8%
Samoa1.8%1.7%0.6%0.3%4.4%
Solomon Islands5.9%5.6%1.8%1.0%14.2%
Tajikistan3.4%6.2%4.4%1.2%15.2%
Timor-Leste5.9%6.3%5.0%0.8%17.9%
Tonga1.8%1.8%0.7%0.6%4.8%
Turkmenistan3.4%1.5%0.3%0.2%5.4%
Tuvalu1.5%1.6%0.6%0.4%4.1%
Uzbekistan2.1%2.9%1.9%0.6%7.4%
Vanuatu2.8%2.9%1.0%0.5%7.3%
Weighted average2.7%3.1%1.6%0.8%8.1%

References

  1. Asian Development Bank (ADB). 2012. Mongolia: Road Sector Development to 2016. Available online: hdl.handle.net/11540/920 (accessed on 1 February 2017).
  2. Asian Development Bank (ADB). 2014. Climate Proofing ADB Investment in the Transport Sector: Initial Experience. Available online: hdl.handle.net/11540/2365 (accessed on 1 February 2017).
  3. Asian Development Bank (ADB). 2017. Meeting Asia’s Infrastructure Needs. Mandaluyong: Asian Development Bank. [Google Scholar] [CrossRef]
  4. Bhattacharyay, Biswa Nath. 2012. Estimating demand for infrastructure, 2010–2020. In Infrastructure for Asian Connectivity. Edited by Biswa Nath Bhattacharyay, Masahiro Kawai and Rajat M. Nag. A joint publication of The Asian Development Bank Institute and Asian Development Bank with Edward Elgar publishing. Cheltenham and Northampton: Edward Elgar. [Google Scholar]
  5. Collier, Paul, Martina Kirchberger, and Måns Söderbom. 2015. The Cost of Road Infrastructure in Low and Middle Income Countries. World Bank Policy Research Working Paper 7408. Washington, DC, USA: World Bank Group. [Google Scholar]
  6. Eliste, Paavo, and Izvorski Ivailo. 2015. Cambodia—Integrated Fiduciary Assessment: The Agriculture, Irrigation, and Rural Roads Sectors—Public Expenditure Review. Washington, DC: World Bank Group. [Google Scholar]
  7. United Nations Economic and Social Commission for Asia and the Pacific (ESCAP). 2015a. Asia-Pacific Countries with Special Needs Development Report 2015: Building Productive Capacities to Overcome Structural Challenges. Available online: https://www.unescap.org/publications/asia-pacific-countries-special-needs-development-report-2015-building-productive (accessed on 1 February 2017).
  8. United Nations Economic and Social Commission for Asia and the Pacific (ESCAP). 2015b. Financing for Transformation: From Agenda to Action on Sustainable Development in Asia and the Pacific. Available online: https://www.unescap.org/resources/financing-transformation-agenda-action-sustainable-development-asia-and-pacific (accessed on 1 February 2017).
  9. United Nations Economic and Social Commission for Asia and the Pacific (ESCAP). 2017. Asia-Pacific Countries with Special Needs Development Report 2017: Investing in Infrastructure for an Inclusive and Sustainable Future. Available online: https://www.unescap.org/publications/asia-pacific-countries-special-needs-2017 (accessed on 1 June 2017).
  10. Fay, Marianne. 2000. Financing the Future: Infrastructure Needs in Latin America, 2000–05. World Bank Policy Research Working Paper 2545. Washington, DC, USA: World Bank. [Google Scholar] [CrossRef]
  11. Fay, Marianne, and Michael Toman. 2010. Infrastructure and sustainable development. Paper presented at Korea-World Bank High Level Conference on Post-Crisis Growth and Development, Busan, Korea, June 3–4. [Google Scholar]
  12. Fay, Marianne, and Tito Yepes. 2003. Investment in Infrastructure: What Is Needed from 2000 to 2010? World Bank Policy Research Working Paper 3102. Washington, DC, USA: World Bank. [Google Scholar]
  13. International Energy Agency (IEA). 2014. World Energy Outlook 2014. Paris: IEA. [Google Scholar]
  14. International Energy Agency (IEA). 2016. World Energy Outlook 2016. Paris: IEA. [Google Scholar]
  15. International Monetary Fund (IMF). 2016. Article IV Consultation Report for Kiribati. IMF Country Report No. 16/292. Washington, DC: IMF. [Google Scholar]
  16. Kalaitzidakis, Pantelis, and Sarantis Kalyvitis. 2004. On the macroeconomic implications of maintenance in public capital. Journal of Public Economics 88: 695–712. [Google Scholar] [CrossRef] [Green Version]
  17. McKinsey Global Institute. 2013. Infrastructure Productivity: How to Save $1 Trillion a Year. Available online: https://www.mckinsey.com/industries/capital-projects-and-infrastructure/our-insights/infrastructure-productivity (accessed on 1 February 2017).
  18. McKinsey Global Institute. 2016. Bridging Global Infrastructure Gaps. Available online: https://www.mckinsey.com/industries/capital-projects-and-infrastructure/our-insights/bridging-global-infrastructure-gaps (accessed on 1 February 2017).
  19. Pacific Region Infrastructure Facility. 2013. Infrastructure Maintenance for the Pacific. Available online: http://www.theprif.org/components/com_jomcomdev/files/2016/06/22/186-Build_Neglect_Rebuild_Revised_Full_Report_2014.pdf (accessed on 1 February 2017).
  20. Rioja, Felix. 2003. Filling Potholes: Macroeconomic Effects of Maintenance vs. New Investments in Public Infrastructure. Journal of Public Economics 87: 2281–304. [Google Scholar] [CrossRef]
  21. Ruiz-Nunez, Fernanda, and Zichao Wei. 2015. Infrastructure Investment Demands in Emerging Markets and Developing Economies. World Bank Policy Research Working Paper 7414. Washington, DC, USA: World Bank Group. [Google Scholar]
  22. United Nations Industrial Development Organization (UNIDO) and International Center on Small Hydro Power (ICSHP). 2013. World Small Hydropower Development Report 2013. Vienna: UNIDO. [Google Scholar]
  23. World Health Organization (WHO). 2012. Global Costs and Benefits of Drinking-Water Supply and Sanitation Interventions to Reach the MDG Target and Universal Coverage. WHO/HSE/WSH/12.01. Geneva: WHO. [Google Scholar]
  24. World Bank. 2005. Why Road Maintenance is Important and How to Get it Done. Transport Note No. TRN-4. Washington, DC: World Bank. [Google Scholar]
  25. World Bank. 2016. Pacific Possible: Climate Change and Disaster Resilience. Available online: pubdocs.worldbank.org/en/720371469614841726/PACIFIC-POSSIBLE-Climate.pdf (accessed on 1 February 2017).
  26. World Bank. 2017. World Development Indicators. Washington, DC: World Bank. [Google Scholar]
  27. World Bank and International Energy Agency (IEA). 2015. Sustainable Energy for All 2015: Progress toward Sustainable Energy. Available online: trackingenergy4all.worldbank.org/~/media/GIAWB/GTF/Documents/GTF-2105-Full-Report.pdf (accessed on 1 February 2017).
1
See www.esmap.org/node/3051 (accessed on 24 February 2017).
2
Estimates for current levels of infrastructure funding in the Asia-Pacific LDCs, LLDCs, and SIDS are given by ESCAP (2017).
Figure 1. Index scores in the energy and WSS sectors in Asia and the Pacific. Source: Authors’ calculation. See Appendix B for details. Notes: Appendix A provides a complete list of countries and country groupings. “Asia-Pacific non-CSN developing economies” refers to the thirteen other Asian developing countries. The figures are based on data from 2015 for the WSS sector and 2012 for the energy sector. The energy index score is calculated, for each country, as the simple average of standardized values of the two energy infrastructure indicators. The WSS index score is the simple average of standardized values of the four WSS infrastructure indicators. Each standardized value is computed to have a mean of 1 and a standard deviation of 0.15 so that the units of these values are consistent. LDCs—least developed countries; LLDCs—landlocked developing countries; SIDS—small island developing States; WSS—water supply and sanitation.
Economies 06 00043 g001
Figure 2. Annual infrastructure financing needs by country group and component, as a percent of gross domestic product (GDP), 2018–2030. Source: Authors’ estimation.
Economies 06 00043 g002
Figure 3. Annual infrastructure financing needs by country group, component and sector, as a percent of GDP, 2018–2030. Source: Authors’ estimation. ICT—Information and Communications Technologies.
Economies 06 00043 g003
Table 1. Access to infrastructure by country groups. LDCs—least developed countries; LLDCs—landlocked developing countries; SIDS—small island developing States.
Infrastructure IndicatorLDCsLLDCsSIDSOther Asian Developing Countries
Total route km of paved roads per 1000 people1.14.72.12.2
Total route km of unpaved roads per 1000 people3.03.15.31.0
Total route km of rail lines per 1,000,000 people10.7376.674.052.2
Electric power consumption (kWh per capita)410.72321.51851.43091.0
Access to electricity (% of population)49.598.667.996.4
Number of fixed telephone subscriptions per 100 people3.813.015.217.6
Number of mobile phone subscriptions per 100 people84.1115.589.4109.8
Access to improved water sources (% of rural population)50.280.384.975.4
Access to improved water sources (% of urban population)77.288.892.587.6
Access to improved sanitation facilities (% of rural population)69.973.384.592.5
Access to improved sanitation facilities (% of urban population)85.792.295.997.6
Sources: Authors’ calculations based on data from various sources. See Annex 2 for details; Note: These figures are simple averages and for 2015 data or the latest available year.
Table 2. Unit capital cost of physical infrastructure.
SectorUnit Cost in 2010 US Dollars
Paved roads, per kilometer200,000 for a 6 m wide road (two lanes)
Unpaved roads, per kilometer50,000
Rail lines, per kilometer1,200,000
Electricity generation, per kilowatt of generating capacity1400 for fossil fuel-based electricity generation, 2200 for hydro power-based, and 1800 for mixed sources, depending on the composition of current generating capacity mix
Access to electricity, per personUnit cost of electricity generation per kilowatt multiplied by the average power consumption of people who have access to electricity
Fixed telephone, per subscription250
Mobile telephone, per subscription100 in urban area and 160 in rural area
Access to water supply, per person75.5 in rural area and 151 in urban area
Access to sanitation, per person117 in rural area and 190.5 in urban area
Sources: Authors’ estimation based on various sources.
Table 3. Annual infrastructure financing needs, 2018–2030, at 2010 prices. WSS—water supply and sanitation; ICT—Information and Communications Technologies; GDP—gross domestic product.
Type of Physical InfrastructureLDCsLLDCsSIDSTotal
Millions of Dollars% of GDPMillions of Dollars% of GDPMillions of Dollars% of GDPMillions of Dollars% of GDP
Transport12,7584.3%56041.5%7132.4%19,0752.7%
Energy15,9855.4%53981.4%7042.3%22,0873.1%
ICT79052.6%27850.7%3211.1%11,0111.6%
WSS29131.0%22860.6%1860.6%53860.8%
Total39,56113.3%16,0724.3%19256.3%57,5598.1%
Source: Authors’ estimation.
Table 4. Total required investment in comparison with current spending.
CountryTotal Infrastructure Investment Needed Annually, % of GDPPublic Gross Fixed Capital Formation as a Share of GDP (Average 2012–2015)Public-Private Partnerships (PPP) Investment as a Share of GDP (Average 2012–2015)Official Development Assistance (ODA) as a Share of GDP (Average 2012–2016)
Afghanistan26.3%#N/A#N/A25.0%
Armenia2.7%1.2%0.2%2.8%
Azerbaijan2.4%4.6%0.0%0.2%
Bangladesh11.2%5.3%0.2%1.4%
Bhutan7.5%7.2%0.7%6.0%
Cambodia12.4%6.1%1.6%4.6%
Fiji3.6%6.8%0.0%2.3%
French Polynesia1.2%#N/A#N/A#N/A
Kazakhstan2.0%2.7%0.0%0.0%
Kiribati11.0%#N/A#N/A37.6%
Kyrgyz Republic15.4%2.1%0.0%8.5%
Lao PDR10.0%#N/A#N/A3.4%
Maldives1.7%5.9%0.0%0.9%
Micronesia (F.S. of)6.0%#N/A#N/A#N/A
Mongolia5.0%9.4%0.1%2.9%
Myanmar9.8%8.1%0.0%2.8%
Nepal19.1%2.8%0.9%4.8%
New Caledonia2.5%#N/A#N/A#N/A
Palau2.3%#N/A#N/A8.5%
Papua New Guinea11.1%#N/A#N/A2.8%
Samoa4.6%#N/A#N/A12.6%
Solomon Islands14.8%#N/A#N/A21.3%
Tajikistan16.0%4.3%0.0%4.8%
Timor-Leste16.0%#N/A#N/A17.1%
Tonga5.1%#N/A#N/A17.6%
Turkmenistan4.7%#N/A#N/A0.1%
Tuvalu4.4%#N/A#N/A95.7%
Uzbekistan7.0%0.3%0.0%0.6%
Vanuatu7.6%#N/A#N/A15.7%
Source: “International Monetary Fund (IMF) Investment and Capital Stock Dataset, 2017” with a reference to “Estimating Public, Private, and PPP Capital Stocks”; World Development Indicators (WDI) from World Bank; #N/A: Data not available.
Table 5. Comparison with other existing studies.
(Percent of GDP)Financing Needs Without Climate—Related RisksFinancing Needs With Climate—Related risksLimitations that This Paper Addresses
This paper
LDCs, LLDCs, and SIDS6.0–7.4%7.6–8.9%
LDCs10.0–12.1%12.2–14.4%
LLDCs2.8–3.6%4.0–4.8%
SIDS6.4–8.0%8.5–10.1%
Asian Development Bank (ADB 2017)
Asia-Pacific5.1%5.9%- When calculating projected infrastructure demands, the industrial share of GDP is kept constant;
- Absence of financing needs estimates at the country level;
- Absence of consideration for the LDC/LLDC/SIDS status of countries;
- Current shortages in economic infrastructure are not accounted for in the financing needs estimates.
By sub-region
Central Asia6.8%7.8%
East Asia4.5%5.2%
South Asia5.0%5.7%
The Pacific8.2%9.1%
By income level
Low income9.9%10.5%
Lower middle income7.1%8.2%
Upper middle income4.9%5.7%
High income1.9%2.3%
Ruiz-Nunez and Wei (2015)
World2.2%- Absence of country/region-specific unit costs;
- Absence of climate change-related financing components;
- When calculating projected infrastructure demand, industrial and agricultural shares of GDP are kept constant;
- Absence of financing needs estimates at the country level;
- Current shortages in economic infrastructure are not accounted for in the financing needs estimates.
By income level
Low income14.1%
Lower middle income3.4%
Upper middle income2.6%
High income0.8%
Bhattacharyay (2012)
Total Asia-Pacific (32)6.5%- Absence of climate change-related financing components;
- When calculating projected infrastructure demand, industrial and agricultural shares of GDP are kept constant;
- Current shortages in economic infrastructure are not accounted for in the financing needs estimates.
Re-calculated using our country grouping
LDCs, LLDCs and SIDS (22)9.1%
LDCs (12)10.2%
LLDCs (7)7.9%
SIDS (4)3.6%
Source: Asian Development Bank (ADB) (2017), Ruiz-Nunez and Wei (2015) and ADBI/ADB (2012).

