The Effect of Governance Quality on Economic Growth: Based on China’s Provincial Panel Data

1
School of Economics and Management, Harbin Institute of Technology (Shenzhen), Shenzhen 518055, China
2
School of Finance, Shanghai University of Finance and Economics, Shanghai 200433, China
*
Authors to whom correspondence should be addressed.
Economies 2018, 6(4), 56; https://doi.org/10.3390/economies6040056
Submission received: 11 July 2018
/
Revised: 8 October 2018
/
Accepted: 15 October 2018
/
Published: 19 October 2018
Abstract
:This paper investigates the impact of governance quality on economic growth in China. After developing a theoretical framework for the effect of governance quality on local economic growth, this article studies the panel data in provincial regions over the period 2001–2015 by constructing a new comprehensive index of provincial governance, and checks the robustness of the empirical findings from four aspects. The results show that governance quality has a positive effect on economic growth, due to good governance strengthening the “helping hand” or weakening the “grabbing hand” of power. Governance quality presents diminishing marginal returns, which means that the high-speed economic growth effect becomes less and less, while the high-quality economic development effect becomes more and more. Higher governance quality could bring a high-speed economic growth effect in the western region, while higher governance quality could bring a high-quality economic development effect in the eastern region. Compared with fixed-asset investment, human capital has played a more important role in economic growth. In order to promote the sustainable development of China’s economy, policy makers should improve local governance quality, strengthen the capacity of independent innovation, and promote the accumulation of high-quality human capital.
Keywords:
good governance; provincial governance; diminishing marginal returns; high-speed economic growth effect; high-quality economic development effect; endogeneity; region difference; robustness checkJEL Classification:
C51; O43; P251. Introduction
Since the early 1980s, China’s economy has maintained rapid growth, with an average annual growth rate of more than 9%. Per capita GDP (gross domestic product) has increased from lower than $300 in 1978 to over $8000 in 2016, which implies that China has finished a great transformation from low income to upper middle income. During this period, China has actively promoted reform in all fields and improved local governance quality a great deal. Olson et al. (2000) pointed out that governance quality was the decisive factor of economic growth. Therefore, this article wants to ask several questions, such as, among others, the following: (1) whether the governance quality has played an important role in China’s past economic growth? (2) If yes, what are the characteristics of this role? Figuring out these problems not only helps understand the remarkable miracle of China’s economic growth, but also helps improve future economic policies in China, resulting in a long-term, stable, and sustainable economic growth.
There are lots of studies on the role of governance quality in China’s regional economic growth, which confirm a close relationship between governance quality and economic growth in China (Zheng 2016). Theoretically, according to the evolution trend of governance connotation (Fukuyama 2013; Faguet 2014; Rotberg 2014; Liu et al. 2016, 2018), there are seven main single perspectives of governance evaluation in the world: horizontal allocation of power (e.g., marketization), vertical allocation of power (e.g., decentralization), supervising power (e.g., rule of law), bureaucracy, bureaucratic autonomy, governance capacity, and governance output. Therefore, according to their governance perspectives, the existing literatures, which study the effect of governance quality on China’s regional economic growth, can be classified into four categories.
The first category focuses on the impact of vertical allocation of power on economic growth in China, with more attention paid to the allocation of power among governments at different administrative levels. Qian and Weingast (1997), starting with the perspective of fiscal decentralization, concluded that China’s central government delegated most of its economic management authority to local governments, which strengthens the motivation of local governments to protect the market, resulting in rapid development of the local economy. Shao (2016) pointed out that the Chinese-style fiscal decentralization positively affected regional economic growth, which was influenced by the marketization process in China. However, Zhou (2007) focused on the perspective of political centralization, and believed that the political promotion tournament, with GDP as the core evaluation index, was closely related to rapid economic growth. Xu et al. (2007) thought that the exchange of provincial governors could increase the economic growth rate of the inflow area by about 1%. Liu et al. (2013) started from the perspective of informal power structure, and believed that the informal power structure of local governments could partially explain the regional differences of economic development performance in 58 counties of Zhejiang province.
The second category analyzes the effect of marketization on economic growth in China, paying attention to the horizontal allocation of power. Based on the panel data of China’s 30 provincial regions over the period of 1997 to 2007, Fan et al. (2011a) quantified the contribution of market-oriented reform to the total factor productivity and economic growth by utilizing the relative index of the marketization process in provincial regions. The findings showed that the contribution of marketization to economic growth was 1.45% annually, with the marketization contributing 39.2% of total factor productivity. Using the provincial panel data over the period 1994–2011, Shao (2016) adopted the threshold panel model to investigate the effect of marketization on economic growth, and found that marketization affected provincial economic growth, which had strong robustness. Lv and Zhu (2016) utilized an endogenous growth model with marketization and incomplete contracts to examine the relationship between marketization and economic growth from the perspective of market potential, and studied the panel data of 38 industrial sectors in provincial regions, believing that market could positively affect long-term economic growth by expanding the market potential.
The third category studies the effect of rule of law on economic growth in China, with attention to the supervising power. Based on China’s 28 provincial regions for the period 1991–2001, Lu and Yao (2004) investigated rule of law, financial development, and economic growth under financial repression, and suggested that rule of law could exert a significant impact on economic growth under the premise that other supporting systems were improved. Liu (2011) studied provincial panel data during the period of 2001 to 2008, and insisted that for China and other post-emerging economies, there were inverted U-curve relationships between intellectual property protection, independent research and development, technological growth rate, and economic growth rate. Dong et al. (2012), starting from the data of China’s transition period (1985–2010), investigated the impact of China’s intellectual property system on economic growth, and thought that weak intellectual property protection was conducive to economic growth in the short term, while stronger intellectual property protection was conducive to economic growth in the long term in China.
The fourth category investigates the effect of two-dimensional governance on economic growth in China, which defines governance or constructs the comprehensive index of governance quality from two dimensions. Zheng (2016) proposed a new model (project system) of economic governance to explain the great prosperity of China’s “project economy” and the various economic problems arising therefrom, with a governance perspective of “horizontal allocation of power + vertical allocation of power”. Zheng and Ying (2017) thought the project system significantly promoted the economic growth in cities through government’s guiding investment in fixed assets, while it also had some negative effects. Wilson (2016) believed that governance quality promoted the transformation of industrial structure in China’s provincial regions by inhibiting the first industry and encouraging the tertiary industry, and had no positive effect on GDP, with a two-dimensional governance perspective of “governance capacity + governance output” and a comprehensive index of governance quality incomparable between different years (1985–2005).
Obviously, most of the existing literature focuses on the effect of single-dimensional (or two-dimensional) governance on economic growth, with few articles focusing on the effect of multi-dimensional governance on economic growth in China. Besides, existing literature ignores the diminishing marginal returns from governance quality on economic growth, and the region difference in the effect of governance quality on economic growth. Additionally, entering the World Trade Organization (WTO) is a great institutional change for China, while existing literature pays little attention to the period since 2001. Therefore, using panel data in China’s provincial regions (2001–2015), this paper aims to empirically investigate the effect of governance quality on economic growth. The results show the following: (1) governance quality has a positive effect on economic growth, due to good governance strengthening the “helping hand” or weakening the “grabbing hand” of power; (2) governance quality presents diminishing marginal returns, because late-mover advantages become less and dividends from system reform become smaller; (3) higher governance quality could bring a high-speed economic growth effect in the western region, while higher governance quality could bring a high-quality economic development effect in the eastern region; and (4) compared with fixed-asset investment, human capital has played a more important role in economic growth.
The contributions of this study are highlighted as follows: (1) to develop a theoretical framework for the effect of governance quality on local economic growth in China, which is used to explain economic growth in provincial regions; (2) to discuss the diminishing marginal returns from governance quality in China’s provincial regions, which could be interpreted as a shift from high-speed economic growth effect to high-quality economic development effect; (3) to divide China into three economic regions to demonstrate that the region difference in governance quality could lead to the region difference in economic growth pattern transformation; (4) to construct a new comprehensive index of governance quality comparable between different years in China’s provincial regions, which focuses on the multi-dimensional governance perspective of “horizontal allocation of power + governance capacity + supervising power”; and (5) to utilize a new provincial panel data (2001–2015) to investigate the impact of governance quality on economic growth since China’s entering the WTO in 2001 and the global economic crisis in 2008.
The rest of this paper is organized as follows: Section 2 introduces the theoretical framework for the effect of governance quality on local economic growth in China. In Section 3, we present an overview of econometric model, variables, method, and data. Section 4 shows the empirical results, robustness checks, and discussion. Finally, in Section 5, we conclude this article with the main findings and policy recommendations.
2. Theoretical Framework
2.1. Quality Assessment of Provincial Governance in China
Since the 1980s, the local governance in China has changed greatly, which can be understood from six aspects: marketization, civil society, community/villager autonomy, decentralization, service-oriented government, and rule of law (Tang et al. 2018). At the same time, governance quality has been operationalized in provincial regions of China by existing studies, which can be divided into three categories according to the dimensions of governance perspective.
The first category is one-dimensional governance perspective. Based on the outputs of public service, Tian and Zhou (2016) quantified the level of social governance in China’s 31 provincial regions, and only focused on the single dimension perspective of “governance output” for governance evaluation, with the comprehensive index of governance quality comparable between different years (2007–2014). Besides, Fan et al. (2011b) discussed five aspects of provincial marketization in China, and calculated the composite index of marketization (1997–2009) using the arithmetic average method, which was the most popular comprehensive index of provincial governance, and indicated a one-dimensional perspective of “horizontal allocation of power”. Further, Wang et al. (2017) deleted five indicators from the index system designed by Fan et al. (2011b), and calculated the comprehensive index of marketization (2008–2014), with the same perspective as Fan et al. (2011b).
The second category is the two-dimensional governance perspective. By learning from the government management competitiveness index of China’s regional competitiveness development report (Xiao 2004, 2006), Wilson (2016) calculated the comprehensive index of provincial governance, which embodied a two-dimensional perspective of “governance capacity + governance output”, while the comprehensive index was not comparable between different years (1985–2005). On the basis of WGI (World Governance Index), Jiang et al. (2017) chose four aspects (i.e., government effectiveness, rule of law, control of corruption, and regulatory quality) to assess provincial governance, which indicated a two-dimensional perspective of “governance capacity + supervising power”, however, they only studied the cross-sectional data.
The third category is multi-dimensional governance perspective. Shi and Fang (2010), starting from three aspects (i.e., policy, system, and behavior), designed the evaluation system of public governance efficiency, and emphasized on a multi-dimensional perspective of “supervising power + governance capacity + governance output”, but they only considered the cross-sectional data of five provincial regions, and did not calculate the comprehensive index of governance quality. Tang et al. (2018) discussed the main contents of China’s local governance quality assessment: government capacity, marketization, and rule of law, which meant a new multi-dimensional perspective of “horizontal allocation of power + governance capacity + supervising power”, and designed the index system of governance assessment based on literature investigation and coefficient of variation, and measured the three sub-indexes of governance quality (2001–2014), without calculating the comprehensive index of provincial governance.
Compared with the most popular research from Fan et al. (2011b), who focused on the one-dimensional perspective, Tang et al. (2018) chose the multi-dimensional perspective, which described the reality of China’s provincial governance more comprehensively. Besides, previous studies designed the index system based on literature investigation, while Tang et al. (2018) based their system on literature investigation and coefficient of variation, which made their index system more scientific. Therefore, this paper adopted the index system (see Table 1) from Tang et al. (2018), calculated the factor loadings of 14 variables (see Appendix A), and got the comprehensive index (see Appendix B) of provincial governance (2001–2015) using the global factor analysis method (Tang et al. 2018).
2.2. Mechanisms of Governance Quality Affecting Economic Growth
The core connotations of “China’s local governance” are the following: effective government, efficient market, and rule of law (Liu et al. 2017; Tang et al. 2018). According to the economic growth miracle in China, good governance encourages the “helping hand” of power, while it inhibits the “grabbing hand” of power, resulting in a positive impact on economic growth in China’s provincial regions, which is through three possible routes or channels: marketization, government capacity, and rule of law.
Firstly, good governance means strong government capacity, namely, local government has enough resources, such as manpower and financial resources; to improve the capital market and investment climate; to keep the bureaucratic system stable and maintain bureaucratic professionalization; to develop a good economic power structure and political power structure; to promote system reform in all fields like science and technology; and to provide public services like medical treatment and education, which facilitates industrial upgrading and economic growth (Lin 2014), resulting in strengthening the “helping hand” of government power. Additionally, China’s economy has the characteristics of transition and development, which may bring market absence and market failure, resulting in a negative impact on local economic growth. Therefore, local governments must play an important role in economic growth to weaken the “grabbing hand” of market power.
Secondly, good governance also means that market mechanism plays a key role in resource allocation, which can make full use of local comparative advantages, and strengthen the market competitiveness of products, resulting in the expansion of the market share of enterprise and the scale of industry, and the rapid growth of the local economy in China. Therefore, we define the positive effect of the market on economic growth as the “helping hand” of market power. At the same time, the full development of local market economy not only supports the “helping hand” of government power by providing tax, products, and services, among others, but also weakens the “grabbing hand” of government power by forcing the local government to gradually reduce the intervention.
Thirdly, good governance also means rule of law, that is, market subjects and government entities are forbidden to act as the “grabbing hand” and are encouraged to be the “helping hand” by legal institutions, they are willing to act in strict accordance with the law, none of them have the privilege to overstep the Constitution and other laws. Rule of law belongs to the software infrastructure, and has an important impact on local economic growth by institutionalization. For example, through the protection of private property rights, rule of law weakens the “grabbing hand” of government power, and strengthens the “helping hand” of market power; through the protection of intellectual property rights, rule of law relieves the “grabbing hand” of market power, and encourages the “helping hand” of market power (see Figure 1).
2.3. Hypotheses of Governance Quality Affecting Economic Growth
Governance quality is an important variable to explain investment rate (Knack and Keefer 1995), which means one way to promote economic growth is improving the capital market and investment climate (Olson et al. 2000). Meanwhile, there are some other approaches by which good governance can improve economic performance, such as a stable bureaucratic system promoting long-term investment in the private sector (Evans and Rauch 1999); bureaucratic professionalization encouraging investment in public facilities (Rauch 1995); reduction of corruption and encouraging productive investment (Campos et al. 1999; Dahlström et al. 2012); a good economic power structure promoting the optimization of resource allocation (Zhang and Yu 2009); a political power structure affecting economy system and economic policy (Liu et al. 2013); the fiscal decentralization resulting in officials incentive and regional competition (Shao 2016); the marketization improving resource allocation; supporting governments’ positive effect by providing tax, products, services, and so on, and weakening governments’ negative effect by forcing governments to reform; the rule of law forbidding the negative effect of market subjects and government entities, and encouraging the positive effect of them; protecting private property rights and intellectual property rights; and supporting investment and innovation (North 1990). Obviously, the above-mentioned approaches reveal that governance can be regarded as social infrastructure, which plays an important role in economic growth (Hall and Jones 1999; Fayissa and Nsiah 2013; Al Mamun et al. 2017) through systems and government policies, that is, good governance can promote economic growth (Kaufmann and Kraay 2002; Setayesh and Daryaei 2017; Adedokun 2017) through encouraging the “helping hand” of power, while inhibiting the “grabbing hand” of power. Therefore, this paper proposes the following hypothesis:
Hypothesis 1 (H1).
The quality of governance has significant impact on economic growth, good governance could bring significant positive effect on economic growth.
Based on empirical studies, undeveloped countries mean not only lower per capita GDP, but also lower quality of governance (Fayissa and Nsiah 2013; Al Mamun et al. 2017). However, better governance allows undeveloped countries to make full use of their late-mover advantages to get catch-up effect, and achieve faster economic growth than developed countries (Murrell and Olson 1991). If WGI is lower, the improvement of per capita GDP will be greater following one unit of governance improvement, while if WGI is higher, the improvement of per capita GDP will be smaller (Zhang and Wang 2013). Compared with countries with higher governance quality, the positive effect of governance index on economic growth is bigger and more significant in countries with lower governance quality (Seldadyo et al. 2007). Therefore, some scholars believe that the interaction between governance quality and economic growth is very complicated, and may be non-monotonous (Huynh and Jacho-Chávez 2009). In 2016, per capita GDP was over $8000 in China, with that in 10 provincial regions being more than $10,000 and that in Tianjin being nearly $20,000, while that in Gansu was around $4000, which revealed per capita GDP covered middle income and high income in China’s provincial regions. Thus, this paper proposes the second hypothesis as follows:
Hypothesis 2 (H2).
As governance quality improves continuously, the improvement of per capita GDP declines gradually following one unit of governance improvement, namely, there is a significant diminishing marginal phenomenon in the economic growth effect of governance quality.
3. Methodology
3.1. Variables Selection
3.1.1. Economic Growth
Economic growth is the dependent variable of this study, and some scholars adopted the indicator per capita GDP (Shao 2016; Fayissa and Nsiah 2013; Al Mamun et al. 2017), whereas some scholars used the GDP growth rate (Adedokun 2017; Seldadyo et al. 2007). Based on actual study needs, this paper utilizes real GDP per capita, which eliminates the inflation factor and uses comparable prices in 2001 (see Table 2).
3.1.2. Governance Quality
The quality of governance is the core explanatory variable of this empirical study, because the governance variable cannot be directly observed, the academic community uses the proxy variable method. Some scholars adopted the comprehensive index of governance quality, such as ICRG (International Country Risk Guide) (Olson et al. 2000), WGI (Adedokun 2017), while some scholars used the sub-index of governance quality, such as the government effectiveness in WGI (Kurtz and Schrank 2007), and six sub-indexes in WGI (Setayesh and Daryaei 2017). According to the latest characteristics of governance evaluation research, this paper highlights the multi-dimensional perspective of governance evaluation; chooses the index system of governance quality evaluation in China’s provincial regions; and calculates the comprehensive index of governance quality (2001–2015) using global factor analysis method, which reveals the multi-dimensional governance perspective of “horizontal allocation of power + governance capacity + supervising power” (Tang et al. 2018).
3.1.3. Control Variables
In addition to the quality of governance, there are other variables that affect economic growth. In order to eliminate the effects of these variables on economic growth, they need to be included in the control variables set. Based on the previous research results (Olson et al. 2000; Seldadyo et al. 2007; Shao 2016), this paper selects the following control variables: openness (Open), education development (Edu), urbanization (Urban), investment proportion (Inv), and human capital (Hum).
3.2. Econometric Model
According to the existing studies (Liu et al. 2013; Zhang and Wang 2013; Huynh and Jacho-Chávez 2009), there is a nonlinear relationship between governance quality and economic growth; at the same time, after directly observing the scatter diagram (see Figure 2) about the relationship between governance quality and economic growth in China’s provincial regions, this paper accepts the nonlinear relationship.
Further, Seldadyo et al. (2010) chose the comprehensive index of WGI and the natural logarithm of per capita GDP, so this article takes into account the comprehensive index of governance quality and the natural logarithm of per capita GDP. Besides, according to Hypothesis 2 and the scatter plot above, the economic growth effect of governance quality may have diminishing marginal phenomenon, so this paper also considers the square term of the comprehensive index of governance quality. Based on the models of the existing literature (Shao 2016; Seldadyo et al. 2010), this paper puts forward the econometric model as follows:
where lnGDP represents the natural logarithm of per capita GDP (constant price in 2001); Gov is the comprehensive index of governance quality; X are the control variables; α0 is the intercept; α1, α2, and β are the coefficients to be estimated; µ denotes the region effect; λ is the time effect; ε is the random error term; and i and t represent provincial regions and time period, respectively.
3.3. Method and Data
3.3.1. Estimation Method
This paper adopts panel data model, which can be divided into three types: mixed effect model, FE (fixed effect model), and RE (random effect model). Because of the differences in industrial structure, the development history of private sector, and the interaction between individuals and state, there may be a provincial heterogenetic relationship between economic growth and governance quality in China (Wilson 2016). If this paper uses the mixed effect model directly, it will miss the individual heterogeneity, resulting in inconsistent parameter estimates (Zhou 2016), so model selection process can be divided into two steps at most. Firstly, the F test is used to figure out if an individual effect exists. If the p value of F test is significantly more than 10%, this indicates that a significant individual effect does not exist, so mixed effect model will be appropriate. However, if the p value of the F test is significantly less than 10%, this indicates a significant individual effect, so mixed effect model will not be appropriate. Then, in the second step, the Hausman test is used to choose between fixed effect model and random effect model. If the p value of the Hausman test is significantly less than 10%, this indicates that the null hypothesis should be strongly rejected and the individual effect is related to random error term; therefore, fixed effect model will be appropriate. However, if the p value of the Hausman test is significantly more than 10%, the random effect model will be appropriate.
3.3.2. Data and Sources
Table 2 shows the variable introduction, parameter explanation, and data sources. Because of the lack of data in Inner Mongolia, Guangxi, Tibet, Hebei, Yunnan, Hainan, and Gansu, this paper adopts data from 24 provincial regions in mainland China, which are divided into three regions: eastern region, central region, and western region. According to the standard in China Statistical Yearbook, the eastern region includes the following: Liaoning, Beijing, Tianjin, Shandong, Jiangsu, Zhejiang, Shanghai, Fujian, and Guangdong. The central region includes the following: Jilin, Heilongjiang, Shanxi, Henan, Hubei, Hunan, Anhui, and Jiangxi. The western region includes the following: Sichuan, Guizhou, Shannxi, Qinghai, Ningxia, Xinjiang, and Chongqing. Taking into account the consistency of indicator and the availability of data, the sample period is 15 years (2001–2015), including 360 samples.
4. Empirical Results and Discussion
4.1. Descriptive Statistics
Table 3 presents the descriptive statistics of variables. In terms of economic growth (lnGDP), mean and median are the same, indicating that 50% of the samples are above the average level of variable value; the absolute values of both skewness and kurtosis are less than 1, implying that the variable is approximately normally distributed. Besides, the mean is greater than the median in variable Gov, which reveals that more than 50% of the sample does not reach the average level of governance quality; the absolute values of both skewness and kurtosis are less than 1, which shows the variable approximately follows the normal distribution; the maximum is 2.93 times of the minimum, which demonstrates huge differences between governance quality in different years and provincial regions.
4.2. Basic Analysis
The model selection process can be divided into two steps: firstly, the F test value is 156.50, while the p value is significantly less than 1%, which indicates a significant individual effect, so the mixed effect model is not appropriate; secondly, the Hausman test value is 16.04, and the p value is significantly less than 5%, therefore, the null hypothesis should be strongly rejected, which means that the random effect model is not appropriate. As a result, this paper chooses the fixed effect model as the final model, as shown in Table 4 (Model 1). Besides, the regression result of the random effect model is shown in Model 2, while the regression results of region difference and period difference are represented in Model 3 and Model 4, respectively.
In Table 4 (Model 1), the coefficient of variable Gov is significantly greater than zero while the coefficient of variable Gov2 is significantly less than zero, so the symmetry axis of the curve is Gov = 359.11, which is significantly greater than the Gov values of all provincial regions in China. Therefore, governance quality has a significant positive impact on economic growth (real GDP per capita) in provincial regions, which supports Hypothesis 1. Some studies on China support the positive effect of governance quality on economic growth, but most of them just focus on one aspect of governance, such as vertical allocation of power (Qian and Weingast 1997; Xu et al. 2007; Zhou 2007; Liu et al. 2013; Shao 2016), horizontal allocation of power (Fan et al. 2011a; Shao 2016; Lv and Zhu 2016), and supervising power (Lu and Yao 2004; Liu 2011; Dong et al. 2012), while few papers choose two-dimensional governance perspectives (Zheng 2016; Wilson 2016; Zheng and Ying 2017). Only Wilson (2016) constructed a comprehensive index of China’s provincial regions, but the governance index was incomparable between different years (1985–2005) and without significant positive effect on GDP, indicating a two-dimensional perspective of “governance capacity + governance output”.
Besides, some studies on cross-country data also support the positive effect of governance quality on economic growth. For example, Setayesh and Daryaei (2017) studied eight developing Islamic countries’ panel data (2005–2014), and found a significant positive correlation between the rule of law and corruption control with economic growth rate. Adedokun (2017) focused on 47 countries1 in Sub-Saharan Africa, and thought that WGI and IIAG (Ibrahim Index of African Governance) had a significant positive effect on the growth rate of real GDP per capita. Al Mamun et al. (2017) chose a large sample of 50 oil exporting countries, including developing and developed countries, and documented that governance quality was by far the most consistent driver of GDP per capita in both the long- and short-run. Based on five measures of governance quality (banking supervision, law and order, corruption, deposit insurance, and government stability), Saidi et al. (2017) adopted the Panel Smooth Transition Regression model to investigate 54 panels of OECD (20) and developing and emerging countries (34) over the period 1985–2010, and confirmed that the effectiveness of governance promoted real GDP per capita growth rate. In contrast, some country-level studies support the negative correlation between governance quality and economic growth. For example, China’s economic growth rate was higher than the world average, while its governance quality was lower than the world average (Qian 2002). Quibria (2006) investigated 29 Asian countries, and found that the GDP growth rate of countries with higher governance quality was lower than that of countries with lower governance quality.
However, this article constructs a new comprehensive index of governance quality, comparable between different years (2001–2015) in China’s provincial regions, which focuses on a multi-dimensional governance perspective of “horizontal allocation of power + governance capacity + supervising power”, and proves the positive effect of governance quality on real GDP per capita in China’s provincial regions. The positive effect can be understood as follows: good governance means institutional innovation and further reform in all fields like science and technology, which may bring the improvements of government capacity, resource allocation ability of market, and the rule of law, and which may improve the governance relation between government mechanism and market mechanism; the governance relation between government institutions, enterprises, and industry associations, resulting in strengthening the “helping hand” of power or weakening the “grabbing hand” of power; and resource concentration and economic growth in China’s provincial regions.
At the same time, with the governance quality raising gradually, the improvement of per capita GDP declines continuously in China’s provincial regions; consequently, there is a significant diminishing marginal phenomenon in the economic growth effect of governance quality, which supports Hypothesis 2. Most of the existing literature ignores the diminishing marginal effect of good governance, and lacks the discussions of a high-quality economic development effect of good governance, such as Qian and Weingast (1997), Xu et al. (2007), Zhou (2007), Liu et al. (2013), Shao (2016), Fan et al. (2011a), Lv and Zhu (2016), Lu and Yao (2004), Liu (2011), Dong et al. (2012), Setayesh and Daryaei (2017), Adedokun (2017), Al Mamun et al. (2017), Saidi et al. (2017), and so on. Only Seldadyo et al. (2007) pointed out that countries with lower governance quality had a bigger and more significant positive economic growth effect than countries with higher governance quality, but they paid attention to recursive regressions of 106 countries (including developed and developing), and utilized the cross-sectional data of the long-term average growth rate (1984–2004) of the per capita GDP, and only focused on the direct comparison of the coefficients. However, this paper develops the theory hypothesis on the diminishing marginal effect of good governance; proves it using the econometric model, annual real GDP per capita, and provincial panel data (2001–2015) in China; and discusses the high-quality economic development effect of good governance in detail.
The diminishing marginal effect of governance quality can be understood as follows: over the investigation period of 2001 to 2015, lower governance quality meant lower per capita GDP and greater economic growth potential, less mature overall framework of institution and greater dividends from system reform, and lower marginal institution cost of generating another unit of economic growth and more economic growth for another unit of governance improvement, resulting in higher marginal effect of governance quality (i.e., late-mover advantage); in addition, because three indicators of innovation subsidy, technology market, and intellectual property protection were included in the index system of China’s provincial governance quality assessment (see Table 1), and related to technical innovation ability and reform effect of science and technology system, lower governance quality also meant a less remarkable reform effect of the science and technology system, and weaker technical innovation ability, resulting in less innovation-driven effects (i.e., late-mover disadvantage). Therefore, lower governance quality could bring a higher marginal effect and less innovation-driven effect, which could be defined as a high-speed economic growth effect, with economic growth driven mainly by factors such as investment. In contrast, higher governance quality meant higher per capita GDP and less economic growth potential, more mature overall framework of institution and smaller dividends from system reform, and higher marginal institution cost of generating another unit of economic growth and less economic growth for another unit of governance improvement, resulting in lower marginal effect of governance quality (i.e., first-mover disadvantage); furthermore, higher governance quality also meant a more remarkable reform effect of the science and technology system, and stronger technical innovation ability, resulting in more innovation-driven effects (i.e., first-mover advantage). Hence, higher governance quality could bring a lower marginal effect and more innovation-driven effect, which could be defined as a high-quality economic development effect, with economic growth driven mainly by innovation. Obviously, the diminishing marginal effect of governance quality meant that as governance quality went up, the high-speed economic growth effect became less and less, while the high-quality economic development effect became more and more, which could be defined as the transformation effect of good governance on the economic growth pattern in China’s provincial regions during the period of 2001 to 2015.
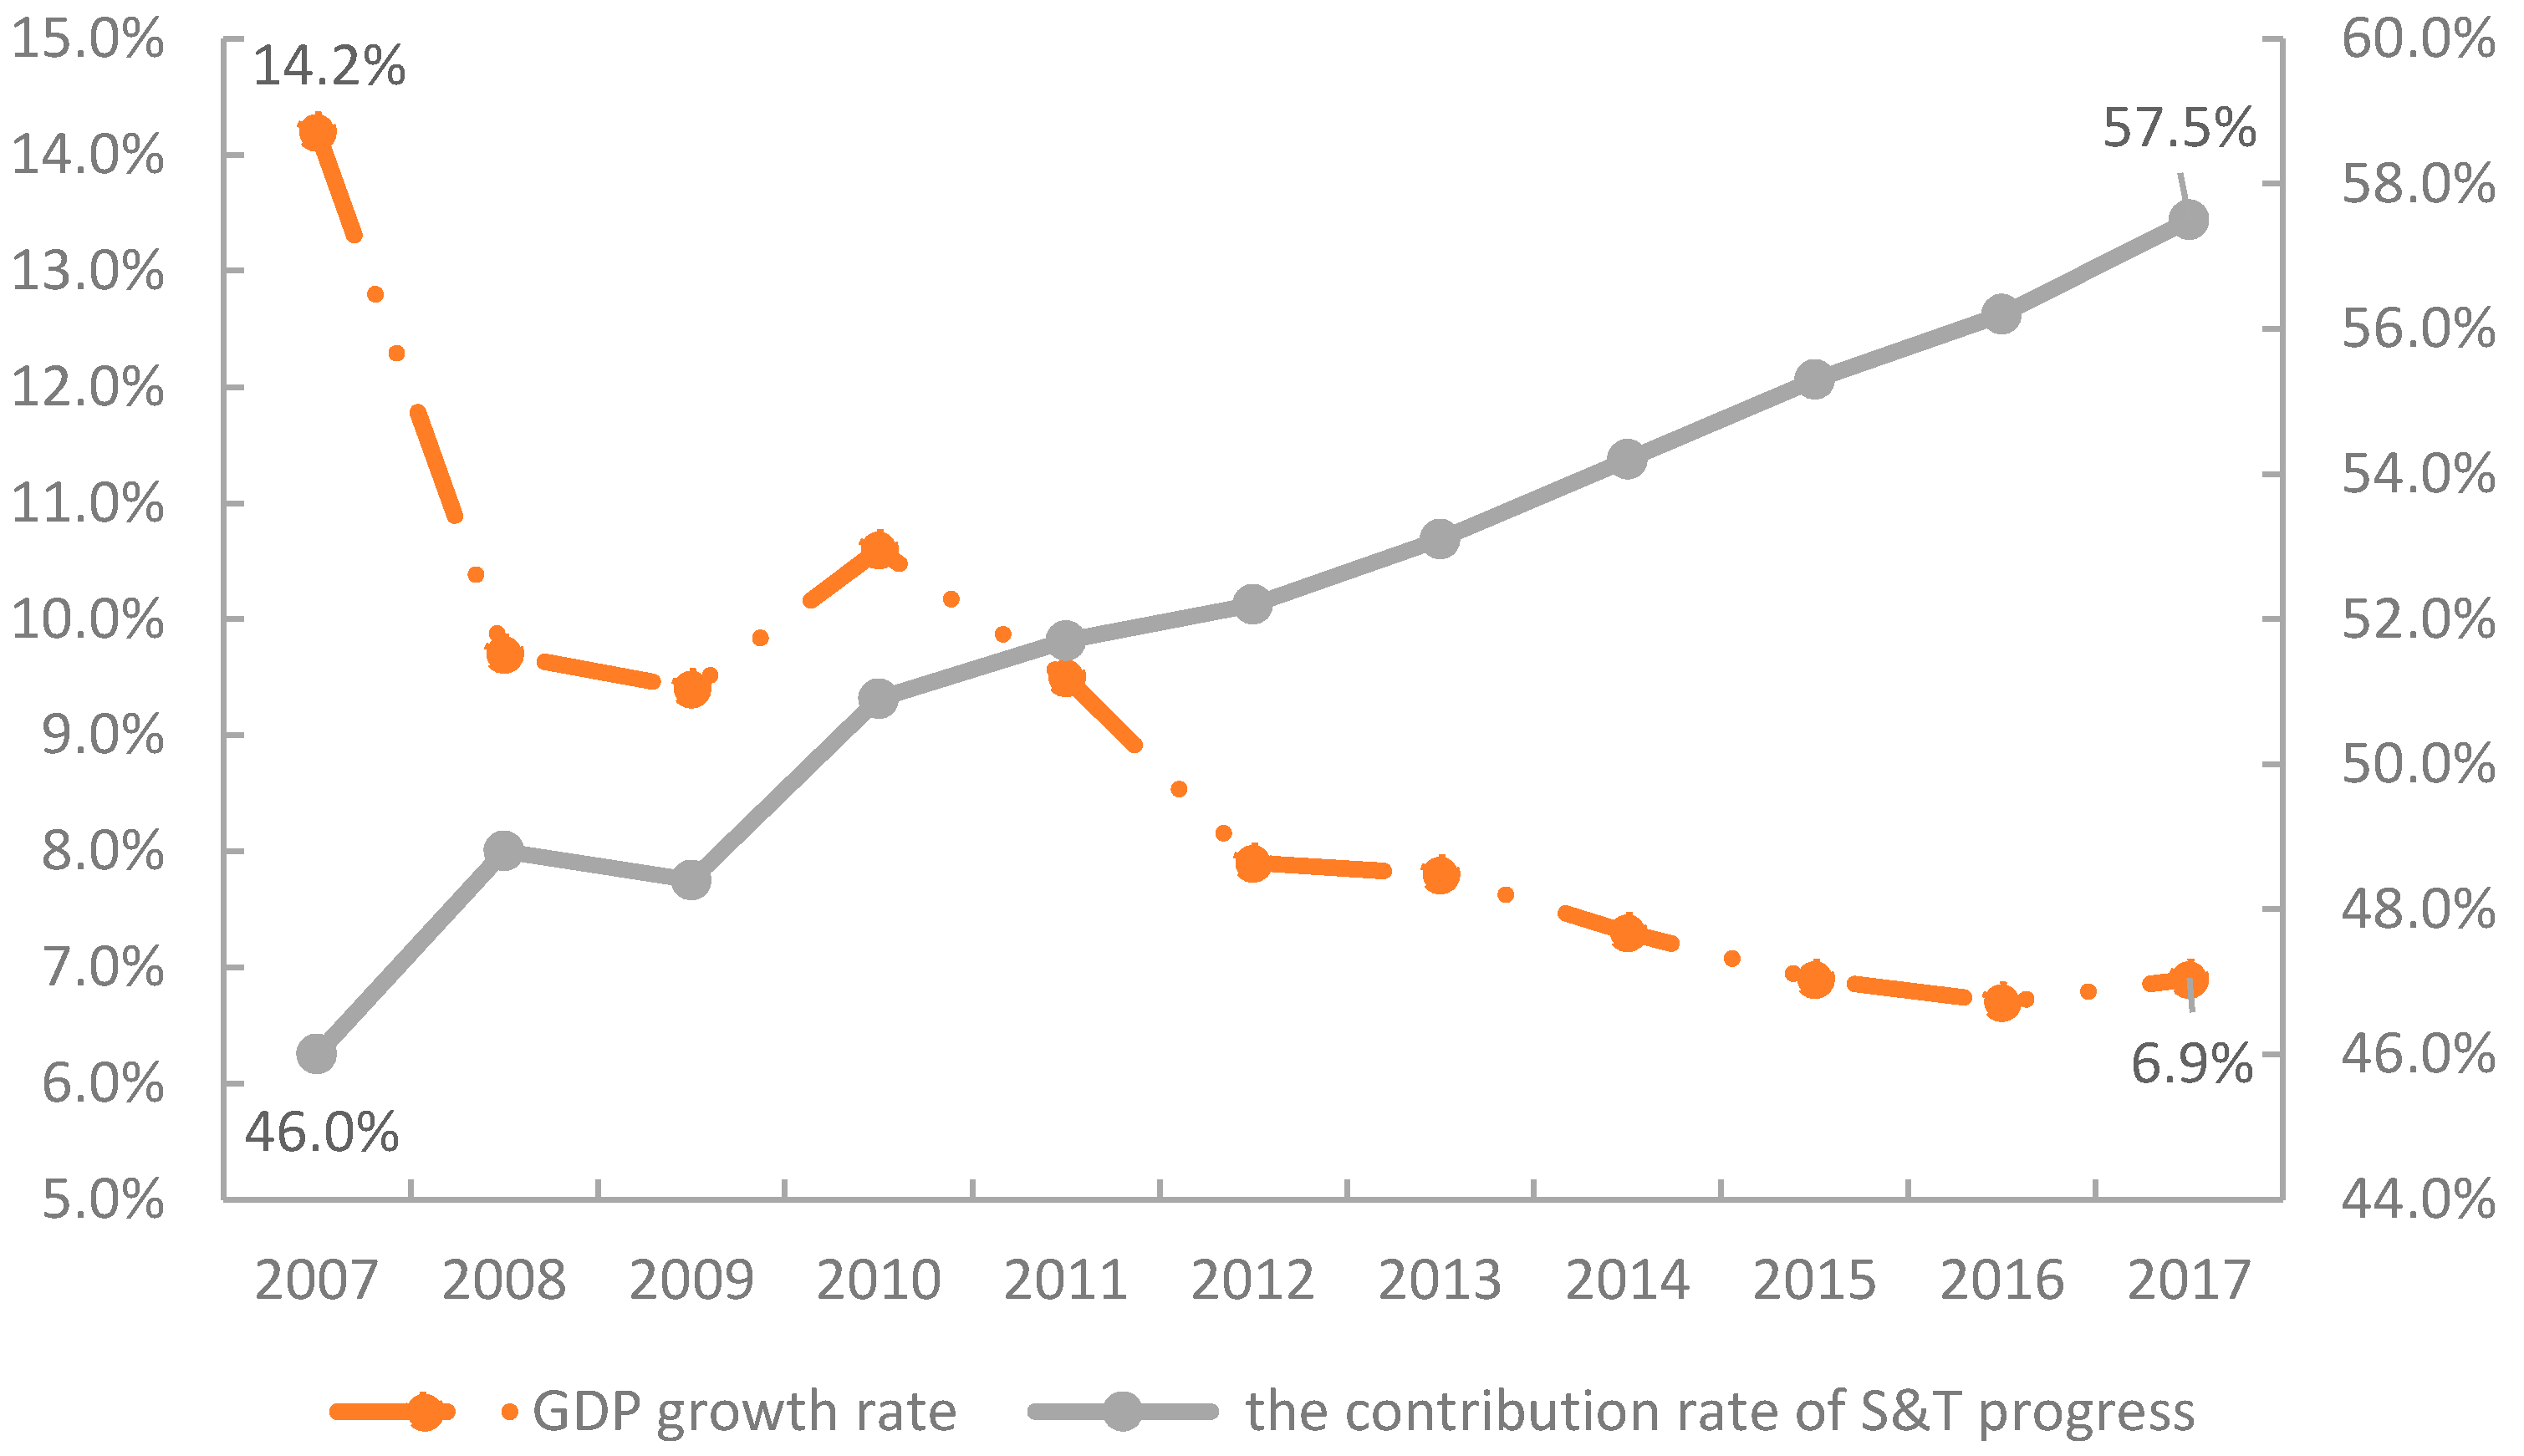
In addition to the theoretical explanation in the paragraph above, there are also some facts that can support our points. Actually, around 2008, with full implementation of the commitments to join the WTO, China had basically completed its integration with the global trading system, which meant the reform dividends began to become smaller. Furthermore, as the trade policies of the major developed countries, such as the United States and other major developed countries, have gradually become conservative, the global free trade system has been destroyed a great deal, resulting in the institutional dividends gradually becoming smaller. Therefore, China’s economic growth rate declined from 14.2% in 2007 to 6.9% in 2017 (see Figure 3), which meant that the high-speed economic growth effect became less. Meanwhile, the reform effect of the science and technology system, which began at the turn of the new century, has gradually emerged in China, resulting in stronger technical innovation ability. By 2017, the total research and development (R&D) investment in China was 1 trillion and 750 billion RMB (second only to the United States), with the R&D input intensity (2.12%) exceeding the average level of the 15 first countries in the European Union (EU) (2.08%); the PCT application in China reached 48,882, second only to the United States (56,624); the amount of invention patents application and authorization ranked first in the world, and the number of effective invention patents ranked third in the world. With the remarkable enhancement of scientific and technological innovation ability, new industries like the digital economy have been developing vigorously, while new formats and new models have been accelerating, resulting in more innovation-driven effects. Consequently, the contribution rate of S&T (scientific and technological) progress2 increased from 46% in 2007 to 57.5% in 2017, which meant that S&T progress brought about 57.5% of economic growth in 2017, and became more important than labor and capital, resulting in more high-quality economic development effect.
In Table 4 (Model 1), the coefficient of variable Open is significantly smaller than zero, which is consistent with the result obtained by Shao (2016), because the variable Open showed a downward trend in eight provincial regions of China over the period 2001–2015, which was in contrast to the upward trend of real per capita GDP over the same period. Higher education has a significant positive effect on economic growth, which is consistent with the finding from Shao (2016). The coefficient of variable Inv is significantly greater than zero, indicating that investment is always an important approach to promote economic growth, which does not conform to that obtained by Shao (2016), maybe because its sample period (1994–2011) is different from this paper’s period (2001–2015). The coefficient of variable Hum is about seven times that of variable Inv, and second only to the variable Gov, which shows that human capital has become an more important factor of economic development in China since entering the WTO; this result conforms to those obtained by Jin and Tao (2015) and Sun et al. (2016), and is consistent with the contribution rate of S&T process in Figure 3. The role of human capital could be understood as follows: mass workers with higher education significantly reduced the labor costs of high-tech enterprises in China, which helped China’s enterprises to make full use of the strategic opportunity of entering the WTO to effectively undertake industrial transfer from the developed countries, and to rapidly finish the upgrade from imitation innovation to independent innovation, resulting in sustainable development of China’s provincial economy.
4.3. Region Difference
The three economic regions in China (eastern region, central region, and western region) are different not only in geography to decide the difference on economic development level, but also in culture and history, which are key factors of marketization and rule of law, and have a significant effect on the relationship between governance quality and economic growth. Therefore, learning from existing literature (Lv and Zhu 2016), this paper takes the eastern region as a base, and sets two dummy variables (M and W) to estimate the fixed effect model. M equals one (1) if the sample belongs to the central region, and zero (0) otherwise. W equals one (1) if the sample belongs to the western region, and zero (0) otherwise. The estimation results are demonstrated in Table 4 (Model 3). Obviously, for the three regions, the quality of governance has a significant positive impact on local economic growth. At the same time, the positive effect of good governance is significantly higher in the western region than in the eastern region. Namely, there is significant region difference in the impact of governance quality on economic growth. Besides, according to the estimation results, the coefficients of the control variables are similar to that in basic analysis.
The region difference could be understood as follows: on the one hand, compared with the eastern region, the western region had a lower governance quality (or lower per capita GDP) for the period 2001–2015, which meant more late-mover advantages, greater dividends from system reform, and more economic growth for another unit of governance improvement, resulting in higher marginal effect of governance quality; moreover, lower governance quality also meant weaker technical innovation ability, and less remarkable reform effects of the science and technology system, resulting in less innovation-driven effects. Consequently, higher governance quality could bring a high-speed economic growth effect in western China, where economic growth was driven mainly by investment (i.e., more factor-driven effect). On the other hand, compared with the western region, the eastern region had a higher governance quality (or higher per capita GDP), which meant less late-mover advantages, smaller dividends from system reform, and less economic growth for another unit of governance improvement, resulting in lower marginal effects of governance quality; besides, higher governance quality also meant stronger technical innovation ability and more remarkable reform effects of the science and technology system, resulting in more innovation-driven effects. As a result, higher governance quality could bring a high-quality economic development effect in eastern China. In conclusion, the regional effect indicated that higher governance quality could bring a high-speed economic growth effect in western China, while higher governance quality could bring a high-quality economic development effect in eastern China, which meant that the region difference in governance quality could bring the region difference in economic growth mode transformation.
In addition to the theoretical explanations above, we can also find some evidence from practice. Actually, the input of independent innovation was small in quantity and low in intensity in the western region. In 2016, R&D expenditure was 194 billion 430 million RMB in the western region, lower than Guangdong’s expenditure (203 billion 510 million RMB); in addition to Shaanxi (2.19%), the R&D input intensity of other provincial regions was lower than the national average (2.11%) (see Figure 4). At the same time, the investment rate of fixed assets was high in the western region, with an obvious investment-driven characteristic. For example, in 2016, the investment rate of fixed assets was 98.87% and 112.12% in Chongqing and Guizhou, respectively, which was higher than the national average (81.50%). The development of new technology and new industries was slow, while the adjustment of industrial structure was lagging behind. For example, in 2016, the proportion of the third industries was 48.4% and 44.6% in Chongqing and Guizhou, respectively, which were lower than the national average level (51.6%). Obviously, the R&D input intensity was lower and the economic growth rate was higher in Chongqing and Guizhou, which meant less innovation-driven effect and higher marginal effect, resulting in high-speed economic growth effect, with economic growth driven mainly by factors such as investment in fixed assets. In contrast, the input of independent innovation was large in quantity and high in intensity in the eastern region. For example, all the six provincial regions with more than 100 billion RMB of R&D investment were in the eastern region, and all the provincial regions with higher R&D input intensity than the national average were almost in the eastern region (except Shaanxi); besides, the R&D input intensity of Beijing, Shenzhen, and Shanghai was 5.96%, 4.1%, and 3.82%, respectively, which was similar or over that of some developed economies with the highest R&D input intensity (Israel, South Korea, and Japan were 4.25%, 4.23%, and 3.49%, respectively). At the same time, the investment rate continued to decline in the eastern region, while new industries flourished, with the industrial structure continuing to optimize. For example, in 2016, the investment rate was only 33.98% and 24.60% in Beijing and Shanghai, respectively, which was far below the national average investment rate; the proportion of third industries was 80.3% and 69.8% in Beijing and Shanghai, respectively, which meant the development stage of service economy and the development level were much higher than the national average. Therefore, the R&D input intensity was higher and the economic growth rate was lower in Beijing and Shanghai, which meant more innovation-driven effect and lower marginal effect, resulting in high-quality economic development effect, with economic growth driven mainly by innovation.
4.4. Period Difference
In 2007, the subprime crisis broke out in the United States, causing the global economic crisis, which may affect foreign trade, fixed-asset investment, and urbanization in China, resulting in impact on the economic growth effect of governance quality in China. Therefore, this article divides the sample into two periods: 2001–2007 and 2008–2015, with 2001–2007 as a benchmark period, and constructs a dummy variable, P, which equals one (1) if the sample belong to period 2008–2015, and zero (0) otherwise. The estimation results are demonstrated in Table 4 (Model 4). Obviously, the coefficient of variable Gov is significantly positive, while the coefficient of variable Gov2 is significantly negative. Therefore, during the investigation period (2001–2007), governance quality had a significant impact on economic growth, which showed significant diminishing marginal phenomenon. Meanwhile, the coefficients of variables P*Gov and P*Gov2 are not significant, so there is no significant difference between the two periods. At the same time, according to the estimation results, the coefficients of the control variables are similar to those in basic analysis.
4.5. Robustness Checks
4.5.1. Endogeneity Concern
Some studies show that economic growth also affects the quality of governance (Wilson 2016; Kaufmann and Kraay 2002; Seldadyo et al. 2010), namely, the quality of governance and economic growth may interact with each other, leading to an endogenous problem. Other variables may have similar problems, which could cause estimation bias (biased and inconsistent). Therefore, this article uses 2SLS (two-stage least squares) to estimate the model. In the first stage, all explanatory variables take one-year lag values, which are used as IVs (instrumental variables), to estimate the model. Relative to the current variable, the lag variable is the fact that has already happened, thus the lag variable is predetermined. The current variable and the predetermined variable are related, while the predetermined variable is not related with the random error, therefore, the predetermined variable is exogenous strong IV (Lv and Zhu 2016; Zhou 2016). According to the statistical test, the F test is significant (F = 3.96, P = 0.000), which suggests that the IV is valid. The estimation results of 2SLS second stage are demonstrated in Table 5 (Model 5). Compared with the regression results in Table 4 (Model 1), after eliminating endogeneity, governance quality still has a significant positive effect on economic growth, which shows a significant diminishing marginal phenomenon, so the main conclusions are reliable. Meanwhile, the parameter estimation results of all control variables are consistent with those in Table 4 (Model 1), which confirms the robustness of our results.
However, the endogeneity of governance quality leads to an upward move of the estimation coefficient of variable Gov, and tends to overestimate the effect of good governance on economic growth, which means economic growth can also affect governance quality; this result conforms to those obtained by Seldadyo et al. (2010), Ward and Dorussen (2015), and Wilson (2016). For the impact of economic growth on governance quality, there are some reasons, such as the following: the first is income effect, the increase of income level can bring the increase of demand for higher level of governance quality in China (Kaufmann and Kraay 2002), which means people would pay more attention to maintain their own expression rights and participation rights, and to improve the rule of law and the quality of public services; the second is complexity effect, economic growth, by increasing the complexity of trade, may strengthen the relative efficiency of formal governance mechanisms (Dixit 2003), which can create strong incentives for the improvement of governance quality; the third is practice effect, the great success of economic development can prompt political leaders to formally adopt informal governance practices that have been proven to be effective in supporting economic development (Nee and Opper 2012); the fourth is constituency effect, economic growth may create a constituency of businesses and consumers, who have the interest and ability to prompt the improvement of governance quality (Wilson 2016); and the fifth is supply effect, economic development can bring more resources such as funds, which enables the improvement in governance quality.
4.5.2. Sample Selection
In mainland China, some provincial party secretaries are also members of the political bureau of the CPC central committee, and have more high-level political resources than other provincial regions. Existing studies show that the political power structure may affect the economic system and economic policies (Liu et al. 2013; Li et al. 2014), which further influences regional economic growth. Therefore, this paper excludes the provinces with more high-level political resources, such as Beijing, Shanghai, Tianjin, Chongqing, Guangdong, and Xinjiang, and estimates the model with the remaining samples. The result shows that the correlation coefficient of random error and individual effect is small (close to zero), meeting the applicable condition of the random effect model, so the random effect model is adopted. In order to solve heteroscedasticity and autocorrelation, the GLS (generalized least square) estimation method is adopted in this section, which ensures the validity of the estimator. The estimation results are demonstrated in Table 5 (Model 6). Compared with the results in Table 4 (Model 1), after excluding the six provincial regions with more high-level political resources, governance quality still has a significant positive effect on economic growth in the remaining provincial regions, which still shows a significant diminishing marginal phenomenon. At the same time, the parameter estimation results of control variables, except variable Open, are basically reliable, which means the sample selection does not significantly affect the main conclusions.
4.5.3. Variable Selection
In the basic analysis of the previous content, this paper uses the annual real GDP per capita as the dependent variable, the annual comprehensive index of governance quality as the core explanatory variable, and the annual values of other explanatory variables, which belongs to the perspective of static analysis. In order to investigate the robustness of the research conclusions, this section selects the 10 years’ relative improvement of real GDP per capita as the dependent variable, the 10 years’ relative improvement of the comprehensive index of governance quality as the core explanatory variable, and the 10 years’ relative improvement of other explanatory variables, which belongs to the perspective of dynamic analysis. Finally, this paper obtains 120 samples, and estimates the fixed effect model, with the results shown in Table 5 (Model 7). Obviously, the greater the 10 years’ relative improvement of governance quality is, the greater the 10 years’ relative improvement of the real GDP per capita would be. At the same time, with one unit of the 10 years’ relative improvement of governance quality, the 10 years’ relative improvement of the real GDP per capita declined gradually, which meant the significant diminishing marginal phenomenon in the effect of governance quality on economic growth, which is consistent with the main conclusions of the basic analysis. Additionally, variables Edu and Hum still have significant positive effects on economic growth.
4.5.4. Model Selection
In the basic analysis, this paper uses the semi logarithmic model. In order to investigate the robustness of the research conclusions, this section uses the double logarithm model, takes the natural logarithms of all the explanatory variables, and estimates the fixed effect model and the individual intercepts (see Appendix C) of all the provincial regions, with results demonstrated in Table 5 (Model 8). The coefficient of variable Gov is about 2.48 and significant at 1%, which means the real GDP per capita growth rate is 2.47% when the governance quality increases by 1%, indicating a significant positive effect of good governance on economic growth in China’s provincial regions. At the same time, the growth of real GDP per capita decreases with one unit of increase in governance quality, which means evidence in favor of a significant diminishing marginal effect of good governance on economic growth, conforming to the results in the basic analysis. Besides, the parameter estimation results of all control variables are robust.
5. Conclusions and Policy Implications
Based on the core connotation of “China’s local governance”, this paper develops a theoretical framework for the effect of governance quality on local economic growth in China, constructs a new comprehensive index of governance quality in provincial regions, and empirically investigates the effect of governance quality on economic growth over the period 2001–2015 by utilizing panel data in China’s provincial regions. The main conclusions are as follows:
Firstly, good governance exerts a significant positive effect on economic growth in China’s provincial regions. Overall, governance quality could positively affect real GDP per capita, because good governance meant good public service, marketization, and rule of law, et al., which could encourage the “helping hand” of power or inhibit the “grabbing hand” of power, resulting in good economic growth performance. Meanwhile, the positive effect is not significantly affected by endogenous concern, sample selection, model selection, variable selection, region difference, and period difference, which implies that the conclusion is robust.
Secondly, the marginal effect of governance quality on economic growth is diminishing. Namely, as governance quality goes up, the improvement of real GDP per capita declines, due to less late-mover advantages, and smaller dividends from system reform, whereas there was more reform effect of the science and technology system, stronger technical innovation ability, and more innovation-driven effect, resulting in more high-quality economic development effect and less high-speed economic growth effect. This result is not significantly affected by endogenous concern, sample selection, model selection, variable selection, and period difference, which indicates that the result is reliable.
Thirdly, the region difference in governance quality could explain the region difference in economic performance. The higher the level of governance quality is in a provincial region, the higher the local real GDP per capita would be, which means the provincial difference in governance quality could explain the provincial difference in the level of economic development. Furthermore, because the governance quality in the eastern region is generally higher than that in the western region of China, higher governance quality could bring significant high-quality economic development effect in the eastern region, while higher governance quality could bring significant high-speed economic growth effect in the western region, which implies that the region difference in governance quality could lead to the region difference in the transformation effect of good governance on economic growth pattern.
Finally, human capital is an important engine driving provincial economic growth in China. If this article does not consider the impact of governance quality, according to the estimation coefficients of five control variables, the three major determinants of economic growth could be ranked as follows: human capital, education development, and investment proportion, which is not significantly affected by endogenous concern, region difference, period difference, and sample selection. Therefore, compared with the traditional fixed-asset investment, human capital has played a more important role in economic development, and becomes an important engine for the take-off of China’s provincial economy since 2001, due to the expansion of college enrollment in China.
Therefore, the lessons learned are as follows: good governance is very important for economic growth, better governance means higher GDP per capita, which is consistent with the study from Al Mamun et al. (2017), who focused on country-level data (including developing and developed countries); good governance can bring the transformation of economic growth pattern, with more innovation-driven effect and high-quality economic development effect, which is ignored by existing studies; the marginal effect of governance quality on economic growth is diminishing, which is similar to the investigation from Seldadyo et al. (2007), who chose 106 countries (including developed and developing) and only focused on the direct comparison of the coefficients using recursive regressions, without discussion of high-speed economic growth effect; human capital is an important driver for per capita GDP growth in the long-run, which conforms to the studies from Jin and Tao (2015), Sun et al. (2016), and Shao (2016).
The results and lessons above lead to some policy implications:
Firstly, governance quality should be improved continuously to promote economic growth in China’s provincial regions. On the one hand, with governance quality ranking in the bottom 50% in 2015, the provincial regions, such as Jilin, Heilongjiang, Shanxi, Ningxia, Hunan, Henan, Anhui, Sichuan, Jiangxi, Xinjiang, Qinghai, and Guizhou, should try their best to improve local governance quality, releasing the potential of regional economic growth. On the other hand, more attention should be paid to the weak aspects of local governance, such as improving the quality of the civil service and building a clean, efficient, and service-oriented government, encouraging private enterprises to develop and cultivating intermediaries such as industry associations, protecting intellectual property rights, and encouraging the development of lawyer profession, resulting in encouraging the “helping hand” or inhibiting the “grabbing hand”. Additionally, there are also some important implications at the international level, for example, the developing countries usually have low governance quality, so they should improve governance quality from all aspects, which will help them become high-income countries; meanwhile, the developed countries should pay more attention to the weak aspects of their governance quality.
Secondly, more attention should be paid to the strategy of independent innovation and the path of innovative development. Relying on imitation and large-scale resources input, and the release of late-mover advantages, China has achieved great economic growth, but this is an unsustainable economic development model. Therefore, western and central regions need to learn the successful experience of the eastern region, for example, creating a good climate for innovation and entrepreneurship, increasing the intensity of subsidies on scientific and technological innovation, encouraging industrial enterprises to increase the research and development input, promoting the transformation, and upgrading of industrial products from low-end to high-end. Moreover, the developing countries should pay more attention to independent innovation, and develop some comparative advantages in certain areas, while the developed countries should enhance their first-mover advantages in scientific and technological innovation.
Finally, China should continuously optimize the higher education system and effectively promote the accumulation of high-quality human capital. On the one hand, some universities and colleges should transform to higher professional education, and focus on cultivating a large number of senior skilled workers. Meanwhile, the central government should play a more important role in the development of key universities, strengthening the financial support to the first-class universities and the first-class disciplines, encouraging key universities to carry out the reform of scientific research system, and improve the internal governance structure of university, which results in the formation of a system conducive to the development of the university. On the other hand, by creating a good institutional environment, living environment, and so on, China should attract the world’s top intelligence resources, and effectively promote the transformation of factor endowment from labor-intensive structure to intelligence-intensive and knowledge-intensive structure. Furthermore, both developing and developed countries should improve their higher education system, and accelerate the accumulation of high-quality human capital, which is in favor of promoting sustainable and high-quality economic development.
This study has some limitations, and can be improved in several directions. Firstly, because the paper chooses provincial panel data during the period 2001–2015, an extension is important to utilize urban panel data with a longer time period. Secondly, the study just focuses on the effect of local governance on local economic growth, an investigation focusing on the spillover effect of good governance on economic growth could offer more interesting findings. Thirdly, the article investigates the relationship between governance quality and economic growth directly, so a study focusing on the effects of a number of mediating factors could bring some special results.
Author Contributions
J.L. gathered data and wrote the whole paper. J.T. supervised the write-up of the paper. J.T. and J.L. designed the study. B.Z. and Z.L. performed the econometric analysis. All authors discussed the empirical results.
Funding
The investigation is not funded by any organization.
Acknowledgments
We are grateful to two anonymous reviewers and the editors for their comments, which have helped us greatly in improving our paper.
Conflicts of Interest
The authors declare no conflict of interest.
Appendix A

Table A1.
The factor loadings of 14 variables.
| Variables | Factor 1 | Factor 2 | Variables | Factor 1 | Factor 2 |
|---|---|---|---|---|---|
| Financial resource | 0.135 | −0.014 | Technology market | 0.129 | −0.015 |
| Infrastructure | −0.136 | 0.270 | Non-state-owned output | −0.089 | 0.233 |
| Innovation subsidy | 0.153 | −0.040 | Factor market | −0.080 | 0.222 |
| Education development | 0.165 | −0.077 | Lawyer | 0.160 | −0.046 |
| Medical care | 0.220 | −0.136 | Litigation business | 0.110 | −0.010 |
| Non-state-owned employment | −0.087 | 0.230 | Law office | 0.204 | −0.108 |
| Non-state-owned investment | −0.049 | 0.197 | Intellectual property protection | 0.071 | 0.065 |
Appendix B
Table A2.
Comprehensive index of governance quality in China’s provincial regions (2001–2007).
| Regions | 2001 | 2002 | 2003 | 2004 | 2005 | 2006 | 2007 |
|---|---|---|---|---|---|---|---|
| Beijing | 91.91 | 95.86 | 98.21 | 100.25 | 102.66 | 104.86 | 106.52 |
| Tianjin | 82.60 | 84.69 | 85.67 | 87.54 | 89.86 | 90.79 | 92.24 |
| Shanxi | 56.45 | 57.54 | 59.17 | 59.72 | 62.62 | 65.49 | 65.56 |
| Liaoning | 68.56 | 70.61 | 72.29 | 74.21 | 75.33 | 77.33 | 79.25 |
| Jilin | 59.19 | 60.20 | 61.32 | 61.85 | 63.55 | 65.77 | 68.25 |
| Heilongjiang | 58.31 | 59.99 | 61.17 | 60.70 | 62.30 | 64.18 | 67.01 |
| Shanghai | 95.28 | 97.41 | 98.42 | 99.75 | 102.34 | 103.42 | 105.19 |
| Jiangsu | 70.39 | 71.97 | 74.43 | 76.23 | 79.01 | 81.88 | 84.32 |
| Zhejiang | 72.37 | 74.08 | 76.43 | 78.63 | 80.71 | 82.94 | 85.84 |
| Anhui | 53.82 | 55.80 | 56.43 | 58.87 | 61.78 | 64.25 | 67.85 |
| Fujian | 64.30 | 65.64 | 66.93 | 68.13 | 69.91 | 71.54 | 72.77 |
| Jiangxi | 51.77 | 53.72 | 55.30 | 57.22 | 58.08 | 60.85 | 63.49 |
| Shandong | 64.42 | 66.37 | 68.65 | 71.05 | 73.62 | 75.14 | 77.61 |
| Henan | 54.65 | 55.97 | 57.57 | 59.62 | 62.87 | 65.24 | 67.89 |
| Hubei | 60.12 | 60.72 | 62.54 | 64.00 | 65.94 | 68.08 | 70.38 |
| Hunan | 55.19 | 57.24 | 58.73 | 60.43 | 63.15 | 65.04 | 67.24 |
| Guangdong | 69.05 | 70.36 | 73.04 | 73.75 | 76.77 | 79.29 | 81.19 |
| Chongqing | 60.55 | 63.18 | 65.25 | 67.31 | 68.26 | 70.91 | 72.95 |
| Sichuan | 52.87 | 54.33 | 56.12 | 57.30 | 59.68 | 62.15 | 65.81 |
| Guizhou | 39.45 | 43.08 | 44.74 | 45.42 | 49.04 | 50.30 | 53.03 |
| Shaanxi | 57.12 | 59.37 | 60.91 | 61.08 | 63.97 | 66.19 | 69.02 |
| Qinghai | 44.48 | 45.78 | 44.20 | 47.46 | 49.83 | 52.68 | 55.19 |
| Ningxia | 56.12 | 57.25 | 58.80 | 60.05 | 61.47 | 61.76 | 65.25 |
| Xinjiang | 49.64 | 50.66 | 51.95 | 52.93 | 53.74 | 55.82 | 57.44 |
Note: All data for calculating those scores are obtained from China Statistical Yearbook (2002–2016) and China Statistical Yearbook on Science and Technology (2002–2016).
Table A3.
Comprehensive index of governance quality in China’s provincial regions (2008–2015).
| Regions | 2008 | 2009 | 2010 | 2011 | 2012 | 2013 | 2014 | 2015 |
|---|---|---|---|---|---|---|---|---|
| Beijing | 109.41 | 110.10 | 111.44 | 113.00 | 112.59 | 116.06 | 115.33 | 117.25 |
| Tianjin | 94.14 | 96.36 | 98.53 | 100.76 | 101.15 | 104.20 | 104.52 | 106.35 |
| Shanxi | 68.95 | 70.52 | 71.97 | 76.22 | 78.82 | 80.79 | 80.75 | 82.40 |
| Liaoning | 81.20 | 83.22 | 85.44 | 87.32 | 89.21 | 90.11 | 90.13 | 88.00 |
| Jilin | 70.02 | 72.45 | 73.31 | 74.45 | 78.34 | 79.51 | 78.57 | 80.55 |
| Heilongjiang | 69.25 | 71.20 | 70.95 | 75.28 | 78.26 | 79.31 | 79.42 | 79.19 |
| Shanghai | 107.36 | 108.27 | 109.50 | 110.88 | 110.39 | 113.12 | 112.75 | 114.45 |
| Jiangsu | 86.97 | 89.12 | 92.33 | 94.79 | 96.66 | 98.43 | 98.74 | 100.57 |
| Zhejiang | 87.80 | 89.69 | 91.16 | 93.39 | 95.01 | 96.80 | 97.79 | 100.10 |
| Anhui | 69.42 | 72.36 | 76.49 | 78.70 | 82.01 | 83.99 | 86.00 | 88.34 |
| Fujian | 74.96 | 78.08 | 80.71 | 83.10 | 85.44 | 87.29 | 88.77 | 91.45 |
| Jiangxi | 65.09 | 67.99 | 70.64 | 73.89 | 75.35 | 77.28 | 79.52 | 82.35 |
| Shandong | 79.68 | 81.86 | 84.33 | 86.91 | 88.91 | 91.02 | 92.34 | 94.05 |
| Henan | 69.22 | 71.33 | 73.66 | 76.23 | 79.01 | 80.05 | 82.32 | 84.64 |
| Hubei | 72.37 | 74.62 | 76.78 | 79.65 | 82.72 | 84.53 | 86.75 | 89.29 |
| Hunan | 69.31 | 71.80 | 73.63 | 75.85 | 78.42 | 80.06 | 81.94 | 83.53 |
| Guangdong | 83.61 | 86.00 | 87.65 | 89.31 | 90.63 | 93.10 | 93.83 | 96.52 |
| Chongqing | 75.46 | 78.75 | 82.58 | 85.62 | 87.63 | 88.60 | 91.06 | 92.47 |
| Sichuan | 68.46 | 70.85 | 73.59 | 76.05 | 79.45 | 80.37 | 82.58 | 84.62 |
| Guizhou | 55.27 | 57.25 | 61.71 | 65.79 | 69.02 | 72.48 | 75.37 | 77.62 |
| Shaanxi | 71.49 | 74.46 | 77.82 | 81.35 | 84.18 | 86.61 | 87.61 | 89.10 |
| Qinghai | 56.53 | 58.38 | 60.81 | 62.92 | 64.96 | 66.11 | 67.71 | 70.53 |
| Ningxia | 66.95 | 69.51 | 70.79 | 74.54 | 76.93 | 78.51 | 80.61 | 83.06 |
| Xinjiang | 59.17 | 59.01 | 62.48 | 64.41 | 66.07 | 67.91 | 69.39 | 71.65 |
Note: All data for calculating those scores are obtained from China Statistical Yearbook (2002–2016) and China Statistical Yearbook on Science and Technology (2002–2016).
Appendix C
Table A4.
Individual intercepts of provincial regions in China.
| Regions | Coefficients | Regions | Coefficients | Regions | Coefficients |
|---|---|---|---|---|---|
| Beijing | −0.470776 *** | Zhejiang | −0.098884 | Guangdong | 0.137882 |
| Tianjin | −0.144678 * | Anhui | −0.493372 *** | Chongqing | −0.400398 *** |
| Shanxi | −0.381706 *** | Fujian | 0.108285 | Sichuan | −0.374084 *** |
| Liaoning | −0.178343 *** | Jiangxi | −0.413555 *** | Guizhou | −0.520935 *** |
| Jilin | −0.187451 *** | Shandong | −0.112753 | Shaanxi | −0.620605 *** |
| Heilongjiang | −0.041370 | Henan | −0.342923 *** | Qinghai | −1.823095 *** |
| Shanghai | −0.158130 | Hubei | −0.463751 *** | Ningxia | −0.518526 *** |
| Jiangsu | −0.098704 | Hunan | −0.380376 *** | Xinjiang | 0.008134 |
Note: *, **, and *** indicate statistical significance at 10%, 5%, and 1%.
References
- Adedokun, Adeniyi Jimmy. 2017. Foreign aid, governance and economic growth in Sub-Saharan Africa: Does one cap fit all? African Development Review 29: 184–96. [Google Scholar] [CrossRef]
- Al Mamun, Md, Kazi Sohag, and M. Kabir Hassan. 2017. Governance, resources and growth. Economic Modelling 63: 238–61. [Google Scholar] [CrossRef]
- Campos, J. Edgardo, Donald Lien, and Sanjay Pradhan. 1999. The impact of corruption on investment: Predictability matters. World Development 27: 1059–67. [Google Scholar] [CrossRef]
- Dahlström, Carl, Victor Lapuente, and Jan Teorell. 2012. The merit of meritocratization: Politics, bureaucracy, and the institutional deterrents of corruption. Political Research Quarterly 65: 656–68. [Google Scholar] [CrossRef]
- Dixit, Avinash. 2003. Trade expansion and contract enforcement. Journal of Political Economy 111: 1293–317. [Google Scholar] [CrossRef]
- Dong, Xuebing, Hui Zhu, Jijun Kang, and Shunfeng Song. 2012. The effect of intellectual property rights protection system on Chinese economic growth during transition period. Economic Research Journal 8: 4–17. [Google Scholar]
- Evans, Peter, and James E. Rauch. 1999. Bureaucracy and growth: A cross national analysis of the effects of “Weberian” state structures on economic growth. American Sociological Review 64: 748–65. [Google Scholar] [CrossRef]
- Faguet, Jean Paul. 2014. Decentralization and governance. World Development 53: 2–13. [Google Scholar] [CrossRef]
- Fan, Gang, Xiaolu Wang, and Guangrong Ma. 2011a. Contribution of marketization to China’s economic growth. Economic Research Journal 9: 4–16. [Google Scholar]
- Fan, Gang, Xiaolu Wang, and Hengpeng Zhu. 2011b. NERI INDEX of Marketization of China’s Provinces 2011 Report. Beijing: Economic Science Press, pp. 12–72. [Google Scholar]
- Fayissa, Bichaka, and Christian Nsiah. 2013. The impact of governance on economic growth in Africa. The Journal of Developing Areas 47: 91–108. [Google Scholar] [CrossRef]
- Fukuyama, Francis. 2013. What is governance? Governance 26: 347–68. [Google Scholar] [CrossRef]
- Hall, Robert E., and Charles I. Jones. 1999. Why do some countries produce so much more output per worker than others? Quarterly Journal of Economics 114: 83–116. [Google Scholar] [CrossRef]
- Huynh, Kim P., and David T. Jacho-Chávez. 2009. Growth and governance: A nonparametric analysis. Journal of Comparative Economics 37: 121–43. [Google Scholar] [CrossRef]
- Jiang, Yang, Xin Fan, and Xinyu Zhao. 2017. Government governance and public happiness. Management World 3: 172–73. [Google Scholar]
- Jin, Tao, and Xinyu Tao. 2015. Analyzing and comparing periodic power of China’s continuous economic growth. The Journal of Quantitative & Technical Economics 11: 74–89. [Google Scholar]
- Kaufmann, Daniel, and Aart Kraay. 2002. Growth without governance. Economia 3: 169–229. [Google Scholar] [CrossRef]
- Knack, Stephen, and Philip Keefer. 1995. Institutions and economic performance: Cross-country tests using alternative institutional measures. Economics & Politics 7: 207–27. [Google Scholar]
- Kurtz, Marcus J., and Andrew Schrank. 2007. Growth and governance: Models, measures, and mechanisms. Journal of Politics 69: 538–54. [Google Scholar] [CrossRef]
- Li, Feiyue, Dong Zhang, and Mingxing Liu. 2014. Distribution of de facto political power and regional economic growth: The long-run effects of China’s revolutionary war. Economic Research Journal 12: 45–59. [Google Scholar]
- Lin, Yifu. 2014. New Structural Economics: A Theoretical Framework for Rethinking Economic Development and Policy, rev. ed. Beijing: Peking University Press, pp. 19–96. [Google Scholar]
- Liu, Xiaolu. 2011. The protection of intellectual property rights, the proportion of independent research and development, and the technological progress of developing countries. Management World 10: 10–19. [Google Scholar]
- Liu, Mingxing, Dong Zhang, Tao Qian, and Qi Zhang. 2013. Informal power structure and economic policy of local government in China. Sociological Studies 5: 26–52. [Google Scholar]
- Liu, Jiandang, Jie Tang, Dong Wang, and Senlin Zhu. 2016. Governance: Origin, connotation and application. Paper presented at the 5th EEM International Conference on Education Science and Social Science (EEM-ESSS 2016), Sydney, Australia, December 24–25. [Google Scholar]
- Liu, Jiandang, Xin Dai, Jie Tang, Dong Wang, and Zhijun Liang. 2017. The provincial governance quality in China: An empirical study of three dimensions. Paper presented at the 3rd International Conference on Creative Education (ICCE 2017), Kuala Lumpur, Malaysia, March 3–4. [Google Scholar]
- Liu, Jiandang, Jie Tang, and Dong Wang. 2018. A comparative study of governance quality assessment: A literature review. Journal of Dalian Maritime University (Social Science Edition) 17: 59–65. [Google Scholar]
- Lu, Feng, and Yang Yao. 2004. Legality, financial development and economic growth under financial repression. Social Sciences in China 1: 42–55. [Google Scholar]
- Lv, Chaofeng, and Dandan Zhu. 2016. How does marketization reform affect long-term economic growth?—Based on the perspective of market potential. Management World 269: 32–44. [Google Scholar]
- Murrell, Peter, and Mancur Olson. 1991. The devolution of centrally planned economies. Journal of Comparative Economics 15: 239–65. [Google Scholar] [CrossRef]
- Nee, Victor, and Sonja Opper. 2012. Capitalism from Below: Markets and Institutional Change in China. Cambridge: Harvard University Press, pp. 67–178. [Google Scholar]
- North, Douglass C. 1990. Institutions, Institutional Change, and Economic Performance. Cambridge: Cambridge University Press, pp. 78–110. [Google Scholar]
- Olson, Mancur, Jr., Naveen Sarna, and Anand V. Swamy. 2000. Governance and growth: A simple hypothesis explaining cross-country differences in productivity growth. Public Choice 102: 341–64. [Google Scholar] [CrossRef]
- Qian, Yingyi. 2002. How Reform Worked in China. CEPR Discussion Paper No. 3447. Available online: https://ssrn.com/abstract=324978 (accessed on 27 August 2002).
- Qian, Yingyi, and Barry R. Weingast. 1997. Federalism as a Commitment to Preserving Market Incentives. Journal of Economic Perspective 11: 83–92. [Google Scholar] [CrossRef] [Green Version]
- Quibria, Muhammad G. 2006. Does Governance Matter? Yes, No or Maybe: Some Evidence from Developing Asia. Kyklos 1: 99–114. [Google Scholar] [CrossRef]
- Rauch, James E. 1995. Bureaucracy, infrastructure, and economic growth: Evidence from U.S. cities during the progressive era. American Economic Review 85: 968–79. [Google Scholar]
- Rotberg, Robert I. 2014. Good governance means performance and results. Governance 27: 511–18. [Google Scholar] [CrossRef]
- Saidi, Hichem, Houssem Rachdi, and Nidhal Mgadmi. 2017. Revisiting the Role of Governance and Institutions in the Impact of Financial Liberalization on Economic Growth Using the PSTR Model. Panoeconomicus 3: 315–36. [Google Scholar] [CrossRef]
- Seldadyo, Harry, Emmanuel Pandu Nugroho, and Jakob De Haan. 2007. Governance and growth revisited. Kyklos 60: 279–90. [Google Scholar] [CrossRef]
- Seldadyo, Harry, J. Paul Elhorst, and Jakob De Haan. 2010. Geography and governance: Does space matter? Papers in Regional Science 89: 625–40. [Google Scholar] [CrossRef]
- Setayesh, Mohammad Hossein, and Abbas Ali Daryaei. 2017. Good governance, innovation, economic growth and the stock market turnover rate. The Journal of International Trade & Economic Development 26: 829–50. [Google Scholar]
- Shao, Chuanlin. 2016. Chinese-style decentralization, marketization process and economic growth. Statistical Research 33: 63–71. [Google Scholar]
- Shi, Xuehua, and Shengju Fang. 2010. The design of public management efficiency assessment index system in China provincial government. Cass Journal of Political Science 2: 56–66. [Google Scholar]
- Sun, Yefei, Qing Xia, and Min Zhou. 2016. The economic growth effects of new urbanization development and industrial structure change. The Journal of Quantitative & Technical Economics 11: 23–40. [Google Scholar]
- Tang, Jie, Jiandang Liu, Dong Wang, Weiteng Lin, and Chang Su. 2018. Assessment system and empirical study on China’s local governance quality. International Journal of Sustainable Development and Planning 13: 773–89. [Google Scholar] [CrossRef]
- Tian, Fa, and Chenying Zhou. 2016. Social governance in China: Index, convergence and influential factors. Public Finance Research 8: 54–65. [Google Scholar]
- Wang, Xiaolu, Gang Fan, and Jingwen Yu. 2017. Marketization Index of China’s Provinces: NERI REPORT 2016. Beijing: Social Sciences Academic Press, pp. 10–76. [Google Scholar]
- Ward, Hugh, and Han Dorussen. 2015. Public information and performance: The role of spatial dependence in the Worldwide Governance Indicators among African countries. World Development 74: 253–63. [Google Scholar] [CrossRef]
- Wilson, Ross. 2016. Does governance cause growth? Evidence from China. World Development 79: 138–51. [Google Scholar] [CrossRef]
- Xiao, Hongye. 2004. China’s Regional Competitiveness Development Report: 1985–2004; Beijing: China Statistics Press, pp. 21–87.
- Xiao, Hongye. 2006. China’s Regional Competitiveness Development Report: 2005; Beijing: China Statistics Press, pp. 30–91.
- Xu, Xianxiang, Xianbin Wang, and Yuan Shu. 2007. Local officials and economic growth. Economic Research Journal 9: 18–31. [Google Scholar]
- Zhang, Hong, and Youqiang Wang. 2013. Governance and economic growth: Evolution of the relationship between different income stages. Comparative Economic & Social Systems 3: 151–59. [Google Scholar]
- Zhang, Yishan, and Weisheng Yu. 2009. Economic power structure and optimal allocation of productive factors. Economic Research Journal 6: 65–72. [Google Scholar]
- Zheng, Shilin. 2016. The Model of Chinese Economic Governance: Project Institutions. China Soft Science 2: 23–38. [Google Scholar]
- Zheng, Shilin, and Shanshan Ying. 2017. The governance model of project institutions and the regional economy development in China. China Industrial Economics 2: 24–42. [Google Scholar]
- Zhou, Li’an. 2007. Governing China’s local officials: An analysis of promotion tournament model. Economic Research Journal 7: 36–50. [Google Scholar]
- Zhou, Bo. 2016. Does house price fluctuation cause precautionary saving? Statistical Research 33: 18–26. [Google Scholar]
| 1 | During the period of 1996 to 2012, 46 countries remained undeveloped, while only Seychelles became a high-income country in 2004. |
| 2 | The contribution rate of S&T (scientific and technological) progress means that the contribution of scientific and technological progress to economic growth after deducting capital and labor. |
| 3 |
Figure 1.
Mechanisms of good governance affecting local economic growth in China.

Figure 2.
Scatter description of relationship between governance quality and per capita gross domestic product (GDP) (Note: As shown in Table 2, lnGDP is the natural log of real GDP per capita, Gov is the comprehensive index of provincial governance quality. All data are obtained from authors’ calculations.)

Figure 3.
China’s GDP growth rate and the contribution rate of scientific and technological (S&T) progress (Note: All data are obtained from China Statistical Yearbook (2008–2017) and official website of Chinese government3).
Figure 3.
China’s GDP growth rate and the contribution rate of scientific and technological (S&T) progress (Note: All data are obtained from China Statistical Yearbook (2008–2017) and official website of Chinese government3).

Figure 4.
Research and development (R&D) input intensity and GDP growth rate in some provincial regions of China in 2016 (Note: All data are obtained from China Statistical Yearbook (2017)).
Figure 4.
Research and development (R&D) input intensity and GDP growth rate in some provincial regions of China in 2016 (Note: All data are obtained from China Statistical Yearbook (2017)).

Table 1.
Index system of provincial governance in China (Tang et al. 2018).
Table 1.
Index system of provincial governance in China (Tang et al. 2018).
| Dimensions | Indicators | Parameters (Unit) |
|---|---|---|
| Government capacity | Financial resource | Local finance revenue (yuan)/inhabitant |
| Infrastructure | Standard highway mileage (meter)/area (km2) | |
| Innovation subsidy | Government expenditures in science and technology (yuan)/inhabitant | |
| Education development | Government expenditures in education (yuan)/inhabitant | |
| Medical care | Number of medical technicians/inhabitant | |
| Marketization | Non-state-owned output | Non-state-owned industrial output (thousand yuan)/area (km2) |
| Non-state-owned employment | Number of employees in private and individual enterprises/area (km2) | |
| Non-state-owned investment | Non-state-owned investment in fixed assets (ten thousands yuan)/area (km2) | |
| Technology market | Technical market transaction value (yuan)/inhabitant | |
| Factor market | Foreign direct investment (hundred yuan)/area (km2) | |
| Rule of law | Lawyer | Number of lawyers/inhabitant |
| Litigation business | Number of litigation businesses/inhabitant | |
| Law office | Number of law offices/inhabitant | |
| Intellectual property protection | Number of patent applications/inhabitant |
Note: All data for those parameters are obtained from China Statistical Yearbook (2002–2016) and China Statistical Yearbook on Science and Technology (2002–2016).
Table 2.
Variable introduction and data sources. GDP—gross domestic product.
| Variables | Codes | Parameters (Unit) | Data Sources |
|---|---|---|---|
| Governance quality | Gov | Comprehensive index of governance quality | see Appendix B |
| Economic growth | lnGDP | ln(real GDP per capita) | China Statistical Yearbook (2002–2016) |
| Openness | Open | Proportion of both import and export in GDP (%) | |
| Education development | Edu | Number of college students/inhabitant (per ten thousands) | |
| Urbanization | Urban | Proportion of urban population (%) | |
| Investment proportion | Inv | Proportion of total fixed-asset investment in GDP (%) | |
| Human capital | Hum | Proportion of college degree or above (%) |
Table 3.
Descriptive statistics.
| Variables | Mean | Median | Kurtosis | Skewness | Min. | Max. | Obs. |
|---|---|---|---|---|---|---|---|
| lnGDP | 9.73 | 9.73 | −0.59 | 0.09 | 8.01 | 11.27 | 360 |
| Gov | 74.08 | 72.32 | −0.04 | 0.55 | 39.45 | 115.67 | 360 |
| Open | 35.39 | 14.22 | 1.93 | 1.73 | 3.57 | 172.15 | 360 |
| Edu | 148.17 | 147.41 | 0.29 | 0.67 | 27.92 | 356.48 | 360 |
| Urban | 48.23 | 46.34 | 0.38 | 0.69 | 14.9 | 89.60 | 360 |
| Inv | 56.03 | 52.06 | −0.36 | 0.58 | 25.29 | 124.22 | 360 |
| Hum | 8.81 | 7.24 | 6.79 | 2.33 | 1.83 | 41.21 | 360 |
Table 4.
Regression results of governance quality and economic growth. FE—fixed effect; RE—random effect.
Table 4.
Regression results of governance quality and economic growth. FE—fixed effect; RE—random effect.
| Variables | Model 1 (FE) | Model 2 (RE) | Model 3 | Model 4 |
|---|---|---|---|---|
| Constant | 6.322445 *** | 6.306703 *** | 6.468178 *** | 6.327791 *** |
| Gov | 0.044530 *** | 0.044842 *** | 0.037344 *** | 0.046203 *** |
| M*Gov | −0.005829 | |||
| W*Gov | 0.017098 * | |||
| P*Gov | 0.000184 | |||
| Gov2 | −0.000062 *** | −0.000063 *** | −0.000019 | −0.000097 *** |
| M*Gov2 | 0.000047 | |||
| W*Gov2 | −0.000128 ** | |||
| P*Gov2 | 4.99 × 10⁻⁶ | |||
| Open | −0.001202 *** | −0.001139 *** | −0.001068 *** | −0.000885 *** |
| Edu | 0.002039 *** | 0.001873 *** | 0.002176 *** | 0.002115 *** |
| Urban | 0.000045 | 0.00050 | 0.000128 | 0.000430 |
| Inv | 0.001738 *** | 0.0019733 *** | 0.001987 *** | 0.001765 *** |
| Hum | 0.012740 *** | 0.012096 *** | 0.011153 *** | 0.013394 *** |
| Hausman test | 16.04 (P = 0.0248) | |||
| R2 | 0.8722 | 0.8759 | 0.6889 | 0.8761 |
| Obs. | 360 | 360 | 360 | 360 |
Note: *, **, and *** indicate statistical significance at 10%, 5%, and 1%.
Table 5.
Regression results of robustness checks.
| Variables | Model 5 | Model 6 | Model 7 | Model 8 |
|---|---|---|---|---|
| Constant | 6.391385 *** | 6.345589 *** | 13.1500 | |
| Gov | 0.043192 *** | 0.044606 *** | 7.1990 *** | 2.478116 *** |
| Gov2 | −0.000084 ** | −0.000067 ** | −0.0564 ** | |
| Open | −0.000970 ** | −0.000173 | 0.0582 | −0.056623 *** |
| Edu | 0.002214 *** | 0.002233 *** | 0.1190 *** | 0.050097 * |
| Urban | −0.000130 | −0.000961 | 0.0861 | 0.032999 |
| Inv | 0.002189 *** | 0.001409 *** | −0.0819 | 0.128509 *** |
| Hum | 0.024231 *** | 0.016502 *** | 0.0525 ** | 0.243599 *** |
| R2 | 0.8488 | 0.8824 | 0.7200 | 0.9836 |
| Obs. | 336 | 270 | 120 | 360 |
Note: *, **, and *** indicate statistical significance at 10%, 5%, and 1%.
© 2018 by the authors. Licensee MDPI, Basel, Switzerland. This article is an open access article distributed under the terms and conditions of the Creative Commons Attribution (CC BY) license (http://creativecommons.org/licenses/by/4.0/).
Share and Cite
MDPI and ACS Style
Liu, J.; Tang, J.; Zhou, B.; Liang, Z. The Effect of Governance Quality on Economic Growth: Based on China’s Provincial Panel Data. Economies 2018, 6, 56. https://doi.org/10.3390/economies6040056
AMA Style
Liu J, Tang J, Zhou B, Liang Z. The Effect of Governance Quality on Economic Growth: Based on China’s Provincial Panel Data. Economies. 2018; 6(4):56. https://doi.org/10.3390/economies6040056
Chicago/Turabian StyleLiu, Jiandang, Jie Tang, Bo Zhou, and Zhijun Liang. 2018. "The Effect of Governance Quality on Economic Growth: Based on China’s Provincial Panel Data" Economies 6, no. 4: 56. https://doi.org/10.3390/economies6040056
Note that from the first issue of 2016, this journal uses article numbers instead of page numbers. See further details here.