
Lesson Study as a Means to Change Secondary Preservice Physics Teachers’ Practice in the Use of Multiple Representations in Teaching


Abstract
:1. Introduction
2. Background
2.1. Multiple Representations in Physics Teaching
2.2. Lesson Study
3. Method
3.1. Characterization of the Participants in the Research
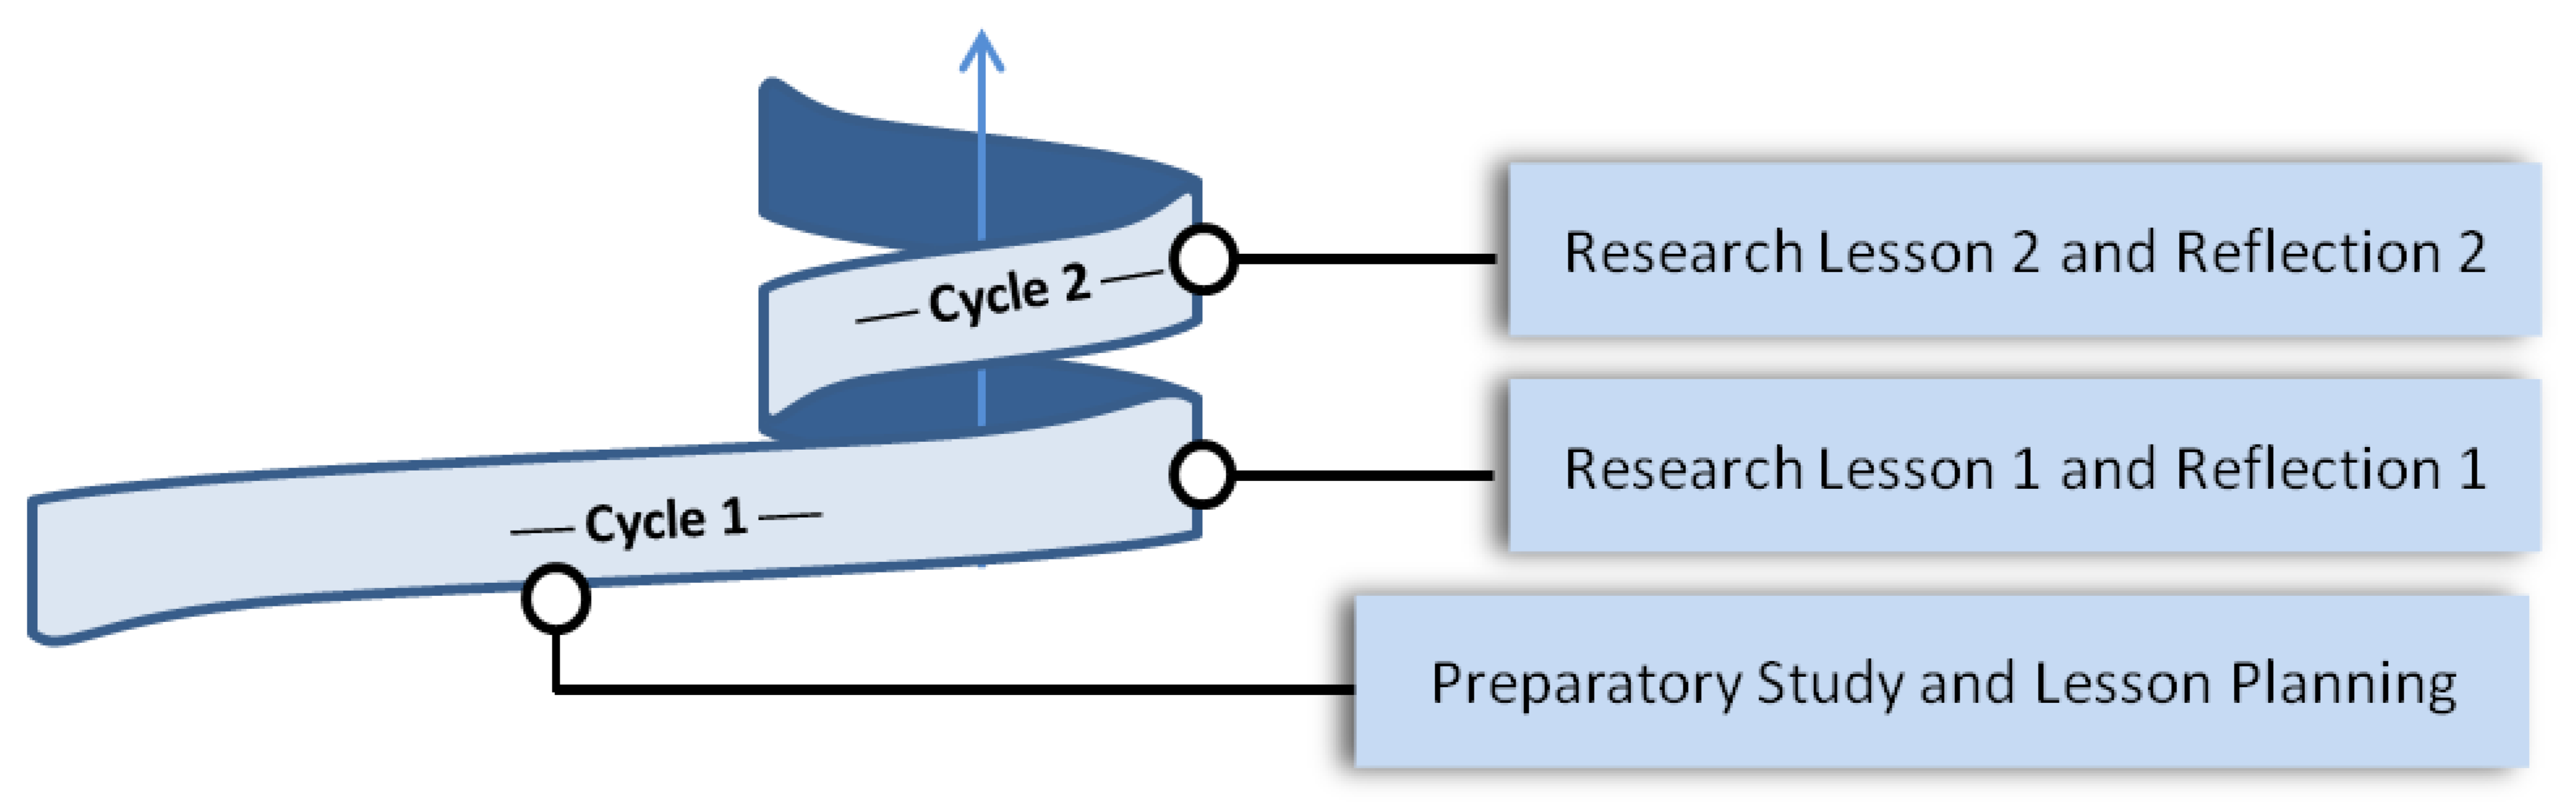
3.2. Lesson Study Implementation
3.3. Data Collection and Analysis
4. Results
4.1. Changes in the MR That PSTs Used to Represent Car Crash Tests as the “Real” World Event (from Research Lesson 1 to Research Lesson 2)
4.2. Changes in the MR That PSTs Used to Support the Teaching of the Scientific Concepts (from Research Lesson 1 to Research Lesson 2 and from Research Lesson 2 to Research Lesson 3)
5. Discussion
6. Conclusions
Author Contributions
Funding
Institutional Review Board Statement
Informed Consent Statement
Data Availability Statement
Conflicts of Interest
References
- Ainsworth, S. The multiple representations principle in multimedia learning. In The Cambridge Handbook of Multimedia Learning, 2nd ed.; Mayer, R.E., Ed.; Cambridge University Press: Cambridge, UK, 2014; pp. 464–486. [Google Scholar]
- Tsui, C.; Treagust, D.F. Introduction to multiple representations: Their importance in biology and biological education. In Multiple Representations in Biological Education; Tsui, C., Treagust, D.F., Eds.; Springer: Dordrecht, The Netherlands, 2013; pp. 3–18. [Google Scholar]
- Roth, W.-M.; McGinn, M. Inscriptions: Toward a theory of representing as social practice. Rev. Educ. Res. 1998, 68, 35–59. [Google Scholar] [CrossRef]
- Latour, B. La Clef de Berlin et Autres Leçons d’un Amateur de Sciences [The Key to Berlin and Other Lessons of a Science Lover]; Editions la Découverte: Paris, France, 1993. [Google Scholar]
- Ainsworth, S. The educational value of multiple-representations when learning complex scientific concepts. In Visualization: Theory and Practice in Science Education; Gilbert, J.K., Reiner, M., Nakhleh, M., Eds.; Springer: New York, NY, USA, 2008; pp. 191–208. [Google Scholar]
- Bowen, G.; Roth, M.-W. Data and graph interpretation practices among preservice science teachers. J. Res. Sci. Teach. 2005, 42, 1063–1088. [Google Scholar] [CrossRef]
- Campbell, T.; Wang, S.K.; Hsu, H.; Duffy, A.; Wolf, P. Learning with web tools, simulations, and other technologies in science classrooms. J. Sci. Educ. Technol. 2010, 19, 505–511. [Google Scholar] [CrossRef]
- Lunsford, E.; Melear, C.; Roth, W.-M.; Perkins, M.; Hickok, L. Proliferation of inscriptions and transformations among preservice science teachers engaged in authentic science. J. Sci. Teach. Educ. 2007, 44, 538–564. [Google Scholar] [CrossRef]
- Mayer, R.E. Multimedia Learning, 2nd ed.; Cambridge University Press: Cambridge, MA, USA, 2009. [Google Scholar]
- Gilbert, J.K. Visualization: A metacognitive skill in science and science education. In Visualization in Science Education. Models and Modeling in Science Education; Gilbert, J.K., Ed.; Springer: Dordrecht, The Netherlands, 2005; Volume 1, pp. 9–27. [Google Scholar] [CrossRef]
- Park, B.; Flowerday, T.; Brünken, R. Cognitive and affective effects of seductive details in multimedia learning. Comput. Hum. Behav. 2015, 44, 267–278. [Google Scholar] [CrossRef]
- NSTA/ASTE Standards for Science Teacher Preparation. 2020. Available online: https://static.nsta.org/pdfs/2020NSTAStandards.pdf (accessed on 19 October 2021).
- Nuffield Foundation. Beyond 2000: Science Education for Future. Available online: https://www.nuffieldfoundation.org/project/beyond-2000-science-education-for-the-future (accessed on 21 November 2021).
- Hill, M.; Sharma, M.D. Students’ representational fluency at university: A cross-sectional measure of how multiple representations are used by physics students using the representational fluency survey. EURASIA J. Math. Sci. Technol. Educ. 2015, 11, 1633–1655. [Google Scholar] [CrossRef] [Green Version]
- Roth, W.-M.; McGinn, M.K.; Bowen, G.M. How prepared are preservice teachers to teach scientific inquiry? Levels of performance in science representation practices. J. Sci. Teach. Educ. 1998, 9, 25–48. [Google Scholar] [CrossRef]
- Lunsford, E.; Melear, C.T.; Hickok, L.G. Knowing and teaching science: Just do it. In Exemplary Science: Best Practices in Professional Development; Yager, R.E., Ed.; NSTA Press: Arlington, VA, USA, 2005; pp. 133–146. [Google Scholar]
- Melear, C.T.; Goodlaxson, J.D.; Warne, T.R.; Hickok, L.G. Teaching preservice science teachers how to do science: Responses to the research experience. J. Sci. Teach. Educ. 2000, 11, 77–90. [Google Scholar] [CrossRef]
- Akerson, V.; Pongsanon, K.; Rogers, M.; Carter, I.; Galindo, E. Exploring the use of lesson study to develop elementary preservice teachers’ pedagogical content knowledge for teaching nature of science. Int. J. Sci. Math. Educ. 2017, 15, 293–312. [Google Scholar] [CrossRef]
- Chassels, C.; Melville, W. Collaborative, reflective and iterative Japanese lesson study in an initial teacher education program: Benefits and challenges. Can. J. Educ. Rev. Can. De L’éducation 2009, 32, 734–763. Available online: http://www.jstor.org/stable/canajeducrevucan.32.4.734 (accessed on 3 October 2021).
- Marble, S. Inquiring into teaching: Lesson study in elementary science methods. J. Sci. Teach. Educ. 2007, 18, 935–953. [Google Scholar] [CrossRef]
- Jain, P.; Brown, A. Using an adapted lesson study with early childhood undergraduate students. Teach. Educ. 2020, 1–21. [Google Scholar] [CrossRef]
- Sims, L.; Walsh, D. Lesson study with preservice teachers: Lessons from lessons. Teach. Teach. Educ. 2009, 25, 724–733. [Google Scholar] [CrossRef]
- Larssen, D.; Cajkler, W.; Mosvold, R.; Bjuland, R.; Helgevold, N.; Fauskanger, J.; Wood, P.; Baldry, F.; Jakobsen, A.; Bugge, H.; et al. A literature review of lesson study in initial teacher education: Perspectives about learning and observation. Int. J. Lesson Learn. Stud. 2018, 7, 8–22. [Google Scholar] [CrossRef]
- Conceição, T.; Baptista, M.; Ponte, J.P. Lesson study in initial teacher education to stimulate the pedagogical content knowledge on the topic of speed of sound. Acta Sci. 2020, 22, 29–47. [Google Scholar] [CrossRef] [Green Version]
- Van Joolingen, W.R.; de Jong, T. SimQuest: Authoring educational simulations. In Authoring Tools for Advanced Technology Educational Software: Toward Cost-Effective Production of Adaptive, Interactive, and Intelligent Educational Software; Murray, T., Blessing, S., Ainsworth, S., Eds.; Kluwer: Dordrecht, The Netherlands, 2003; pp. 1–31. [Google Scholar]
- Lemke, J.L. Multiplying meaning: Visual and verbal semiotics in scientific text. In Reading Science; Martin, J.R., Veels, R., Eds.; Routledge: London, UK, 1998; pp. 87–113. [Google Scholar]
- Star, S.L. The politics of formal representations: Wizards, gurus, and organizational complexity. In Ecologies of Knowledge: Work and Politics in Science and Technology; Star, S.L., Ed.; SUNY Press: Ithaca, NY, USA, 1995; pp. 88–118. [Google Scholar]
- Osborne, J. Sacred cows in physics: Towards a redefinition of physics education. Phys. Educ. 1990, 25, 189–196. [Google Scholar] [CrossRef]
- Ainsworth, S.; Prain, V.; Tytler, R. Drawing to learn in science. Science 2011, 333, 1096–1097. [Google Scholar] [CrossRef] [Green Version]
- Bodemer, D.; Ploetzner, R.; Feuerlein, I.; Spada, H. The active integration of information during learning with dynamic and interactive visualisations. Learn. Instr. 2004, 14, 325–341. [Google Scholar] [CrossRef]
- Roth, W.-M. Where is the context in contextual word problems? Mathematical practices and products in grade 8 students’ answers to story problems. Cogn. Instr. 1996, 14, 487–527. Available online: https://www.jstor.org/stable/3233784 (accessed on 21 November 2021). [CrossRef]
- Arias, A.M.; Davis, E.A. Supporting children to construct evidence-based claims in science: Individual learning trajectories in a practice-based program. Teach. Teach. Educ. 2017, 66, 204–218. [Google Scholar] [CrossRef]
- Bowen, G.M.; Bartley, A.; MacDonald, L.; Sherman, A. Experiences with Activities Developing Pre-service Science Teacher Data Literacy. ASTE Ser. Sci. Educ. 2016, 243–269. [Google Scholar] [CrossRef]
- Enzingmüller, C.; Prechtl, H. Constructing Graphs in Biology Class: Secondary Biology Teachers’ Beliefs, Motivation, and Self-Reported Practices. Int. J. Sci. Math. Educ. 2021, 19, 1–19. [Google Scholar] [CrossRef]
- Clark-Wilson, A.; Hoyles, C. A research-informed web-based professional development toolkit to support technology-enhanced mathematics teaching at scale. Educ. Stud. Math. 2019, 102, 343–359. [Google Scholar] [CrossRef] [Green Version]
- Gardner, S.; Suazo-Flores, E.; Maruca, S.; Abraham, J.; Karippadath, A.; Meir, E. Biology Undergraduate Students’ Graphing Practice in Digital Versus Pen and Paper Graphing Environments. J. Sci. Educ. Technol. 2021, 30, 431–446. [Google Scholar] [CrossRef]
- National Research Council. Inquiry and the National Science Education Standards: A Guide for Teaching and Learning; The National Academies Press: Washington, DC, USA, 2000. [Google Scholar] [CrossRef]
- Fujii, T. Designing and adapting tasks in lesson planning: A critical process of lesson study. ZDM Math. Educ. 2016, 48, 411–423. [Google Scholar] [CrossRef] [Green Version]
- Stigler, J.W.; Hiebert, J. The Teaching Gap; Free Press: New York, NY, USA, 1999. [Google Scholar]
- Takahashi, A.; McDougal, T. Collaborative lesson research: Maximizing the impact of lesson study. ZDM Math. Educ. 2016, 48, 513–526. [Google Scholar] [CrossRef] [Green Version]
- Conceição, T.; Baptista, M.; Ponte, J.P. Lesson study as a trigger for preservice physics and chemistry teachers’ learning about inquiry tasks and classroom communication. Int. J. Lesson Learn. Stud. 2019, 8, 79–96. [Google Scholar] [CrossRef]
- Fernandez, M.L. Investigating how and what prospective teachers learn through microteaching lesson study. Teach. Teach. Educ. 2010, 26, 351–362. [Google Scholar] [CrossRef]
- Fernandez, C.; Cannon, J.; Chokshi, S. A US–Japan lesson study collaboration reveals critical lenses for examining practice. Teach. Teach. Educ. 2003, 19, 171–185. [Google Scholar] [CrossRef]
- Zhou, G.; Xu, J.; Martinovic, D. Developing pre-service teachers’ capacity in teaching science with technology through microteaching lesson study approach. EURASIA J. Math. Sci. Technol. Educ. 2016, 13, 85–103. [Google Scholar] [CrossRef]
- Parks, M.; Oslick, M.E.; Tichenor, M. Cooperating Teachers: Willing partners or reluctant participants? STRATE J. 2020, 29, 1–10. Available online: https://files.eric.ed.gov/fulltext/EJ1243763.pdf (accessed on 21 November 2021).
- Zeichner, K. Rethinking the connections between campus courses and field experiences in college-and university-based teacher education. J. Teach. Educ. 2010, 61, 89–99. [Google Scholar] [CrossRef] [Green Version]
- Lewis, C.; Perry, R.; Friedkin, S. Using Japanese curriculum materials to support lesson study outside Japan: Toward coherent curriculum. Educ. Stud. Jpn. Int. Yearb. 2011, 6, 5–19. [Google Scholar] [CrossRef]
- Takahashi, A.; Watanabe, T.; Yoshida, M.; Wand-Iverson, P. Improving content and pedagogical knowledge through Kyozaikenkyu. In Building our Understanding of Lesson Study; Wang-Iverson, P., Yoshida, M., Eds.; Research for Better Schools: Philadelphia, PA, USA, 2005; pp. 101–110. [Google Scholar]
- Patton, M.Q. Qualitative Evaluation and Research Methods, 2nd ed.; Sage: Newbury Park, CA, USA, 1990. [Google Scholar]
- Strauss, A.; Corbin, J. Basic of Qualitative Research. Grounded Theory Procedures and Techniques; SAGE: Newbury Park, CA, USA, 1990. [Google Scholar]
- Miles, M.B.; Huberman, A.M. Qualitative Data Analysis: An Expanded Sourcebook, 2nd ed.; Sage: Newbury Park, CA, USA, 1994. [Google Scholar]
- Danday, B. Active vs. passive microteaching lesson study: Effects on pre-service teachers’ technological pedagogical content knowledge. Int. J. Learn. Teach. Educ. Res. 2019, 18, 181–200. [Google Scholar] [CrossRef]
- Juhler, M.V. The use of lesson study combined with content representation in the planning of physics lessons during field practice to develop pedagogical content knowledge. J. Sci. Teach. Educ. 2016, 27, 533–553. [Google Scholar] [CrossRef]


| Preservice Teachers | Age | Gender | Education | Work Experience |
|---|---|---|---|---|
| PST1 | 42 | Male | Five-year first degree (major in chemistry with minor in physics) | Chemistry and physics teaching in a tutoring center |
| PST2 | 42 | Male | PhD in physics | Mathematics teaching in a private school |
| PST3 | 36 | Female | Five-year first degree (major in chemistry with minor in physics) | Chemistry teaching in a tutoring center |
| Segmented Text (Data) | Code |
|---|---|
| With this graph, students visualize the relationship between kinetic energy and car’s mass (video record). | Mass and graph |
| The algebraic equation relates the three variables, i.e., kinetic energy, mass, and speed (video record). | Variables and algebraic equation |
| The direction of acceleration of the mannequin′s head is clearly visible in the photo sequence (video record). | Acceleration and photos |
| Students can calculate the force with which the mannequin′s head hits the front seat from the acceleration value (video record). | Force and acceleration |
| The graph and photos complement each other (interview). | Photos and graph |
| Category | Description |
|---|---|
| 1. Changes in the MR that PSTs use to represent car crash tests as a “real” world event. | Evidence that PSTs changed the car crash tests representations, namely PSTs started using authentic data and other realistic information, instead non-realistic data and frictionless crash tests. |
| 2. Changes in the MR that PSTs use to support the teaching of the scientific concepts. | Evidence that PSTs changed the kinetic energy representations, namely PSTs started using a sequence of photos of the dummy head in different instants of the collision, a table elaborated by the students, and a Cartesian graph with experimental data, instead of algebraic equations and other complex representations, such as Cartesian graphs with fictional data. |
Publisher’s Note: MDPI stays neutral with regard to jurisdictional claims in published maps and institutional affiliations. |
© 2021 by the authors. Licensee MDPI, Basel, Switzerland. This article is an open access article distributed under the terms and conditions of the Creative Commons Attribution (CC BY) license (https://creativecommons.org/licenses/by/4.0/).
Share and Cite
Conceição, T.; Baptista, M.; Ponte, J.P. Lesson Study as a Means to Change Secondary Preservice Physics Teachers’ Practice in the Use of Multiple Representations in Teaching. Educ. Sci. 2021, 11, 791. https://doi.org/10.3390/educsci11120791
Conceição T, Baptista M, Ponte JP. Lesson Study as a Means to Change Secondary Preservice Physics Teachers’ Practice in the Use of Multiple Representations in Teaching. Education Sciences. 2021; 11(12):791. https://doi.org/10.3390/educsci11120791
Chicago/Turabian StyleConceição, Teresa, Mónica Baptista, and João Pedro Ponte. 2021. "Lesson Study as a Means to Change Secondary Preservice Physics Teachers’ Practice in the Use of Multiple Representations in Teaching" Education Sciences 11, no. 12: 791. https://doi.org/10.3390/educsci11120791